Delaware Social Profile
COMPARE
Delaware
Select to Compare
Social Profile
Delaware Social Profile
3,204
SOCIAL INDEX
29.6/ 100
SOCIAL RATING
228th/ 347
SOCIAL RANK
Delaware Geographic Distribution
Delaware Income
In terms of income, Delaware residing in the United States exhibit better wage/income gap percentage (26.3%), median male earnings ($52,412), and median earnings ($44,783), but there is room for improvement in household income with householder under the age of 25 ($47,159), median female earnings ($37,964), and per capita income ($40,778).
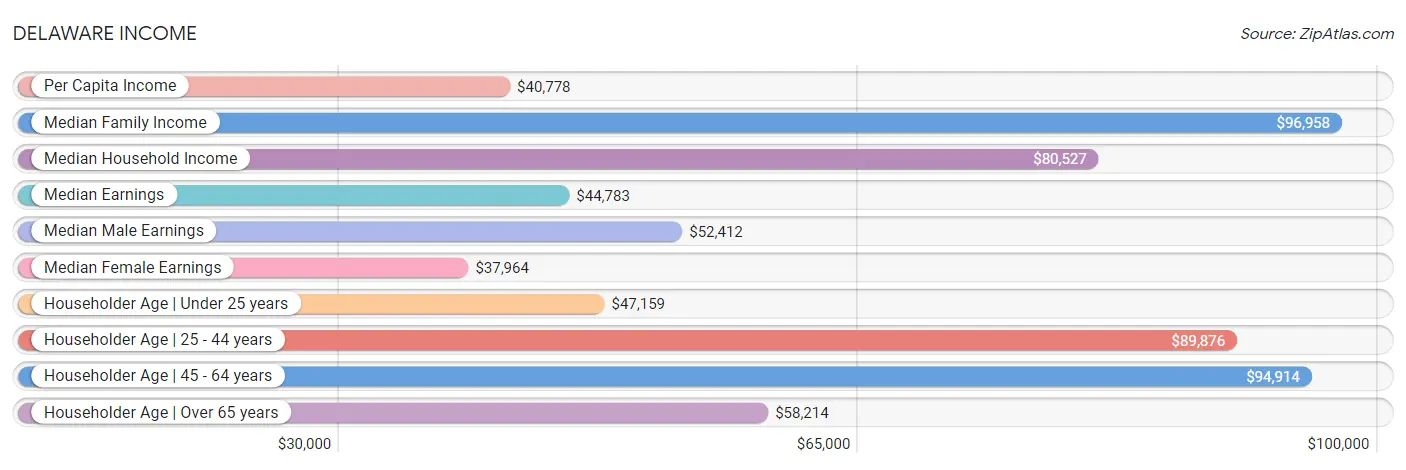
| Income Metric | Rating | Rank | Value |
| Per Capita Income | 3.8 /100 | #233 | Tragic $40,778 |
| Median Family Income | 5.1 /100 | #219 | Tragic $96,958 |
| Median Household Income | 5.0 /100 | #229 | Tragic $80,527 |
| Median Earnings | 9.0 /100 | #232 | Tragic $44,783 |
| Median Male Earnings | 11.5 /100 | #210 | Poor $52,412 |
| Median Female Earnings | 2.6 /100 | #246 | Tragic $37,964 |
| Householder Age | Under 25 years | 0.0 /100 | #313 | Tragic $47,159 |
| Householder Age | 25 - 44 years | 6.9 /100 | #219 | Tragic $89,876 |
| Householder Age | 45 - 64 years | 6.2 /100 | #218 | Tragic $94,914 |
| Householder Age | Over 65 years | 5.3 /100 | #222 | Tragic $58,214 |
| Wage/Income Gap | 20.9 /100 | #200 | Fair 26.3% |
Delaware Poverty
In terms of poverty, Delaware residing in the United States exhibit better poverty level among seniors over the age of 75 (11.4%), poverty level among seniors over the age of 65 (10.2%), and poverty level among married-couple families (5.1%), but there is room for improvement in poverty level among single fathers (18.9%), poverty level among single males (15.0%), and poverty level among single mothers (31.8%).
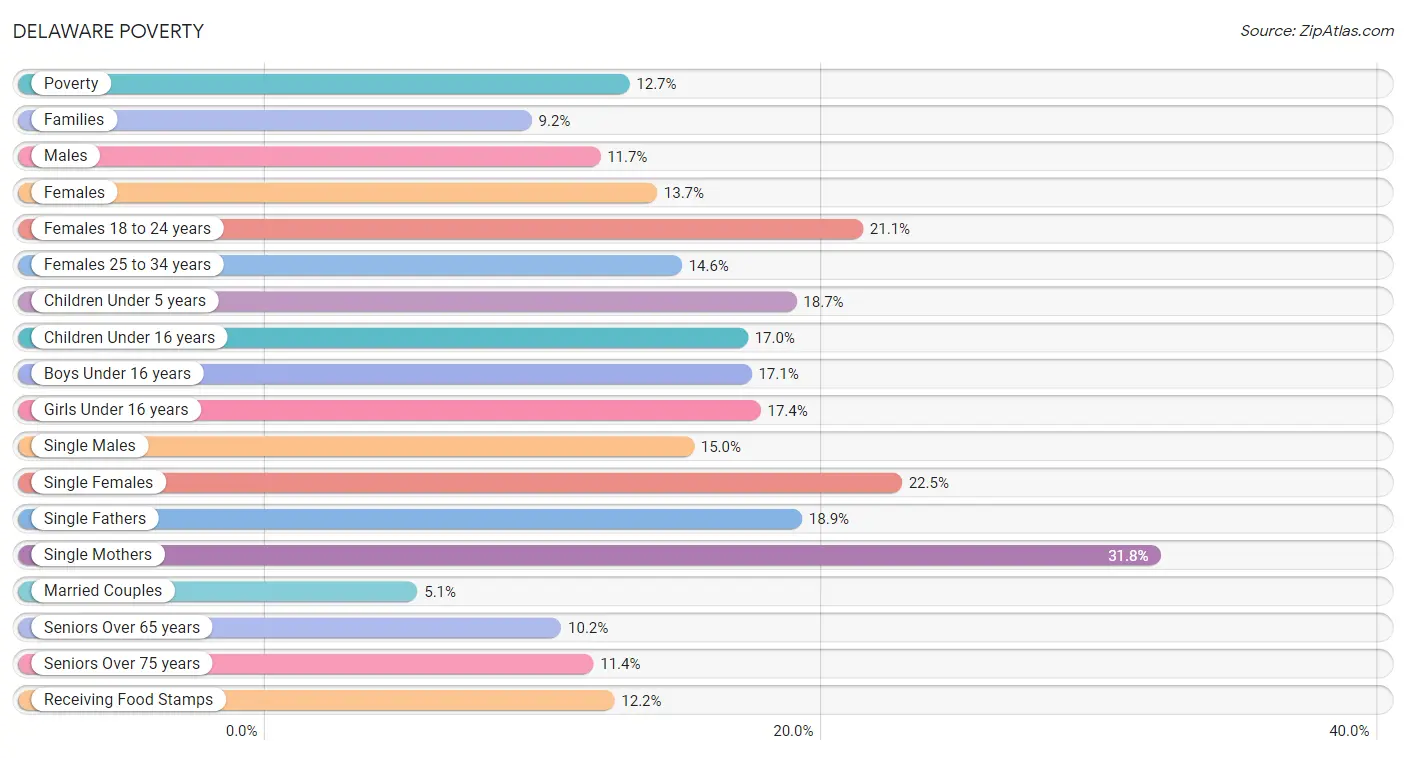
| Poverty Metric | Rating | Rank | Value |
| Poverty | 21.4 /100 | #193 | Fair 12.7% |
| Families | 35.4 /100 | #187 | Fair 9.2% |
| Males | 15.4 /100 | #197 | Poor 11.7% |
| Females | 31.1 /100 | #194 | Fair 13.7% |
| Females 18 to 24 years | 1.6 /100 | #253 | Tragic 21.1% |
| Females 25 to 34 years | 2.3 /100 | #231 | Tragic 14.6% |
| Children Under 5 years | 3.4 /100 | #218 | Tragic 18.7% |
| Children Under 16 years | 17.1 /100 | #198 | Poor 17.0% |
| Boys Under 16 years | 18.8 /100 | #199 | Poor 17.1% |
| Girls Under 16 years | 11.5 /100 | #206 | Poor 17.4% |
| Single Males | 0.0 /100 | #299 | Tragic 15.0% |
| Single Females | 1.0 /100 | #252 | Tragic 22.5% |
| Single Fathers | 0.0 /100 | #314 | Tragic 18.9% |
| Single Mothers | 0.0 /100 | #276 | Tragic 31.8% |
| Married Couples | 73.7 /100 | #154 | Good 5.1% |
| Seniors Over 65 years | 94.5 /100 | #102 | Exceptional 10.2% |
| Seniors Over 75 years | 96.0 /100 | #74 | Exceptional 11.4% |
| Receiving Food Stamps | 26.1 /100 | #197 | Fair 12.2% |
Delaware Unemployment
In terms of unemployment, Delaware residing in the United States exhibit better unemployment rate among population between the ages 55 and 59 (4.7%), unemployment (5.4%), and unemployment rate among seniors over the age of 75 (9.0%), but there is room for improvement in unemployment rate among women with children under the age of 6 (9.8%), unemployment rate among women with children between the ages 6 and 17 (10.5%), and unemployment rate among population between the ages 65 and 74 (6.0%).
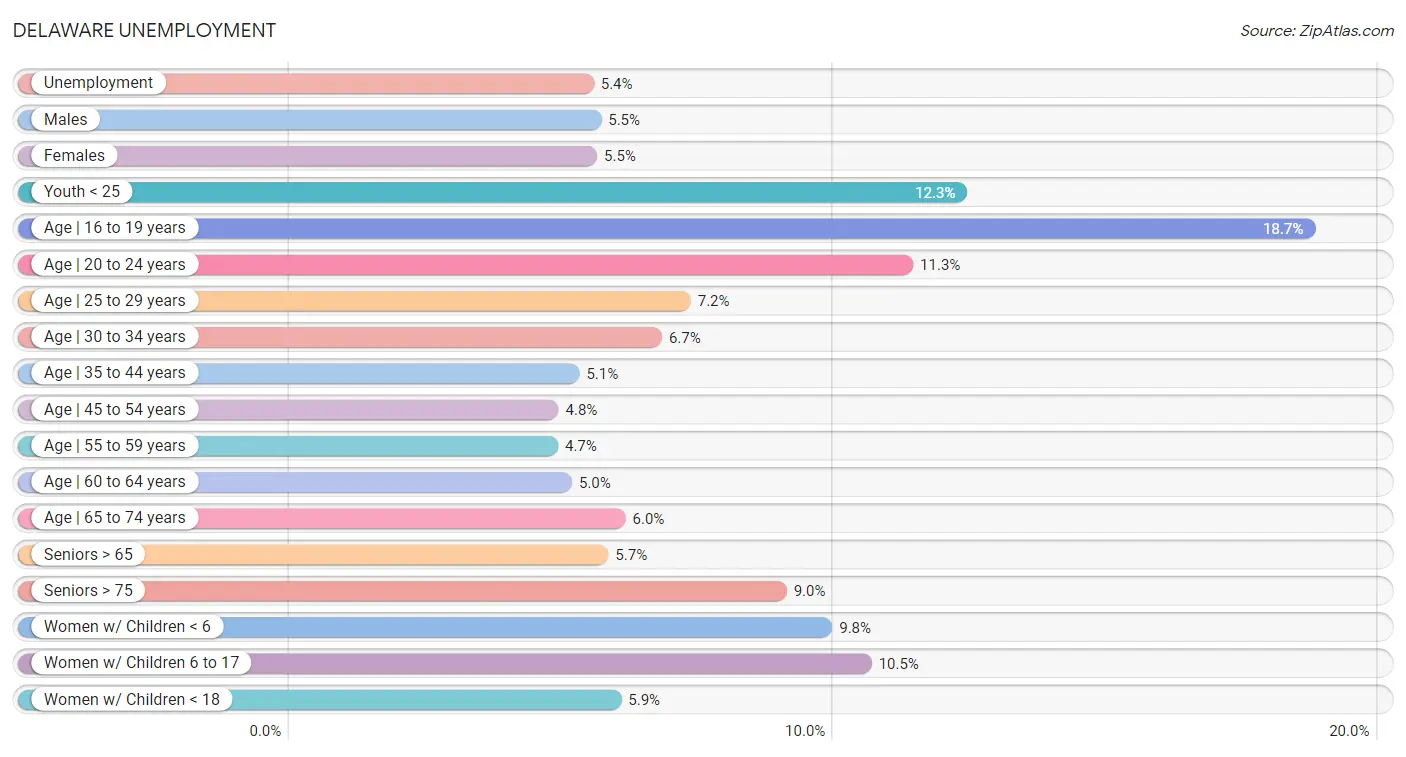
| Unemployment Metric | Rating | Rank | Value |
| Unemployment | 14.7 /100 | #215 | Poor 5.4% |
| Males | 4.2 /100 | #217 | Tragic 5.5% |
| Females | 7.2 /100 | #223 | Tragic 5.5% |
| Youth < 25 | 0.4 /100 | #250 | Tragic 12.3% |
| Age | 16 to 19 years | 0.5 /100 | #248 | Tragic 18.7% |
| Age | 20 to 24 years | 0.0 /100 | #270 | Tragic 11.3% |
| Age | 25 to 29 years | 0.5 /100 | #250 | Tragic 7.2% |
| Age | 30 to 34 years | 0.0 /100 | #302 | Tragic 6.7% |
| Age | 35 to 44 years | 0.5 /100 | #242 | Tragic 5.1% |
| Age | 45 to 54 years | 1.3 /100 | #241 | Tragic 4.8% |
| Age | 55 to 59 years | 83.6 /100 | #137 | Excellent 4.7% |
| Age | 60 to 64 years | 3.6 /100 | #235 | Tragic 5.0% |
| Age | 65 to 74 years | 0.0 /100 | #323 | Tragic 6.0% |
| Seniors > 65 | 0.0 /100 | #314 | Tragic 5.7% |
| Seniors > 75 | 14.6 /100 | #211 | Poor 9.0% |
| Women w/ Children < 6 | 0.0 /100 | #326 | Tragic 9.8% |
| Women w/ Children 6 to 17 | 0.0 /100 | #318 | Tragic 10.5% |
| Women w/ Children < 18 | 0.8 /100 | #248 | Tragic 5.9% |
Delaware Labor Participation
In terms of labor participation, Delaware residing in the United States exhibit better labor force participation rate among population between the ages 16 and 19 (38.6%), labor force participation rate among population between the ages 20 and 24 (75.5%), and labor force participation rate among population between the ages 25 and 29 (83.7%), but there is room for improvement in labor force participation rate among population between the ages 20 and 64 (77.8%), labor force participation rate among population between the ages 45 and 54 (80.8%), and labor force participation rate among population between the ages 35 and 44 (83.2%).
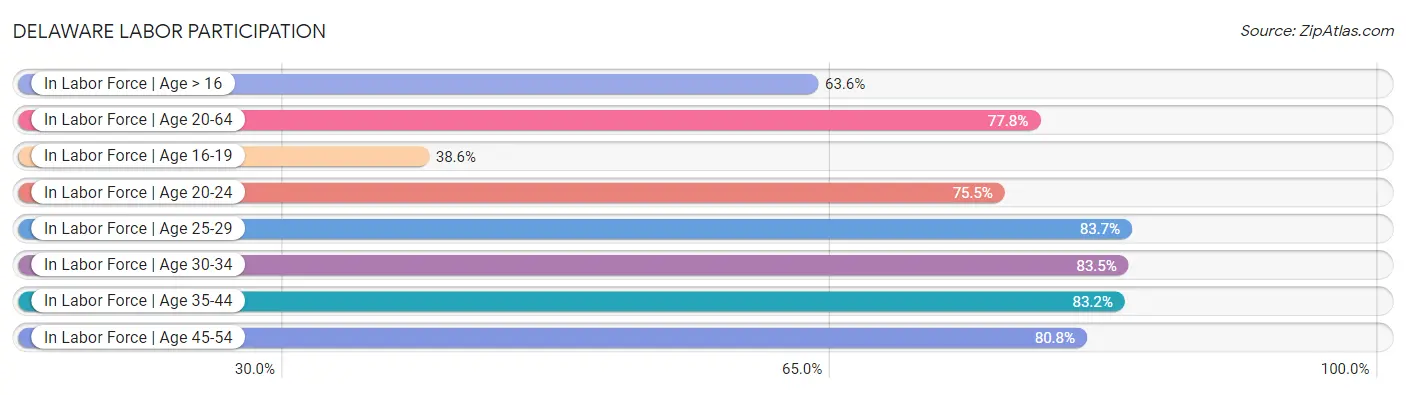
| Labor Participation Metric | Rating | Rank | Value |
| In Labor Force | Age > 16 | 0.0 /100 | #302 | Tragic 63.6% |
| In Labor Force | Age 20-64 | 0.0 /100 | #293 | Tragic 77.8% |
| In Labor Force | Age 16-19 | 98.8 /100 | #106 | Exceptional 38.6% |
| In Labor Force | Age 20-24 | 84.5 /100 | #140 | Excellent 75.5% |
| In Labor Force | Age 25-29 | 0.2 /100 | #257 | Tragic 83.7% |
| In Labor Force | Age 30-34 | 0.0 /100 | #277 | Tragic 83.5% |
| In Labor Force | Age 35-44 | 0.0 /100 | #276 | Tragic 83.2% |
| In Labor Force | Age 45-54 | 0.0 /100 | #285 | Tragic 80.8% |
Delaware Family Structure
In terms of family structure, Delaware residing in the United States exhibit better percentage of family households (64.6%), percentage of married-couple family households (46.8%), and percentage of population currently married (46.9%), but there is room for improvement in percentage of population currently divorced or separated (12.7%), percentage of single father households (2.5%), and percentage of births to unmarried women (34.2%).
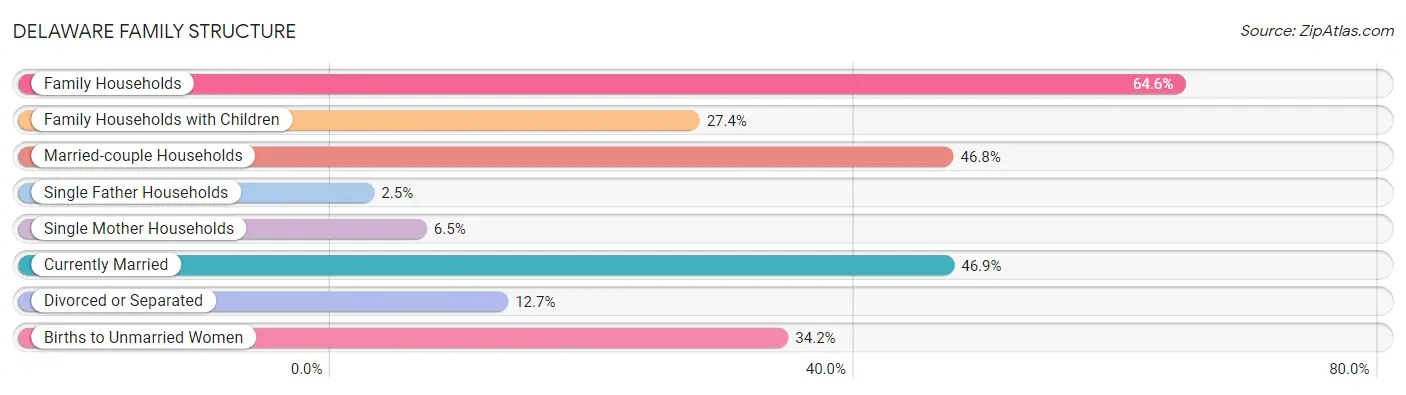
| Family Structure Metric | Rating | Rank | Value |
| Family Households | 76.3 /100 | #148 | Good 64.6% |
| Family Households with Children | 42.0 /100 | #185 | Average 27.4% |
| Married-couple Households | 71.2 /100 | #161 | Good 46.8% |
| Average Family Size | 11.1 /100 | #215 | Poor 3.20 |
| Single Father Households | 2.5 /100 | #247 | Tragic 2.5% |
| Single Mother Households | 23.3 /100 | #189 | Fair 6.5% |
| Currently Married | 64.7 /100 | #163 | Good 46.9% |
| Divorced or Separated | 0.1 /100 | #283 | Tragic 12.7% |
| Births to Unmarried Women | 3.3 /100 | #226 | Tragic 34.2% |
Delaware Vehicle Availability
In terms of vehicle availability, Delaware residing in the United States exhibit better percentage of households with 4 or more vehicles available (7.2%), percentage of households with 3 or more vehicles available (21.5%), and percentage of households with 2 or more vehicles available (58.2%), but there is room for improvement in percentage of households with no vehicle available (9.2%), percentage of households with 1 or more vehicles available (91.0%), and percentage of households with 2 or more vehicles available (58.2%).
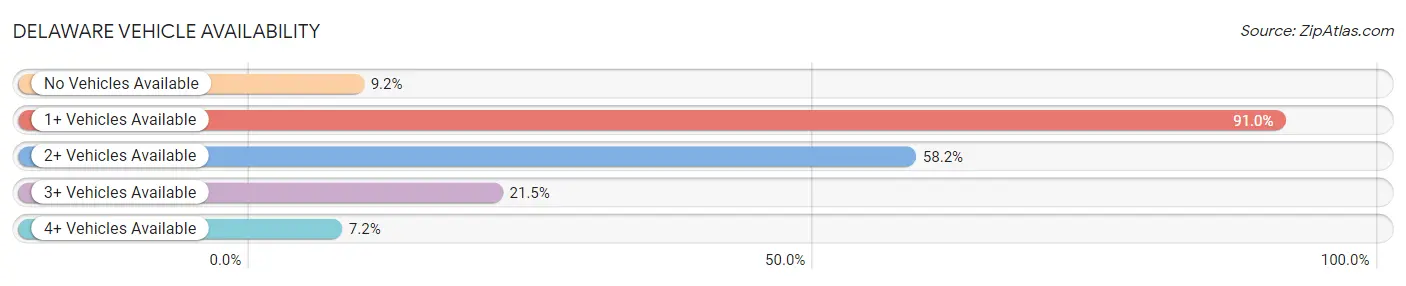
| Vehicle Availability Metric | Rating | Rank | Value |
| No Vehicles Available | 97.2 /100 | #110 | Exceptional 9.2% |
| 1+ Vehicles Available | 97.6 /100 | #109 | Exceptional 91.0% |
| 2+ Vehicles Available | 99.4 /100 | #79 | Exceptional 58.2% |
| 3+ Vehicles Available | 99.6 /100 | #86 | Exceptional 21.5% |
| 4+ Vehicles Available | 99.6 /100 | #87 | Exceptional 7.2% |
Delaware Education Level
In terms of education level, Delaware residing in the United States exhibit better percentage of population with no schooling (1.7%), percentage of population with at least nursery school education (98.3%), and percentage of population with at least kindergarten education (98.3%), but there is room for improvement in percentage of population with at least college, 1 year or more education (55.5%), percentage of population with at least professional degree education (3.6%), and percentage of population with at least associate's degree education (42.3%).
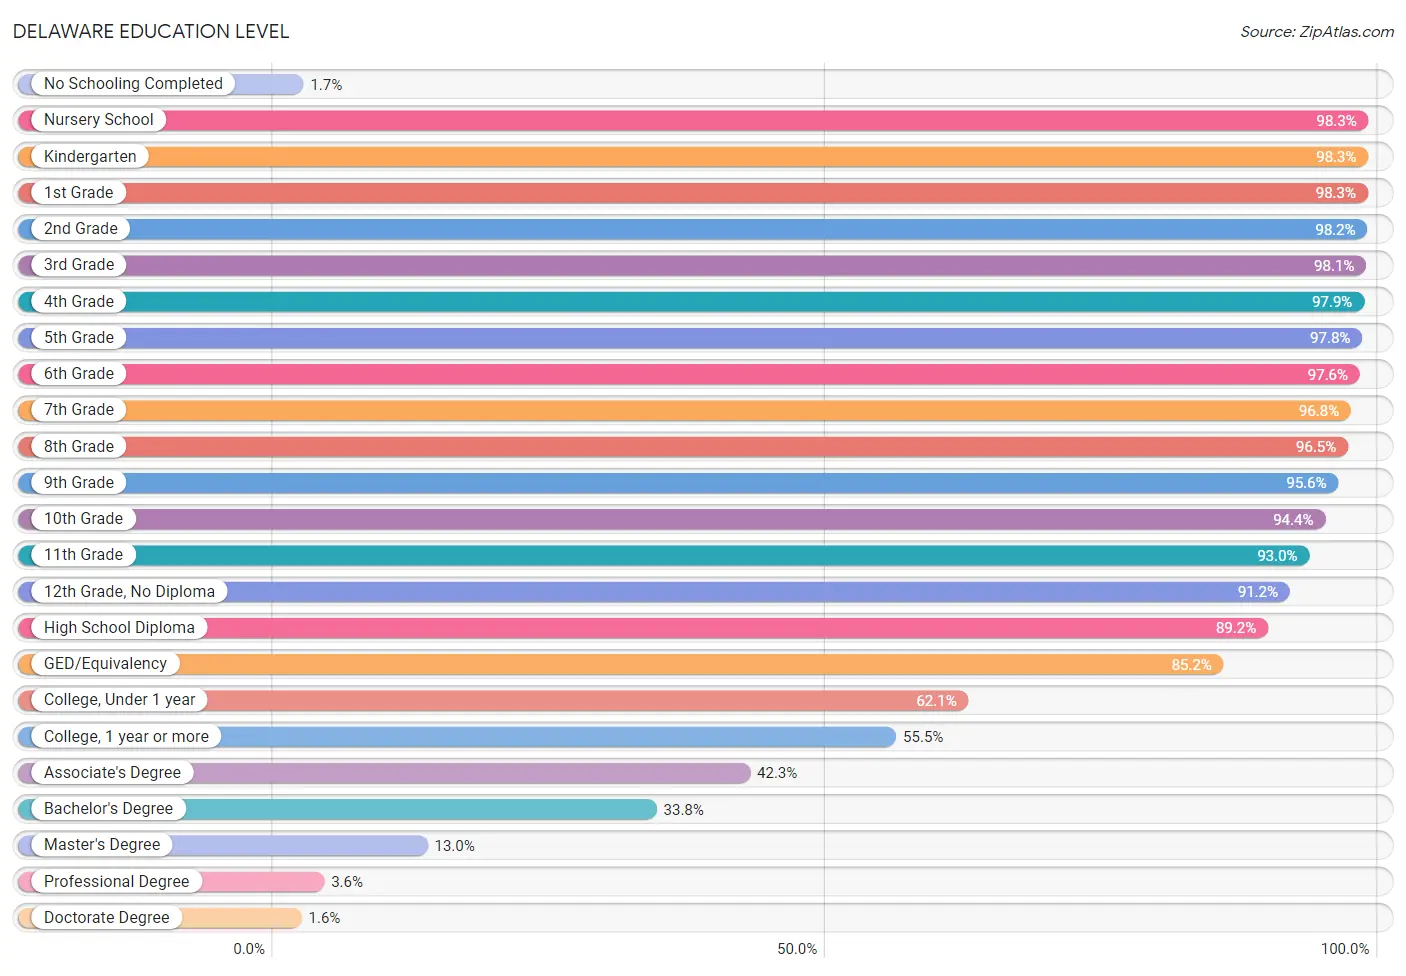
| Education Level Metric | Rating | Rank | Value |
| No Schooling Completed | 99.3 /100 | #78 | Exceptional 1.7% |
| Nursery School | 99.3 /100 | #78 | Exceptional 98.3% |
| Kindergarten | 99.3 /100 | #77 | Exceptional 98.3% |
| 1st Grade | 99.1 /100 | #84 | Exceptional 98.3% |
| 2nd Grade | 99.1 /100 | #82 | Exceptional 98.2% |
| 3rd Grade | 98.8 /100 | #89 | Exceptional 98.1% |
| 4th Grade | 98.8 /100 | #89 | Exceptional 97.9% |
| 5th Grade | 98.6 /100 | #93 | Exceptional 97.8% |
| 6th Grade | 98.9 /100 | #85 | Exceptional 97.6% |
| 7th Grade | 99.2 /100 | #81 | Exceptional 96.8% |
| 8th Grade | 99.2 /100 | #80 | Exceptional 96.5% |
| 9th Grade | 98.4 /100 | #97 | Exceptional 95.6% |
| 10th Grade | 96.3 /100 | #115 | Exceptional 94.4% |
| 11th Grade | 87.3 /100 | #134 | Excellent 93.0% |
| 12th Grade, No Diploma | 52.8 /100 | #170 | Average 91.2% |
| High School Diploma | 55.8 /100 | #168 | Average 89.2% |
| GED/Equivalency | 22.2 /100 | #193 | Fair 85.2% |
| College, Under 1 year | 0.9 /100 | #245 | Tragic 62.1% |
| College, 1 year or more | 0.7 /100 | #250 | Tragic 55.5% |
| Associate's Degree | 0.9 /100 | #246 | Tragic 42.3% |
| Bachelor's Degree | 1.2 /100 | #244 | Tragic 33.8% |
| Master's Degree | 1.7 /100 | #244 | Tragic 13.0% |
| Professional Degree | 0.7 /100 | #267 | Tragic 3.6% |
| Doctorate Degree | 1.9 /100 | #245 | Tragic 1.6% |
Delaware Disability
In terms of disability, Delaware residing in the United States exhibit better percentage of population with a disability over the age of 75 (47.5%), percentage of population with cognitive disability (17.4%), and percentage of population with a disability between the ages 65 and 75 (25.9%), but there is room for improvement in percentage of population with a disability (13.6%), percentage of males with a disability (13.5%), and percentage of population with a disability between the ages 18 and 35 (8.2%).
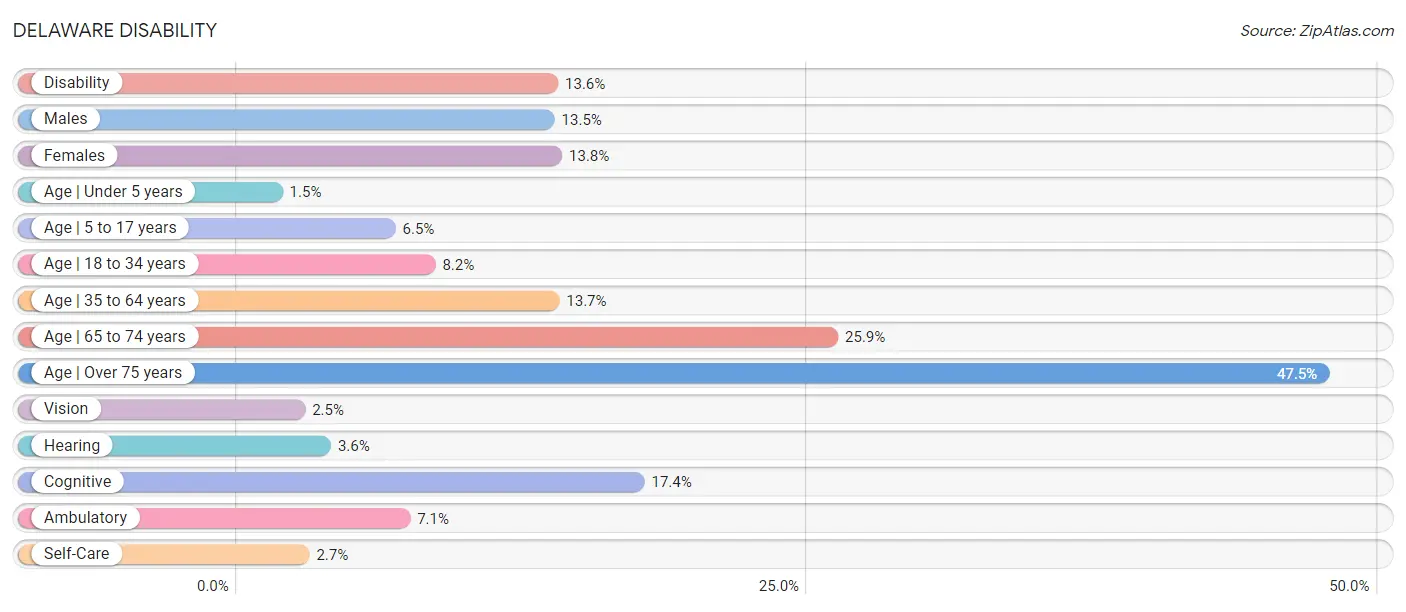
| Disability Metric | Rating | Rank | Value |
| Disability | 0.0 /100 | #311 | Tragic 13.6% |
| Males | 0.0 /100 | #311 | Tragic 13.5% |
| Females | 0.0 /100 | #312 | Tragic 13.8% |
| Age | Under 5 years | 0.0 /100 | #283 | Tragic 1.5% |
| Age | 5 to 17 years | 0.0 /100 | #319 | Tragic 6.5% |
| Age | 18 to 34 years | 0.0 /100 | #328 | Tragic 8.2% |
| Age | 35 to 64 years | 0.0 /100 | #300 | Tragic 13.7% |
| Age | 65 to 74 years | 0.1 /100 | #282 | Tragic 25.9% |
| Age | Over 75 years | 39.1 /100 | #183 | Fair 47.5% |
| Vision | 0.0 /100 | #295 | Tragic 2.5% |
| Hearing | 0.0 /100 | #286 | Tragic 3.6% |
| Cognitive | 25.6 /100 | #193 | Fair 17.4% |
| Ambulatory | 0.0 /100 | #312 | Tragic 7.1% |
| Self-Care | 0.0 /100 | #283 | Tragic 2.7% |
Common Questions
What are the strongest characteristics of Delaware in the United States?
The strongest characteristics of Delaware in the United States are:
#1
Percentage of Households with 4 or More Vehicles Available
7.2%
(99.6/100)
#2
Percentage of Households with 3 or More Vehicles Available
21.5%
(99.6/100)
#3
Percentage of Households with 2 or More Vehicles Available
58.2%
(99.4/100)
#4
Percentage of Population with No Schooling
1.7%
(99.3/100)
#5
Percentage of Population with at least Nursery School Education
98.3%
(99.3/100)
What are the most vital challenges facing Delaware in the United States?
The most vital challenges facing Delaware in the United States are:
#1
Unemployment Rate Among Women with Children Under the Age of 6
9.8%
(0.0/100)
#2
Unemployment Rate Among Women with Children Between the Ages 6 and 17
10.5%
(0.0/100)
#3
Percentage of Population with a Disability
13.6%
(0.0/100)
#4
Poverty Level Among Single Fathers
18.9%
(0.0/100)
#5
Percentage of Males with a Disability
13.5%
(0.0/100)
What is Delaware per capita income in the United States?
Delaware per capita income in the United States is $40,778, which is tragic, ranking it 233rd out of 347 demographic groups.
What is Delaware median family income in the United States?
Delaware median family income in the United States is $96,958, which is tragic, ranking it 219th out of 347 demographic groups.
What is Delaware median household income in the United States?
Delaware median household income in the United States is $80,527, which is tragic, ranking it 229th out of 347 demographic groups.
What is Delaware median earnings in the United States?
Delaware median earnings in the United States is $44,783, which is tragic, ranking it 232nd out of 347 demographic groups.
What is Delaware median male earnings in the United States?
Delaware median male earnings in the United States is $52,412, which is poor, ranking it 210th out of 347 demographic groups.
What is Delaware median female earnings in the United States?
Delaware median female earnings in the United States is $37,964, which is tragic, ranking it 246th out of 347 demographic groups.
What is Delaware wage/income gap percentage in the United States?
Delaware wage/income gap percentage in the United States is 26.3%, which is fair, ranking it 200th out of 347 demographic groups.
What is Delaware poverty level in the United States?
Delaware poverty level in the United States is 12.7%, which is fair, ranking it 193rd out of 347 demographic groups.
What is Delaware poverty level among families in the United States?
Delaware poverty level among families in the United States is 9.2%, which is fair, ranking it 187th out of 347 demographic groups.
What is Delaware poverty level among males in the United States?
Delaware poverty level among males in the United States is 11.7%, which is poor, ranking it 197th out of 347 demographic groups.
What is Delaware poverty level among females in the United States?
Delaware poverty level among females in the United States is 13.7%, which is fair, ranking it 194th out of 347 demographic groups.
What is Delaware poverty level among children under the age of 16 in the United States?
Delaware poverty level among children under the age of 16 in the United States is 17.0%, which is poor, ranking it 198th out of 347 demographic groups.
What is Delaware poverty level among single males in the United States?
Delaware poverty level among single males in the United States is 15.0%, which is tragic, ranking it 299th out of 347 demographic groups.
What is Delaware poverty level among single females in the United States?
Delaware poverty level among single females in the United States is 22.5%, which is tragic, ranking it 252nd out of 347 demographic groups.
What is Delaware poverty level among single fathers in the United States?
Delaware poverty level among single fathers in the United States is 18.9%, which is tragic, ranking it 314th out of 347 demographic groups.
What is Delaware poverty level among single mothers in the United States?
Delaware poverty level among single mothers in the United States is 31.8%, which is tragic, ranking it 276th out of 347 demographic groups.
What is Delaware percentage of population receiving government assistance and/or food stamps in the United States?
Delaware percentage of population receiving government assistance and/or food stamps in the United States is 12.2%, which is fair, ranking it 197th out of 347 demographic groups.
What is Delaware unemployment in the United States?
Delaware unemployment in the United States is 5.4%, which is poor, ranking it 215th out of 347 demographic groups.
What is Delaware unemployment rate among males in the United States?
Delaware unemployment rate among males in the United States is 5.5%, which is tragic, ranking it 217th out of 347 demographic groups.
What is Delaware unemploymnet rate among females in the United States?
Delaware unemploymnet rate among females in the United States is 5.5%, which is tragic, ranking it 223rd out of 347 demographic groups.
What is Delaware percentage of family households in the United States?
Delaware percentage of family households in the United States is 64.6%, which is good, ranking it 148th out of 347 demographic groups.
What is Delaware percentage of family households with children in the United States?
Delaware percentage of family households with children in the United States is 27.4%, which is average, ranking it 185th out of 347 demographic groups.
What is Delaware percentage of married-couple family households in the United States?
Delaware percentage of married-couple family households in the United States is 46.8%, which is good, ranking it 161st out of 347 demographic groups.
What is Delaware average family size in the United States?
Delaware average family size in the United States is 3.20, which is poor, ranking it 215th out of 347 demographic groups.
What is Delaware percentage of single father households in the United States?
Delaware percentage of single father households in the United States is 2.5%, which is tragic, ranking it 247th out of 347 demographic groups.
What is Delaware percentage of single mother households in the United States?
Delaware percentage of single mother households in the United States is 6.5%, which is fair, ranking it 189th out of 347 demographic groups.
What is Delaware percentage of population currently married in the United States?
Delaware percentage of population currently married in the United States is 46.9%, which is good, ranking it 163rd out of 347 demographic groups.
What is Delaware percentage of population currently divorced or separated in the United States?
Delaware percentage of population currently divorced or separated in the United States is 12.7%, which is tragic, ranking it 283rd out of 347 demographic groups.
What is Delaware percentage of births to unmarried women in the United States?
Delaware percentage of births to unmarried women in the United States is 34.2%, which is tragic, ranking it 226th out of 347 demographic groups.
What is Delaware percentage of population with a disability in the United States?
Delaware percentage of population with a disability in the United States is 13.6%, which is tragic, ranking it 311th out of 347 demographic groups.
What is Delaware percentage of males with a disability in the United States?
Delaware percentage of males with a disability in the United States is 13.5%, which is tragic, ranking it 311th out of 347 demographic groups.
What is Delaware percentage of females with a disability in the United States?
Delaware percentage of females with a disability in the United States is 13.8%, which is tragic, ranking it 312th out of 347 demographic groups.
Definitions
Social Index (Si) is a quantitative measure of societal well-being and progress based on various factors and indicators.
Social Index Explained
Social Index refers to a cumulative metric used to assess and measure the overall well-being or social standing of a specific demographic group within a society. It combines multiple factors such as income, poverty rates, family structure, education levels, employment and unemployment rates, rates of illegitimate childbirths, divorce rates, and other relevant social indicators. The purpose of a social index is to provide a comprehensive snapshot of the social conditions and quality of life within a particular group.
Social Index Calculation
The calculation of a social index involves assigning weights or scores to various social factors and then summing up these scores to obtain an overall composite score. These scores are then multiplied by their respective weights and summed up to calculate the overall social index score for the demographic group being assessed. The resulting score provides a quantitative measure of the group's social well-being, allowing for comparisons, tracking changes over time, and informing policy and decision-making processes.
What Can Social Index be Used For
A social index can be used for various purposes, including:
- Assessing Social Well-being: The social index provides a quantitative measure of the overall well-being of a demographic group. It helps assess the social conditions, quality of life, and disparities within a population, allowing policymakers, researchers, and organizations to identify areas that require improvement or targeted interventions.
- Policy Evaluation: The index can be used to evaluate the effectiveness of social policies and interventions. By tracking changes in the social index score over time, policymakers can assess the impact of specific initiatives and make data-driven decisions regarding resource allocation and policy adjustments.
- Targeting Resources: The social index helps identify demographic groups or geographic regions that are facing greater social challenges or experiencing lower levels of well-being. It assists in targeting resources and interventions to address specific social issues, reduce disparities, and promote equitable development.
- Comparing Demographic Groups: The social index allows for comparisons between different demographic groups or across different regions. It provides insights into the relative social standing or well-being of these groups, facilitating a deeper understanding of disparities and informing policy efforts to address them.
- Advocacy and Awareness: The social index can be used as a tool for advocacy and raising awareness about social issues. By quantifying and visualizing social conditions, the index helps highlight areas of concern, draw attention to inequalities, and mobilize support for social change and policy reforms.
- Monitoring Progress: The index serves as a benchmark for monitoring progress and evaluating the impact of social development initiatives. It enables stakeholders to track changes in social indicators, identify trends, and measure the effectiveness of interventions over time.
- Academic and Research Purposes: The social index provides researchers with a comprehensive metric to study social phenomena and investigate the relationship between different social factors. It helps generate insights, support academic research, and contribute to the body of knowledge on social well-being and development.
- Overall, the social index serves as a valuable tool for understanding, measuring, and addressing social challenges. It informs policy decisions, facilitates targeted interventions, and promotes a more holistic approach to social development and well-being.