Cities with the Most Immigrants from England in California
RELATED REPORTS & OPTIONS
England
California
Compare Cities
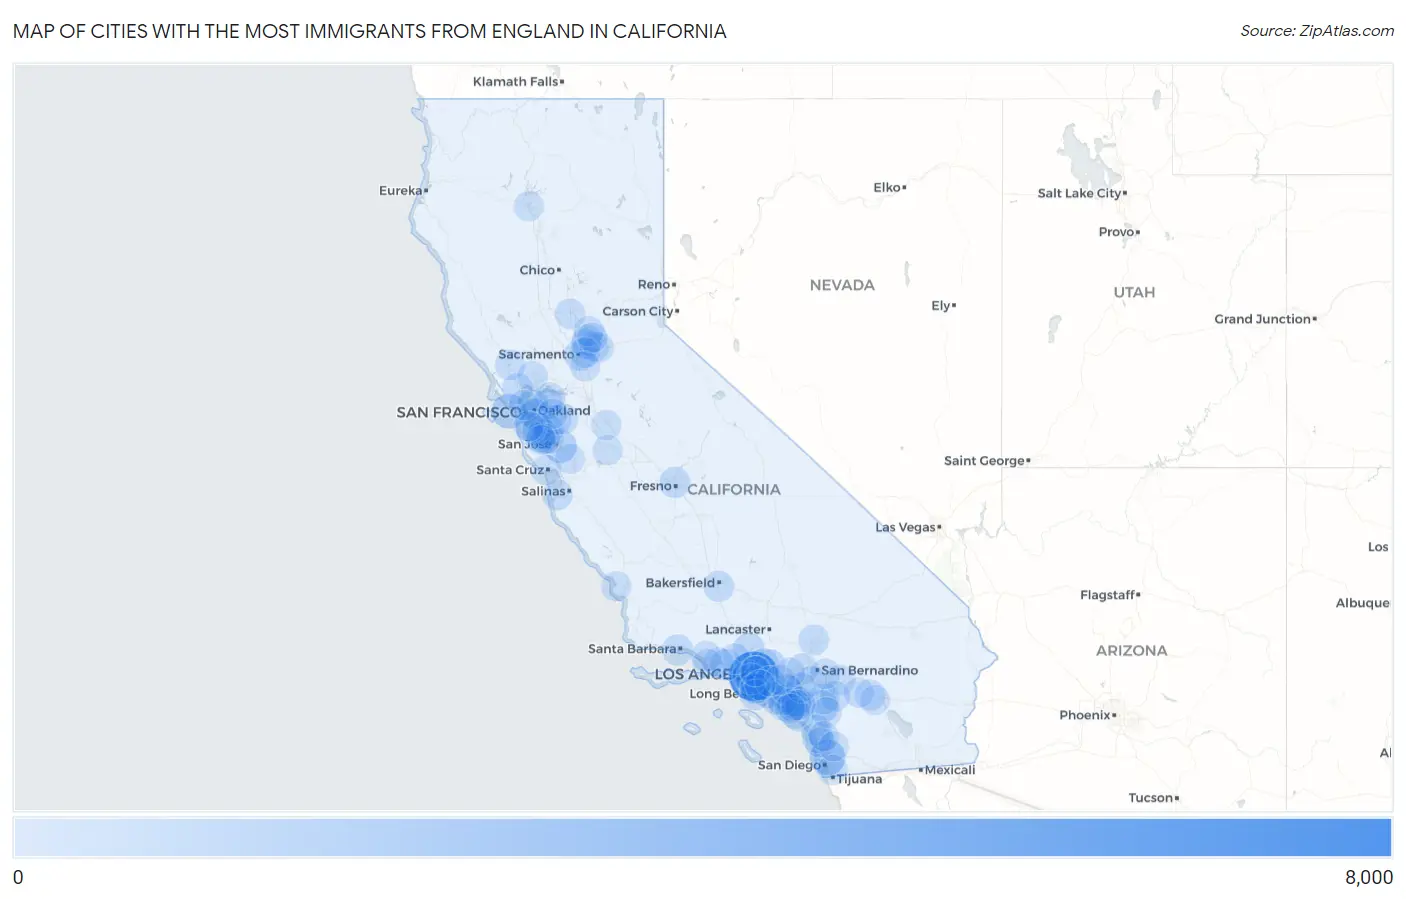
Map of Cities with the Most Immigrants from England in California
0
8,000
Cities with the Most Immigrants from England in California
| City | England | vs State | vs National | |
| 1. | Los Angeles | 6,510 | 57,953(11.23%)#1 | 318,896(2.04%)#2 |
| 2. | San Diego | 1,898 | 57,953(3.28%)#2 | 318,896(0.60%)#5 |
| 3. | San Francisco | 1,548 | 57,953(2.67%)#3 | 318,896(0.49%)#6 |
| 4. | San Jose | 1,178 | 57,953(2.03%)#4 | 318,896(0.37%)#9 |
| 5. | Murrieta | 784 | 57,953(1.35%)#5 | 318,896(0.25%)#17 |
| 6. | Irvine | 724 | 57,953(1.25%)#6 | 318,896(0.23%)#22 |
| 7. | Huntington Beach | 657 | 57,953(1.13%)#7 | 318,896(0.21%)#27 |
| 8. | Long Beach | 656 | 57,953(1.13%)#8 | 318,896(0.21%)#28 |
| 9. | Santa Monica | 651 | 57,953(1.12%)#9 | 318,896(0.20%)#30 |
| 10. | Sacramento | 547 | 57,953(0.94%)#10 | 318,896(0.17%)#40 |
| 11. | Oakland | 527 | 57,953(0.91%)#11 | 318,896(0.17%)#45 |
| 12. | Thousand Oaks | 515 | 57,953(0.89%)#12 | 318,896(0.16%)#46 |
| 13. | Santa Clarita | 505 | 57,953(0.87%)#13 | 318,896(0.16%)#47 |
| 14. | Pasadena | 503 | 57,953(0.87%)#14 | 318,896(0.16%)#48 |
| 15. | Redondo Beach | 482 | 57,953(0.83%)#15 | 318,896(0.15%)#50 |
| 16. | Carlsbad | 442 | 57,953(0.76%)#16 | 318,896(0.14%)#55 |
| 17. | Santa Barbara | 437 | 57,953(0.75%)#17 | 318,896(0.14%)#57 |
| 18. | Menifee | 423 | 57,953(0.73%)#18 | 318,896(0.13%)#61 |
| 19. | Newport Beach | 420 | 57,953(0.72%)#19 | 318,896(0.13%)#64 |
| 20. | Livermore | 412 | 57,953(0.71%)#20 | 318,896(0.13%)#67 |
| 21. | Fresno | 402 | 57,953(0.69%)#21 | 318,896(0.13%)#70 |
| 22. | Berkeley | 389 | 57,953(0.67%)#22 | 318,896(0.12%)#73 |
| 23. | Walnut Creek | 385 | 57,953(0.66%)#23 | 318,896(0.12%)#74 |
| 24. | Glendale | 375 | 57,953(0.65%)#24 | 318,896(0.12%)#75 |
| 25. | Roseville | 367 | 57,953(0.63%)#25 | 318,896(0.12%)#79 |
| 26. | Bakersfield | 351 | 57,953(0.61%)#26 | 318,896(0.11%)#87 |
| 27. | Rancho Cucamonga | 341 | 57,953(0.59%)#27 | 318,896(0.11%)#88 |
| 28. | Novato | 334 | 57,953(0.58%)#28 | 318,896(0.10%)#91 |
| 29. | West Hollywood | 323 | 57,953(0.56%)#29 | 318,896(0.10%)#94 |
| 30. | Marina Del Rey | 318 | 57,953(0.55%)#30 | 318,896(0.10%)#97 |
| 31. | Victorville | 305 | 57,953(0.53%)#31 | 318,896(0.10%)#103 |
| 32. | Rancho Santa Margarita | 304 | 57,953(0.52%)#32 | 318,896(0.10%)#105 |
| 33. | Simi Valley | 288 | 57,953(0.50%)#33 | 318,896(0.09%)#113 |
| 34. | Anaheim | 287 | 57,953(0.50%)#34 | 318,896(0.09%)#114 |
| 35. | San Clemente | 279 | 57,953(0.48%)#35 | 318,896(0.09%)#116 |
| 36. | Palm Desert | 273 | 57,953(0.47%)#36 | 318,896(0.09%)#119 |
| 37. | Torrance | 272 | 57,953(0.47%)#37 | 318,896(0.09%)#120 |
| 38. | Santa Rosa | 271 | 57,953(0.47%)#38 | 318,896(0.08%)#121 |
| 39. | Oceanside | 266 | 57,953(0.46%)#39 | 318,896(0.08%)#125 |
| 40. | Riverside | 258 | 57,953(0.45%)#40 | 318,896(0.08%)#129 |
| 41. | Banning | 256 | 57,953(0.44%)#41 | 318,896(0.08%)#131 |
| 42. | Sunnyvale | 255 | 57,953(0.44%)#42 | 318,896(0.08%)#132 |
| 43. | Orange | 254 | 57,953(0.44%)#43 | 318,896(0.08%)#133 |
| 44. | Rancho Palos Verdes | 250 | 57,953(0.43%)#44 | 318,896(0.08%)#137 |
| 45. | Hemet | 248 | 57,953(0.43%)#45 | 318,896(0.08%)#139 |
| 46. | Napa | 248 | 57,953(0.43%)#46 | 318,896(0.08%)#140 |
| 47. | Redlands | 248 | 57,953(0.43%)#47 | 318,896(0.08%)#141 |
| 48. | Monterey | 244 | 57,953(0.42%)#48 | 318,896(0.08%)#145 |
| 49. | Lake Forest | 237 | 57,953(0.41%)#49 | 318,896(0.07%)#149 |
| 50. | Redwood City | 227 | 57,953(0.39%)#50 | 318,896(0.07%)#155 |
| 51. | Encinitas | 222 | 57,953(0.38%)#51 | 318,896(0.07%)#163 |
| 52. | Alameda | 216 | 57,953(0.37%)#52 | 318,896(0.07%)#169 |
| 53. | Chula Vista | 215 | 57,953(0.37%)#53 | 318,896(0.07%)#170 |
| 54. | Orangevale | 213 | 57,953(0.37%)#54 | 318,896(0.07%)#173 |
| 55. | Coto De Caza | 209 | 57,953(0.36%)#55 | 318,896(0.07%)#175 |
| 56. | Folsom | 207 | 57,953(0.36%)#56 | 318,896(0.06%)#176 |
| 57. | Camarillo | 207 | 57,953(0.36%)#57 | 318,896(0.06%)#177 |
| 58. | Aliso Viejo | 203 | 57,953(0.35%)#58 | 318,896(0.06%)#183 |
| 59. | Yuba City | 202 | 57,953(0.35%)#59 | 318,896(0.06%)#185 |
| 60. | Temecula | 201 | 57,953(0.35%)#60 | 318,896(0.06%)#188 |
| 61. | Antelope | 198 | 57,953(0.34%)#61 | 318,896(0.06%)#192 |
| 62. | Costa Mesa | 194 | 57,953(0.33%)#62 | 318,896(0.06%)#194 |
| 63. | Santa Cruz | 192 | 57,953(0.33%)#63 | 318,896(0.06%)#196 |
| 64. | Dana Point | 191 | 57,953(0.33%)#64 | 318,896(0.06%)#202 |
| 65. | Lincoln | 190 | 57,953(0.33%)#65 | 318,896(0.06%)#203 |
| 66. | Corona | 188 | 57,953(0.32%)#66 | 318,896(0.06%)#206 |
| 67. | Mission Viejo | 185 | 57,953(0.32%)#67 | 318,896(0.06%)#212 |
| 68. | San Buenaventura Ventura | 184 | 57,953(0.32%)#68 | 318,896(0.06%)#213 |
| 69. | Eastern Goleta Valley | 182 | 57,953(0.31%)#69 | 318,896(0.06%)#220 |
| 70. | Fremont | 180 | 57,953(0.31%)#70 | 318,896(0.06%)#224 |
| 71. | Beverly Hills | 177 | 57,953(0.31%)#71 | 318,896(0.06%)#231 |
| 72. | East Palo Alto | 176 | 57,953(0.30%)#72 | 318,896(0.06%)#233 |
| 73. | Foster City | 175 | 57,953(0.30%)#73 | 318,896(0.05%)#234 |
| 74. | Laguna Beach | 171 | 57,953(0.30%)#74 | 318,896(0.05%)#241 |
| 75. | Arden Arcade | 168 | 57,953(0.29%)#75 | 318,896(0.05%)#246 |
| 76. | Downey | 166 | 57,953(0.29%)#76 | 318,896(0.05%)#249 |
| 77. | La Habra Heights | 164 | 57,953(0.28%)#77 | 318,896(0.05%)#253 |
| 78. | Pleasanton | 163 | 57,953(0.28%)#78 | 318,896(0.05%)#254 |
| 79. | Stanford | 163 | 57,953(0.28%)#79 | 318,896(0.05%)#255 |
| 80. | Morgan Hill | 162 | 57,953(0.28%)#80 | 318,896(0.05%)#256 |
| 81. | Concord | 156 | 57,953(0.27%)#81 | 318,896(0.05%)#267 |
| 82. | Elk Grove | 152 | 57,953(0.26%)#82 | 318,896(0.05%)#279 |
| 83. | Rocklin | 151 | 57,953(0.26%)#83 | 318,896(0.05%)#281 |
| 84. | Mountain View | 145 | 57,953(0.25%)#84 | 318,896(0.05%)#293 |
| 85. | Oxnard | 144 | 57,953(0.25%)#85 | 318,896(0.05%)#296 |
| 86. | San Ramon | 143 | 57,953(0.25%)#86 | 318,896(0.04%)#299 |
| 87. | Gardena | 139 | 57,953(0.24%)#87 | 318,896(0.04%)#311 |
| 88. | San Mateo | 138 | 57,953(0.24%)#88 | 318,896(0.04%)#315 |
| 89. | Tiburon | 138 | 57,953(0.24%)#89 | 318,896(0.04%)#318 |
| 90. | Redding | 130 | 57,953(0.22%)#90 | 318,896(0.04%)#337 |
| 91. | Palm Springs | 129 | 57,953(0.22%)#91 | 318,896(0.04%)#343 |
| 92. | Los Osos | 129 | 57,953(0.22%)#92 | 318,896(0.04%)#345 |
| 93. | Pomona | 125 | 57,953(0.22%)#93 | 318,896(0.04%)#366 |
| 94. | Gustine | 125 | 57,953(0.22%)#94 | 318,896(0.04%)#369 |
| 95. | Modesto | 124 | 57,953(0.21%)#95 | 318,896(0.04%)#370 |
| 96. | Palo Alto | 124 | 57,953(0.21%)#96 | 318,896(0.04%)#373 |
| 97. | La Quinta | 124 | 57,953(0.21%)#97 | 318,896(0.04%)#374 |
| 98. | Burlingame | 124 | 57,953(0.21%)#98 | 318,896(0.04%)#375 |
| 99. | San Marcos | 123 | 57,953(0.21%)#99 | 318,896(0.04%)#378 |
| 100. | Poway | 123 | 57,953(0.21%)#100 | 318,896(0.04%)#379 |
Common Questions
What are the Top 10 Cities with the Most Immigrants from England in California?
Top 10 Cities with the Most Immigrants from England in California are:
#1
6,510
#2
1,898
#3
1,548
#4
1,178
#5
784
#6
724
#7
657
#8
656
#9
651
#10
547
What city has the Most Immigrants from England in California?
Los Angeles has the Most Immigrants from England in California with 6,510.
What is the Total Immigrants from England in the State of California?
Total Immigrants from England in California is 57,953.
What is the Total Immigrants from England in the United States?
Total Immigrants from England in the United States is 318,896.