Cities with the Highest Percentage of Immigrants from Malaysia in California
RELATED REPORTS & OPTIONS
Malaysia
California
Compare Cities
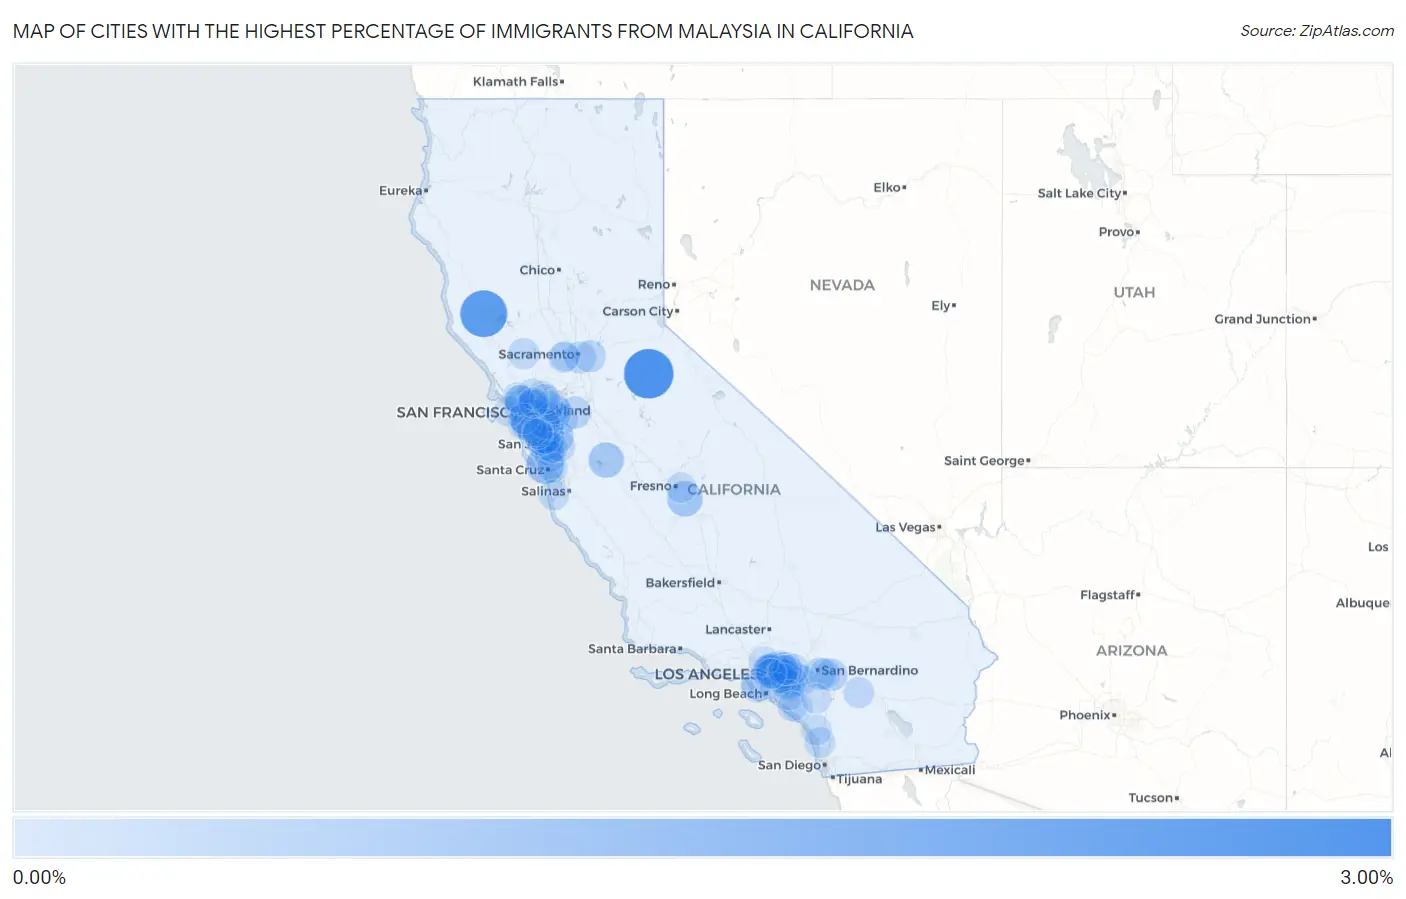
Map of Cities with the Highest Percentage of Immigrants from Malaysia in California
0.00%
3.00%
Cities with the Highest Percentage of Immigrants from Malaysia in California
| City | Malaysia | vs State | vs National | |
| 1. | Dorrington | 2.81% | 0.046%(+2.77)#-1 | 0.025%(+2.79)#0 |
| 2. | Talmage | 2.42% | 0.046%(+2.38)#0 | 0.025%(+2.40)#1 |
| 3. | Brisbane | 1.37% | 0.046%(+1.32)#1 | 0.025%(+1.34)#2 |
| 4. | Felton | 1.11% | 0.046%(+1.06)#2 | 0.025%(+1.08)#3 |
| 5. | Selma | 0.82% | 0.046%(+0.772)#3 | 0.025%(+0.793)#4 |
| 6. | Santa Nella | 0.78% | 0.046%(+0.733)#4 | 0.025%(+0.754)#5 |
| 7. | Loyola | 0.71% | 0.046%(+0.662)#5 | 0.025%(+0.682)#6 |
| 8. | Milpitas | 0.70% | 0.046%(+0.659)#136 | 0.025%(+0.679)#787 |
| 9. | Sausalito | 0.53% | 0.046%(+0.480)#137 | 0.025%(+0.500)#788 |
| 10. | Camp Pendleton Mainside | 0.49% | 0.046%(+0.444)#138 | 0.025%(+0.465)#789 |
| 11. | Saratoga | 0.49% | 0.046%(+0.442)#139 | 0.025%(+0.463)#790 |
| 12. | Alhambra | 0.46% | 0.046%(+0.415)#218 | 0.025%(+0.436)#1,247 |
| 13. | Yucaipa | 0.40% | 0.046%(+0.359)#219 | 0.025%(+0.379)#1,248 |
| 14. | Diamond Bar | 0.40% | 0.046%(+0.356)#220 | 0.025%(+0.377)#1,249 |
| 15. | Temple City | 0.40% | 0.046%(+0.353)#260 | 0.025%(+0.373)#1,409 |
| 16. | Arcadia | 0.39% | 0.046%(+0.344)#261 | 0.025%(+0.365)#1,410 |
| 17. | East San Gabriel | 0.38% | 0.046%(+0.338)#262 | 0.025%(+0.359)#1,411 |
| 18. | Mountain House | 0.38% | 0.046%(+0.332)#263 | 0.025%(+0.352)#1,412 |
| 19. | Loma Linda | 0.37% | 0.046%(+0.320)#264 | 0.025%(+0.341)#1,413 |
| 20. | Sunnyvale | 0.36% | 0.046%(+0.315)#265 | 0.025%(+0.336)#1,414 |
| 21. | Fruitridge Pocket | 0.32% | 0.046%(+0.276)#266 | 0.025%(+0.297)#1,415 |
| 22. | Mather | 0.32% | 0.046%(+0.273)#267 | 0.025%(+0.293)#1,416 |
| 23. | San Gabriel | 0.30% | 0.046%(+0.255)#268 | 0.025%(+0.276)#1,417 |
| 24. | Emeryville | 0.28% | 0.046%(+0.235)#269 | 0.025%(+0.255)#1,418 |
| 25. | Walnut | 0.26% | 0.046%(+0.213)#270 | 0.025%(+0.234)#1,419 |
| 26. | Angwin | 0.26% | 0.046%(+0.211)#271 | 0.025%(+0.231)#1,420 |
| 27. | Brea | 0.25% | 0.046%(+0.207)#272 | 0.025%(+0.228)#1,421 |
| 28. | Cupertino | 0.24% | 0.046%(+0.197)#273 | 0.025%(+0.218)#1,422 |
| 29. | Duarte | 0.24% | 0.046%(+0.194)#274 | 0.025%(+0.215)#1,423 |
| 30. | Corte Madera | 0.24% | 0.046%(+0.191)#275 | 0.025%(+0.211)#1,424 |
| 31. | Chino | 0.22% | 0.046%(+0.176)#276 | 0.025%(+0.197)#1,425 |
| 32. | Monterey Park | 0.22% | 0.046%(+0.176)#277 | 0.025%(+0.197)#1,426 |
| 33. | Glendora | 0.22% | 0.046%(+0.173)#278 | 0.025%(+0.194)#1,427 |
| 34. | Livermore | 0.22% | 0.046%(+0.172)#301 | 0.025%(+0.193)#1,568 |
| 35. | Dublin | 0.22% | 0.046%(+0.171)#302 | 0.025%(+0.192)#1,569 |
| 36. | Palm Springs | 0.22% | 0.046%(+0.170)#303 | 0.025%(+0.191)#1,570 |
| 37. | Fremont | 0.22% | 0.046%(+0.170)#304 | 0.025%(+0.191)#1,571 |
| 38. | Camino Tassajara | 0.21% | 0.046%(+0.163)#305 | 0.025%(+0.183)#1,572 |
| 39. | Redlands | 0.21% | 0.046%(+0.161)#306 | 0.025%(+0.181)#1,573 |
| 40. | Los Altos | 0.21% | 0.046%(+0.160)#307 | 0.025%(+0.181)#1,574 |
| 41. | North El Monte | 0.20% | 0.046%(+0.155)#308 | 0.025%(+0.176)#1,575 |
| 42. | Lexington Hills | 0.19% | 0.046%(+0.148)#309 | 0.025%(+0.168)#1,576 |
| 43. | San Marino | 0.19% | 0.046%(+0.147)#310 | 0.025%(+0.168)#1,577 |
| 44. | Alameda | 0.19% | 0.046%(+0.145)#311 | 0.025%(+0.166)#1,578 |
| 45. | Palo Alto | 0.19% | 0.046%(+0.140)#312 | 0.025%(+0.161)#1,579 |
| 46. | Highlands | 0.18% | 0.046%(+0.138)#313 | 0.025%(+0.158)#1,580 |
| 47. | Pacifica | 0.18% | 0.046%(+0.133)#314 | 0.025%(+0.154)#1,581 |
| 48. | Del Aire | 0.18% | 0.046%(+0.131)#315 | 0.025%(+0.152)#1,582 |
| 49. | Sonoma State University | 0.18% | 0.046%(+0.130)#316 | 0.025%(+0.151)#1,583 |
| 50. | Soquel | 0.17% | 0.046%(+0.126)#317 | 0.025%(+0.146)#1,584 |
| 51. | University Of California Davis | 0.17% | 0.046%(+0.125)#318 | 0.025%(+0.145)#1,585 |
| 52. | Encinitas | 0.16% | 0.046%(+0.119)#319 | 0.025%(+0.140)#1,586 |
| 53. | Oceanside | 0.16% | 0.046%(+0.117)#320 | 0.025%(+0.138)#1,587 |
| 54. | Eastvale | 0.16% | 0.046%(+0.115)#321 | 0.025%(+0.136)#1,588 |
| 55. | South Pasadena | 0.16% | 0.046%(+0.112)#322 | 0.025%(+0.133)#1,589 |
| 56. | Chino Hills | 0.16% | 0.046%(+0.112)#323 | 0.025%(+0.132)#1,590 |
| 57. | Union City | 0.16% | 0.046%(+0.111)#324 | 0.025%(+0.132)#1,591 |
| 58. | Castro Valley | 0.15% | 0.046%(+0.109)#325 | 0.025%(+0.129)#1,592 |
| 59. | Sunnyside | 0.15% | 0.046%(+0.108)#326 | 0.025%(+0.128)#1,593 |
| 60. | North Fork | 0.15% | 0.046%(+0.107)#327 | 0.025%(+0.128)#1,594 |
| 61. | Azusa | 0.15% | 0.046%(+0.105)#328 | 0.025%(+0.126)#1,595 |
| 62. | Blackhawk | 0.15% | 0.046%(+0.105)#329 | 0.025%(+0.126)#1,596 |
| 63. | Berkeley | 0.15% | 0.046%(+0.103)#330 | 0.025%(+0.123)#1,597 |
| 64. | Albany | 0.14% | 0.046%(+0.099)#331 | 0.025%(+0.120)#1,598 |
| 65. | Hacienda Heights | 0.14% | 0.046%(+0.099)#332 | 0.025%(+0.119)#1,599 |
| 66. | Martinez | 0.14% | 0.046%(+0.097)#333 | 0.025%(+0.118)#1,600 |
| 67. | San Jose | 0.14% | 0.046%(+0.095)#334 | 0.025%(+0.116)#1,601 |
| 68. | East Bakersfield | 0.14% | 0.046%(+0.094)#335 | 0.025%(+0.115)#1,602 |
| 69. | Pacific Grove | 0.14% | 0.046%(+0.094)#336 | 0.025%(+0.114)#1,603 |
| 70. | Hercules | 0.14% | 0.046%(+0.093)#337 | 0.025%(+0.113)#1,604 |
| 71. | Yorba Linda | 0.13% | 0.046%(+0.085)#338 | 0.025%(+0.106)#1,605 |
| 72. | San Francisco | 0.13% | 0.046%(+0.083)#339 | 0.025%(+0.104)#1,606 |
| 73. | West Covina | 0.13% | 0.046%(+0.081)#340 | 0.025%(+0.102)#1,607 |
| 74. | Campbell | 0.13% | 0.046%(+0.081)#341 | 0.025%(+0.102)#1,608 |
| 75. | Claremont | 0.12% | 0.046%(+0.079)#342 | 0.025%(+0.100)#1,609 |
| 76. | Mountain View | 0.12% | 0.046%(+0.079)#343 | 0.025%(+0.099)#1,610 |
| 77. | San Mateo | 0.12% | 0.046%(+0.077)#344 | 0.025%(+0.098)#1,611 |
| 78. | Millbrae | 0.12% | 0.046%(+0.077)#345 | 0.025%(+0.098)#1,612 |
| 79. | Rowland Heights | 0.12% | 0.046%(+0.075)#346 | 0.025%(+0.096)#1,613 |
| 80. | Ladera Ranch | 0.12% | 0.046%(+0.074)#347 | 0.025%(+0.094)#1,614 |
| 81. | San Anselmo | 0.12% | 0.046%(+0.072)#348 | 0.025%(+0.093)#1,615 |
| 82. | La Crescenta Montrose | 0.11% | 0.046%(+0.069)#349 | 0.025%(+0.090)#1,616 |
| 83. | Hayward | 0.11% | 0.046%(+0.067)#350 | 0.025%(+0.088)#1,617 |
| 84. | Belmont | 0.11% | 0.046%(+0.066)#351 | 0.025%(+0.086)#1,618 |
| 85. | Daly City | 0.11% | 0.046%(+0.064)#352 | 0.025%(+0.085)#1,619 |
| 86. | La Palma | 0.11% | 0.046%(+0.064)#353 | 0.025%(+0.085)#1,620 |
| 87. | Tustin | 0.11% | 0.046%(+0.064)#354 | 0.025%(+0.084)#1,621 |
| 88. | San Dimas | 0.11% | 0.046%(+0.062)#355 | 0.025%(+0.082)#1,622 |
| 89. | Redwood City | 0.11% | 0.046%(+0.060)#356 | 0.025%(+0.081)#1,623 |
| 90. | Alamo | 0.10% | 0.046%(+0.059)#357 | 0.025%(+0.080)#1,624 |
| 91. | Davis | 0.10% | 0.046%(+0.059)#358 | 0.025%(+0.079)#1,625 |
| 92. | North Fair Oaks | 0.10% | 0.046%(+0.057)#359 | 0.025%(+0.077)#1,626 |
| 93. | Larkspur | 0.10% | 0.046%(+0.055)#360 | 0.025%(+0.075)#1,627 |
| 94. | Citrus | 0.10% | 0.046%(+0.055)#361 | 0.025%(+0.075)#1,628 |
| 95. | Pleasant Hill | 0.096% | 0.046%(+0.050)#362 | 0.025%(+0.071)#1,629 |
| 96. | Aliso Viejo | 0.094% | 0.046%(+0.049)#363 | 0.025%(+0.069)#1,630 |
| 97. | Kensington | 0.094% | 0.046%(+0.049)#364 | 0.025%(+0.069)#1,631 |
| 98. | Redondo Beach | 0.093% | 0.046%(+0.048)#365 | 0.025%(+0.069)#1,632 |
| 99. | Lake Elsinore | 0.091% | 0.046%(+0.046)#366 | 0.025%(+0.066)#1,633 |
| 100. | South San Gabriel | 0.090% | 0.046%(+0.044)#367 | 0.025%(+0.065)#1,634 |
Common Questions
What are the Top 10 Cities with the Highest Percentage of Immigrants from Malaysia in California?
Top 10 Cities with the Highest Percentage of Immigrants from Malaysia in California are:
#1
2.81%
#2
2.42%
#3
1.37%
#4
1.11%
#5
0.82%
#6
0.78%
#7
0.71%
#8
0.70%
#9
0.53%
#10
0.49%
What city has the Highest Percentage of Immigrants from Malaysia in California?
Dorrington has the Highest Percentage of Immigrants from Malaysia in California with 2.81%.
What is the Percentage of Immigrants from Malaysia in the State of California?
Percentage of Immigrants from Malaysia in California is 0.046%.
What is the Percentage of Immigrants from Malaysia in the United States?
Percentage of Immigrants from Malaysia in the United States is 0.025%.