Puerto Rico Map & Demographics
Puerto Rico Map
Puerto Rico Overview
Jul 25, 1898
INCORPORATED
3,425
TOTAL AREA [ SQ MI ]
3,459
LAND AREA [ SQ MI ]
56
WATER AREA [ SQ MI ]
856
ELEVATION AVG [ FT ]
4,390
ELEVATION HIGH [ FT ]
Sea Level
ELEVATION LOW [ FT ]
946.0
POP DENSITY [ PPL / SQ MI ]
$15,637
PER CAPITA INCOME
$29,240
AVG FAMILY INCOME
$24,002
AVG HOUSEHOLD INCOME
0.7%
WAGE / INCOME GAP [ % ]
99.3¢/ $1
WAGE / INCOME GAP [ $ ]
$11,267
FAMILY INCOME DEFICIT
0.54
INEQUALITY / GINI INDEX
00926
LARGEST ZIP CODE
San Juan
LARGEST CITY
San Juan Municipio
LARGEST COUNTY
3,272,382
TOTAL POPULATION
1,551,668
MALE POPULATION
1,720,714
FEMALE POPULATION
90.18
MALES / 100 FEMALES
110.89
FEMALES / 100 MALES
43.7
MEDIAN AGE
3.3
AVG FAMILY SIZE
2.6
AVG HOUSEHOLD SIZE
1,250,873
LABOR FORCE [ PEOPLE ]
44.9%
PERCENT IN LABOR FORCE
13.3%
UNEMPLOYMENT RATE
Income in Puerto Rico
Income Overview in Puerto Rico
Per Capita Income in Puerto Rico is $15,637, while median incomes of families and households are $29,240 and $24,002 respectively.
| Characteristic | Number | Measure |
| Per Capita Income | 3,272,382 | $15,637 |
| Median Family Income | 795,953 | $29,240 |
| Mean Family Income | 795,953 | $44,020 |
| Median Household Income | 1,219,658 | $24,002 |
| Mean Household Income | 1,219,658 | $38,227 |
| Income Deficit | 795,953 | $11,267 |
| Wage / Income Gap (%) | 3,272,382 | 0.69% |
| Wage / Income Gap ($) | 3,272,382 | 99.31¢ per $1 |
| Gini / Inequality Index | 3,272,382 | 0.54 |
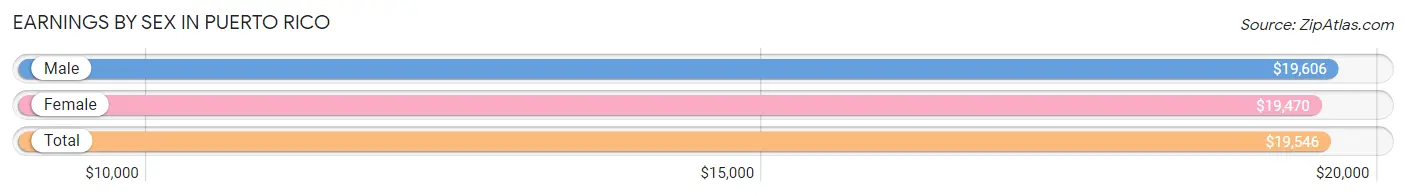
Earnings by Sex in Puerto Rico
Average Earnings in Puerto Rico are $19,546, $19,606 for men and $19,470 for women, a difference of 0.7%.
| Sex | Number | Average Earnings |
| Male | 620,647 (52.5%) | $19,606 |
| Female | 561,473 (47.5%) | $19,470 |
| Total | 1,182,120 (100.0%) | $19,546 |
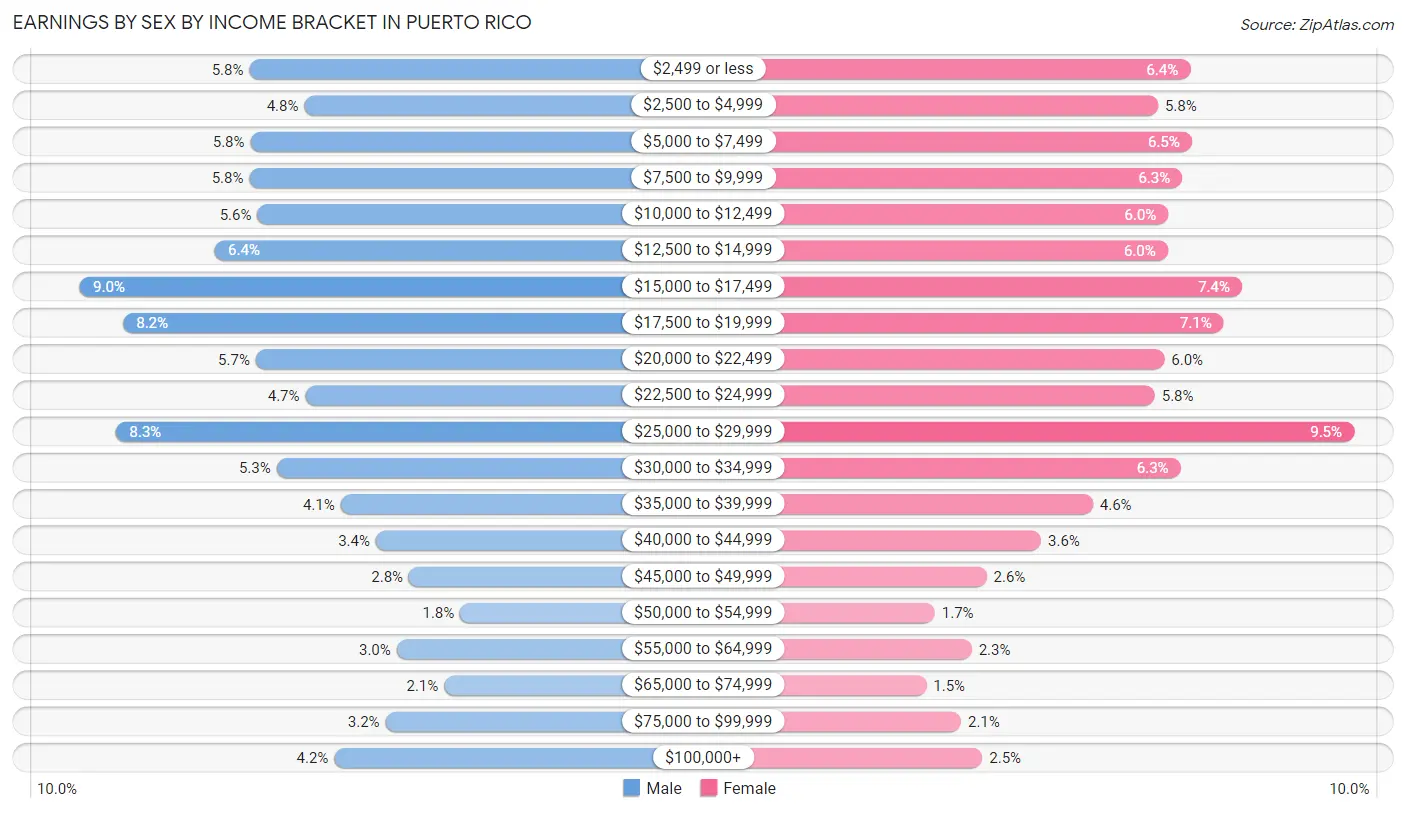
Earnings by Sex by Income Bracket in Puerto Rico
The most common earnings brackets in Puerto Rico are $15,000 to $17,499 for men (55,592 | 9.0%) and $25,000 to $29,999 for women (53,342 | 9.5%).
| Income | Male | Female |
| $2,499 or less | 35,913 (5.8%) | 36,081 (6.4%) |
| $2,500 to $4,999 | 29,556 (4.8%) | 32,719 (5.8%) |
| $5,000 to $7,499 | 35,784 (5.8%) | 36,286 (6.5%) |
| $7,500 to $9,999 | 35,919 (5.8%) | 35,279 (6.3%) |
| $10,000 to $12,499 | 35,030 (5.6%) | 33,803 (6.0%) |
| $12,500 to $14,999 | 39,932 (6.4%) | 33,765 (6.0%) |
| $15,000 to $17,499 | 55,592 (9.0%) | 41,570 (7.4%) |
| $17,500 to $19,999 | 50,560 (8.2%) | 39,645 (7.1%) |
| $20,000 to $22,499 | 35,192 (5.7%) | 33,410 (5.9%) |
| $22,500 to $24,999 | 29,391 (4.7%) | 32,403 (5.8%) |
| $25,000 to $29,999 | 51,420 (8.3%) | 53,342 (9.5%) |
| $30,000 to $34,999 | 32,746 (5.3%) | 35,093 (6.2%) |
| $35,000 to $39,999 | 25,332 (4.1%) | 25,869 (4.6%) |
| $40,000 to $44,999 | 21,240 (3.4%) | 20,422 (3.6%) |
| $45,000 to $49,999 | 17,407 (2.8%) | 14,717 (2.6%) |
| $50,000 to $54,999 | 11,425 (1.8%) | 9,273 (1.7%) |
| $55,000 to $64,999 | 18,778 (3.0%) | 13,147 (2.3%) |
| $65,000 to $74,999 | 13,281 (2.1%) | 8,390 (1.5%) |
| $75,000 to $99,999 | 20,107 (3.2%) | 12,014 (2.1%) |
| $100,000+ | 26,042 (4.2%) | 14,245 (2.5%) |
| Total | 620,647 (100.0%) | 561,473 (100.0%) |
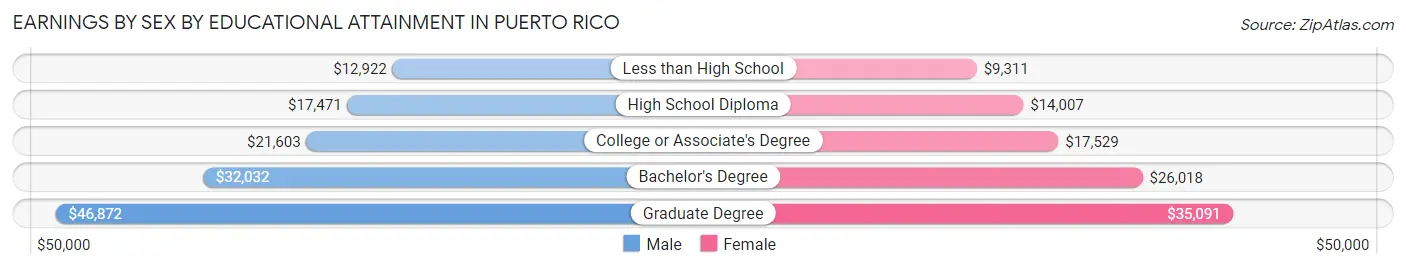
Earnings by Sex by Educational Attainment in Puerto Rico
Average earnings in Puerto Rico are $21,246 for men and $21,147 for women, a difference of 0.5%. Men with an educational attainment of graduate degree enjoy the highest average annual earnings of $46,872, while those with less than high school education earn the least with $12,922. Women with an educational attainment of graduate degree earn the most with the average annual earnings of $35,091, while those with less than high school education have the smallest earnings of $9,311.
| Educational Attainment | Male Income | Female Income |
| Less than High School | $12,922 | $9,311 |
| High School Diploma | $17,471 | $14,007 |
| College or Associate's Degree | $21,603 | $17,529 |
| Bachelor's Degree | $32,032 | $26,018 |
| Graduate Degree | $46,872 | $35,091 |
| Total | $21,246 | $21,147 |
Family Income in Puerto Rico
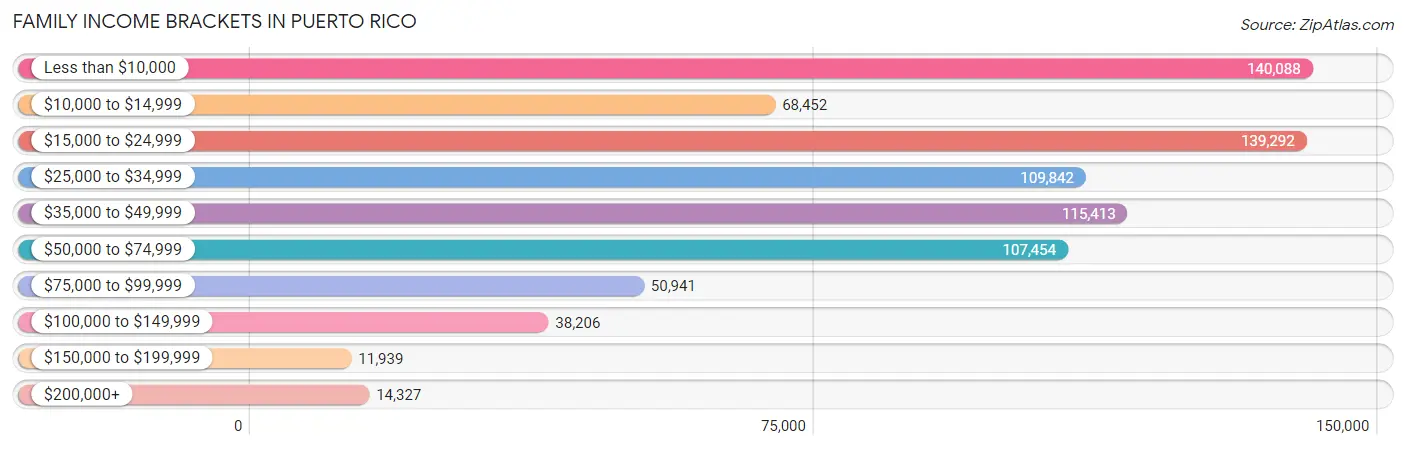
Family Income Brackets in Puerto Rico
According to the Puerto Rico family income data, there are 140,088 families falling into the less than $10,000 income range, which is the most common income bracket and makes up 17.6% of all families. Conversely, the $150,000 to $199,999 income bracket is the least frequent group with only 11,939 families (1.5%) belonging to this category.
| Income Bracket | # Families | % Families |
| Less than $10,000 | 140,088 | 17.6% |
| $10,000 to $14,999 | 68,452 | 8.6% |
| $15,000 to $24,999 | 139,292 | 17.5% |
| $25,000 to $34,999 | 109,842 | 13.8% |
| $35,000 to $49,999 | 115,413 | 14.5% |
| $50,000 to $74,999 | 107,454 | 13.5% |
| $75,000 to $99,999 | 50,941 | 6.4% |
| $100,000 to $149,999 | 38,206 | 4.8% |
| $150,000 to $199,999 | 11,939 | 1.5% |
| $200,000+ | 14,327 | 1.8% |
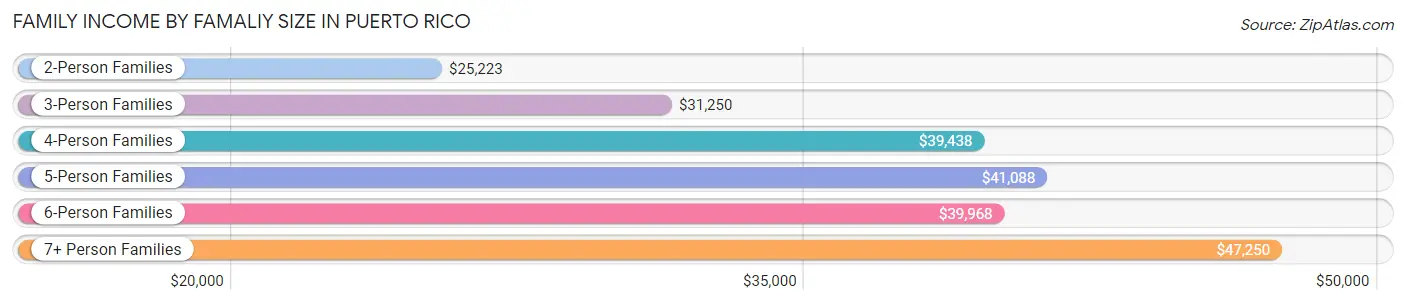
Family Income by Famaliy Size in Puerto Rico
7+ person families (4,123 | 0.5%) account for the highest median family income in Puerto Rico with $47,250 per family, while 2-person families (393,463 | 49.4%) have the highest median income of $12,612 per family member.
| Income Bracket | # Families | Median Income |
| 2-Person Families | 393,463 (49.4%) | $25,223 |
| 3-Person Families | 225,785 (28.4%) | $31,250 |
| 4-Person Families | 125,431 (15.8%) | $39,438 |
| 5-Person Families | 38,128 (4.8%) | $41,088 |
| 6-Person Families | 9,023 (1.1%) | $39,968 |
| 7+ Person Families | 4,123 (0.5%) | $47,250 |
| Total | 795,953 (100.0%) | $29,240 |
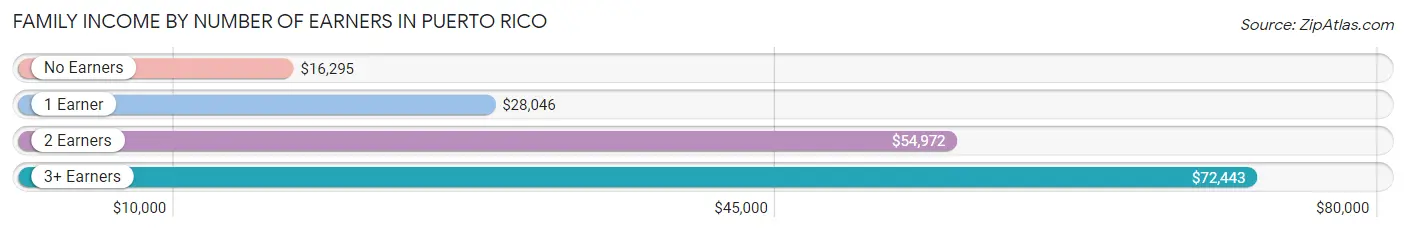
Family Income by Number of Earners in Puerto Rico
The median family income in Puerto Rico is $29,240, with families comprising 3+ earners (37,859) having the highest median family income of $72,443, while families with no earners (284,772) have the lowest median family income of $16,295, accounting for 4.8% and 35.8% of families, respectively.
| Number of Earners | # Families | Median Income |
| No Earners | 284,772 (35.8%) | $16,295 |
| 1 Earner | 294,755 (37.0%) | $28,046 |
| 2 Earners | 178,567 (22.4%) | $54,972 |
| 3+ Earners | 37,859 (4.8%) | $72,443 |
| Total | 795,953 (100.0%) | $29,240 |
Household Income in Puerto Rico
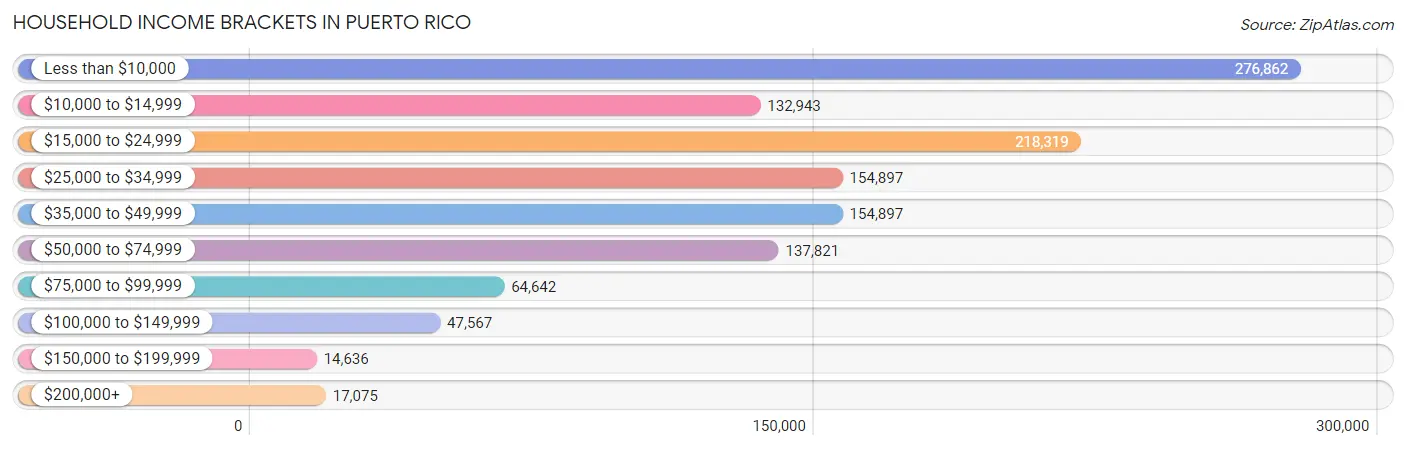
Household Income Brackets in Puerto Rico
With 276,862 households falling in the category, the less than $10,000 income range is the most frequent in Puerto Rico, accounting for 22.7% of all households. In contrast, only 14,636 households (1.2%) fall into the $150,000 to $199,999 income bracket, making it the least populous group.
| Income Bracket | # Households | % Households |
| Less than $10,000 | 276,862 | 22.7% |
| $10,000 to $14,999 | 132,943 | 10.9% |
| $15,000 to $24,999 | 218,319 | 17.9% |
| $25,000 to $34,999 | 154,897 | 12.7% |
| $35,000 to $49,999 | 154,897 | 12.7% |
| $50,000 to $74,999 | 137,821 | 11.3% |
| $75,000 to $99,999 | 64,642 | 5.3% |
| $100,000 to $149,999 | 47,567 | 3.9% |
| $150,000 to $199,999 | 14,636 | 1.2% |
| $200,000+ | 17,075 | 1.4% |
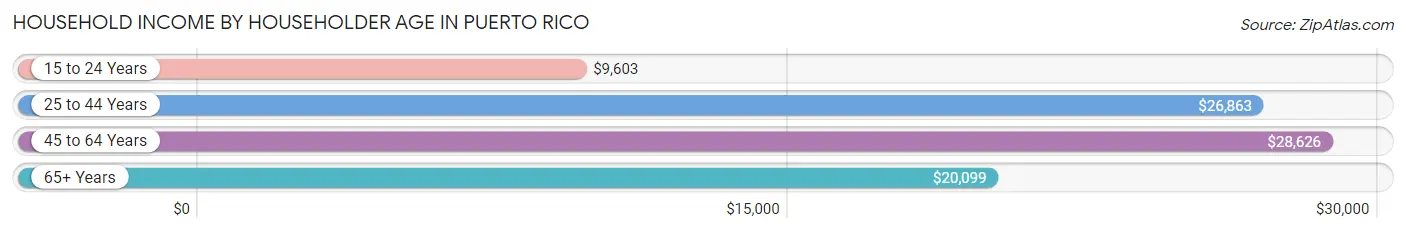
Household Income by Householder Age in Puerto Rico
The median household income in Puerto Rico is $24,002, with the highest median household income of $28,626 found in the 45 to 64 years age bracket for the primary householder. A total of 455,812 households (37.4%) fall into this category. Meanwhile, the 15 to 24 years age bracket for the primary householder has the lowest median household income of $9,603, with 20,979 households (1.7%) in this group.
| Income Bracket | # Households | Median Income |
| 15 to 24 Years | 20,979 (1.7%) | $9,603 |
| 25 to 44 Years | 293,399 (24.1%) | $26,863 |
| 45 to 64 Years | 455,812 (37.4%) | $28,626 |
| 65+ Years | 449,468 (36.8%) | $20,099 |
| Total | 1,219,658 (100.0%) | $24,002 |
Poverty in Puerto Rico
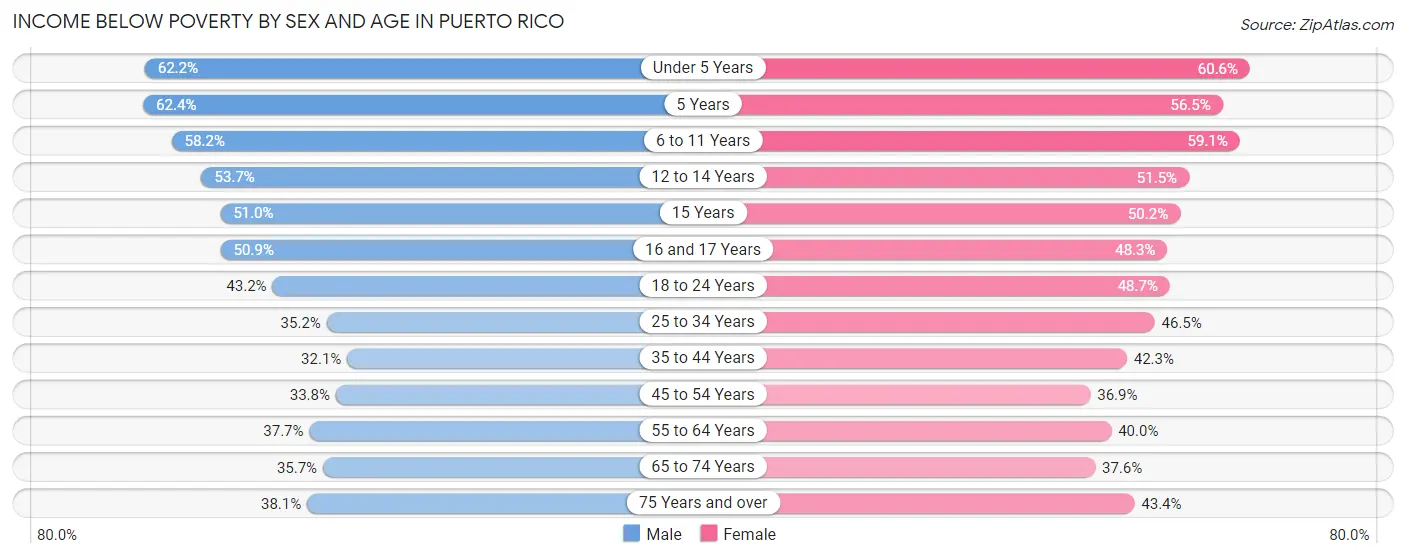
Income Below Poverty by Sex and Age in Puerto Rico
With 40.1% poverty level for males and 44.1% for females among the residents of Puerto Rico, 5 year old males and under 5 year old females are the most vulnerable to poverty, with 8,550 males (62.4%) and 33,298 females (60.6%) in their respective age groups living below the poverty level.
| Age Bracket | Male | Female |
| Under 5 Years | 35,576 (62.2%) | 33,298 (60.6%) |
| 5 Years | 8,550 (62.4%) | 7,561 (56.5%) |
| 6 to 11 Years | 57,350 (58.2%) | 55,584 (59.1%) |
| 12 to 14 Years | 30,519 (53.7%) | 29,142 (51.5%) |
| 15 Years | 9,739 (50.9%) | 9,265 (50.2%) |
| 16 and 17 Years | 20,991 (50.9%) | 18,479 (48.3%) |
| 18 to 24 Years | 66,471 (43.2%) | 72,344 (48.7%) |
| 25 to 34 Years | 71,697 (35.1%) | 98,585 (46.5%) |
| 35 to 44 Years | 58,639 (32.1%) | 87,676 (42.3%) |
| 45 to 54 Years | 66,232 (33.8%) | 82,013 (36.9%) |
| 55 to 64 Years | 75,774 (37.7%) | 95,679 (40.0%) |
| 65 to 74 Years | 60,498 (35.7%) | 78,721 (37.6%) |
| 75 Years and over | 53,138 (38.1%) | 84,839 (43.4%) |
| Total | 615,174 (40.1%) | 753,186 (44.1%) |
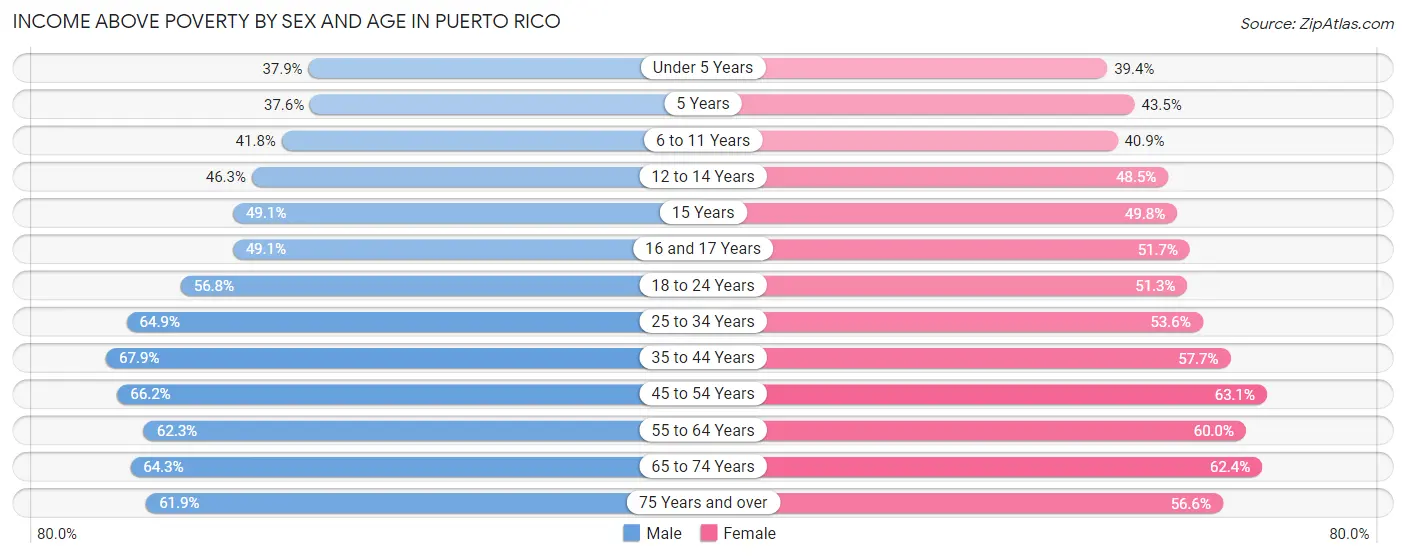
Income Above Poverty by Sex and Age in Puerto Rico
According to the poverty statistics in Puerto Rico, males aged 35 to 44 years and females aged 45 to 54 years are the age groups that are most secure financially, with 67.9% of males and 63.1% of females in these age groups living above the poverty line.
| Age Bracket | Male | Female |
| Under 5 Years | 21,665 (37.9%) | 21,656 (39.4%) |
| 5 Years | 5,155 (37.6%) | 5,815 (43.5%) |
| 6 to 11 Years | 41,241 (41.8%) | 38,522 (40.9%) |
| 12 to 14 Years | 26,273 (46.3%) | 27,400 (48.5%) |
| 15 Years | 9,376 (49.0%) | 9,187 (49.8%) |
| 16 and 17 Years | 20,239 (49.1%) | 19,749 (51.7%) |
| 18 to 24 Years | 87,385 (56.8%) | 76,232 (51.3%) |
| 25 to 34 Years | 132,302 (64.8%) | 113,657 (53.5%) |
| 35 to 44 Years | 124,054 (67.9%) | 119,513 (57.7%) |
| 45 to 54 Years | 129,793 (66.2%) | 140,267 (63.1%) |
| 55 to 64 Years | 125,105 (62.3%) | 143,444 (60.0%) |
| 65 to 74 Years | 108,965 (64.3%) | 130,637 (62.4%) |
| 75 Years and over | 86,466 (61.9%) | 110,458 (56.6%) |
| Total | 918,019 (59.9%) | 956,537 (55.9%) |
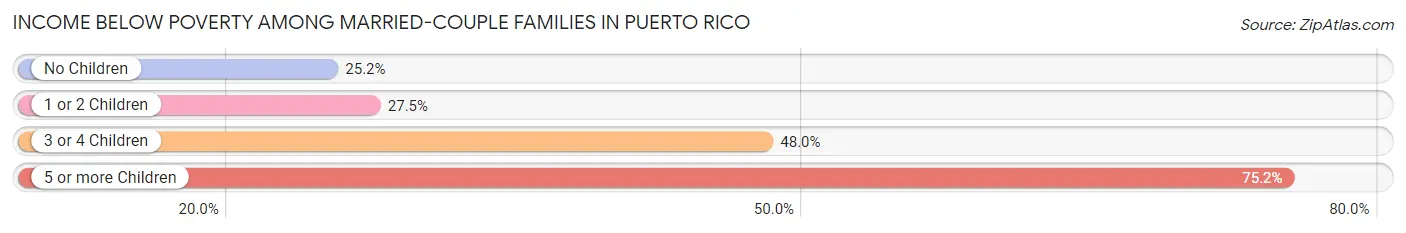
Income Below Poverty Among Married-Couple Families in Puerto Rico
The poverty statistics for married-couple families in Puerto Rico show that 26.4% or 116,129 of the total 440,016 families live below the poverty line. Families with 5 or more children have the highest poverty rate of 75.2%, comprising of 330 families. On the other hand, families with no children have the lowest poverty rate of 25.2%, which includes 79,644 families.
| Children | Above Poverty | Below Poverty |
| No Children | 235,884 (74.8%) | 79,644 (25.2%) |
| 1 or 2 Children | 82,576 (72.5%) | 31,253 (27.5%) |
| 3 or 4 Children | 5,318 (52.0%) | 4,902 (48.0%) |
| 5 or more Children | 109 (24.8%) | 330 (75.2%) |
| Total | 323,887 (73.6%) | 116,129 (26.4%) |
Income Below Poverty Among Single-Parent Households in Puerto Rico
According to the poverty data in Puerto Rico, 47.3% or 38,601 single-father households and 56.3% or 154,446 single-mother households are living below the poverty line. Among single-father households, those with 5 or more children have the highest poverty rate, with 106 households (100.0%) experiencing poverty. Likewise, among single-mother households, those with 5 or more children have the highest poverty rate, with 479 households (97.8%) falling below the poverty line.
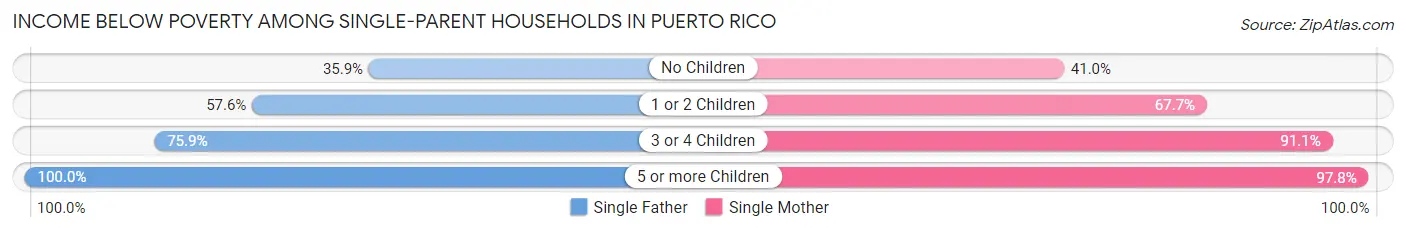
| Children | Single Father | Single Mother |
| No Children | 15,166 (35.9%) | 54,127 (41.0%) |
| 1 or 2 Children | 20,295 (57.6%) | 84,729 (67.6%) |
| 3 or 4 Children | 3,034 (75.8%) | 15,111 (91.0%) |
| 5 or more Children | 106 (100.0%) | 479 (97.8%) |
| Total | 38,601 (47.3%) | 154,446 (56.3%) |
Income Below Poverty Among Married-Couple vs Single-Parent Households in Puerto Rico
The poverty data for Puerto Rico shows that 116,129 of the married-couple family households (26.4%) and 193,047 of the single-parent households (54.2%) are living below the poverty level. Within the married-couple family households, those with 5 or more children have the highest poverty rate, with 330 households (75.2%) falling below the poverty line. Among the single-parent households, those with 5 or more children have the highest poverty rate, with 585 household (98.2%) living below poverty.
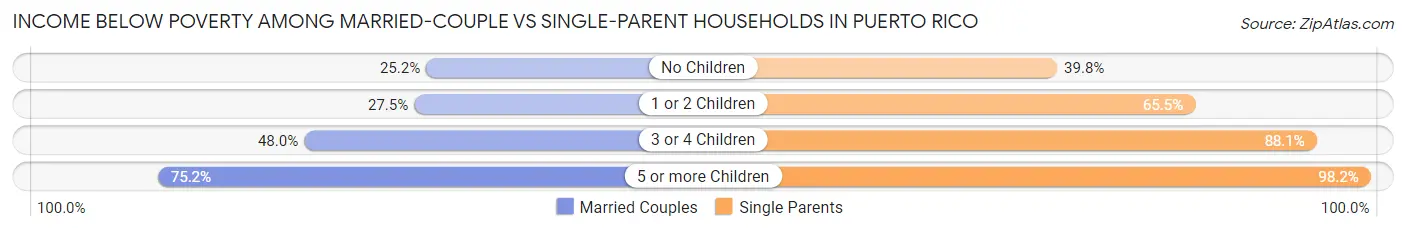
| Children | Married-Couple Families | Single-Parent Households |
| No Children | 79,644 (25.2%) | 69,293 (39.8%) |
| 1 or 2 Children | 31,253 (27.5%) | 105,024 (65.4%) |
| 3 or 4 Children | 4,902 (48.0%) | 18,145 (88.1%) |
| 5 or more Children | 330 (75.2%) | 585 (98.2%) |
| Total | 116,129 (26.4%) | 193,047 (54.2%) |
Largest Zip Codes by Population in Puerto Rico
The largest zip codes in Puerto Rico by population are 00926 (93,751), 00725 (77,244), 00949 (68,031), 00953 (66,079), and 00956 (65,841).
1.00926
93,751 (2.86%)
2.00725
77,244 (2.36%)
3.00949
68,031 (2.08%)
4.00953
66,079 (2.02%)
5.00956
65,841 (2.01%)
6.00612
63,312 (1.93%)
7.00976
61,638 (1.88%)
8.00693
55,570 (1.70%)
9.00987
54,109 (1.65%)
10.00727
53,258 (1.63%)
11.00603
49,075 (1.50%)
12.00729
47,826 (1.46%)
13.00959
47,721 (1.46%)
14.00745
47,494 (1.45%)
15.00924
47,080 (1.44%)
16.00791
46,537 (1.42%)
17.00736
45,867 (1.40%)
18.00680
43,173 (1.32%)
19.00795
42,900 (1.31%)
20.00969
41,784 (1.28%)
21.00957
41,009 (1.25%)
22.00662
40,480 (1.24%)
23.00778
40,476 (1.24%)
24.00685
40,346 (1.23%)
25.00623
39,406 (1.20%)
26.00674
39,385 (1.20%)
27.00728
38,590 (1.18%)
28.00777
37,726 (1.15%)
29.00602
37,642 (1.15%)
30.00659
37,066 (1.13%)
Largest Cities by Population in Puerto Rico
The largest cities in Puerto Rico by population are San Juan (322,616), Bayamón (168,698), Carolina (139,201), Ponce (110,867), and Caguas (73,713).
1.San Juan
322,616 (9.86%)
2.Bayamón
168,698 (5.16%)
3.Carolina
139,201 (4.25%)
4.Ponce
110,867 (3.39%)
5.Caguas
73,713 (2.25%)
6.Guaynabo
70,167 (2.14%)
7.Mayaguez
60,062 (1.84%)
43,192 (1.32%)
9.Arecibo
40,485 (1.24%)
27,301 (0.83%)
11.Fajardo
25,573 (0.78%)
12.Vega Baja
23,418 (0.72%)
13.Catano
23,060 (0.70%)
14.Guayama
18,153 (0.55%)
15.Humacao
16,762 (0.51%)
16.Yauco
15,165 (0.46%)
17.Cayey
14,423 (0.44%)
18.Candelaria
14,114 (0.43%)
19.Dorado
13,208 (0.40%)
20.Canovanas
12,468 (0.38%)
21.Rio Grande
12,311 (0.38%)
11,939 (0.36%)
23.Aguadilla
11,383 (0.35%)
24.Hormigueros
11,224 (0.34%)
25.Manati
11,134 (0.34%)
10,301 (0.31%)
27.San German
10,266 (0.31%)
28.Cabo Rojo
10,137 (0.31%)
29.Isabela
10,110 (0.31%)
30.Pajaros
10,043 (0.31%)
Largest Counties by Population in Puerto Rico
The largest counties in Puerto Rico by population are San Juan Municipio (340,903), Bayamon Municipio (184,326), Carolina Municipio (154,126), Ponce Municipio (136,542), and Caguas Municipio (126,772).
340,903 (10.42%)
184,326 (5.63%)
154,126 (4.71%)
136,542 (4.17%)
126,772 (3.87%)
89,554 (2.74%)
87,217 (2.67%)
74,854 (2.29%)
72,721 (2.22%)
67,497 (2.06%)
66,699 (2.04%)
54,752 (1.67%)
54,182 (1.66%)
50,729 (1.55%)
46,983 (1.44%)
46,838 (1.43%)
46,333 (1.42%)
42,817 (1.31%)
42,218 (1.29%)
41,509 (1.27%)
40,517 (1.24%)
39,831 (1.22%)
39,310 (1.20%)
39,183 (1.20%)
38,330 (1.17%)
37,998 (1.16%)
37,552 (1.15%)
37,363 (1.14%)
36,928 (1.13%)
36,365 (1.11%)
Race in Puerto Rico
The most populous races in Puerto Rico are Hispanic or Latino (3,231,327 | 98.8%), White / Caucasian (1,425,431 | 43.6%), and Some other Race (786,315 | 24.0%).
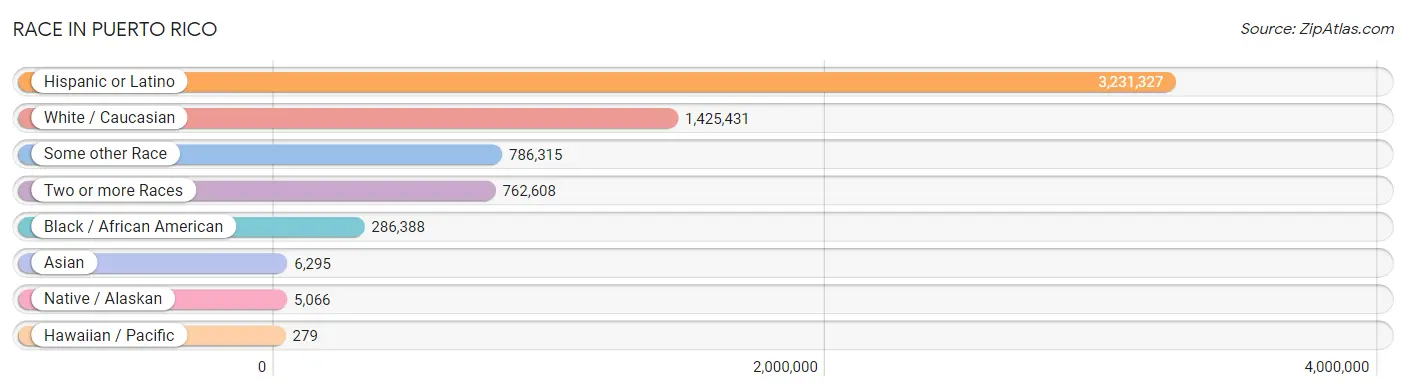
| Race | # Population | % Population |
| Asian | 6,295 | 0.2% |
| Black / African American | 286,388 | 8.7% |
| Hawaiian / Pacific | 279 | 0.0% |
| Hispanic or Latino | 3,231,327 | 98.8% |
| Native / Alaskan | 5,066 | 0.2% |
| White / Caucasian | 1,425,431 | 43.6% |
| Two or more Races | 762,608 | 23.3% |
| Some other Race | 786,315 | 24.0% |
| Total | 3,272,382 | 100.0% |
Ancestry in Puerto Rico
The most populous ancestries reported in Puerto Rico are Puerto Rican (3,123,942 | 95.5%), Dominican (55,911 | 1.7%), American (45,869 | 1.4%), Central American Indian (44,444 | 1.4%), and South American (13,864 | 0.4%), together accounting for 100.4% of all Puerto Rico residents.
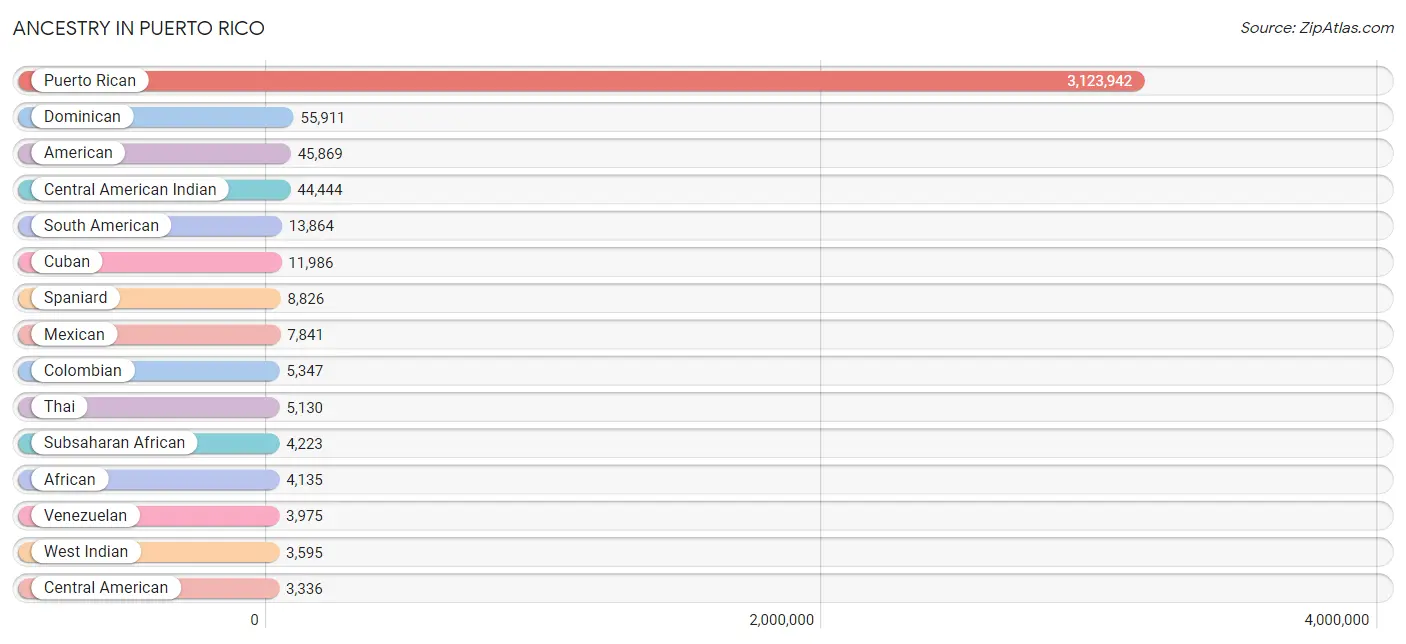
| Ancestry | # Population | % Population |
| African | 4,135 | 0.1% |
| American | 45,869 | 1.4% |
| Apache | 14 | 0.0% |
| Arab | 1,546 | 0.1% |
| Argentinean | 883 | 0.0% |
| Australian | 57 | 0.0% |
| Austrian | 55 | 0.0% |
| Barbadian | 36 | 0.0% |
| Basque | 68 | 0.0% |
| Belgian | 120 | 0.0% |
| Bhutanese | 107 | 0.0% |
| Bolivian | 22 | 0.0% |
| Brazilian | 319 | 0.0% |
| British | 460 | 0.0% |
| British West Indian | 492 | 0.0% |
| Bulgarian | 27 | 0.0% |
| Burmese | 335 | 0.0% |
| Canadian | 123 | 0.0% |
| Cape Verdean | 20 | 0.0% |
| Central American | 3,336 | 0.1% |
| Central American Indian | 44,444 | 1.4% |
| Cherokee | 27 | 0.0% |
| Chilean | 573 | 0.0% |
| Colombian | 5,347 | 0.2% |
| Costa Rican | 850 | 0.0% |
| Croatian | 9 | 0.0% |
| Cuban | 11,986 | 0.4% |
| Czech | 51 | 0.0% |
| Czechoslovakian | 42 | 0.0% |
| Danish | 29 | 0.0% |
| Dominican | 55,911 | 1.7% |
| Dutch | 174 | 0.0% |
| Dutch West Indian | 111 | 0.0% |
| Eastern European | 13 | 0.0% |
| Ecuadorian | 1,292 | 0.0% |
| Egyptian | 8 | 0.0% |
| English | 1,049 | 0.0% |
| European | 1,390 | 0.0% |
| Fijian | 10 | 0.0% |
| Finnish | 11 | 0.0% |
| French | 2,149 | 0.1% |
| French Canadian | 104 | 0.0% |
| German | 2,075 | 0.1% |
| Greek | 148 | 0.0% |
| Guamanian / Chamorro | 21 | 0.0% |
| Guatemalan | 265 | 0.0% |
| Guyanese | 21 | 0.0% |
| Haitian | 584 | 0.0% |
| Honduran | 664 | 0.0% |
| Hungarian | 48 | 0.0% |
| Indian (Asian) | 2,533 | 0.1% |
| Inupiat | 16 | 0.0% |
| Iranian | 128 | 0.0% |
| Iraqi | 19 | 0.0% |
| Irish | 1,084 | 0.0% |
| Israeli | 61 | 0.0% |
| Italian | 3,159 | 0.1% |
| Jamaican | 130 | 0.0% |
| Kenyan | 23 | 0.0% |
| Korean | 526 | 0.0% |
| Laotian | 49 | 0.0% |
| Lebanese | 251 | 0.0% |
| Liberian | 12 | 0.0% |
| Lithuanian | 14 | 0.0% |
| Mexican | 7,841 | 0.2% |
| Mexican American Indian | 275 | 0.0% |
| Native Hawaiian | 144 | 0.0% |
| Navajo | 12 | 0.0% |
| Nicaraguan | 280 | 0.0% |
| Nigerian | 18 | 0.0% |
| Northern European | 50 | 0.0% |
| Norwegian | 79 | 0.0% |
| Osage | 16 | 0.0% |
| Pakistani | 51 | 0.0% |
| Palestinian | 567 | 0.0% |
| Panamanian | 874 | 0.0% |
| Paraguayan | 78 | 0.0% |
| Peruvian | 1,414 | 0.0% |
| Polish | 476 | 0.0% |
| Portuguese | 474 | 0.0% |
| Pueblo | 27 | 0.0% |
| Puerto Rican | 3,123,942 | 95.5% |
| Romanian | 87 | 0.0% |
| Russian | 222 | 0.0% |
| Salvadoran | 403 | 0.0% |
| Samoan | 65 | 0.0% |
| Scotch-Irish | 51 | 0.0% |
| Scottish | 195 | 0.0% |
| Serbian | 9 | 0.0% |
| Slovene | 17 | 0.0% |
| South American | 13,864 | 0.4% |
| South American Indian | 470 | 0.0% |
| Spaniard | 8,826 | 0.3% |
| Spanish | 70 | 0.0% |
| Spanish American Indian | 552 | 0.0% |
| Sri Lankan | 109 | 0.0% |
| Subsaharan African | 4,223 | 0.1% |
| Swedish | 97 | 0.0% |
| Swiss | 76 | 0.0% |
| Syrian | 31 | 0.0% |
| Thai | 5,130 | 0.2% |
| Trinidadian and Tobagonian | 108 | 0.0% |
| U.S. Virgin Islander | 341 | 0.0% |
| Ukrainian | 79 | 0.0% |
| Uruguayan | 268 | 0.0% |
| Venezuelan | 3,975 | 0.1% |
| Welsh | 9 | 0.0% |
| West Indian | 3,595 | 0.1% | View All 108 Rows |
Immigrants in Puerto Rico

| Immigration Origin | # Population | % Population | View All 0 Rows |
Sex and Age in Puerto Rico
Sex and Age in Puerto Rico
The most populous age groups in Puerto Rico are 20 to 24 Years (112,354 | 7.2%) for men and 60 to 64 Years (120,485 | 7.0%) for women.
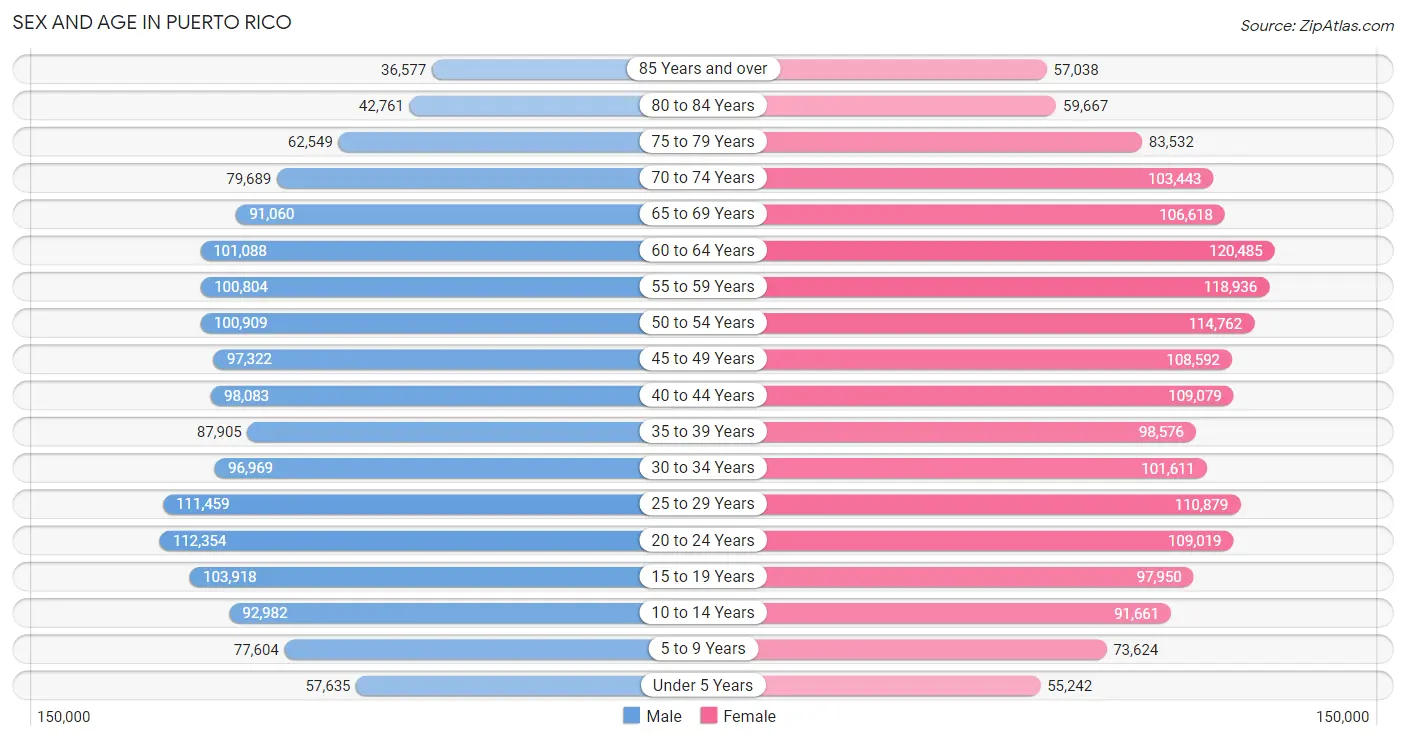
| Age Bracket | Male | Female |
| Under 5 Years | 57,635 (3.7%) | 55,242 (3.2%) |
| 5 to 9 Years | 77,604 (5.0%) | 73,624 (4.3%) |
| 10 to 14 Years | 92,982 (6.0%) | 91,661 (5.3%) |
| 15 to 19 Years | 103,918 (6.7%) | 97,950 (5.7%) |
| 20 to 24 Years | 112,354 (7.2%) | 109,019 (6.3%) |
| 25 to 29 Years | 111,459 (7.2%) | 110,879 (6.4%) |
| 30 to 34 Years | 96,969 (6.2%) | 101,611 (5.9%) |
| 35 to 39 Years | 87,905 (5.7%) | 98,576 (5.7%) |
| 40 to 44 Years | 98,083 (6.3%) | 109,079 (6.3%) |
| 45 to 49 Years | 97,322 (6.3%) | 108,592 (6.3%) |
| 50 to 54 Years | 100,909 (6.5%) | 114,762 (6.7%) |
| 55 to 59 Years | 100,804 (6.5%) | 118,936 (6.9%) |
| 60 to 64 Years | 101,088 (6.5%) | 120,485 (7.0%) |
| 65 to 69 Years | 91,060 (5.9%) | 106,618 (6.2%) |
| 70 to 74 Years | 79,689 (5.1%) | 103,443 (6.0%) |
| 75 to 79 Years | 62,549 (4.0%) | 83,532 (4.9%) |
| 80 to 84 Years | 42,761 (2.8%) | 59,667 (3.5%) |
| 85 Years and over | 36,577 (2.4%) | 57,038 (3.3%) |
| Total | 1,551,668 (100.0%) | 1,720,714 (100.0%) |
Families and Households in Puerto Rico
Median Family Size in Puerto Rico
The median family size in Puerto Rico is 3.33 persons per family, with single female/mother families (274,304 | 34.5%) accounting for the largest median family size of 3.41 persons per family. On the other hand, married-couple families (440,016 | 55.3%) represent the smallest median family size with 3.28 persons per family.
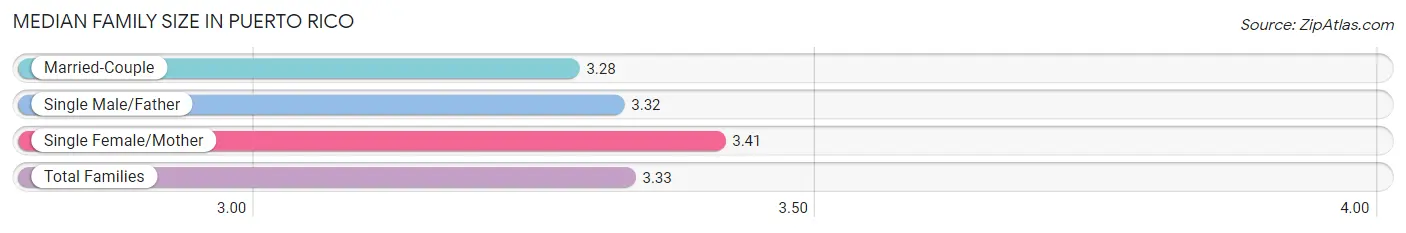
| Family Type | # Families | Family Size |
| Married-Couple | 440,016 (55.3%) | 3.28 |
| Single Male/Father | 81,633 (10.3%) | 3.32 |
| Single Female/Mother | 274,304 (34.5%) | 3.41 |
| Total Families | 795,953 (100.0%) | 3.33 |
Median Household Size in Puerto Rico
The median household size in Puerto Rico is 2.65 persons per household, with single male/father households (81,633 | 6.7%) accounting for the largest median household size of 3.79 persons per household. non-family households (423,705 | 34.7%) represent the smallest median household size with 1.17 persons per household.
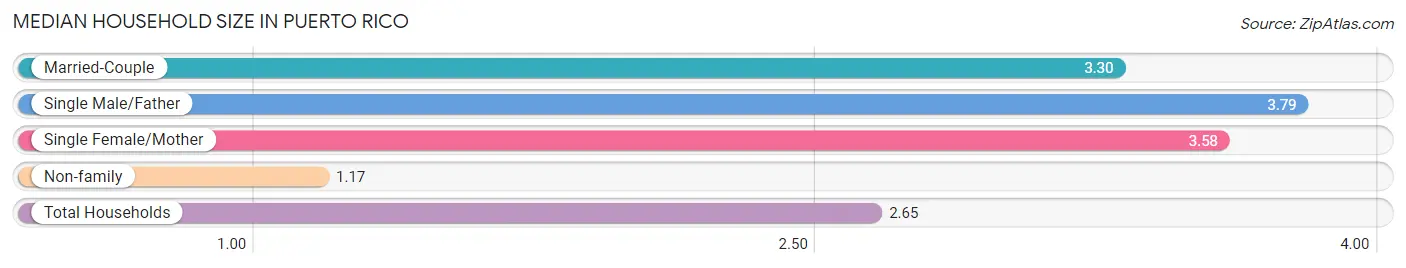
| Household Type | # Households | Household Size |
| Married-Couple | 440,016 (36.1%) | 3.30 |
| Single Male/Father | 81,633 (6.7%) | 3.79 |
| Single Female/Mother | 274,304 (22.5%) | 3.58 |
| Non-family | 423,705 (34.7%) | 1.17 |
| Total Households | 1,219,658 (100.0%) | 2.65 |
Household Size by Marriage Status in Puerto Rico
Out of a total of 1,219,658 households in Puerto Rico, 795,953 (65.3%) are family households, while 423,705 (34.7%) are nonfamily households. The most numerous type of family households are 2-person households, comprising 356,817, and the most common type of nonfamily households are 1-person households, comprising 363,908.
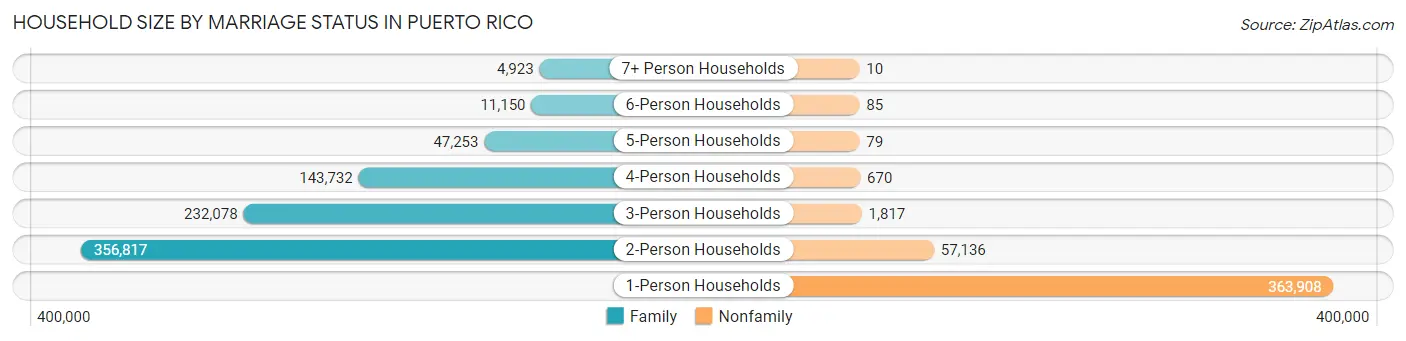
| Household Size | Family Households | Nonfamily Households |
| 1-Person Households | - | 363,908 (29.8%) |
| 2-Person Households | 356,817 (29.3%) | 57,136 (4.7%) |
| 3-Person Households | 232,078 (19.0%) | 1,817 (0.2%) |
| 4-Person Households | 143,732 (11.8%) | 670 (0.1%) |
| 5-Person Households | 47,253 (3.9%) | 79 (0.0%) |
| 6-Person Households | 11,150 (0.9%) | 85 (0.0%) |
| 7+ Person Households | 4,923 (0.4%) | 10 (0.0%) |
| Total | 795,953 (65.3%) | 423,705 (34.7%) |
Female Fertility in Puerto Rico
Fertility by Age in Puerto Rico
Average fertility rate in Puerto Rico is 28.0 births per 1,000 women. Women in the age bracket of 20 to 34 years have the highest fertility rate with 49.0 births per 1,000 women. Women in the age bracket of 20 to 34 years acount for 74.5% of all women with births.
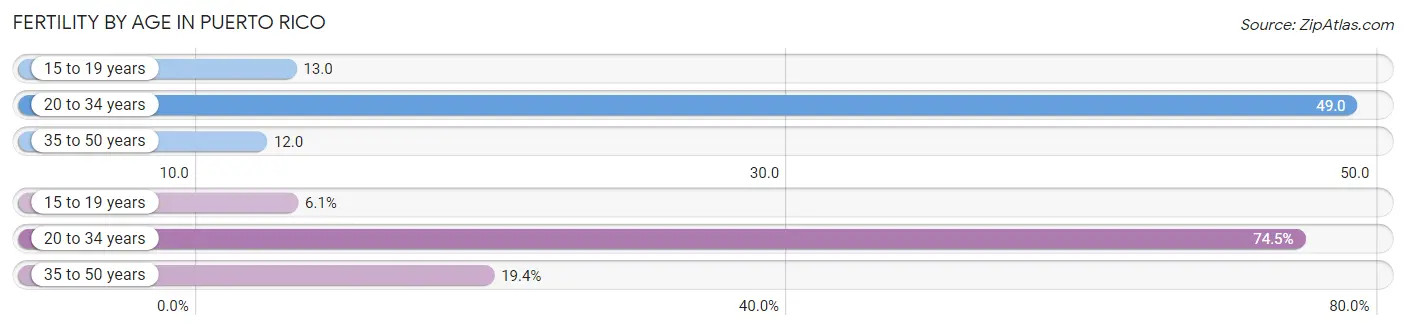
| Age Bracket | Women with Births | Births / 1,000 Women |
| 15 to 19 years | 1,284 (6.1%) | 13.0 |
| 20 to 34 years | 15,655 (74.5%) | 49.0 |
| 35 to 50 years | 4,083 (19.4%) | 12.0 |
| Total | 21,022 (100.0%) | 28.0 |
Fertility by Age by Marriage Status in Puerto Rico
40.1% of women with births (21,022) in Puerto Rico are married. The highest percentage of unmarried women with births falls into 15 to 19 years age bracket with 93.1% of them unmarried at the time of birth, while the lowest percentage of unmarried women with births belong to 35 to 50 years age bracket with 40.1% of them unmarried.
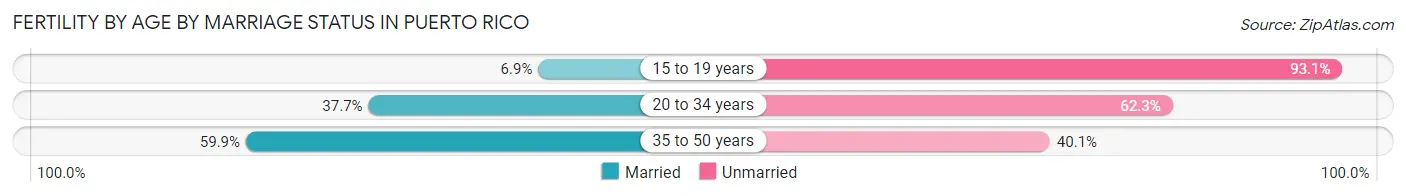
| Age Bracket | Married | Unmarried |
| 15 to 19 years | 89 (6.9%) | 1,195 (93.1%) |
| 20 to 34 years | 5,902 (37.7%) | 9,753 (62.3%) |
| 35 to 50 years | 2,446 (59.9%) | 1,637 (40.1%) |
| Total | 8,430 (40.1%) | 12,592 (59.9%) |
Fertility by Education in Puerto Rico
Average fertility rate in Puerto Rico is 28.0 births per 1,000 women. Women with the education attainment of college or associate's degree have the highest fertility rate of 32.0 births per 1,000 women, while women with the education attainment of less than high school have the lowest fertility at 14.0 births per 1,000 women. Women with the education attainment of college or associate's degree represent 38.0% of all women with births.
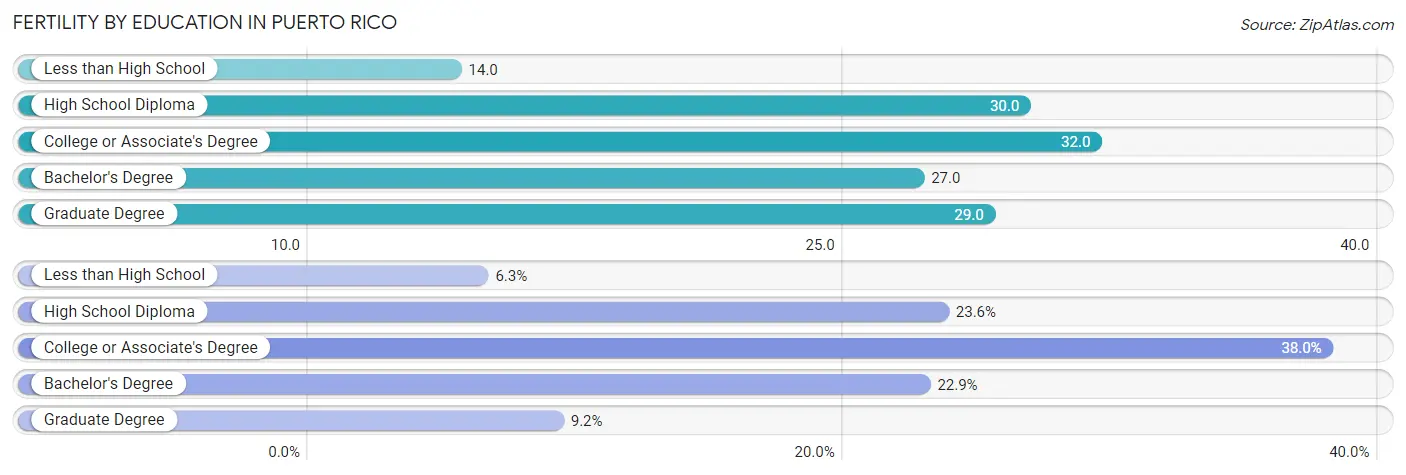
| Educational Attainment | Women with Births | Births / 1,000 Women |
| Less than High School | 1,333 (6.3%) | 14.0 |
| High School Diploma | 4,960 (23.6%) | 30.0 |
| College or Associate's Degree | 7,989 (38.0%) | 32.0 |
| Bachelor's Degree | 4,815 (22.9%) | 27.0 |
| Graduate Degree | 1,925 (9.2%) | 29.0 |
| Total | 21,022 (100.0%) | 28.0 |
Fertility by Education by Marriage Status in Puerto Rico
59.9% of women with births in Puerto Rico are unmarried. Women with the educational attainment of graduate degree are most likely to be married with 67.4% of them married at childbirth, while women with the educational attainment of less than high school are least likely to be married with 80.8% of them unmarried at childbirth.
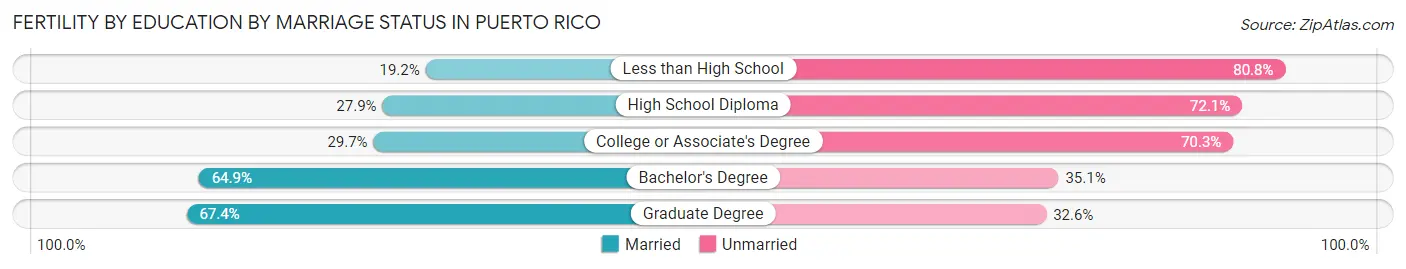
| Educational Attainment | Married | Unmarried |
| Less than High School | 256 (19.2%) | 1,077 (80.8%) |
| High School Diploma | 1,384 (27.9%) | 3,576 (72.1%) |
| College or Associate's Degree | 2,373 (29.7%) | 5,616 (70.3%) |
| Bachelor's Degree | 3,125 (64.9%) | 1,690 (35.1%) |
| Graduate Degree | 1,297 (67.4%) | 628 (32.6%) |
| Total | 8,430 (40.1%) | 12,592 (59.9%) |
Employment Characteristics in Puerto Rico
Employment by Class of Employer in Puerto Rico
Among the 1,051,707 employed individuals in Puerto Rico, private company employees (658,882 | 62.6%), state government employees (121,258 | 11.5%), and self-employed (not incorporated) (115,106 | 10.9%) make up the most common classes of employment.
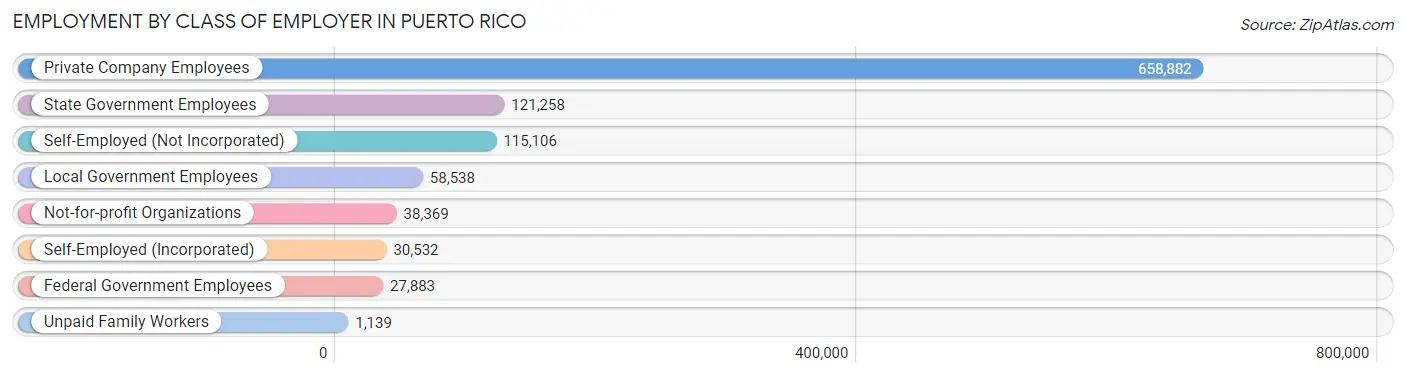
| Employer Class | # Employees | % Employees |
| Private Company Employees | 658,882 | 62.6% |
| Self-Employed (Incorporated) | 30,532 | 2.9% |
| Self-Employed (Not Incorporated) | 115,106 | 10.9% |
| Not-for-profit Organizations | 38,369 | 3.6% |
| Local Government Employees | 58,538 | 5.6% |
| State Government Employees | 121,258 | 11.5% |
| Federal Government Employees | 27,883 | 2.6% |
| Unpaid Family Workers | 1,139 | 0.1% |
| Total | 1,051,707 | 100.0% |
Employment Status by Age in Puerto Rico
According to the labor force statistics for Puerto Rico, out of the total population over 16 years of age (2,785,909), 44.9% or 1,250,873 individuals are in the labor force, with 13.3% or 166,366 of them unemployed. The age group with the highest labor force participation rate is 30 to 34 years, with 75.4% or 149,729 individuals in the labor force. Within the labor force, the 16 to 19 years age range has the highest percentage of unemployed individuals, with 43.9% or 10,953 of them being unemployed.
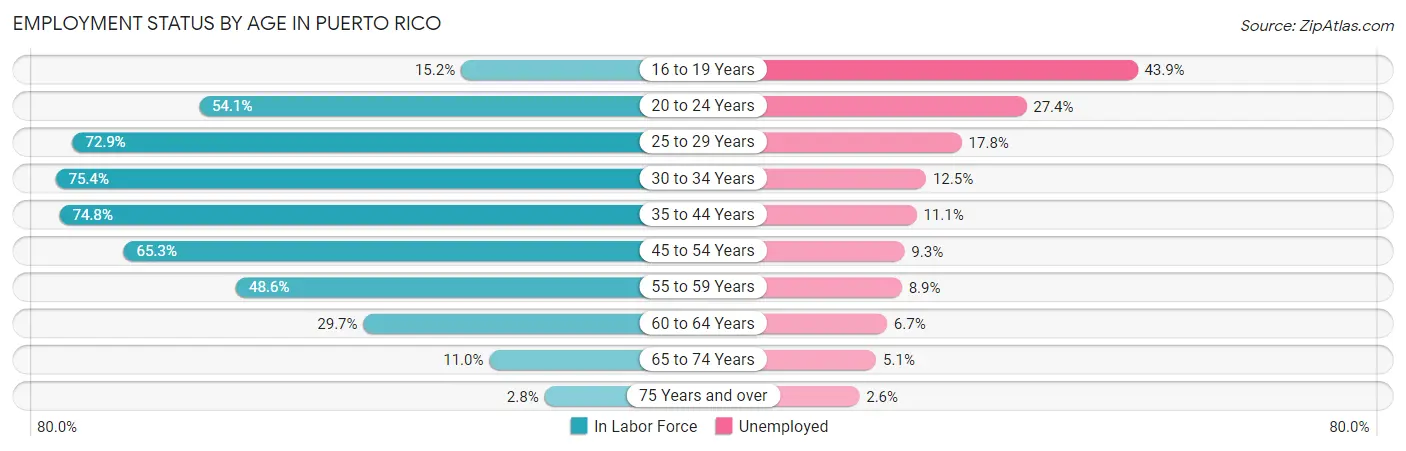
| Age Bracket | In Labor Force | Unemployed |
| 16 to 19 Years | 24,950 (15.2%) | 10,953 (43.9%) |
| 20 to 24 Years | 119,763 (54.1%) | 32,815 (27.4%) |
| 25 to 29 Years | 162,084 (72.9%) | 28,851 (17.8%) |
| 30 to 34 Years | 149,729 (75.4%) | 18,716 (12.5%) |
| 35 to 44 Years | 294,445 (74.8%) | 32,683 (11.1%) |
| 45 to 54 Years | 275,295 (65.3%) | 25,602 (9.3%) |
| 55 to 59 Years | 106,794 (48.6%) | 9,505 (8.9%) |
| 60 to 64 Years | 65,807 (29.7%) | 4,409 (6.7%) |
| 65 to 74 Years | 41,889 (11.0%) | 2,136 (5.1%) |
| 75 Years and over | 9,579 (2.8%) | 249 (2.6%) |
| Total | 1,250,873 (44.9%) | 166,366 (13.3%) |
Employment Status by Educational Attainment in Puerto Rico
According to labor force statistics for Puerto Rico, 62.9% of individuals (1,055,122) out of the total population between 25 and 64 years of age (1,677,459) are in the labor force, with 11.4% or 120,284 of them being unemployed. The group with the highest labor force participation rate are those with the educational attainment of bachelor's degree or higher, with 77.5% or 418,798 individuals in the labor force. Within the labor force, individuals with less than high school education have the highest percentage of unemployment, with 23.7% or 17,738 of them being unemployed.
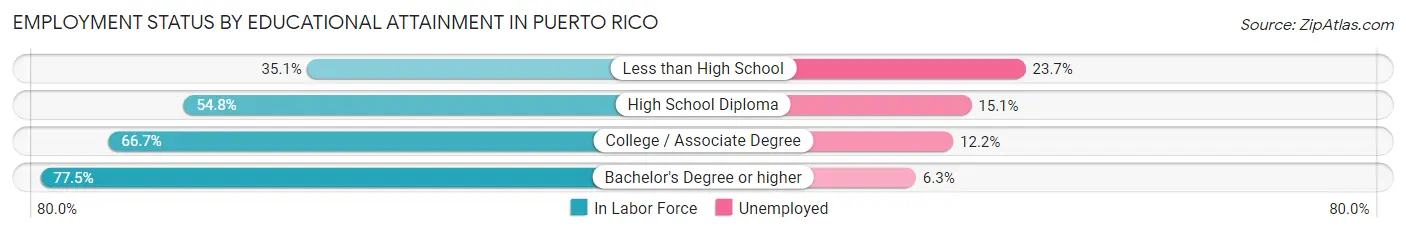
| Educational Attainment | In Labor Force | Unemployed |
| Less than High School | 74,842 (35.1%) | 50,534 (23.7%) |
| High School Diploma | 255,066 (54.8%) | 70,283 (15.1%) |
| College / Associate Degree | 305,753 (66.7%) | 55,925 (12.2%) |
| Bachelor's Degree or higher | 418,798 (77.5%) | 34,044 (6.3%) |
| Total | 1,055,122 (62.9%) | 191,230 (11.4%) |
Employment Occupations by Sex in Puerto Rico
Management, Business, Science and Arts Occupations
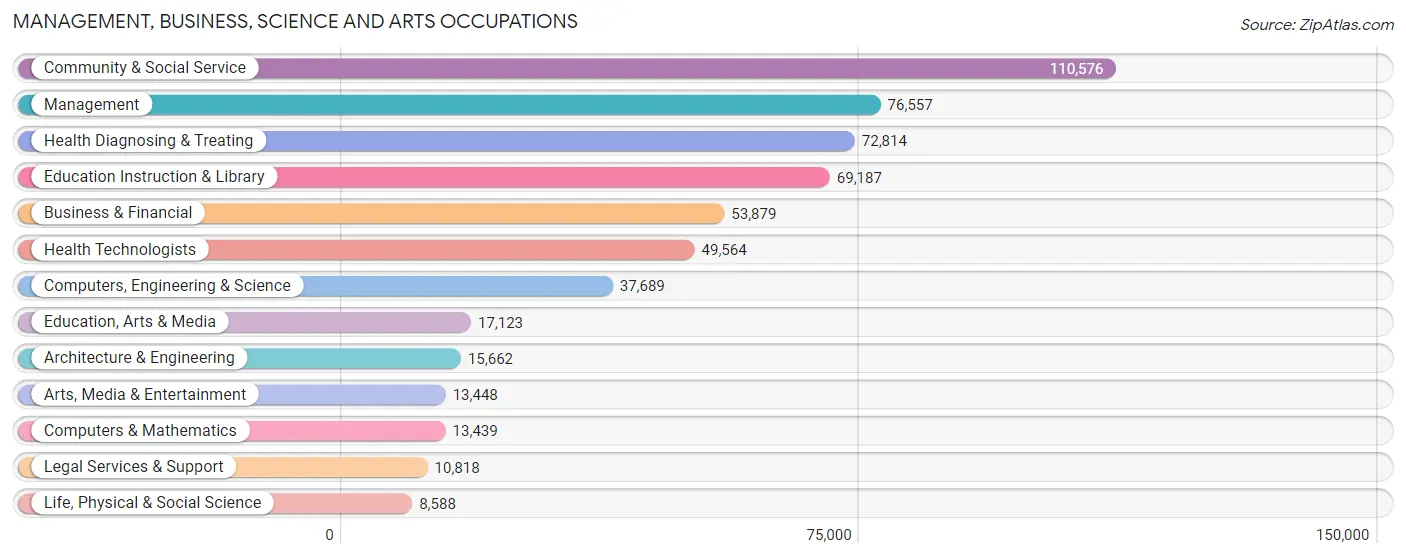
The most common Management, Business, Science and Arts occupations in Puerto Rico are Community & Social Service (110,576 | 10.2%), Management (76,557 | 7.1%), Health Diagnosing & Treating (72,814 | 6.7%), Education Instruction & Library (69,187 | 6.4%), and Business & Financial (53,879 | 5.0%).
Management, Business, Science and Arts Occupations by Sex
Within the Management, Business, Science and Arts occupations in Puerto Rico, the most male-oriented occupations are Architecture & Engineering (80.0%), Computers & Mathematics (73.2%), and Computers, Engineering & Science (67.8%), while the most female-oriented occupations are Education Instruction & Library (76.0%), Health Technologists (71.5%), and Health Diagnosing & Treating (70.6%).
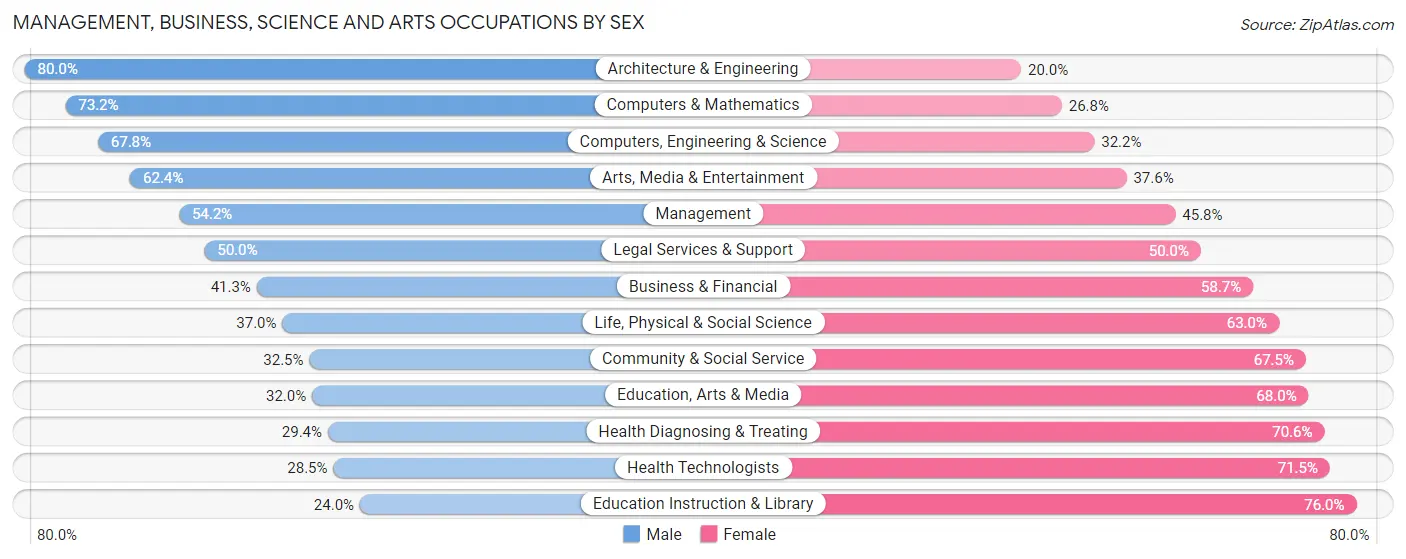
| Occupation | Male | Female |
| Management | 41,524 (54.2%) | 35,033 (45.8%) |
| Business & Financial | 22,236 (41.3%) | 31,643 (58.7%) |
| Computers, Engineering & Science | 25,542 (67.8%) | 12,147 (32.2%) |
| Computers & Mathematics | 9,836 (73.2%) | 3,603 (26.8%) |
| Architecture & Engineering | 12,530 (80.0%) | 3,132 (20.0%) |
| Life, Physical & Social Science | 3,176 (37.0%) | 5,412 (63.0%) |
| Community & Social Service | 35,918 (32.5%) | 74,658 (67.5%) |
| Education, Arts & Media | 5,484 (32.0%) | 11,639 (68.0%) |
| Legal Services & Support | 5,409 (50.0%) | 5,409 (50.0%) |
| Education Instruction & Library | 16,634 (24.0%) | 52,553 (76.0%) |
| Arts, Media & Entertainment | 8,391 (62.4%) | 5,057 (37.6%) |
| Health Diagnosing & Treating | 21,403 (29.4%) | 51,411 (70.6%) |
| Health Technologists | 14,109 (28.5%) | 35,455 (71.5%) |
| Total (Category) | 146,623 (41.7%) | 204,892 (58.3%) |
| Total (Overall) | 564,978 (52.2%) | 516,352 (47.7%) |
Services Occupations
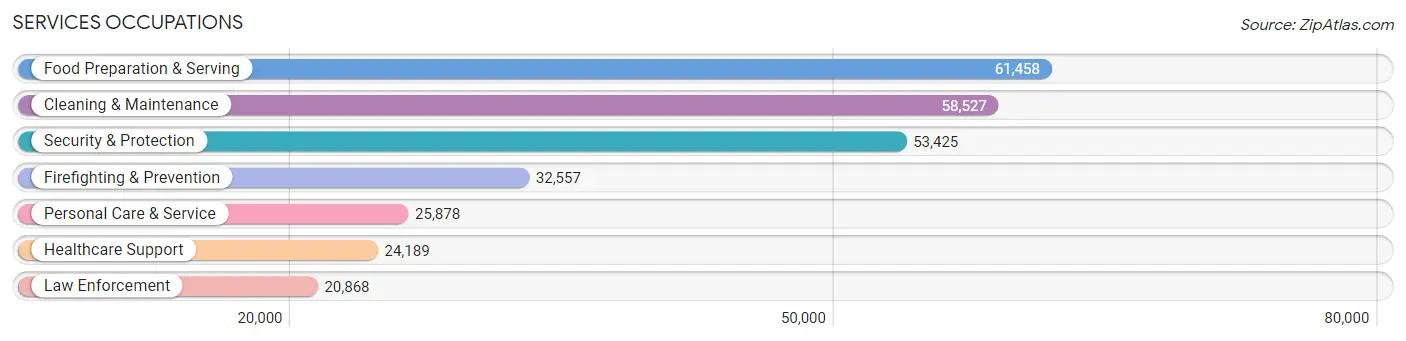
The most common Services occupations in Puerto Rico are Food Preparation & Serving (61,458 | 5.7%), Cleaning & Maintenance (58,527 | 5.4%), Security & Protection (53,425 | 4.9%), Firefighting & Prevention (32,557 | 3.0%), and Personal Care & Service (25,878 | 2.4%).
Services Occupations by Sex
Within the Services occupations in Puerto Rico, the most male-oriented occupations are Law Enforcement (78.9%), Security & Protection (77.2%), and Firefighting & Prevention (76.1%), while the most female-oriented occupations are Healthcare Support (85.1%), Personal Care & Service (54.6%), and Food Preparation & Serving (50.4%).
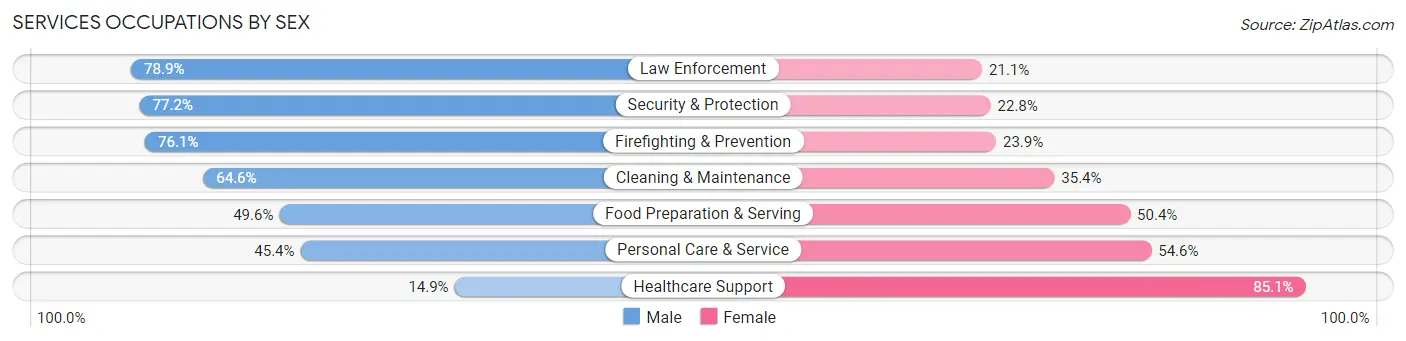
| Occupation | Male | Female |
| Healthcare Support | 3,600 (14.9%) | 20,589 (85.1%) |
| Security & Protection | 41,248 (77.2%) | 12,177 (22.8%) |
| Firefighting & Prevention | 24,785 (76.1%) | 7,772 (23.9%) |
| Law Enforcement | 16,463 (78.9%) | 4,405 (21.1%) |
| Food Preparation & Serving | 30,473 (49.6%) | 30,985 (50.4%) |
| Cleaning & Maintenance | 37,804 (64.6%) | 20,723 (35.4%) |
| Personal Care & Service | 11,746 (45.4%) | 14,132 (54.6%) |
| Total (Category) | 124,871 (55.9%) | 98,606 (44.1%) |
| Total (Overall) | 564,978 (52.2%) | 516,352 (47.7%) |
Sales and Office Occupations
The most common Sales and Office occupations in Puerto Rico are Office & Administration (150,189 | 13.9%), and Sales & Related (125,091 | 11.6%).

Sales and Office Occupations by Sex
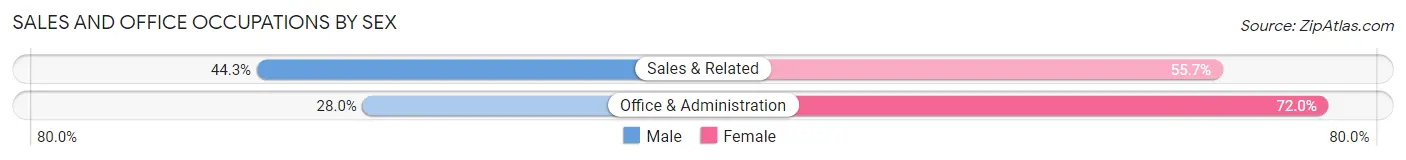
| Occupation | Male | Female |
| Sales & Related | 55,365 (44.3%) | 69,726 (55.7%) |
| Office & Administration | 42,041 (28.0%) | 108,148 (72.0%) |
| Total (Category) | 97,406 (35.4%) | 177,874 (64.6%) |
| Total (Overall) | 564,978 (52.2%) | 516,352 (47.7%) |
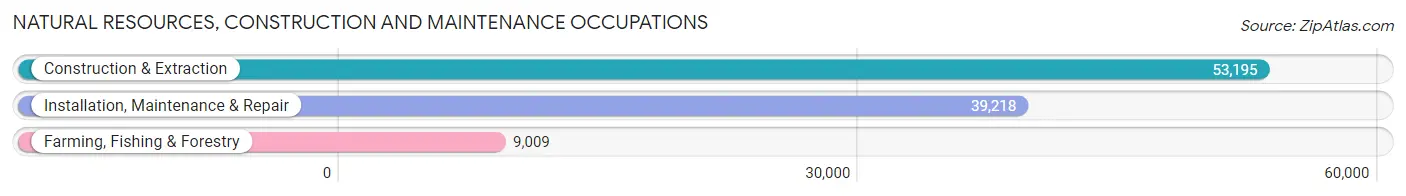
Natural Resources, Construction and Maintenance Occupations
The most common Natural Resources, Construction and Maintenance occupations in Puerto Rico are Construction & Extraction (53,195 | 4.9%), Installation, Maintenance & Repair (39,218 | 3.6%), and Farming, Fishing & Forestry (9,009 | 0.8%).
Natural Resources, Construction and Maintenance Occupations by Sex
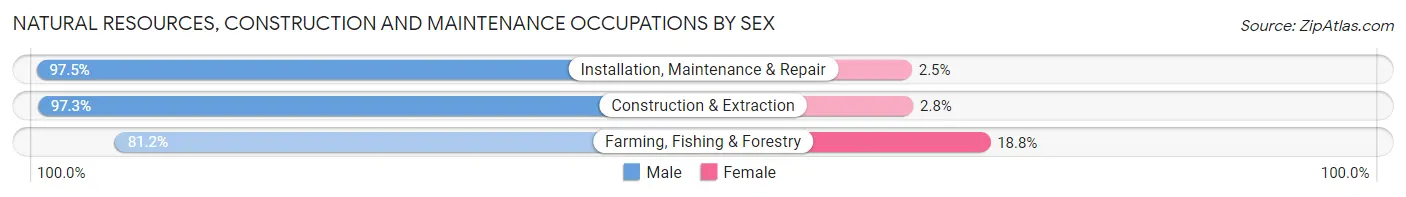
| Occupation | Male | Female |
| Farming, Fishing & Forestry | 7,317 (81.2%) | 1,692 (18.8%) |
| Construction & Extraction | 51,734 (97.3%) | 1,461 (2.8%) |
| Installation, Maintenance & Repair | 38,249 (97.5%) | 969 (2.5%) |
| Total (Category) | 97,300 (95.9%) | 4,122 (4.1%) |
| Total (Overall) | 564,978 (52.2%) | 516,352 (47.7%) |
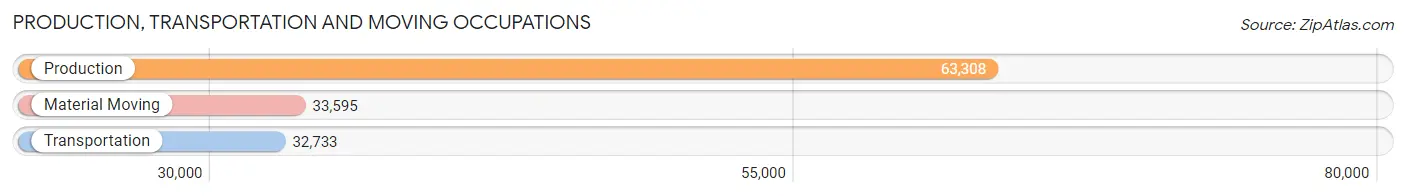
Production, Transportation and Moving Occupations
The most common Production, Transportation and Moving occupations in Puerto Rico are Production (63,308 | 5.9%), Material Moving (33,595 | 3.1%), and Transportation (32,733 | 3.0%).
Production, Transportation and Moving Occupations by Sex
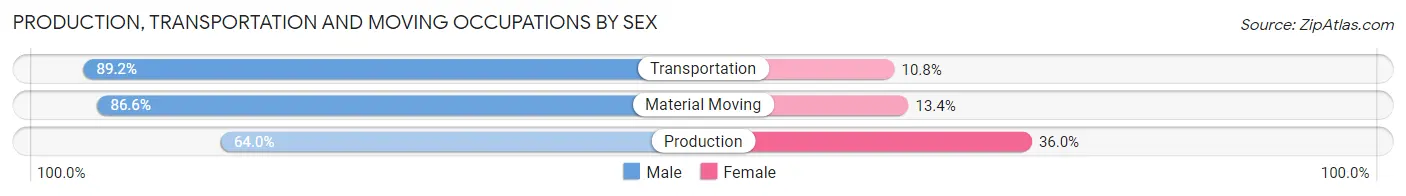
| Occupation | Male | Female |
| Production | 40,492 (64.0%) | 22,816 (36.0%) |
| Transportation | 29,188 (89.2%) | 3,545 (10.8%) |
| Material Moving | 29,098 (86.6%) | 4,497 (13.4%) |
| Total (Category) | 98,778 (76.2%) | 30,858 (23.8%) |
| Total (Overall) | 564,978 (52.2%) | 516,352 (47.7%) |
Employment Industries by Sex in Puerto Rico
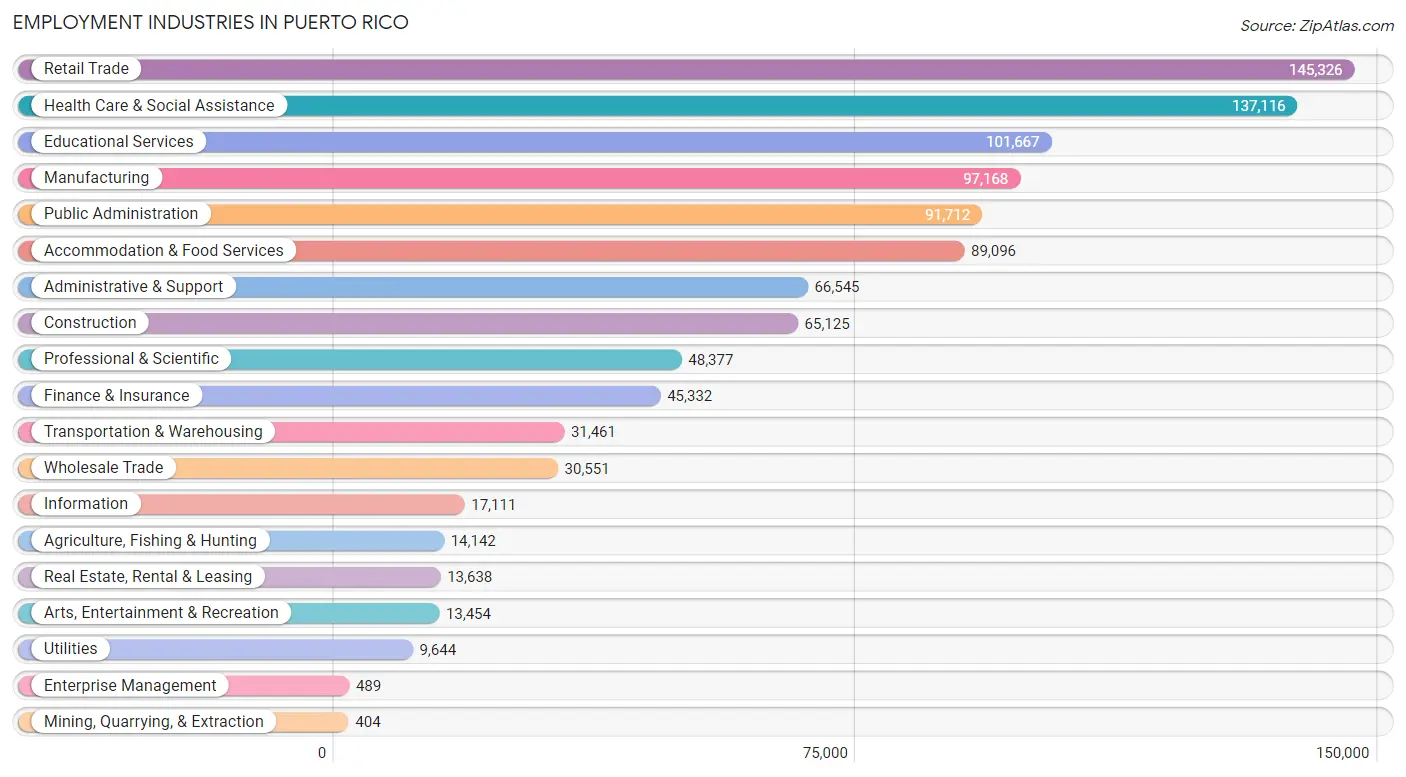
Employment Industries in Puerto Rico
The major employment industries in Puerto Rico include Retail Trade (145,326 | 13.4%), Health Care & Social Assistance (137,116 | 12.7%), Educational Services (101,667 | 9.4%), Manufacturing (97,168 | 9.0%), and Public Administration (91,712 | 8.5%).
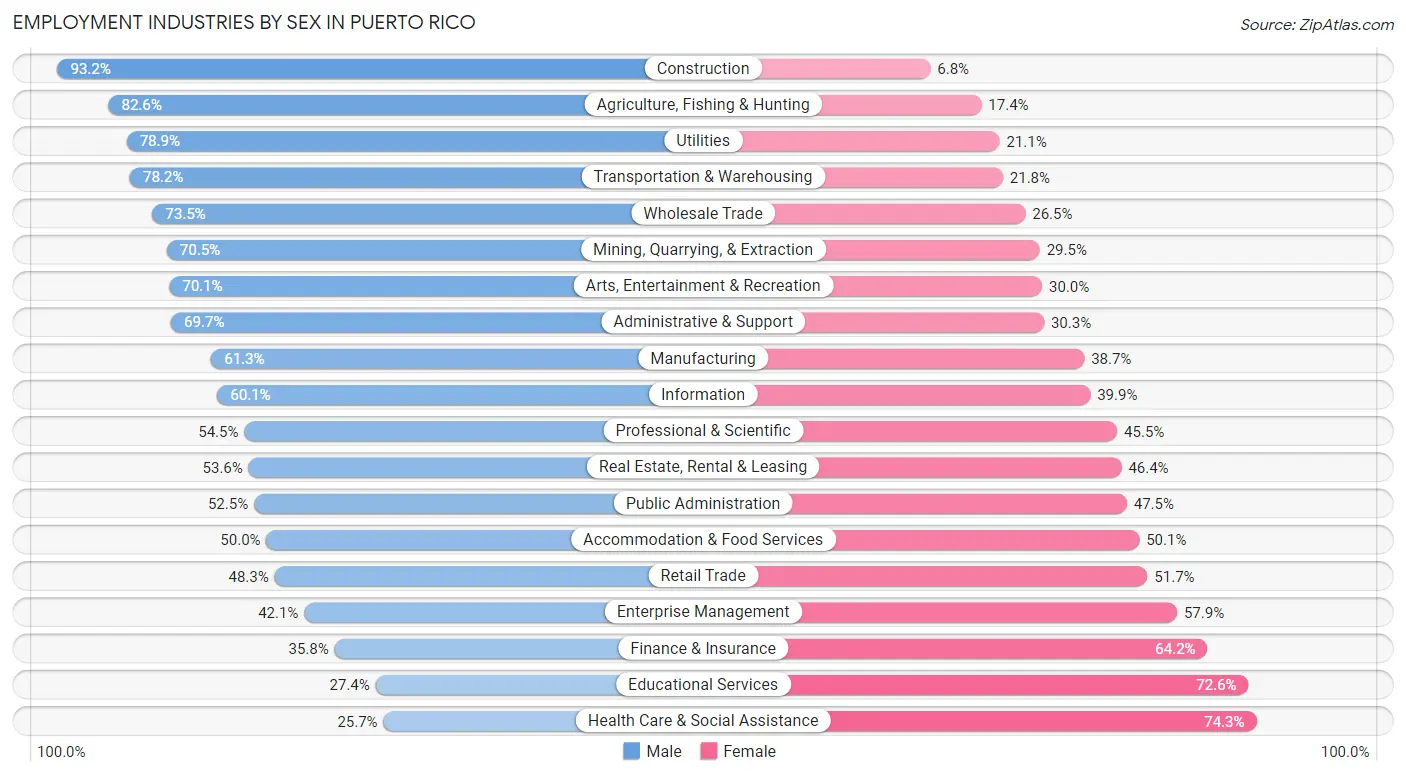
Employment Industries by Sex in Puerto Rico
The Puerto Rico industries that see more men than women are Construction (93.2%), Agriculture, Fishing & Hunting (82.6%), and Utilities (78.9%), whereas the industries that tend to have a higher number of women are Health Care & Social Assistance (74.3%), Educational Services (72.6%), and Finance & Insurance (64.2%).
| Industry | Male | Female |
| Agriculture, Fishing & Hunting | 11,684 (82.6%) | 2,458 (17.4%) |
| Mining, Quarrying, & Extraction | 285 (70.5%) | 119 (29.5%) |
| Construction | 60,688 (93.2%) | 4,437 (6.8%) |
| Manufacturing | 59,606 (61.3%) | 37,562 (38.7%) |
| Wholesale Trade | 22,467 (73.5%) | 8,084 (26.5%) |
| Retail Trade | 70,140 (48.3%) | 75,186 (51.7%) |
| Transportation & Warehousing | 24,594 (78.2%) | 6,867 (21.8%) |
| Utilities | 7,605 (78.9%) | 2,039 (21.1%) |
| Information | 10,282 (60.1%) | 6,829 (39.9%) |
| Finance & Insurance | 16,248 (35.8%) | 29,084 (64.2%) |
| Real Estate, Rental & Leasing | 7,314 (53.6%) | 6,324 (46.4%) |
| Professional & Scientific | 26,374 (54.5%) | 22,003 (45.5%) |
| Enterprise Management | 206 (42.1%) | 283 (57.9%) |
| Administrative & Support | 46,355 (69.7%) | 20,190 (30.3%) |
| Educational Services | 27,820 (27.4%) | 73,847 (72.6%) |
| Health Care & Social Assistance | 35,272 (25.7%) | 101,844 (74.3%) |
| Arts, Entertainment & Recreation | 9,425 (70.1%) | 4,029 (29.9%) |
| Accommodation & Food Services | 44,503 (49.9%) | 44,593 (50.0%) |
| Public Administration | 48,166 (52.5%) | 43,546 (47.5%) |
| Total | 564,978 (52.2%) | 516,352 (47.7%) |
Education in Puerto Rico
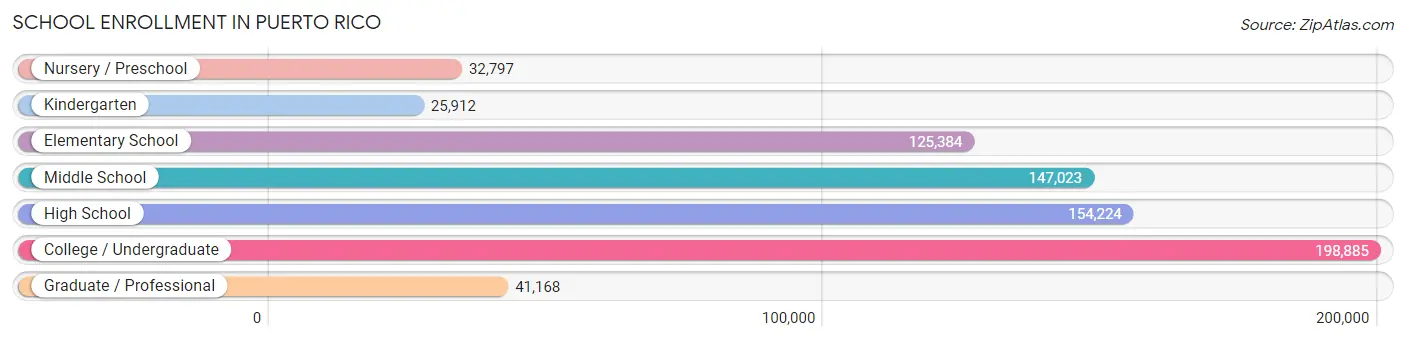
School Enrollment in Puerto Rico
The most common levels of schooling among the 725,393 students in Puerto Rico are college / undergraduate (198,885 | 27.4%), high school (154,224 | 21.3%), and middle school (147,023 | 20.3%).
| School Level | # Students | % Students |
| Nursery / Preschool | 32,797 | 4.5% |
| Kindergarten | 25,912 | 3.6% |
| Elementary School | 125,384 | 17.3% |
| Middle School | 147,023 | 20.3% |
| High School | 154,224 | 21.3% |
| College / Undergraduate | 198,885 | 27.4% |
| Graduate / Professional | 41,168 | 5.7% |
| Total | 725,393 | 100.0% |
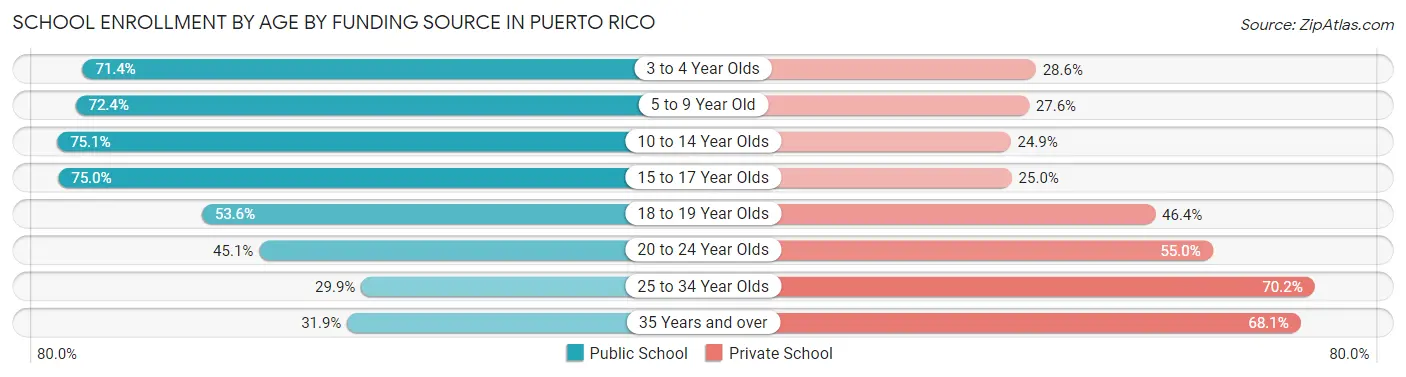
School Enrollment by Age by Funding Source in Puerto Rico
Out of a total of 725,393 students who are enrolled in schools in Puerto Rico, 269,121 (37.1%) attend a private institution, while the remaining 456,272 (62.9%) are enrolled in public schools. The age group of 25 to 34 year olds has the highest likelihood of being enrolled in private schools, with 35,014 (70.2% in the age bracket) enrolled. Conversely, the age group of 10 to 14 year olds has the lowest likelihood of being enrolled in a private school, with 136,593 (75.1% in the age bracket) attending a public institution.
| Age Bracket | Public School | Private School |
| 3 to 4 Year Olds | 21,118 (71.4%) | 8,467 (28.6%) |
| 5 to 9 Year Old | 106,141 (72.4%) | 40,468 (27.6%) |
| 10 to 14 Year Olds | 136,593 (75.1%) | 45,223 (24.9%) |
| 15 to 17 Year Olds | 84,367 (75.0%) | 28,166 (25.0%) |
| 18 to 19 Year Olds | 34,292 (53.6%) | 29,702 (46.4%) |
| 20 to 24 Year Olds | 48,679 (45.1%) | 59,384 (54.9%) |
| 25 to 34 Year Olds | 14,901 (29.8%) | 35,014 (70.2%) |
| 35 Years and over | 10,498 (31.9%) | 22,380 (68.1%) |
| Total | 456,272 (62.9%) | 269,121 (37.1%) |
Educational Attainment by Field of Study in Puerto Rico
Business (198,356 | 28.5%), education (122,480 | 17.6%), science & technology (86,488 | 12.4%), arts & humanities (47,956 | 6.9%), and bio, nature & agricultural (41,229 | 5.9%) are the most common fields of study among 696,038 individuals in Puerto Rico who have obtained a bachelor's degree or higher.
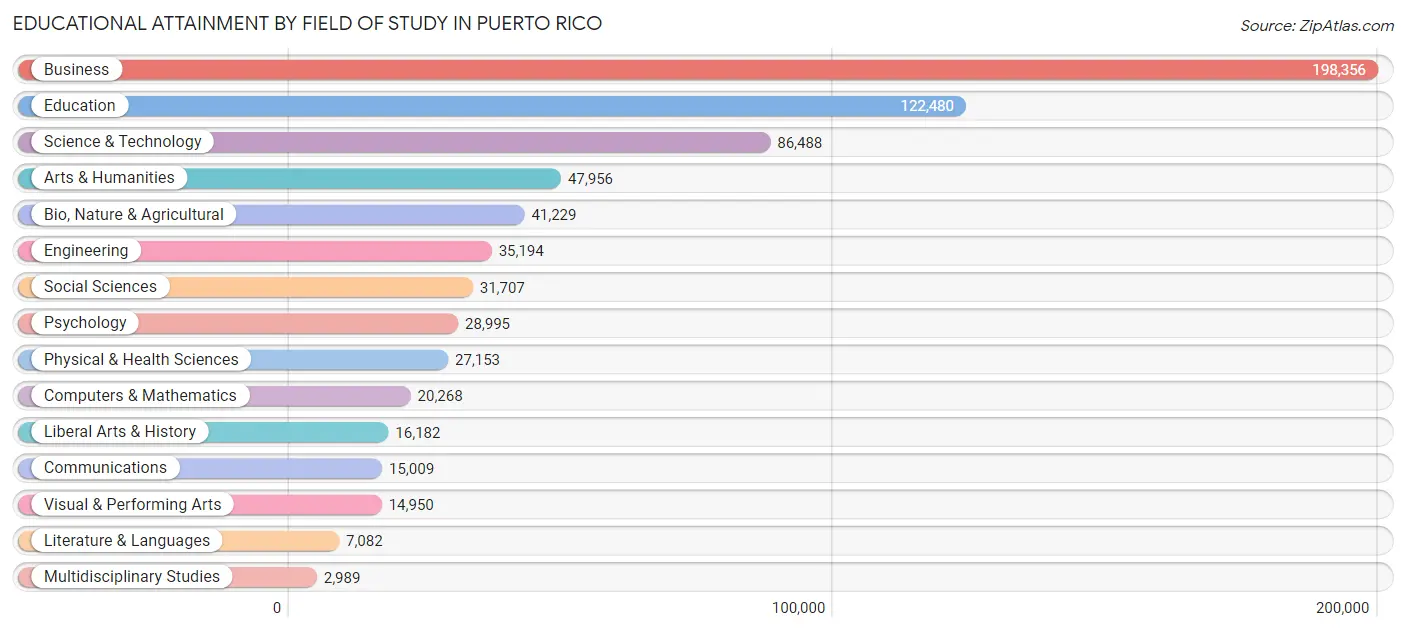
| Field of Study | # Graduates | % Graduates |
| Computers & Mathematics | 20,268 | 2.9% |
| Bio, Nature & Agricultural | 41,229 | 5.9% |
| Physical & Health Sciences | 27,153 | 3.9% |
| Psychology | 28,995 | 4.2% |
| Social Sciences | 31,707 | 4.6% |
| Engineering | 35,194 | 5.1% |
| Multidisciplinary Studies | 2,989 | 0.4% |
| Science & Technology | 86,488 | 12.4% |
| Business | 198,356 | 28.5% |
| Education | 122,480 | 17.6% |
| Literature & Languages | 7,082 | 1.0% |
| Liberal Arts & History | 16,182 | 2.3% |
| Visual & Performing Arts | 14,950 | 2.1% |
| Communications | 15,009 | 2.2% |
| Arts & Humanities | 47,956 | 6.9% |
| Total | 696,038 | 100.0% |
Transportation & Commute in Puerto Rico
Vehicle Availability by Sex in Puerto Rico
The most prevalent vehicle ownership categories in Puerto Rico are males with 2 vehicles (232,275, accounting for 42.2%) and females with 2 vehicles (195,333, making up 46.6%).
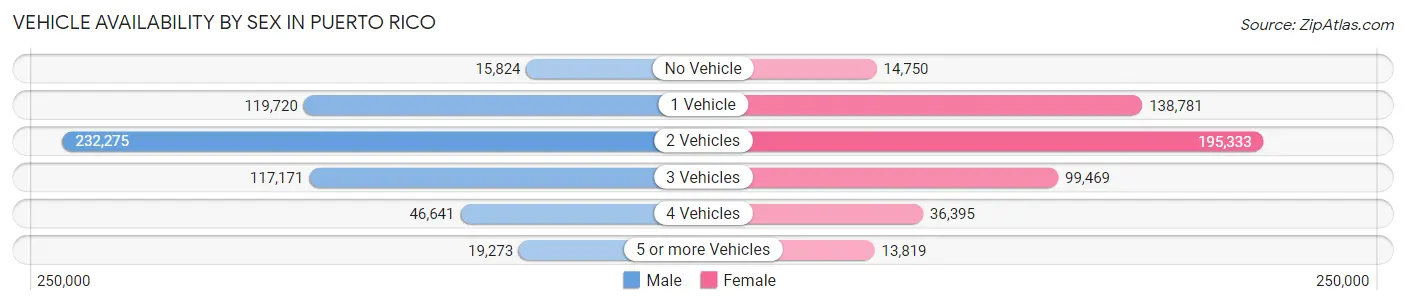
| Vehicles Available | Male | Female |
| No Vehicle | 15,824 (2.9%) | 14,750 (3.0%) |
| 1 Vehicle | 119,720 (21.7%) | 138,781 (27.8%) |
| 2 Vehicles | 232,275 (42.2%) | 195,333 (39.2%) |
| 3 Vehicles | 117,171 (21.3%) | 99,469 (20.0%) |
| 4 Vehicles | 46,641 (8.5%) | 36,395 (7.3%) |
| 5 or more Vehicles | 19,273 (3.5%) | 13,819 (2.8%) |
| Total | 550,904 (100.0%) | 498,547 (100.0%) |
Commute Time in Puerto Rico
The most frequently occuring commute durations in Puerto Rico are 30 to 34 minutes (161,263 commuters, 16.1%), 20 to 24 minutes (156,063 commuters, 15.6%), and 15 to 19 minutes (154,375 commuters, 15.4%).
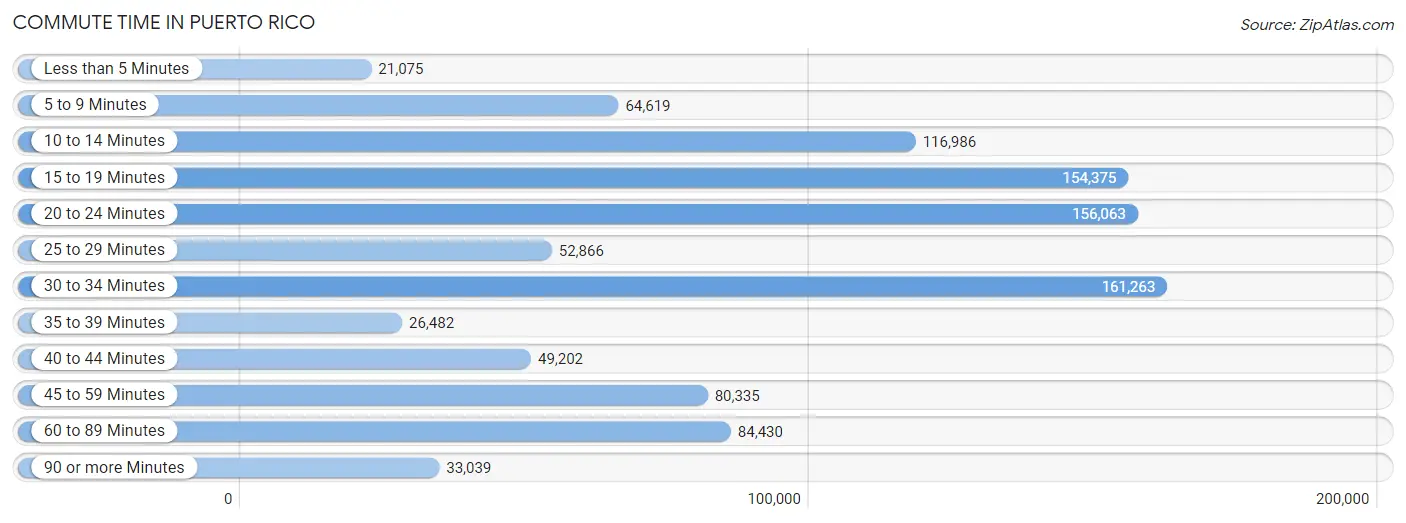
| Commute Time | # Commuters | % Commuters |
| Less than 5 Minutes | 21,075 | 2.1% |
| 5 to 9 Minutes | 64,619 | 6.5% |
| 10 to 14 Minutes | 116,986 | 11.7% |
| 15 to 19 Minutes | 154,375 | 15.4% |
| 20 to 24 Minutes | 156,063 | 15.6% |
| 25 to 29 Minutes | 52,866 | 5.3% |
| 30 to 34 Minutes | 161,263 | 16.1% |
| 35 to 39 Minutes | 26,482 | 2.6% |
| 40 to 44 Minutes | 49,202 | 4.9% |
| 45 to 59 Minutes | 80,335 | 8.0% |
| 60 to 89 Minutes | 84,430 | 8.4% |
| 90 or more Minutes | 33,039 | 3.3% |
Commute Time by Sex in Puerto Rico
The most common commute times in Puerto Rico are 30 to 34 minutes (85,745 commuters, 16.3%) for males and 20 to 24 minutes (77,065 commuters, 16.3%) for females.
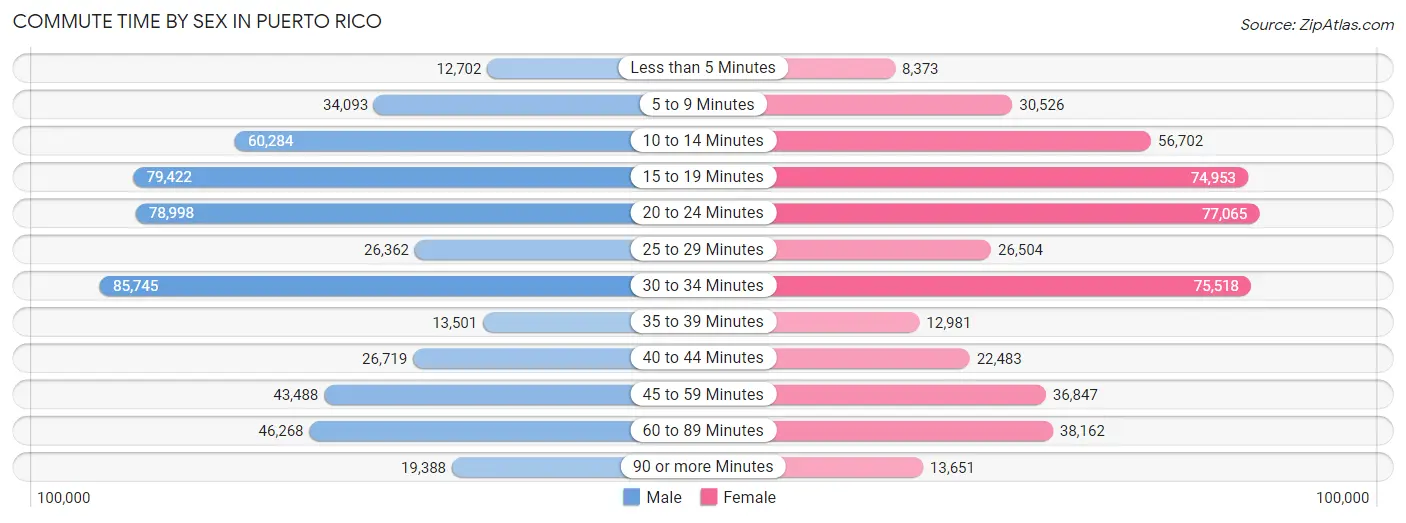
| Commute Time | Male | Female |
| Less than 5 Minutes | 12,702 (2.4%) | 8,373 (1.8%) |
| 5 to 9 Minutes | 34,093 (6.5%) | 30,526 (6.4%) |
| 10 to 14 Minutes | 60,284 (11.4%) | 56,702 (12.0%) |
| 15 to 19 Minutes | 79,422 (15.1%) | 74,953 (15.8%) |
| 20 to 24 Minutes | 78,998 (15.0%) | 77,065 (16.3%) |
| 25 to 29 Minutes | 26,362 (5.0%) | 26,504 (5.6%) |
| 30 to 34 Minutes | 85,745 (16.3%) | 75,518 (15.9%) |
| 35 to 39 Minutes | 13,501 (2.6%) | 12,981 (2.7%) |
| 40 to 44 Minutes | 26,719 (5.1%) | 22,483 (4.8%) |
| 45 to 59 Minutes | 43,488 (8.3%) | 36,847 (7.8%) |
| 60 to 89 Minutes | 46,268 (8.8%) | 38,162 (8.1%) |
| 90 or more Minutes | 19,388 (3.7%) | 13,651 (2.9%) |
Time of Departure to Work by Sex in Puerto Rico
The most frequent times of departure to work in Puerto Rico are 7:00 AM to 7:29 AM (85,801, 16.3%) for males and 7:00 AM to 7:29 AM (98,946, 20.9%) for females.
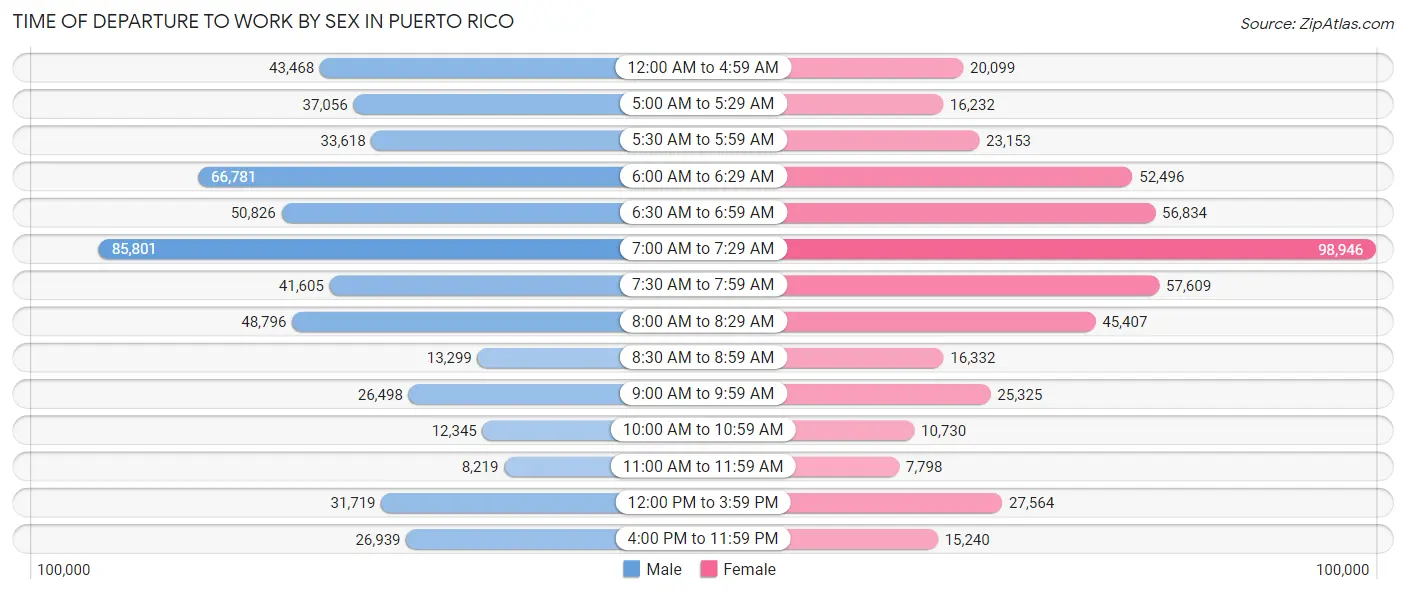
| Time of Departure | Male | Female |
| 12:00 AM to 4:59 AM | 43,468 (8.3%) | 20,099 (4.2%) |
| 5:00 AM to 5:29 AM | 37,056 (7.0%) | 16,232 (3.4%) |
| 5:30 AM to 5:59 AM | 33,618 (6.4%) | 23,153 (4.9%) |
| 6:00 AM to 6:29 AM | 66,781 (12.7%) | 52,496 (11.1%) |
| 6:30 AM to 6:59 AM | 50,826 (9.6%) | 56,834 (12.0%) |
| 7:00 AM to 7:29 AM | 85,801 (16.3%) | 98,946 (20.9%) |
| 7:30 AM to 7:59 AM | 41,605 (7.9%) | 57,609 (12.2%) |
| 8:00 AM to 8:29 AM | 48,796 (9.3%) | 45,407 (9.6%) |
| 8:30 AM to 8:59 AM | 13,299 (2.5%) | 16,332 (3.5%) |
| 9:00 AM to 9:59 AM | 26,498 (5.0%) | 25,325 (5.3%) |
| 10:00 AM to 10:59 AM | 12,345 (2.3%) | 10,730 (2.3%) |
| 11:00 AM to 11:59 AM | 8,219 (1.6%) | 7,798 (1.7%) |
| 12:00 PM to 3:59 PM | 31,719 (6.0%) | 27,564 (5.8%) |
| 4:00 PM to 11:59 PM | 26,939 (5.1%) | 15,240 (3.2%) |
| Total | 526,970 (100.0%) | 473,765 (100.0%) |
Housing Occupancy in Puerto Rico
Occupancy by Ownership in Puerto Rico
Of the total 1,219,658 dwellings in Puerto Rico, owner-occupied units account for 829,943 (68.0%), while renter-occupied units make up 389,715 (32.0%).
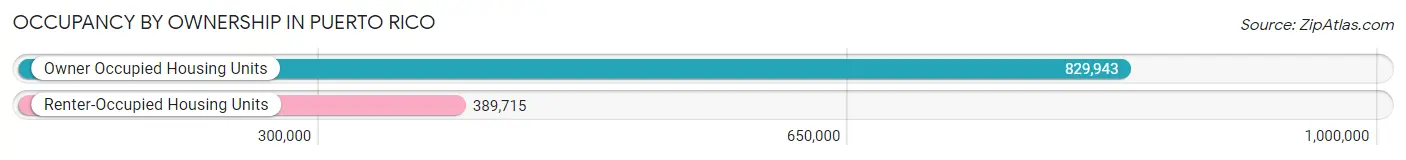
| Occupancy | # Housing Units | % Housing Units |
| Owner Occupied Housing Units | 829,943 | 68.0% |
| Renter-Occupied Housing Units | 389,715 | 32.0% |
| Total Occupied Housing Units | 1,219,658 | 100.0% |
Occupancy by Household Size in Puerto Rico
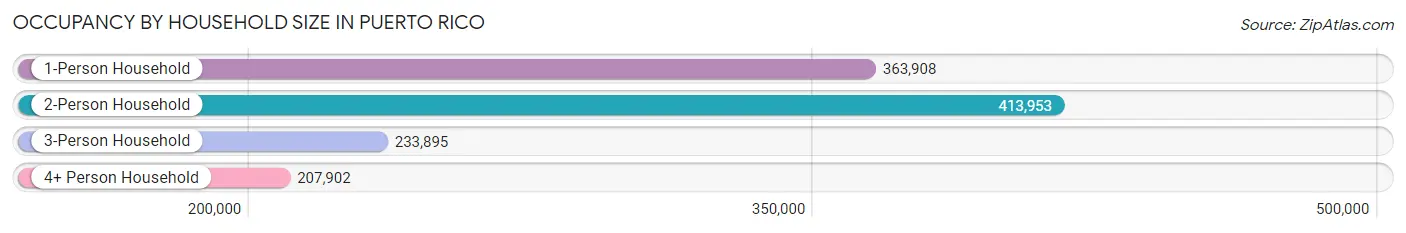
| Household Size | # Housing Units | % Housing Units |
| 1-Person Household | 363,908 | 29.8% |
| 2-Person Household | 413,953 | 33.9% |
| 3-Person Household | 233,895 | 19.2% |
| 4+ Person Household | 207,902 | 17.1% |
| Total Housing Units | 1,219,658 | 100.0% |
Occupancy by Ownership by Household Size in Puerto Rico
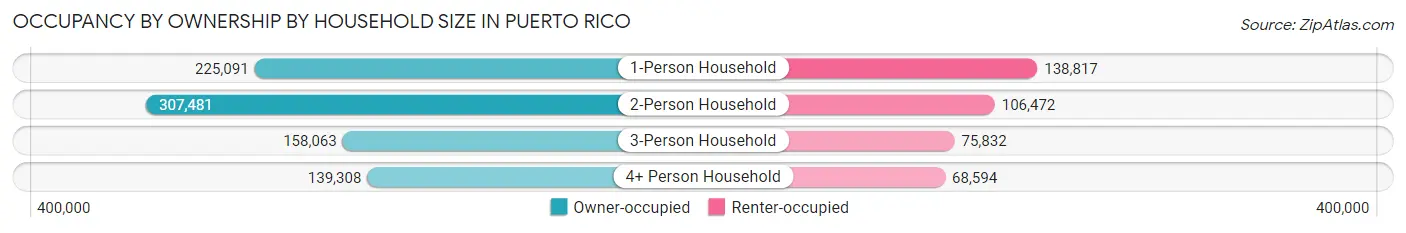
| Household Size | Owner-occupied | Renter-occupied |
| 1-Person Household | 225,091 (61.9%) | 138,817 (38.2%) |
| 2-Person Household | 307,481 (74.3%) | 106,472 (25.7%) |
| 3-Person Household | 158,063 (67.6%) | 75,832 (32.4%) |
| 4+ Person Household | 139,308 (67.0%) | 68,594 (33.0%) |
| Total Housing Units | 829,943 (68.0%) | 389,715 (32.0%) |
Occupancy by Educational Attainment in Puerto Rico
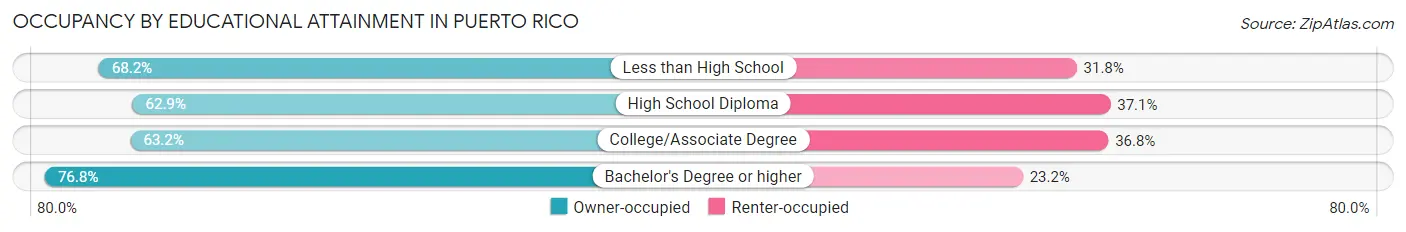
| Household Size | Owner-occupied | Renter-occupied |
| Less than High School | 175,758 (68.2%) | 81,931 (31.8%) |
| High School Diploma | 206,637 (62.9%) | 122,067 (37.1%) |
| College/Associate Degree | 179,566 (63.2%) | 104,562 (36.8%) |
| Bachelor's Degree or higher | 267,982 (76.8%) | 81,155 (23.2%) |
Occupancy by Age of Householder in Puerto Rico
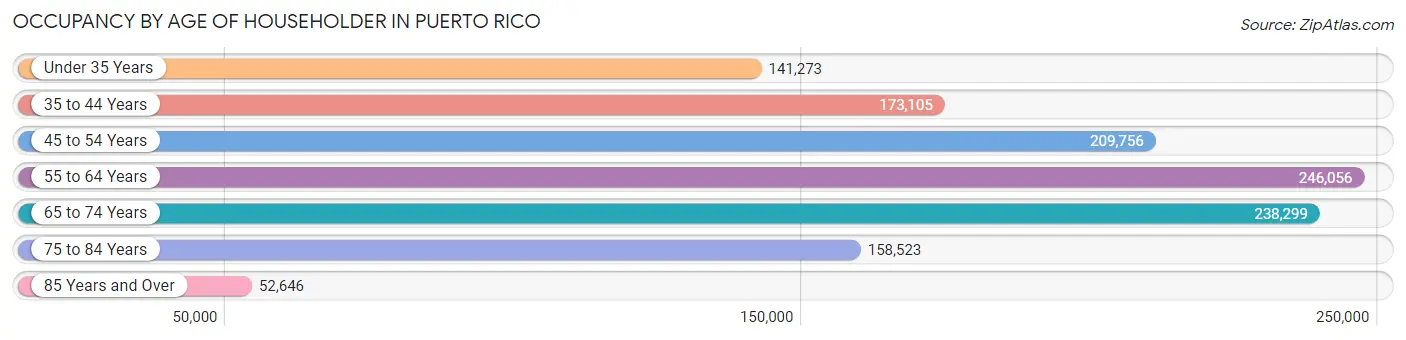
| Age Bracket | # Households | % Households |
| Under 35 Years | 141,273 | 11.6% |
| 35 to 44 Years | 173,105 | 14.2% |
| 45 to 54 Years | 209,756 | 17.2% |
| 55 to 64 Years | 246,056 | 20.2% |
| 65 to 74 Years | 238,299 | 19.5% |
| 75 to 84 Years | 158,523 | 13.0% |
| 85 Years and Over | 52,646 | 4.3% |
| Total | 1,219,658 | 100.0% |
Housing Finances in Puerto Rico
Median Income by Occupancy in Puerto Rico
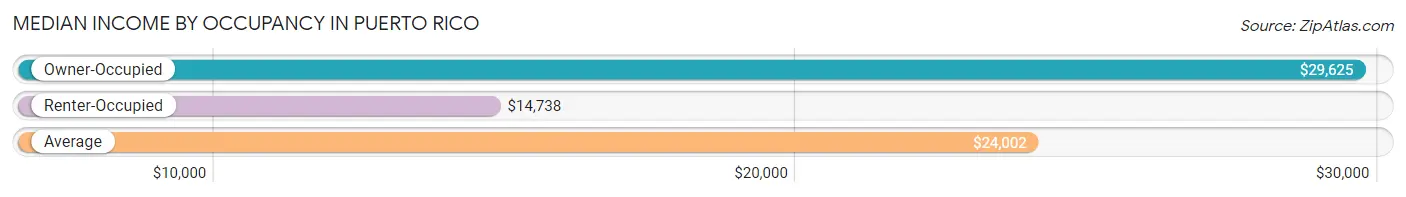
| Occupancy Type | # Households | Median Income |
| Owner-Occupied | 829,943 (68.0%) | $29,625 |
| Renter-Occupied | 389,715 (32.0%) | $14,738 |
| Average | 1,219,658 (100.0%) | $24,002 |
Occupancy by Householder Income Bracket in Puerto Rico
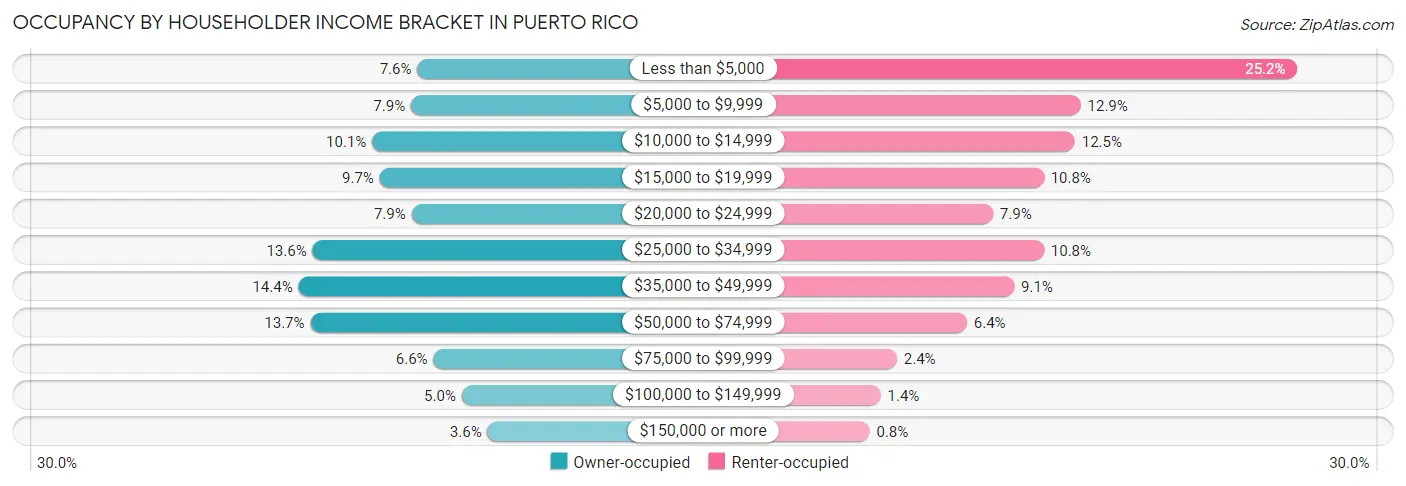
| Income Bracket | Owner-occupied | Renter-occupied |
| Less than $5,000 | 62,731 (7.6%) | 98,366 (25.2%) |
| $5,000 to $9,999 | 65,722 (7.9%) | 50,132 (12.9%) |
| $10,000 to $14,999 | 84,141 (10.1%) | 48,813 (12.5%) |
| $15,000 to $19,999 | 80,569 (9.7%) | 41,875 (10.7%) |
| $20,000 to $24,999 | 65,507 (7.9%) | 30,583 (7.9%) |
| $25,000 to $34,999 | 112,419 (13.6%) | 41,945 (10.8%) |
| $35,000 to $49,999 | 119,134 (14.3%) | 35,314 (9.1%) |
| $50,000 to $74,999 | 113,464 (13.7%) | 24,790 (6.4%) |
| $75,000 to $99,999 | 55,109 (6.6%) | 9,200 (2.4%) |
| $100,000 to $149,999 | 41,648 (5.0%) | 5,582 (1.4%) |
| $150,000 or more | 29,499 (3.5%) | 3,115 (0.8%) |
| Total | 829,943 (100.0%) | 389,715 (100.0%) |
Monthly Housing Cost Tiers in Puerto Rico
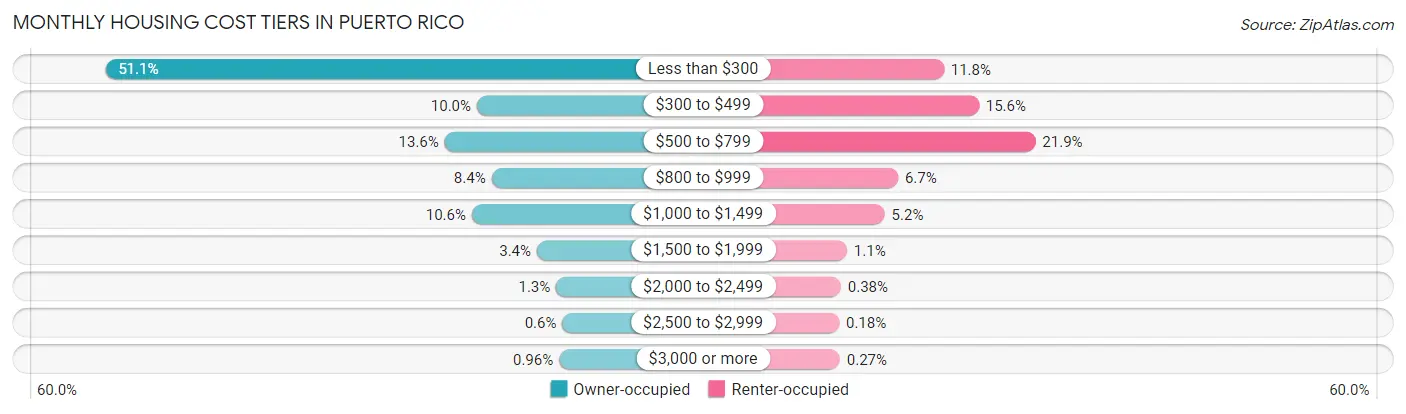
| Monthly Cost | Owner-occupied | Renter-occupied |
| Less than $300 | 424,007 (51.1%) | 45,806 (11.7%) |
| $300 to $499 | 83,331 (10.0%) | 60,879 (15.6%) |
| $500 to $799 | 112,851 (13.6%) | 85,221 (21.9%) |
| $800 to $999 | 69,902 (8.4%) | 26,089 (6.7%) |
| $1,000 to $1,499 | 88,008 (10.6%) | 20,361 (5.2%) |
| $1,500 to $1,999 | 28,301 (3.4%) | 4,109 (1.1%) |
| $2,000 to $2,499 | 10,582 (1.3%) | 1,499 (0.4%) |
| $2,500 to $2,999 | 5,011 (0.6%) | 708 (0.2%) |
| $3,000 or more | 7,950 (1.0%) | 1,053 (0.3%) |
| Total | 829,943 (100.0%) | 389,715 (100.0%) |
Physical Housing Characteristics in Puerto Rico
Housing Structures in Puerto Rico
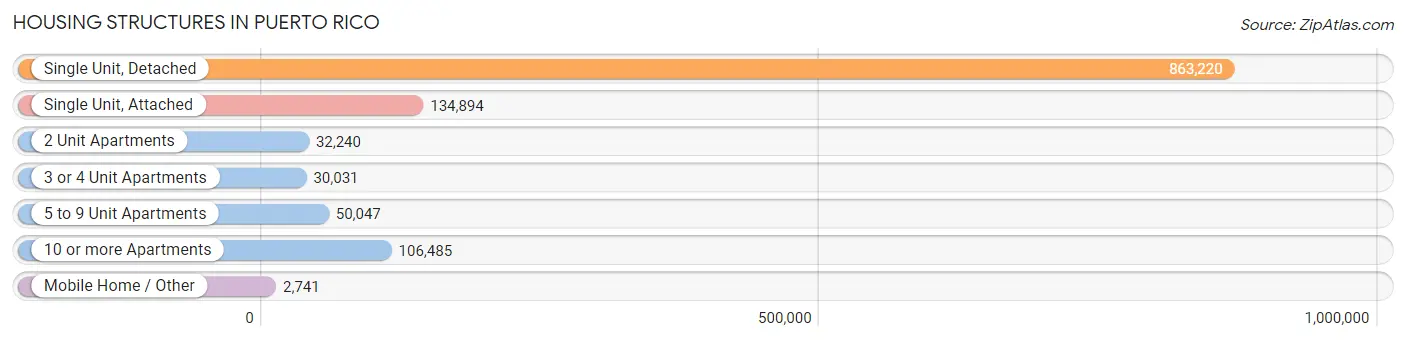
| Structure Type | # Housing Units | % Housing Units |
| Single Unit, Detached | 863,220 | 70.8% |
| Single Unit, Attached | 134,894 | 11.1% |
| 2 Unit Apartments | 32,240 | 2.6% |
| 3 or 4 Unit Apartments | 30,031 | 2.5% |
| 5 to 9 Unit Apartments | 50,047 | 4.1% |
| 10 or more Apartments | 106,485 | 8.7% |
| Mobile Home / Other | 2,741 | 0.2% |
| Total | 1,219,658 | 100.0% |
Housing Structures by Occupancy in Puerto Rico
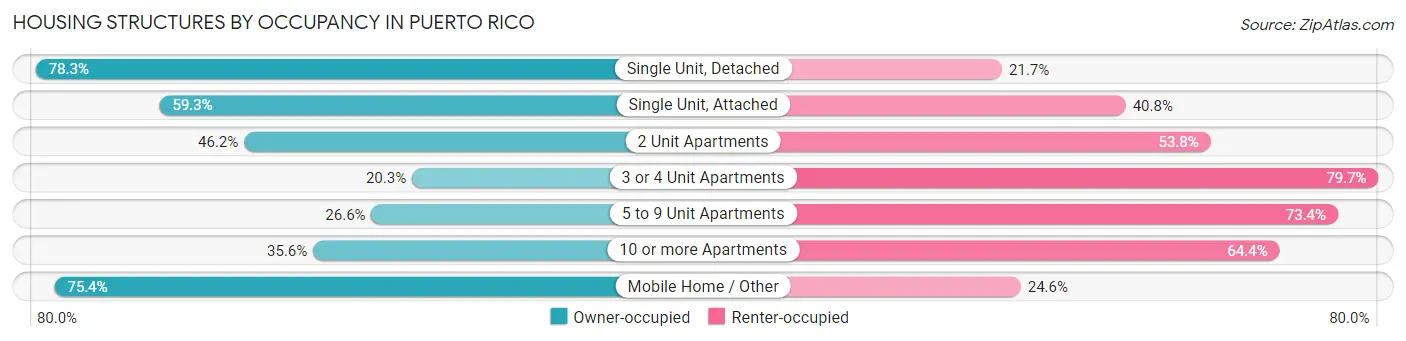
| Structure Type | Owner-occupied | Renter-occupied |
| Single Unit, Detached | 675,781 (78.3%) | 187,439 (21.7%) |
| Single Unit, Attached | 79,929 (59.3%) | 54,965 (40.7%) |
| 2 Unit Apartments | 14,892 (46.2%) | 17,348 (53.8%) |
| 3 or 4 Unit Apartments | 6,106 (20.3%) | 23,925 (79.7%) |
| 5 to 9 Unit Apartments | 13,302 (26.6%) | 36,745 (73.4%) |
| 10 or more Apartments | 37,866 (35.6%) | 68,619 (64.4%) |
| Mobile Home / Other | 2,067 (75.4%) | 674 (24.6%) |
| Total | 829,943 (68.0%) | 389,715 (32.0%) |
Housing Structures by Number of Rooms in Puerto Rico
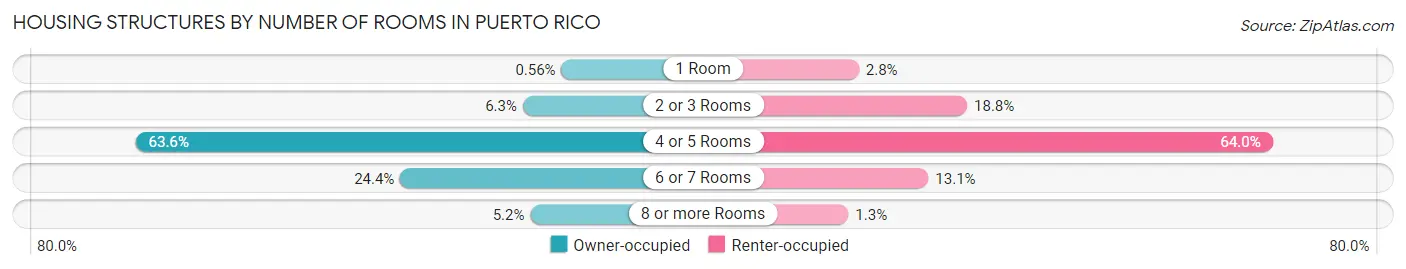
| Number of Rooms | Owner-occupied | Renter-occupied |
| 1 Room | 4,688 (0.6%) | 10,925 (2.8%) |
| 2 or 3 Rooms | 52,105 (6.3%) | 73,332 (18.8%) |
| 4 or 5 Rooms | 527,602 (63.6%) | 249,507 (64.0%) |
| 6 or 7 Rooms | 202,633 (24.4%) | 51,030 (13.1%) |
| 8 or more Rooms | 42,915 (5.2%) | 4,921 (1.3%) |
| Total | 829,943 (100.0%) | 389,715 (100.0%) |
Housing Structure by Heating Type in Puerto Rico
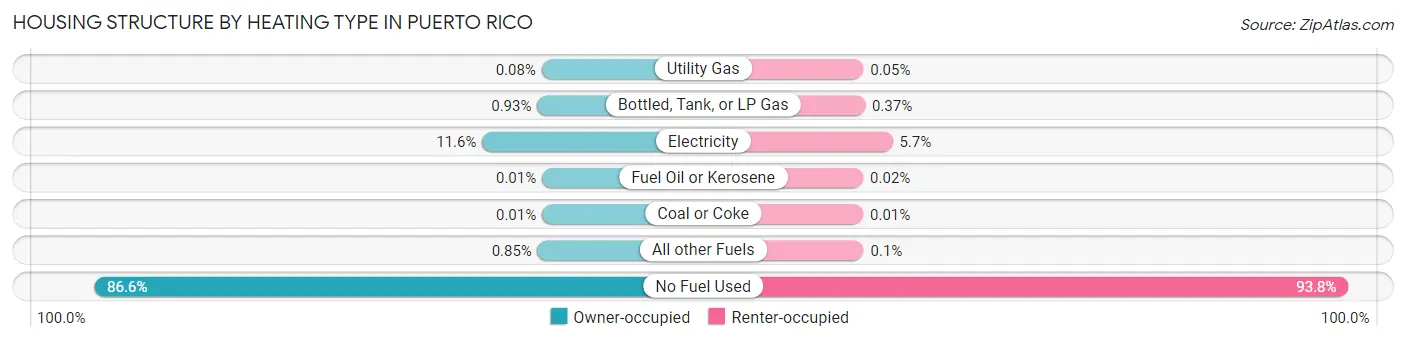
| Heating Type | Owner-occupied | Renter-occupied |
| Utility Gas | 684 (0.1%) | 191 (0.1%) |
| Bottled, Tank, or LP Gas | 7,757 (0.9%) | 1,429 (0.4%) |
| Electricity | 95,891 (11.6%) | 22,159 (5.7%) |
| Fuel Oil or Kerosene | 91 (0.0%) | 59 (0.0%) |
| Coal or Coke | 85 (0.0%) | 41 (0.0%) |
| All other Fuels | 7,074 (0.9%) | 399 (0.1%) |
| No Fuel Used | 718,361 (86.6%) | 365,437 (93.8%) |
| Total | 829,943 (100.0%) | 389,715 (100.0%) |
Household Vehicle Usage in Puerto Rico
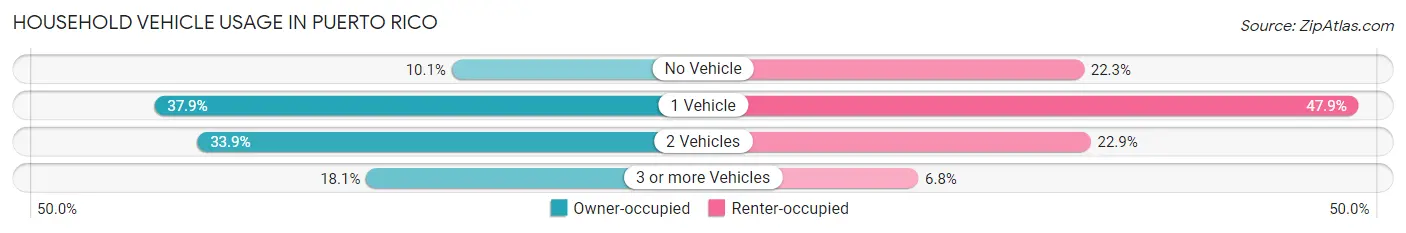
| Vehicles per Household | Owner-occupied | Renter-occupied |
| No Vehicle | 84,061 (10.1%) | 86,915 (22.3%) |
| 1 Vehicle | 314,431 (37.9%) | 186,834 (47.9%) |
| 2 Vehicles | 281,183 (33.9%) | 89,357 (22.9%) |
| 3 or more Vehicles | 150,268 (18.1%) | 26,609 (6.8%) |
| Total | 829,943 (100.0%) | 389,715 (100.0%) |
Real Estate & Mortgages in Puerto Rico
Real Estate and Mortgage Overview in Puerto Rico
| Characteristic | Without Mortgage | With Mortgage |
| Housing Units | 518,280 | 311,663 |
| Median Property Value | $107,300 | $144,300 |
| Median Household Income | $22,514 | $18,414 |
| Monthly Housing Costs | $170 | $7,653 |
| Real Estate Taxes | $538 | $252,402 |
Property Value by Mortgage Status in Puerto Rico
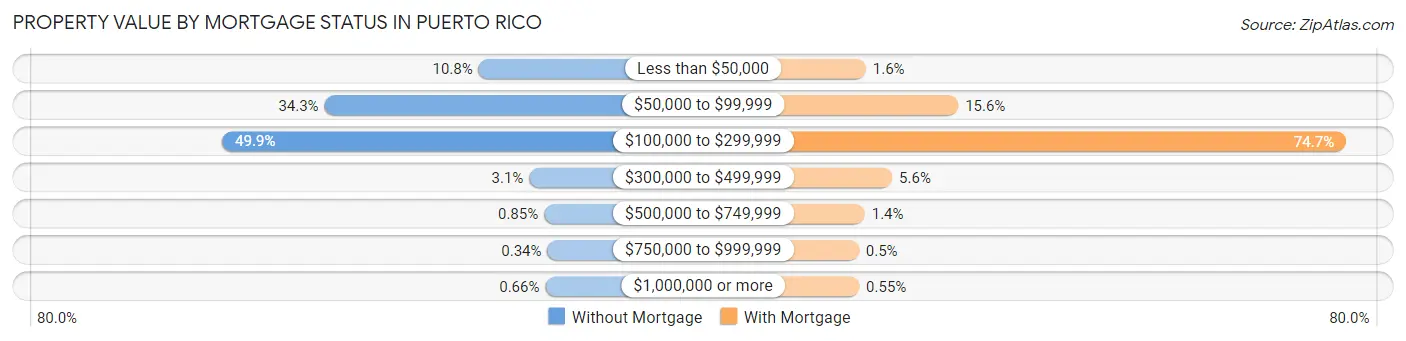
| Property Value | Without Mortgage | With Mortgage |
| Less than $50,000 | 56,130 (10.8%) | 4,897 (1.6%) |
| $50,000 to $99,999 | 177,815 (34.3%) | 48,747 (15.6%) |
| $100,000 to $299,999 | 258,612 (49.9%) | 232,918 (74.7%) |
| $300,000 to $499,999 | 16,121 (3.1%) | 17,404 (5.6%) |
| $500,000 to $749,999 | 4,428 (0.9%) | 4,406 (1.4%) |
| $750,000 to $999,999 | 1,779 (0.3%) | 1,567 (0.5%) |
| $1,000,000 or more | 3,395 (0.7%) | 1,724 (0.5%) |
| Total | 518,280 (100.0%) | 311,663 (100.0%) |
Household Income by Mortgage Status in Puerto Rico
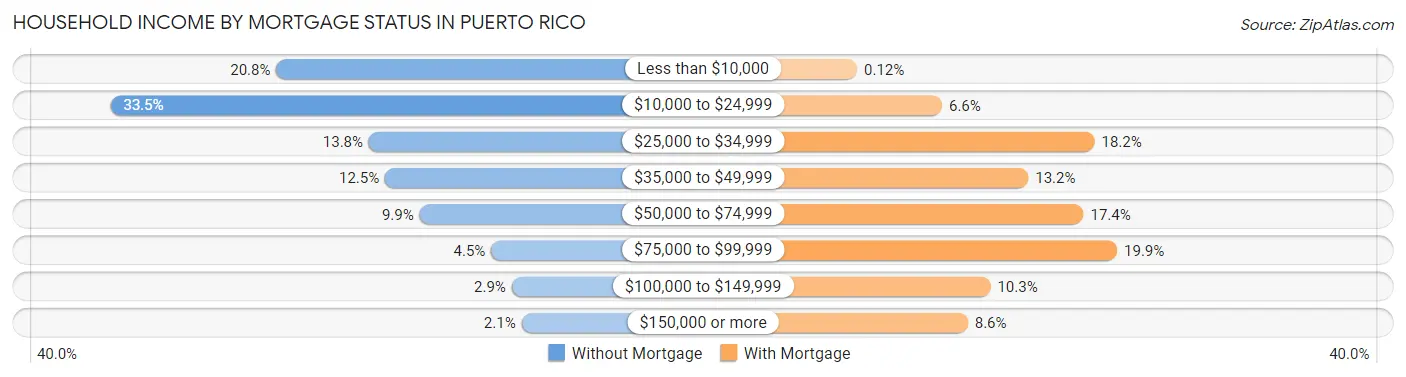
| Household Income | Without Mortgage | With Mortgage |
| Less than $10,000 | 107,919 (20.8%) | 370 (0.1%) |
| $10,000 to $24,999 | 173,474 (33.5%) | 20,534 (6.6%) |
| $25,000 to $34,999 | 71,390 (13.8%) | 56,743 (18.2%) |
| $35,000 to $49,999 | 65,005 (12.5%) | 41,029 (13.2%) |
| $50,000 to $74,999 | 51,343 (9.9%) | 54,129 (17.4%) |
| $75,000 to $99,999 | 23,061 (4.4%) | 62,121 (19.9%) |
| $100,000 to $149,999 | 15,003 (2.9%) | 32,048 (10.3%) |
| $150,000 or more | 11,085 (2.1%) | 26,645 (8.6%) |
| Total | 518,280 (100.0%) | 311,663 (100.0%) |
Property Value to Household Income Ratio in Puerto Rico
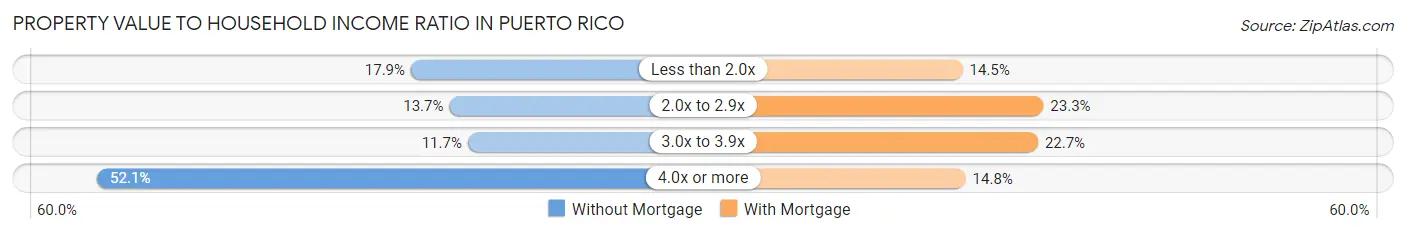
| Value-to-Income Ratio | Without Mortgage | With Mortgage |
| Less than 2.0x | 92,839 (17.9%) | 45,067 (14.5%) |
| 2.0x to 2.9x | 71,127 (13.7%) | 72,500 (23.3%) |
| 3.0x to 3.9x | 60,668 (11.7%) | 70,656 (22.7%) |
| 4.0x or more | 269,965 (52.1%) | 46,087 (14.8%) |
| Total | 518,280 (100.0%) | 311,663 (100.0%) |
Real Estate Taxes by Mortgage Status in Puerto Rico
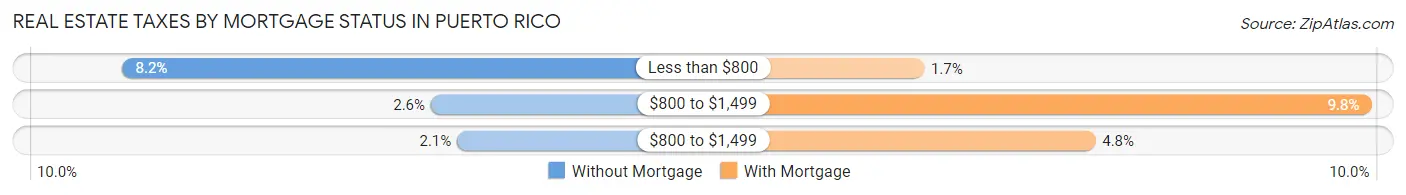
| Property Taxes | Without Mortgage | With Mortgage |
| Less than $800 | 42,568 (8.2%) | 5,185 (1.7%) |
| $800 to $1,499 | 13,361 (2.6%) | 30,642 (9.8%) |
| $800 to $1,499 | 10,906 (2.1%) | 14,936 (4.8%) |
| Total | 518,280 (100.0%) | 311,663 (100.0%) |
Health & Disability in Puerto Rico
Health Insurance Coverage by Age in Puerto Rico
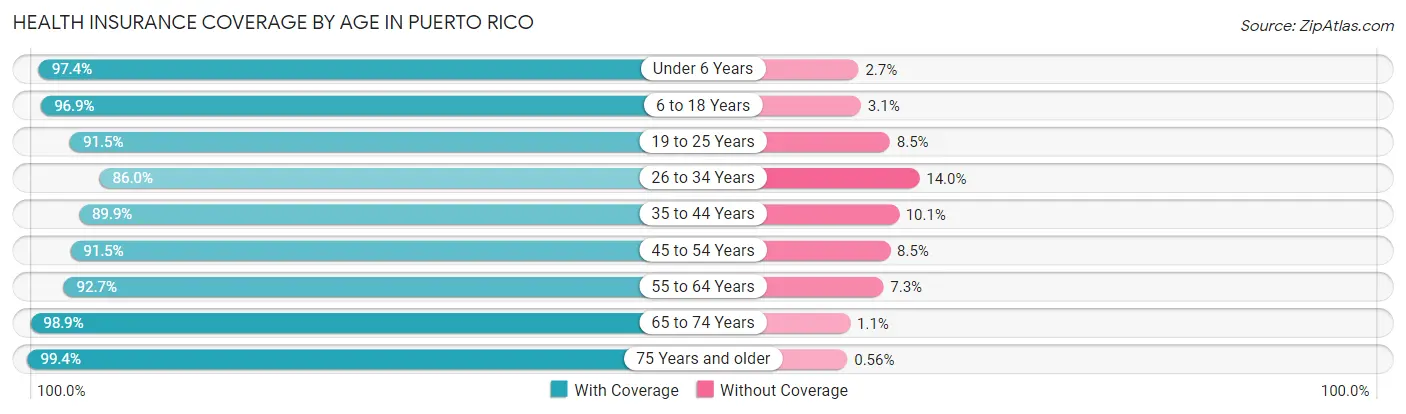
| Age Bracket | With Coverage | Without Coverage |
| Under 6 Years | 136,226 (97.4%) | 3,702 (2.6%) |
| 6 to 18 Years | 454,207 (96.9%) | 14,547 (3.1%) |
| 19 to 25 Years | 285,259 (91.5%) | 26,478 (8.5%) |
| 26 to 34 Years | 313,311 (86.0%) | 50,979 (14.0%) |
| 35 to 44 Years | 349,501 (89.9%) | 39,440 (10.1%) |
| 45 to 54 Years | 382,000 (91.5%) | 35,676 (8.5%) |
| 55 to 64 Years | 407,795 (92.7%) | 32,023 (7.3%) |
| 65 to 74 Years | 374,711 (98.9%) | 4,110 (1.1%) |
| 75 Years and older | 333,042 (99.4%) | 1,859 (0.6%) |
| Total | 3,036,052 (93.6%) | 208,814 (6.4%) |
Health Insurance Coverage by Citizenship Status in Puerto Rico
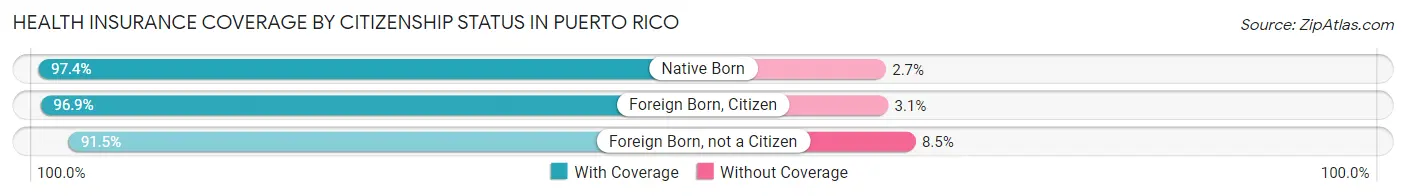
| Citizenship Status | With Coverage | Without Coverage |
| Native Born | 136,226 (97.4%) | 3,702 (2.6%) |
| Foreign Born, Citizen | 454,207 (96.9%) | 14,547 (3.1%) |
| Foreign Born, not a Citizen | 285,259 (91.5%) | 26,478 (8.5%) |
Health Insurance Coverage by Household Income in Puerto Rico
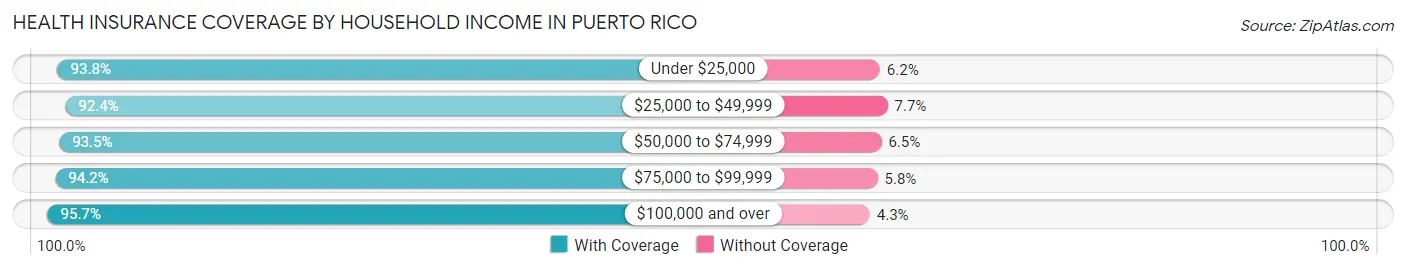
| Household Income | With Coverage | Without Coverage |
| Under $25,000 | 1,303,984 (93.8%) | 86,117 (6.2%) |
| $25,000 to $49,999 | 816,235 (92.3%) | 67,586 (7.6%) |
| $50,000 to $74,999 | 426,397 (93.5%) | 29,570 (6.5%) |
| $75,000 to $99,999 | 210,395 (94.2%) | 12,888 (5.8%) |
| $100,000 and over | 266,826 (95.7%) | 12,048 (4.3%) |
Public vs Private Health Insurance Coverage by Age in Puerto Rico
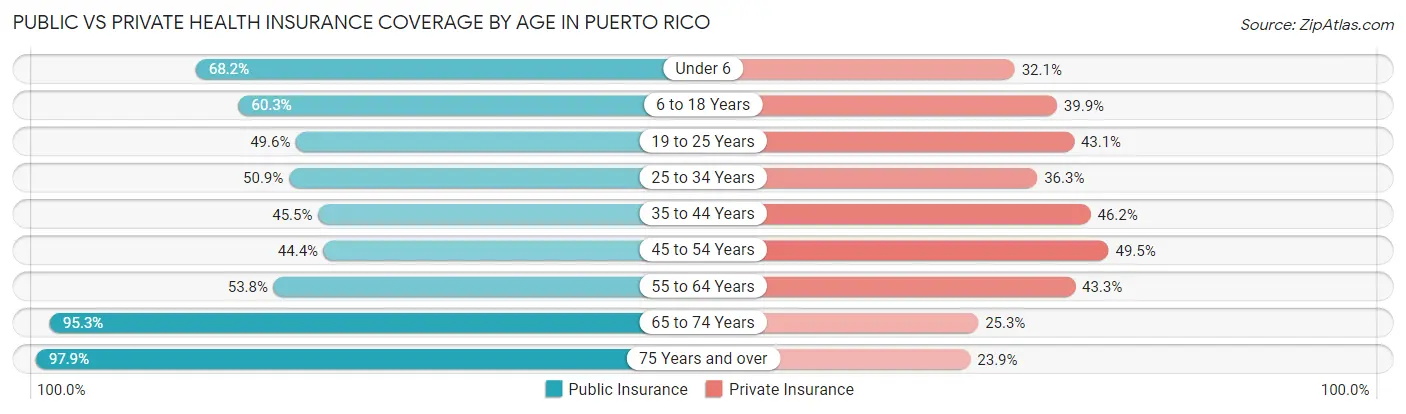
| Age Bracket | Public Insurance | Private Insurance |
| Under 6 | 95,448 (68.2%) | 44,913 (32.1%) |
| 6 to 18 Years | 282,706 (60.3%) | 187,173 (39.9%) |
| 19 to 25 Years | 154,574 (49.6%) | 134,342 (43.1%) |
| 25 to 34 Years | 185,441 (50.9%) | 132,170 (36.3%) |
| 35 to 44 Years | 176,927 (45.5%) | 179,576 (46.2%) |
| 45 to 54 Years | 185,629 (44.4%) | 206,825 (49.5%) |
| 55 to 64 Years | 236,420 (53.7%) | 190,407 (43.3%) |
| 65 to 74 Years | 361,012 (95.3%) | 95,903 (25.3%) |
| 75 Years and over | 327,929 (97.9%) | 79,913 (23.9%) |
| Total | 2,006,086 (61.8%) | 1,251,222 (38.6%) |
Disability Status by Sex by Age in Puerto Rico
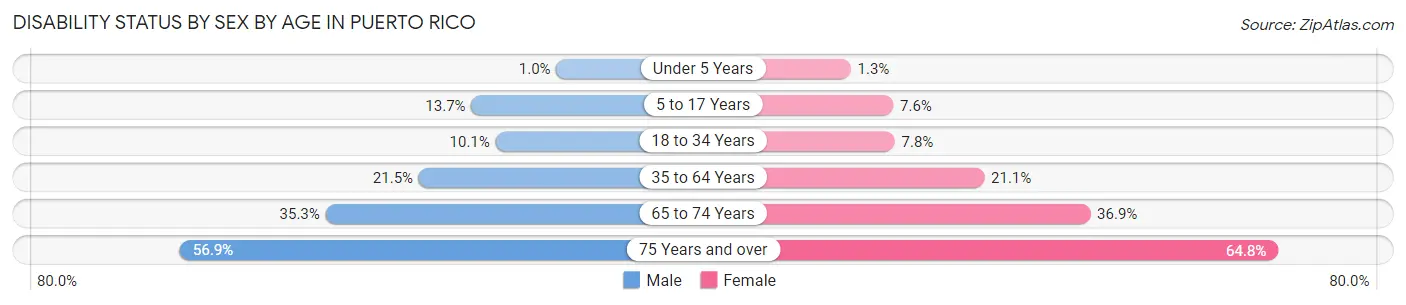
| Age Bracket | Male | Female |
| Under 5 Years | 594 (1.0%) | 726 (1.3%) |
| 5 to 17 Years | 31,481 (13.7%) | 16,910 (7.6%) |
| 18 to 34 Years | 35,953 (10.1%) | 28,400 (7.8%) |
| 35 to 64 Years | 124,014 (21.4%) | 141,223 (21.1%) |
| 65 to 74 Years | 59,821 (35.3%) | 77,201 (36.9%) |
| 75 Years and over | 79,480 (56.9%) | 126,527 (64.8%) |
Disability Class by Sex by Age in Puerto Rico
Disability Class: Hearing Difficulty
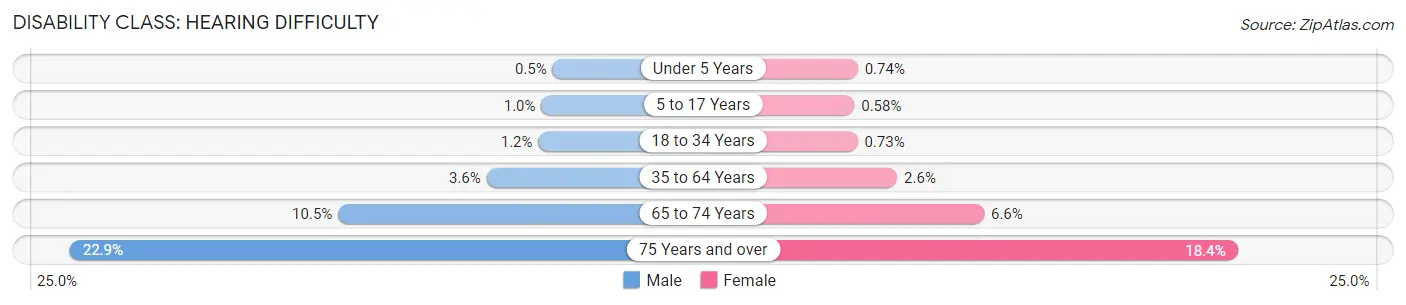
| Age Bracket | Male | Female |
| Under 5 Years | 285 (0.5%) | 407 (0.7%) |
| 5 to 17 Years | 2,360 (1.0%) | 1,294 (0.6%) |
| 18 to 34 Years | 4,147 (1.2%) | 2,654 (0.7%) |
| 35 to 64 Years | 20,570 (3.6%) | 17,205 (2.6%) |
| 65 to 74 Years | 17,708 (10.4%) | 13,813 (6.6%) |
| 75 Years and over | 31,973 (22.9%) | 35,858 (18.4%) |
Disability Class: Vision Difficulty
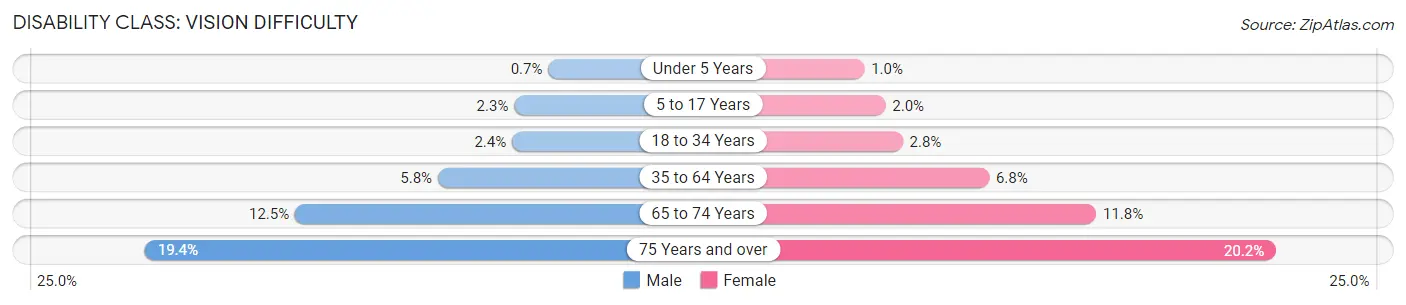
| Age Bracket | Male | Female |
| Under 5 Years | 403 (0.7%) | 573 (1.0%) |
| 5 to 17 Years | 5,260 (2.3%) | 4,473 (2.0%) |
| 18 to 34 Years | 8,518 (2.4%) | 10,200 (2.8%) |
| 35 to 64 Years | 33,633 (5.8%) | 45,661 (6.8%) |
| 65 to 74 Years | 21,105 (12.4%) | 24,695 (11.8%) |
| 75 Years and over | 27,118 (19.4%) | 39,344 (20.2%) |
Disability Class: Cognitive Difficulty
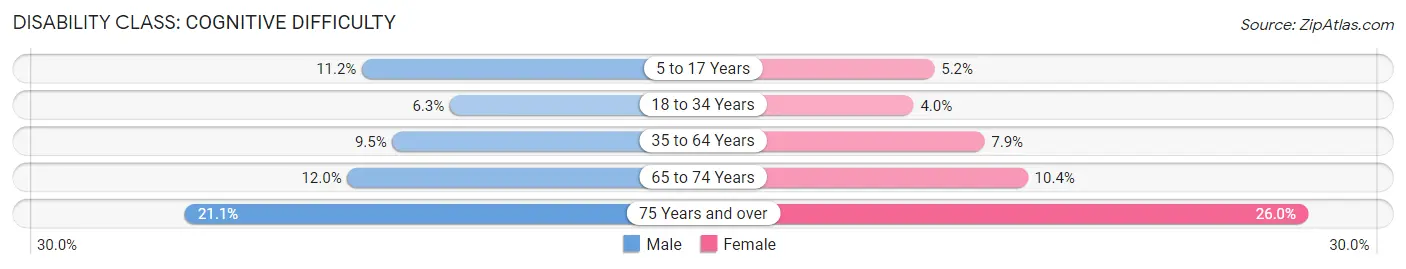
| Age Bracket | Male | Female |
| 5 to 17 Years | 25,822 (11.2%) | 11,428 (5.1%) |
| 18 to 34 Years | 22,554 (6.3%) | 14,451 (4.0%) |
| 35 to 64 Years | 54,973 (9.5%) | 53,066 (7.9%) |
| 65 to 74 Years | 20,362 (12.0%) | 21,662 (10.3%) |
| 75 Years and over | 29,418 (21.1%) | 50,674 (26.0%) |
Disability Class: Ambulatory Difficulty
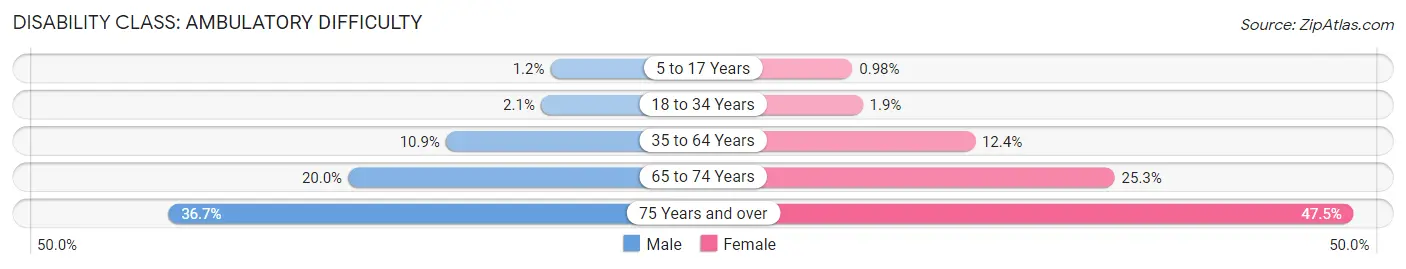
| Age Bracket | Male | Female |
| 5 to 17 Years | 2,780 (1.2%) | 2,179 (1.0%) |
| 18 to 34 Years | 7,497 (2.1%) | 7,001 (1.9%) |
| 35 to 64 Years | 63,167 (10.9%) | 82,572 (12.4%) |
| 65 to 74 Years | 33,881 (20.0%) | 53,000 (25.3%) |
| 75 Years and over | 51,196 (36.7%) | 92,762 (47.5%) |
Disability Class: Self-Care Difficulty
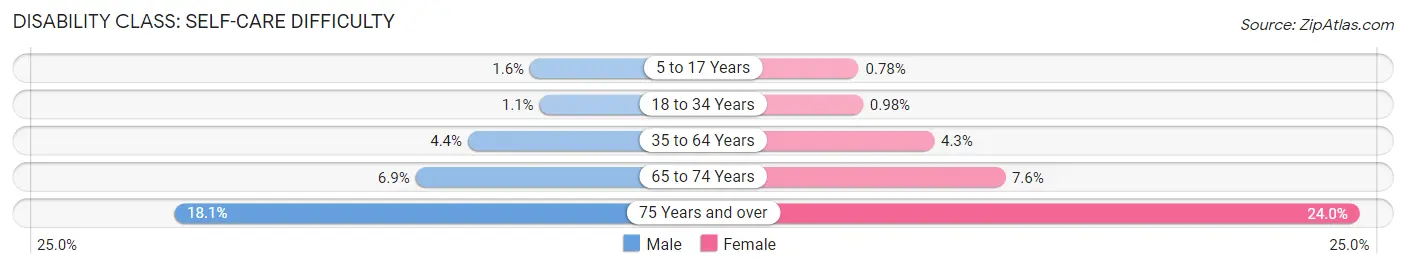
| Age Bracket | Male | Female |
| 5 to 17 Years | 3,586 (1.5%) | 1,721 (0.8%) |
| 18 to 34 Years | 3,970 (1.1%) | 3,544 (1.0%) |
| 35 to 64 Years | 25,606 (4.4%) | 28,594 (4.3%) |
| 65 to 74 Years | 11,627 (6.9%) | 15,846 (7.6%) |
| 75 Years and over | 25,207 (18.1%) | 46,932 (24.0%) |
Technology Access in Puerto Rico
Computing Device Access in Puerto Rico
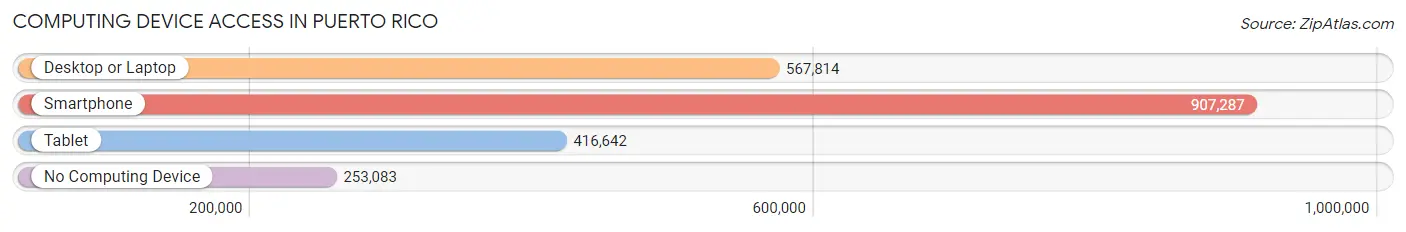
| Device Type | # Households | % Households |
| Desktop or Laptop | 567,814 | 46.6% |
| Smartphone | 907,287 | 74.4% |
| Tablet | 416,642 | 34.2% |
| No Computing Device | 253,083 | 20.7% |
| Total | 1,219,658 | 100.0% |
Internet Access in Puerto Rico
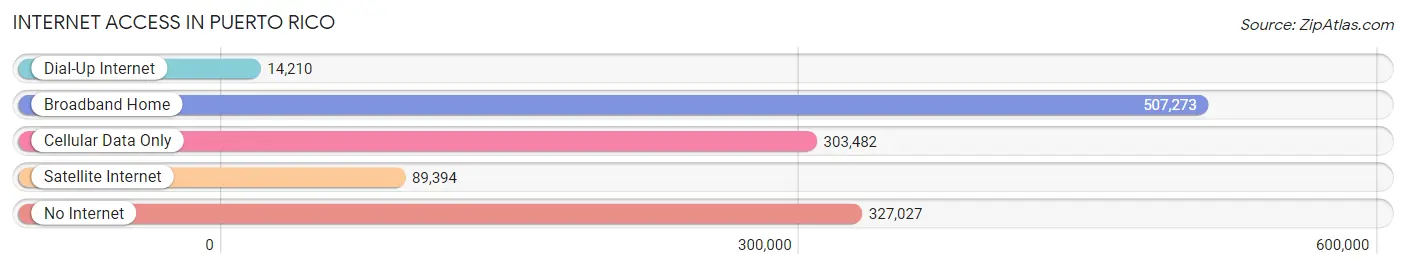
| Internet Type | # Households | % Households |
| Dial-Up Internet | 14,210 | 1.2% |
| Broadband Home | 507,273 | 41.6% |
| Cellular Data Only | 303,482 | 24.9% |
| Satellite Internet | 89,394 | 7.3% |
| No Internet | 327,027 | 26.8% |
| Total | 1,219,658 | 100.0% |
Puerto Rico Summary
Puerto Rico is an unincorporated territory of the United States located in the Caribbean Sea. It is the easternmost and smallest of the Greater Antilles, and is composed of the main island of Puerto Rico and several smaller islands. The island has a rich history, diverse geography, vibrant economy, and unique demographics.
History
Puerto Rico has a long and varied history, beginning with its first inhabitants, the Taíno people, who arrived on the island around 1000 AD. The Taíno were a peaceful people who lived in small villages and practiced agriculture. They were eventually conquered by the Spanish in the late 15th century, and the island became a Spanish colony. During the colonial period, the island was used as a base for Spanish exploration and conquest of the Americas.
In 1898, Puerto Rico was ceded to the United States as part of the Treaty of Paris, which ended the Spanish-American War. The island became an unincorporated territory of the United States, and its citizens were granted U.S. citizenship in 1917. In 1952, Puerto Rico became a self-governing commonwealth of the United States.
Geography
Puerto Rico is located in the Caribbean Sea, east of the Dominican Republic and west of the Virgin Islands. The main island of Puerto Rico is approximately 100 miles long and 35 miles wide, and is surrounded by smaller islands, including Vieques, Culebra, and Mona. The island is mostly mountainous, with the highest peak, Cerro de Punta, reaching 4,390 feet. The climate is tropical, with temperatures ranging from the mid-70s to the mid-80s year-round.
Economy
Puerto Rico has a vibrant economy, with a gross domestic product (GDP) of $103.3 billion in 2019. The economy is largely driven by tourism, manufacturing, and services. The island is home to several large pharmaceutical companies, including Johnson & Johnson and Merck, and is a major producer of rum and other alcoholic beverages. The government of Puerto Rico also provides incentives for businesses to invest in the island, including tax breaks and other incentives.
Demographics
Puerto Rico has a population of 3.2 million people, making it the second-most populous territory in the United States. The population is largely of Spanish and African descent, with smaller numbers of other ethnicities, including Native American, Asian, and European. The official language is Spanish, although English is also widely spoken. The majority of the population is Roman Catholic, with smaller numbers of other religious groups, including Protestantism and Judaism.
Common Questions
When was Puerto Rico Incorporated?
Puerto Rico was Incorporated into the Union on Jul 25, 1898.
What is the Total Area of Puerto Rico?
Total Area of Puerto Rico is 3,425 Square Miles.
What is the Total Land Area of Puerto Rico?
Total Land Area of Puerto Rico is 3,459 Square Miles.
What is the Total Water Area of Puerto Rico?
Total Water Area of Puerto Rico is 56 Square Miles.
What is the Average Elevation in Puerto Rico?
Average Elevation in Puerto Rico is 856 Feet.
What is the Highest Elevation in Puerto Rico?
Highest Elevation in Puerto Rico is 4,390 Feet.
What is the Lowest Elevation in Puerto Rico?
Lowest Elevation in Puerto Rico is 0 Feet.
What is the Population Density in Puerto Rico?
Population Density in Puerto Rico is 946.0 People per Square Mile.
What is Per Capita Income in Puerto Rico?
Per Capita income in Puerto Rico is $15,637.
What is the Median Family Income in Puerto Rico?
Median Family Income in Puerto Rico is $29,240.
What is the Median Household income in Puerto Rico?
Median Household Income in Puerto Rico is $24,002.
What is Income or Wage Gap in Puerto Rico?
Income or Wage Gap in Puerto Rico is 0.7%.
Women in Puerto Rico earn 99.3 cents for every dollar earned by a man.
What is Family Income Deficit in Puerto Rico?
Family Income Deficit in Puerto Rico is $11,267.
Families that are below poverty line in Puerto Rico earn $11,267 less on average than the poverty threshold level.
What is Inequality or Gini Index in Puerto Rico?
Inequality or Gini Index in Puerto Rico is 0.54.
What is the Total Population of Puerto Rico?
Total Population of Puerto Rico is 3,272,382.
What is the Total Male Population of Puerto Rico?
Total Male Population of Puerto Rico is 1,551,668.
What is the Total Female Population of Puerto Rico?
Total Female Population of Puerto Rico is 1,720,714.
What is the Ratio of Males per 100 Females in Puerto Rico?
There are 90.18 Males per 100 Females in Puerto Rico.
What is the Ratio of Females per 100 Males in Puerto Rico?
There are 110.89 Females per 100 Males in Puerto Rico.
What is the Median Population Age in Puerto Rico?
Median Population Age in Puerto Rico is 43.7 Years.
What is the Average Family Size in Puerto Rico
Average Family Size in Puerto Rico is 3.3 People.
What is the Average Household Size in Puerto Rico
Average Household Size in Puerto Rico is 2.6 People.
How Large is the Labor Force in Puerto Rico?
There are 1,250,873 People in the Labor Forcein in Puerto Rico.
What is the Percentage of People in the Labor Force in Puerto Rico?
44.9% of People are in the Labor Force in Puerto Rico.
What is the Unemployment Rate in Puerto Rico?
Unemployment Rate in Puerto Rico is 13.3%.