Cities with the Highest Percentage of Population Employed in Installation, Maintenance & Repair in Illinois
RELATED REPORTS & OPTIONS
Installation, Maintenance & Repair
Illinois
Compare Cities
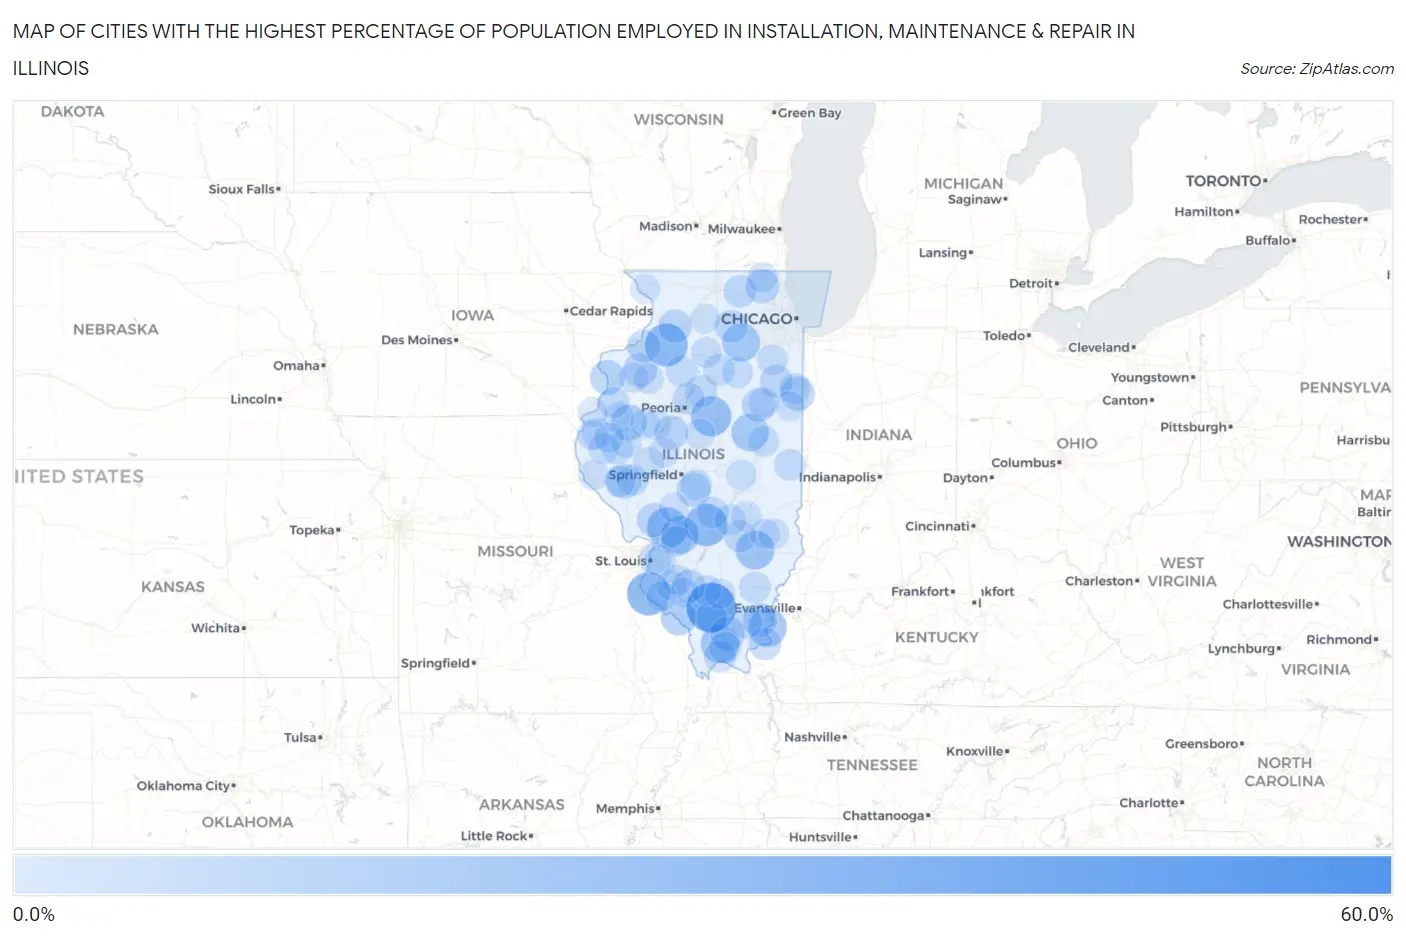
Map of Cities with the Highest Percentage of Population Employed in Installation, Maintenance & Repair in Illinois
0.0%
60.0%
Cities with the Highest Percentage of Population Employed in Installation, Maintenance & Repair in Illinois
| City | % Employed | vs State | vs National | |
| 1. | Andres | 54.5% | 2.7%(+51.8)#1 | 3.1%(+51.5)#58 |
| 2. | La Clede | 51.5% | 2.7%(+48.8)#2 | 3.1%(+48.4)#67 |
| 3. | Mulkeytown | 44.4% | 2.7%(+41.7)#3 | 3.1%(+41.4)#108 |
| 4. | Fults | 33.3% | 2.7%(+30.6)#4 | 3.1%(+30.3)#229 |
| 5. | Hooppole | 32.5% | 2.7%(+29.7)#5 | 3.1%(+29.4)#247 |
| 6. | Bingham | 31.6% | 2.7%(+28.9)#6 | 3.1%(+28.5)#254 |
| 7. | Elwin | 30.6% | 2.7%(+27.8)#7 | 3.1%(+27.5)#276 |
| 8. | Dorchester | 28.4% | 2.7%(+25.6)#8 | 3.1%(+25.3)#324 |
| 9. | Carlock | 27.8% | 2.7%(+25.1)#9 | 3.1%(+24.7)#337 |
| 10. | Lowpoint | 27.1% | 2.7%(+24.4)#10 | 3.1%(+24.0)#354 |
| 11. | Sailor Springs | 25.5% | 2.7%(+22.8)#11 | 3.1%(+22.5)#391 |
| 12. | Buncombe | 25.0% | 2.7%(+22.3)#12 | 3.1%(+21.9)#408 |
| 13. | Old Shawneetown | 25.0% | 2.7%(+22.3)#13 | 3.1%(+21.9)#413 |
| 14. | New Douglas | 24.1% | 2.7%(+21.3)#14 | 3.1%(+21.0)#456 |
| 15. | Millington | 23.9% | 2.7%(+21.2)#15 | 3.1%(+20.9)#462 |
| 16. | Foosland | 23.1% | 2.7%(+20.3)#16 | 3.1%(+20.0)#498 |
| 17. | Literberry | 20.6% | 2.7%(+17.9)#17 | 3.1%(+17.6)#628 |
| 18. | Bardolph | 20.3% | 2.7%(+17.6)#18 | 3.1%(+17.3)#652 |
| 19. | Rockwood | 20.0% | 2.7%(+17.3)#19 | 3.1%(+16.9)#684 |
| 20. | Valley City | 18.8% | 2.7%(+16.0)#20 | 3.1%(+15.7)#753 |
| 21. | Keithsburg | 18.6% | 2.7%(+15.8)#21 | 3.1%(+15.5)#761 |
| 22. | Rest Haven | 18.4% | 2.7%(+15.6)#22 | 3.1%(+15.3)#779 |
| 23. | Sunnyland | 18.3% | 2.7%(+15.6)#23 | 3.1%(+15.2)#784 |
| 24. | Creal Springs | 18.2% | 2.7%(+15.5)#24 | 3.1%(+15.1)#793 |
| 25. | Wilton Center | 18.1% | 2.7%(+15.3)#25 | 3.1%(+15.0)#816 |
| 26. | Donovan | 17.8% | 2.7%(+15.1)#26 | 3.1%(+14.8)#834 |
| 27. | Solon Mills | 17.3% | 2.7%(+14.6)#27 | 3.1%(+14.3)#868 |
| 28. | Kincaid | 17.3% | 2.7%(+14.6)#28 | 3.1%(+14.3)#869 |
| 29. | Forest City | 17.3% | 2.7%(+14.6)#29 | 3.1%(+14.3)#870 |
| 30. | Ridgway | 17.3% | 2.7%(+14.6)#30 | 3.1%(+14.2)#875 |
| 31. | Alpha | 17.0% | 2.7%(+14.3)#31 | 3.1%(+13.9)#902 |
| 32. | Holiday Hills | 16.7% | 2.7%(+13.9)#32 | 3.1%(+13.6)#927 |
| 33. | Chatsworth | 16.6% | 2.7%(+13.9)#33 | 3.1%(+13.6)#957 |
| 34. | Medora | 16.5% | 2.7%(+13.7)#34 | 3.1%(+13.4)#969 |
| 35. | Alexander | 16.3% | 2.7%(+13.6)#35 | 3.1%(+13.3)#984 |
| 36. | Oakdale | 16.2% | 2.7%(+13.4)#36 | 3.1%(+13.1)#1,003 |
| 37. | Como | 16.1% | 2.7%(+13.4)#37 | 3.1%(+13.0)#1,012 |
| 38. | Waterman | 15.7% | 2.7%(+12.9)#38 | 3.1%(+12.6)#1,055 |
| 39. | Irwin | 15.4% | 2.7%(+12.7)#39 | 3.1%(+12.3)#1,090 |
| 40. | Moro | 15.3% | 2.7%(+12.6)#40 | 3.1%(+12.3)#1,099 |
| 41. | Cleveland | 15.2% | 2.7%(+12.5)#41 | 3.1%(+12.1)#1,125 |
| 42. | Marengo | 14.8% | 2.7%(+12.1)#42 | 3.1%(+11.8)#1,184 |
| 43. | Cave In Rock | 14.5% | 2.7%(+11.7)#43 | 3.1%(+11.4)#1,237 |
| 44. | Fairmont City | 14.3% | 2.7%(+11.6)#44 | 3.1%(+11.2)#1,260 |
| 45. | Mason | 14.3% | 2.7%(+11.6)#45 | 3.1%(+11.2)#1,262 |
| 46. | Muddy | 14.3% | 2.7%(+11.6)#46 | 3.1%(+11.2)#1,279 |
| 47. | Karnak | 14.2% | 2.7%(+11.5)#47 | 3.1%(+11.1)#1,298 |
| 48. | Washburn | 14.1% | 2.7%(+11.4)#48 | 3.1%(+11.0)#1,317 |
| 49. | Bay View Gardens | 13.7% | 2.7%(+10.9)#49 | 3.1%(+10.6)#1,400 |
| 50. | Bush | 13.5% | 2.7%(+10.8)#50 | 3.1%(+10.4)#1,438 |
| 51. | Vienna | 13.5% | 2.7%(+10.8)#51 | 3.1%(+10.4)#1,439 |
| 52. | Mill Shoals | 13.4% | 2.7%(+10.7)#52 | 3.1%(+10.4)#1,457 |
| 53. | Leonore | 13.2% | 2.7%(+10.5)#53 | 3.1%(+10.2)#1,509 |
| 54. | Indianola | 13.0% | 2.7%(+10.3)#54 | 3.1%(+9.98)#1,558 |
| 55. | Camden | 13.0% | 2.7%(+10.3)#55 | 3.1%(+9.98)#1,562 |
| 56. | Exeter | 13.0% | 2.7%(+10.2)#56 | 3.1%(+9.90)#1,582 |
| 57. | Oconee | 12.9% | 2.7%(+10.2)#57 | 3.1%(+9.87)#1,587 |
| 58. | Beecher City | 12.9% | 2.7%(+10.2)#58 | 3.1%(+9.82)#1,605 |
| 59. | Caseyville | 12.8% | 2.7%(+10.1)#59 | 3.1%(+9.77)#1,615 |
| 60. | Beaverville | 12.5% | 2.7%(+9.77)#60 | 3.1%(+9.43)#1,689 |
| 61. | Sciota | 12.5% | 2.7%(+9.77)#61 | 3.1%(+9.43)#1,705 |
| 62. | La Prairie | 12.5% | 2.7%(+9.77)#62 | 3.1%(+9.43)#1,711 |
| 63. | Bentley | 12.5% | 2.7%(+9.77)#63 | 3.1%(+9.43)#1,714 |
| 64. | Bradford | 12.4% | 2.7%(+9.70)#64 | 3.1%(+9.36)#1,719 |
| 65. | Thomasboro | 12.3% | 2.7%(+9.56)#65 | 3.1%(+9.22)#1,750 |
| 66. | Media | 12.3% | 2.7%(+9.55)#66 | 3.1%(+9.21)#1,756 |
| 67. | Edinburg | 12.3% | 2.7%(+9.54)#67 | 3.1%(+9.20)#1,760 |
| 68. | Griggsville | 12.2% | 2.7%(+9.51)#68 | 3.1%(+9.17)#1,771 |
| 69. | Ransom | 12.2% | 2.7%(+9.48)#69 | 3.1%(+9.14)#1,778 |
| 70. | Lenzburg | 11.9% | 2.7%(+9.18)#70 | 3.1%(+8.84)#1,854 |
| 71. | Basco | 11.9% | 2.7%(+9.18)#71 | 3.1%(+8.84)#1,858 |
| 72. | Alhambra | 11.9% | 2.7%(+9.17)#72 | 3.1%(+8.83)#1,861 |
| 73. | Symerton | 11.8% | 2.7%(+9.04)#73 | 3.1%(+8.70)#1,899 |
| 74. | Cherry | 11.7% | 2.7%(+8.94)#74 | 3.1%(+8.60)#1,924 |
| 75. | St Libory | 11.6% | 2.7%(+8.86)#75 | 3.1%(+8.52)#1,944 |
| 76. | Piper City | 11.5% | 2.7%(+8.75)#76 | 3.1%(+8.41)#1,989 |
| 77. | Littleton | 11.5% | 2.7%(+8.75)#77 | 3.1%(+8.41)#1,997 |
| 78. | Virginia | 11.5% | 2.7%(+8.73)#78 | 3.1%(+8.39)#1,998 |
| 79. | Hammond | 11.5% | 2.7%(+8.73)#79 | 3.1%(+8.39)#2,001 |
| 80. | Willow Hill | 11.4% | 2.7%(+8.70)#80 | 3.1%(+8.36)#2,007 |
| 81. | Plainville | 11.2% | 2.7%(+8.50)#81 | 3.1%(+8.16)#2,071 |
| 82. | Plymouth | 11.1% | 2.7%(+8.38)#82 | 3.1%(+8.04)#2,097 |
| 83. | Sigel | 11.1% | 2.7%(+8.38)#83 | 3.1%(+8.04)#2,098 |
| 84. | Armington | 11.1% | 2.7%(+8.38)#84 | 3.1%(+8.04)#2,100 |
| 85. | Nason | 11.1% | 2.7%(+8.38)#85 | 3.1%(+8.04)#2,104 |
| 86. | Coulterville | 11.0% | 2.7%(+8.30)#86 | 3.1%(+7.96)#2,136 |
| 87. | Ruma | 10.9% | 2.7%(+8.19)#87 | 3.1%(+7.85)#2,165 |
| 88. | Oneida | 10.9% | 2.7%(+8.19)#88 | 3.1%(+7.85)#2,166 |
| 89. | Oakford | 10.9% | 2.7%(+8.16)#89 | 3.1%(+7.82)#2,179 |
| 90. | Pistakee Highlands | 10.9% | 2.7%(+8.16)#90 | 3.1%(+7.82)#2,181 |
| 91. | Newton | 10.9% | 2.7%(+8.16)#91 | 3.1%(+7.82)#2,182 |
| 92. | Du Bois | 10.8% | 2.7%(+8.10)#92 | 3.1%(+7.77)#2,204 |
| 93. | Bryant | 10.6% | 2.7%(+7.86)#93 | 3.1%(+7.52)#2,294 |
| 94. | North Henderson | 10.6% | 2.7%(+7.85)#94 | 3.1%(+7.51)#2,298 |
| 95. | Hanover | 10.6% | 2.7%(+7.84)#95 | 3.1%(+7.50)#2,301 |
| 96. | Pontoosuc | 10.5% | 2.7%(+7.80)#96 | 3.1%(+7.46)#2,321 |
| 97. | Standard City | 10.4% | 2.7%(+7.72)#97 | 3.1%(+7.38)#2,353 |
| 98. | Smithfield | 10.4% | 2.7%(+7.72)#98 | 3.1%(+7.38)#2,354 |
| 99. | Woodland | 10.4% | 2.7%(+7.65)#99 | 3.1%(+7.31)#2,376 |
| 100. | Ashton | 10.3% | 2.7%(+7.62)#100 | 3.1%(+7.28)#2,393 |
Common Questions
What are the Top 10 Cities with the Highest Percentage of Population Employed in Installation, Maintenance & Repair in Illinois?
Top 10 Cities with the Highest Percentage of Population Employed in Installation, Maintenance & Repair in Illinois are:
#1
44.4%
#2
33.3%
#3
32.5%
#4
31.6%
#5
28.4%
#6
27.8%
#7
25.5%
#8
25.0%
#9
25.0%
#10
24.1%
What city has the Highest Percentage of Population Employed in Installation, Maintenance & Repair in Illinois?
Mulkeytown has the Highest Percentage of Population Employed in Installation, Maintenance & Repair in Illinois with 44.4%.
What is the Percentage of Population Employed in Installation, Maintenance & Repair in the State of Illinois?
Percentage of Population Employed in Installation, Maintenance & Repair in Illinois is 2.7%.
What is the Percentage of Population Employed in Installation, Maintenance & Repair in the United States?
Percentage of Population Employed in Installation, Maintenance & Repair in the United States is 3.1%.