Independence, CA Map & Demographics
Independence Map
Independence Overview
$28,402
PER CAPITA INCOME
$78,929
AVG FAMILY INCOME
$57,917
AVG HOUSEHOLD INCOME
40.2%
WAGE / INCOME GAP [ % ]
59.8¢/ $1
WAGE / INCOME GAP [ $ ]
0.35
INEQUALITY / GINI INDEX
850
TOTAL POPULATION
456
MALE POPULATION
394
FEMALE POPULATION
115.74
MALES / 100 FEMALES
86.40
FEMALES / 100 MALES
40.0
MEDIAN AGE
3.7
AVG FAMILY SIZE
2.4
AVG HOUSEHOLD SIZE
274
LABOR FORCE [ PEOPLE ]
41.8%
PERCENT IN LABOR FORCE
8.0%
UNEMPLOYMENT RATE
Independence Zip Codes
Independence Area Codes
Income in Independence
Income Overview in Independence
Per Capita Income in Independence is $28,402, while median incomes of families and households are $78,929 and $57,917 respectively.
| Characteristic | Number | Measure |
| Per Capita Income | 850 | $28,402 |
| Median Family Income | 156 | $78,929 |
| Mean Family Income | 156 | $83,923 |
| Median Household Income | 337 | $57,917 |
| Mean Household Income | 337 | $65,929 |
| Income Deficit | 156 | $0 |
| Wage / Income Gap (%) | 850 | 40.17% |
| Wage / Income Gap ($) | 850 | 59.83¢ per $1 |
| Gini / Inequality Index | 850 | 0.35 |
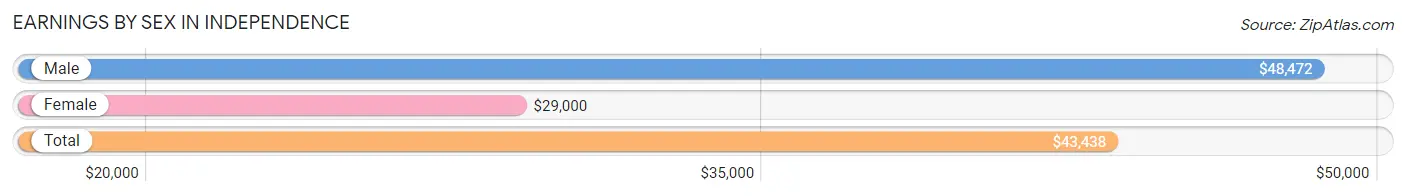
Earnings by Sex in Independence
Average Earnings in Independence are $43,438, $48,472 for men and $29,000 for women, a difference of 40.2%.
| Sex | Number | Average Earnings |
| Male | 188 (58.0%) | $48,472 |
| Female | 136 (42.0%) | $29,000 |
| Total | 324 (100.0%) | $43,438 |
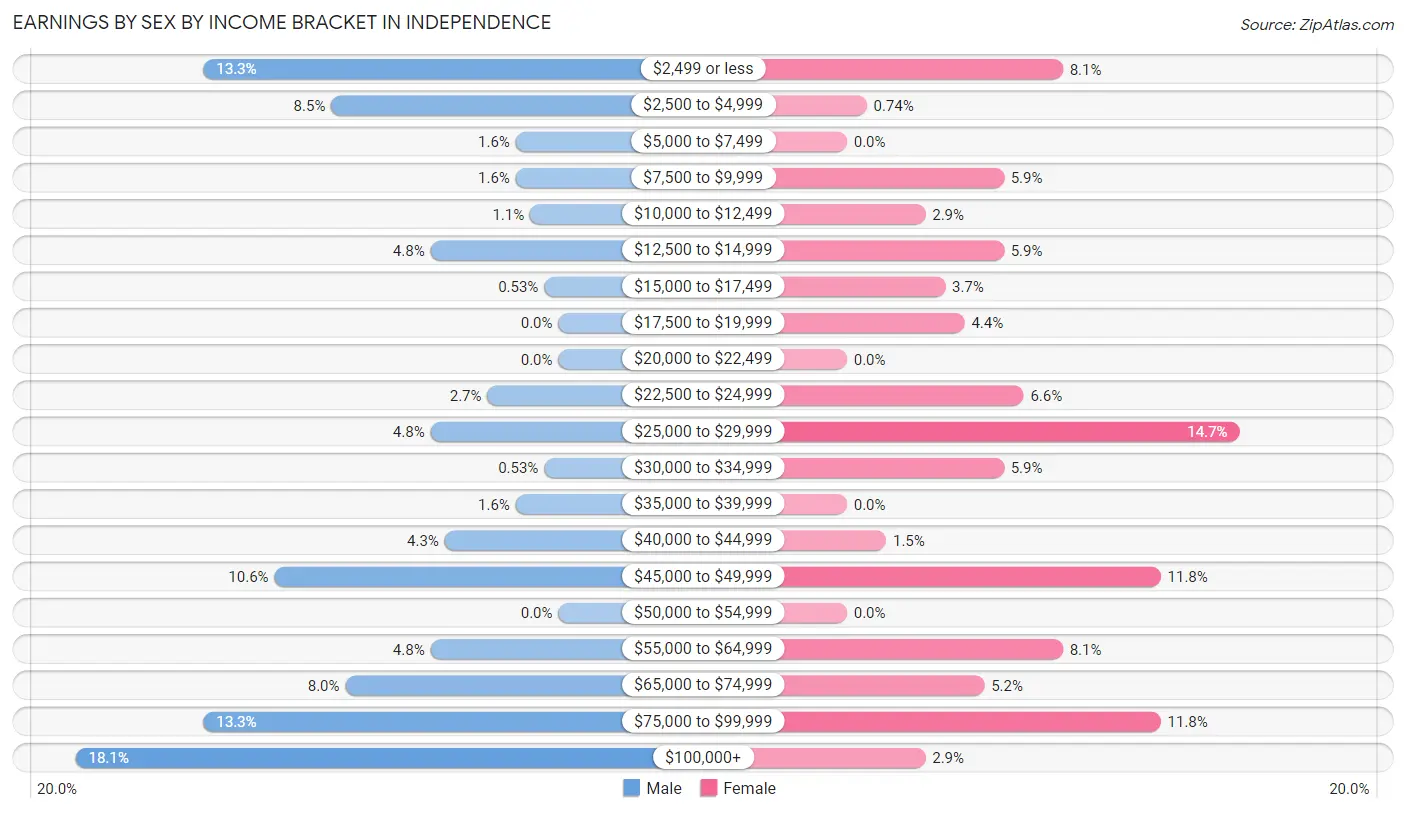
Earnings by Sex by Income Bracket in Independence
The most common earnings brackets in Independence are $100,000+ for men (34 | 18.1%) and $25,000 to $29,999 for women (20 | 14.7%).
| Income | Male | Female |
| $2,499 or less | 25 (13.3%) | 11 (8.1%) |
| $2,500 to $4,999 | 16 (8.5%) | 1 (0.7%) |
| $5,000 to $7,499 | 3 (1.6%) | 0 (0.0%) |
| $7,500 to $9,999 | 3 (1.6%) | 8 (5.9%) |
| $10,000 to $12,499 | 2 (1.1%) | 4 (2.9%) |
| $12,500 to $14,999 | 9 (4.8%) | 8 (5.9%) |
| $15,000 to $17,499 | 1 (0.5%) | 5 (3.7%) |
| $17,500 to $19,999 | 0 (0.0%) | 6 (4.4%) |
| $20,000 to $22,499 | 0 (0.0%) | 0 (0.0%) |
| $22,500 to $24,999 | 5 (2.7%) | 9 (6.6%) |
| $25,000 to $29,999 | 9 (4.8%) | 20 (14.7%) |
| $30,000 to $34,999 | 1 (0.5%) | 8 (5.9%) |
| $35,000 to $39,999 | 3 (1.6%) | 0 (0.0%) |
| $40,000 to $44,999 | 8 (4.3%) | 2 (1.5%) |
| $45,000 to $49,999 | 20 (10.6%) | 16 (11.8%) |
| $50,000 to $54,999 | 0 (0.0%) | 0 (0.0%) |
| $55,000 to $64,999 | 9 (4.8%) | 11 (8.1%) |
| $65,000 to $74,999 | 15 (8.0%) | 7 (5.1%) |
| $75,000 to $99,999 | 25 (13.3%) | 16 (11.8%) |
| $100,000+ | 34 (18.1%) | 4 (2.9%) |
| Total | 188 (100.0%) | 136 (100.0%) |
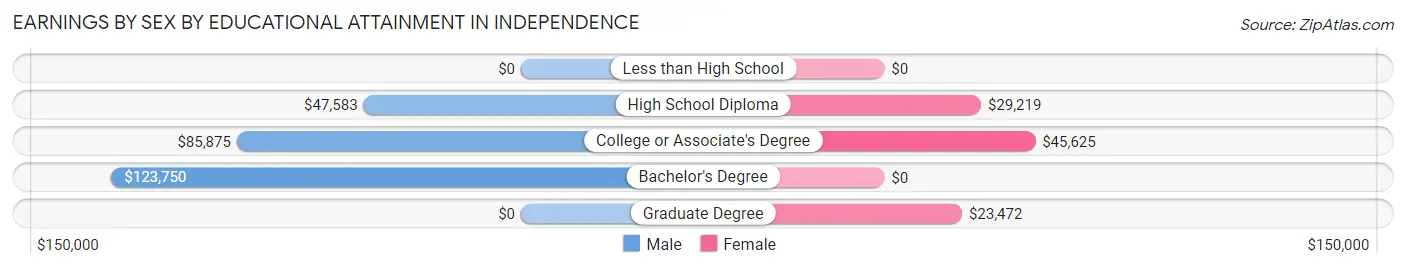
Earnings by Sex by Educational Attainment in Independence
Average earnings in Independence are $57,500 for men and $28,750 for women, a difference of 50.0%. Men with an educational attainment of bachelor's degree enjoy the highest average annual earnings of $123,750, while those with high school diploma education earn the least with $47,583. Women with an educational attainment of college or associate's degree earn the most with the average annual earnings of $45,625, while those with graduate degree education have the smallest earnings of $23,472.
| Educational Attainment | Male Income | Female Income |
| Less than High School | - | - |
| High School Diploma | $47,583 | $29,219 |
| College or Associate's Degree | $85,875 | $45,625 |
| Bachelor's Degree | $123,750 | $0 |
| Graduate Degree | - | - |
| Total | $57,500 | $28,750 |
Family Income in Independence
Family Income Brackets in Independence
According to the Independence family income data, there are 42 families falling into the $100,000 to $149,999 income range, which is the most common income bracket and makes up 26.9% of all families.
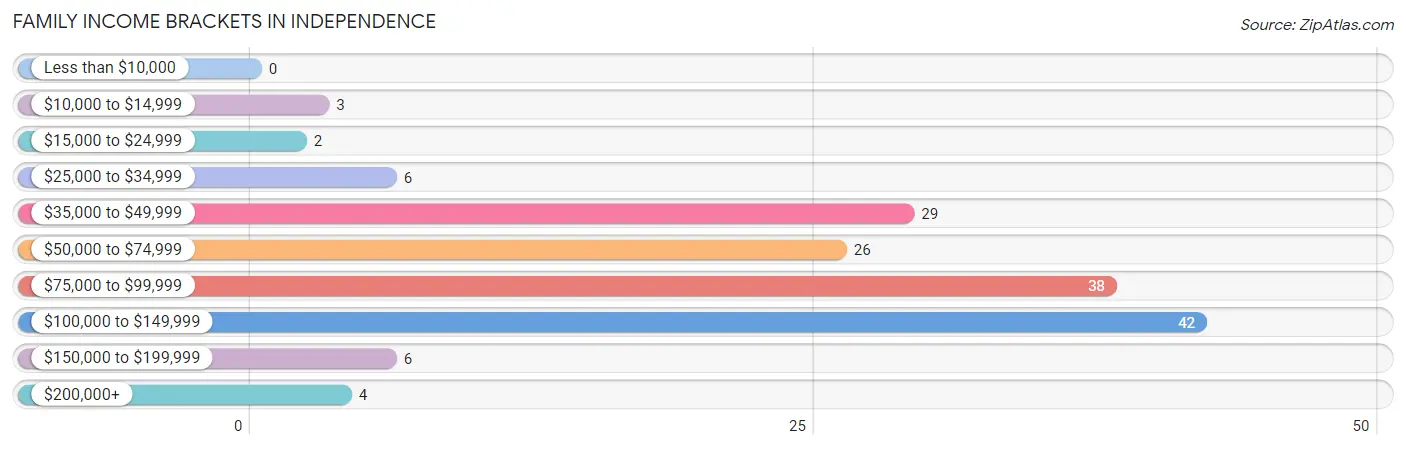
| Income Bracket | # Families | % Families |
| Less than $10,000 | 0 | 0.0% |
| $10,000 to $14,999 | 3 | 1.9% |
| $15,000 to $24,999 | 2 | 1.3% |
| $25,000 to $34,999 | 6 | 3.8% |
| $35,000 to $49,999 | 29 | 18.6% |
| $50,000 to $74,999 | 26 | 16.7% |
| $75,000 to $99,999 | 38 | 24.4% |
| $100,000 to $149,999 | 42 | 26.9% |
| $150,000 to $199,999 | 6 | 3.8% |
| $200,000+ | 4 | 2.6% |
Family Income by Famaliy Size in Independence
4-person families (37 | 23.7%) account for the highest median family income in Independence with $101,518 per family, while 2-person families (88 | 56.4%) have the highest median income of $38,125 per family member.
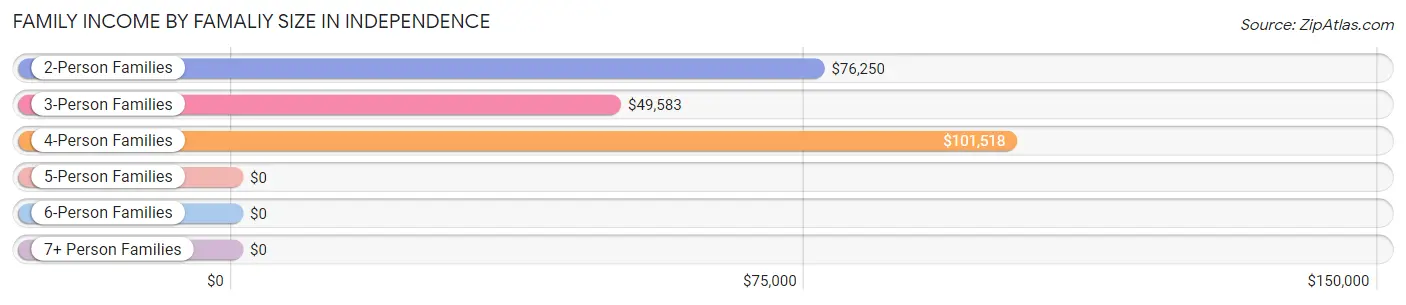
| Income Bracket | # Families | Median Income |
| 2-Person Families | 88 (56.4%) | $76,250 |
| 3-Person Families | 20 (12.8%) | $49,583 |
| 4-Person Families | 37 (23.7%) | $101,518 |
| 5-Person Families | 2 (1.3%) | $0 |
| 6-Person Families | 9 (5.8%) | $0 |
| 7+ Person Families | 0 (0.0%) | $0 |
| Total | 156 (100.0%) | $78,929 |
Family Income by Number of Earners in Independence
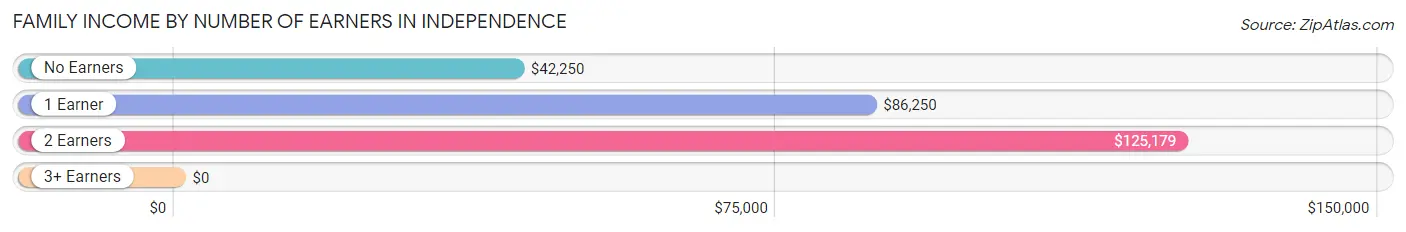
| Number of Earners | # Families | Median Income |
| No Earners | 33 (21.1%) | $42,250 |
| 1 Earner | 80 (51.3%) | $86,250 |
| 2 Earners | 43 (27.6%) | $125,179 |
| 3+ Earners | 0 (0.0%) | $0 |
| Total | 156 (100.0%) | $78,929 |
Household Income in Independence
Household Income Brackets in Independence
With 67 households falling in the category, the $50,000 to $74,999 income range is the most frequent in Independence, accounting for 19.9% of all households. In contrast, only 4 households (1.2%) fall into the $10,000 to $14,999 income bracket, making it the least populous group.
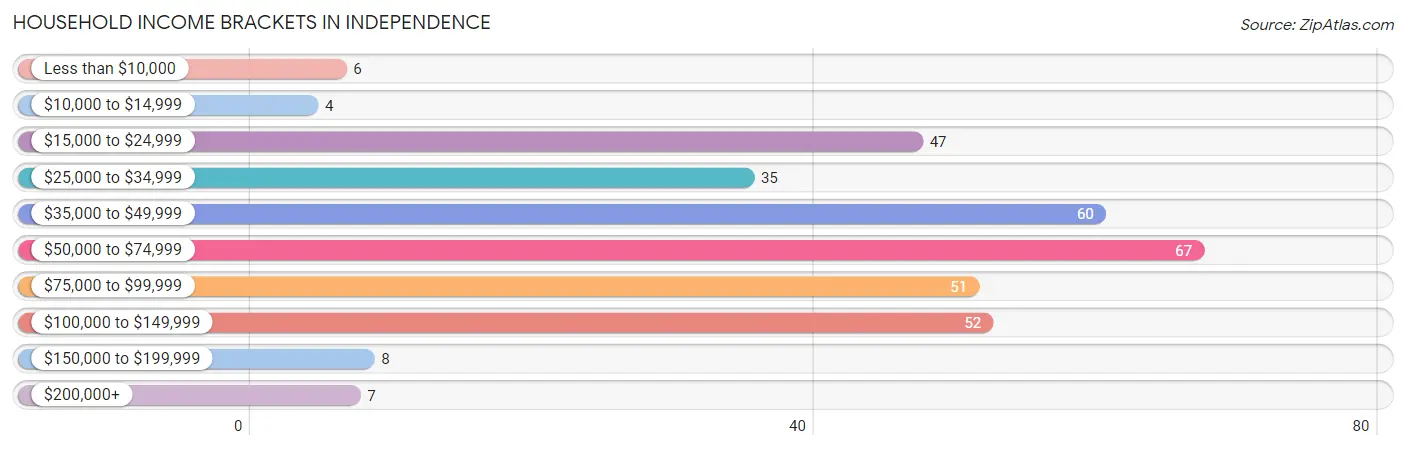
| Income Bracket | # Households | % Households |
| Less than $10,000 | 6 | 1.8% |
| $10,000 to $14,999 | 4 | 1.2% |
| $15,000 to $24,999 | 47 | 13.9% |
| $25,000 to $34,999 | 35 | 10.4% |
| $35,000 to $49,999 | 60 | 17.8% |
| $50,000 to $74,999 | 67 | 19.9% |
| $75,000 to $99,999 | 51 | 15.1% |
| $100,000 to $149,999 | 52 | 15.4% |
| $150,000 to $199,999 | 8 | 2.4% |
| $200,000+ | 7 | 2.1% |
Household Income by Householder Age in Independence
The median household income in Independence is $57,917, with the highest median household income of $85,268 found in the 45 to 64 years age bracket for the primary householder. A total of 83 households (24.6%) fall into this category. Meanwhile, the 15 to 24 years age bracket for the primary householder has the lowest median household income of $0, with 3 households (0.9%) in this group.
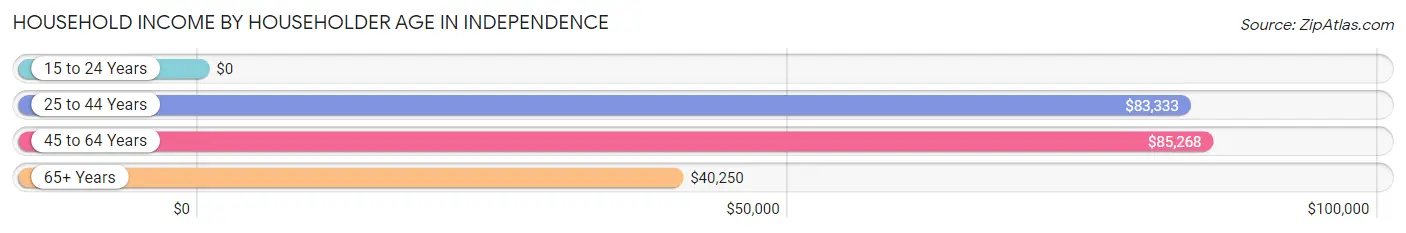
| Income Bracket | # Households | Median Income |
| 15 to 24 Years | 3 (0.9%) | $0 |
| 25 to 44 Years | 88 (26.1%) | $83,333 |
| 45 to 64 Years | 83 (24.6%) | $85,268 |
| 65+ Years | 163 (48.4%) | $40,250 |
| Total | 337 (100.0%) | $57,917 |
Poverty in Independence
Income Below Poverty by Sex and Age in Independence
With 10.3% poverty level for males and 5.7% for females among the residents of Independence, 6 to 11 year old males and 5 year old females are the most vulnerable to poverty, with 9 males (25.0%) and 1 females (100.0%) in their respective age groups living below the poverty level.
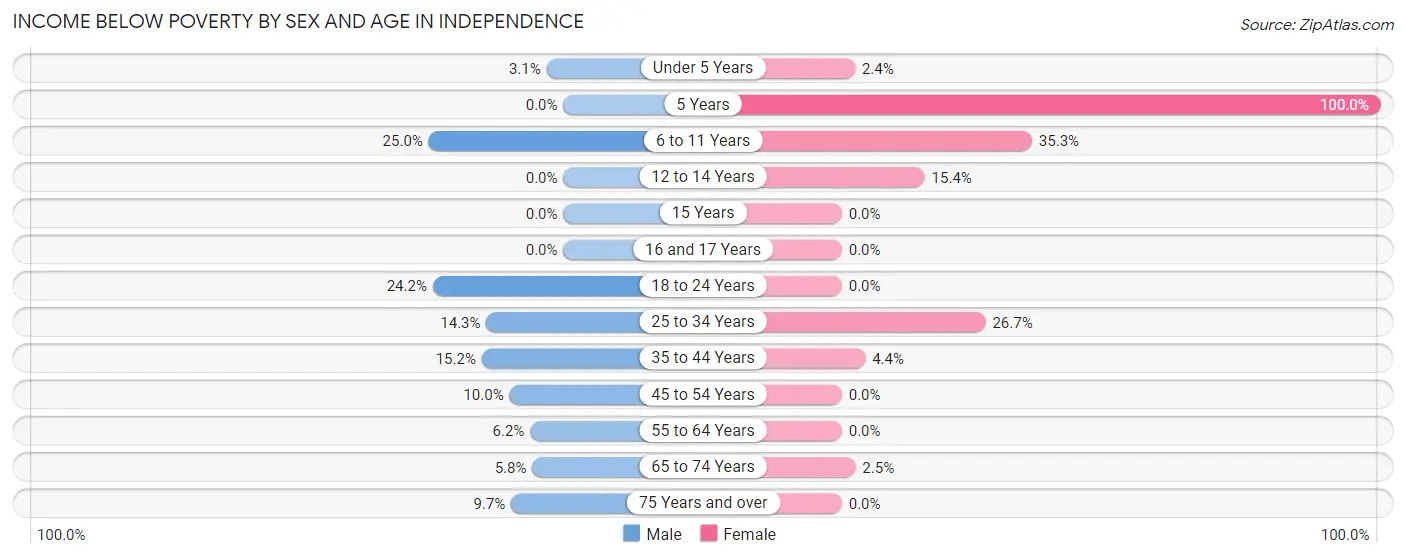
| Age Bracket | Male | Female |
| Under 5 Years | 1 (3.1%) | 1 (2.4%) |
| 5 Years | 0 (0.0%) | 1 (100.0%) |
| 6 to 11 Years | 9 (25.0%) | 6 (35.3%) |
| 12 to 14 Years | 0 (0.0%) | 2 (15.4%) |
| 15 Years | 0 (0.0%) | 0 (0.0%) |
| 16 and 17 Years | 0 (0.0%) | 0 (0.0%) |
| 18 to 24 Years | 8 (24.2%) | 0 (0.0%) |
| 25 to 34 Years | 3 (14.3%) | 8 (26.7%) |
| 35 to 44 Years | 10 (15.1%) | 2 (4.3%) |
| 45 to 54 Years | 2 (10.0%) | 0 (0.0%) |
| 55 to 64 Years | 4 (6.1%) | 0 (0.0%) |
| 65 to 74 Years | 3 (5.8%) | 2 (2.5%) |
| 75 Years and over | 3 (9.7%) | 0 (0.0%) |
| Total | 43 (10.3%) | 22 (5.7%) |
Income Above Poverty by Sex and Age in Independence
According to the poverty statistics in Independence, males aged 12 to 14 years and females aged 15 years are the age groups that are most secure financially, with 100.0% of males and 100.0% of females in these age groups living above the poverty line.
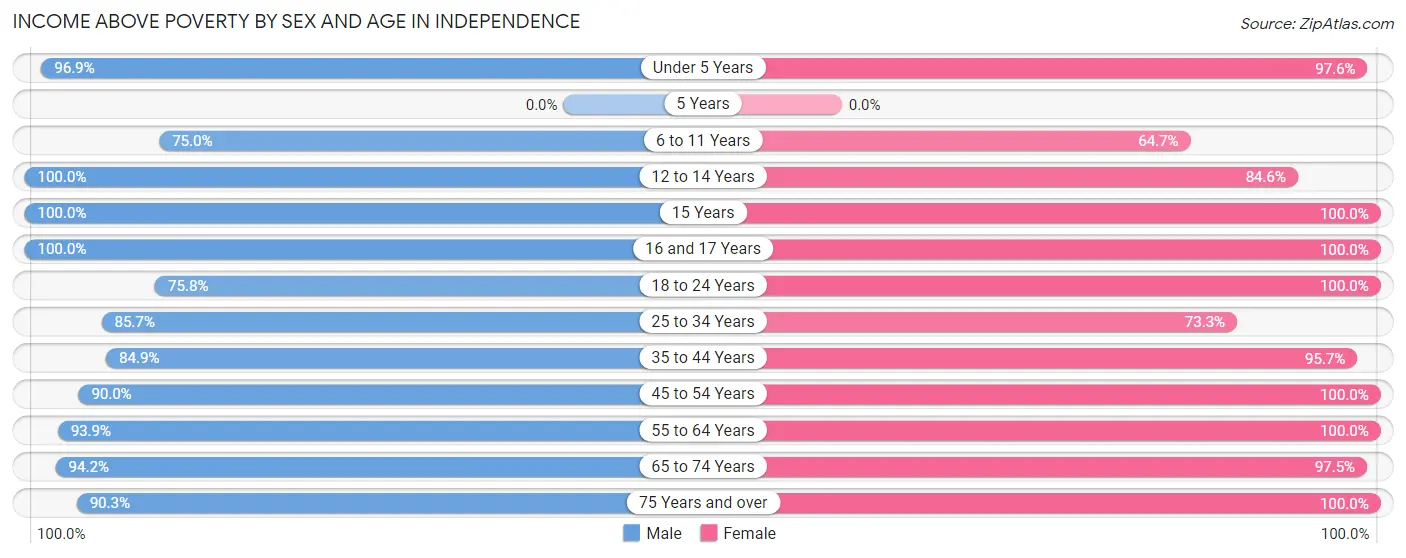
| Age Bracket | Male | Female |
| Under 5 Years | 31 (96.9%) | 40 (97.6%) |
| 5 Years | 0 (0.0%) | 0 (0.0%) |
| 6 to 11 Years | 27 (75.0%) | 11 (64.7%) |
| 12 to 14 Years | 25 (100.0%) | 11 (84.6%) |
| 15 Years | 21 (100.0%) | 9 (100.0%) |
| 16 and 17 Years | 17 (100.0%) | 3 (100.0%) |
| 18 to 24 Years | 25 (75.8%) | 10 (100.0%) |
| 25 to 34 Years | 18 (85.7%) | 22 (73.3%) |
| 35 to 44 Years | 56 (84.9%) | 44 (95.7%) |
| 45 to 54 Years | 18 (90.0%) | 22 (100.0%) |
| 55 to 64 Years | 61 (93.9%) | 63 (100.0%) |
| 65 to 74 Years | 49 (94.2%) | 77 (97.5%) |
| 75 Years and over | 28 (90.3%) | 52 (100.0%) |
| Total | 376 (89.7%) | 364 (94.3%) |
Income Below Poverty Among Married-Couple Families in Independence
The poverty statistics for married-couple families in Independence show that 2.6% or 3 of the total 113 families live below the poverty line. Families with 3 or 4 children have the highest poverty rate of 9.1%, comprising of 1 families. On the other hand, families with no children have the lowest poverty rate of 0.0%, which includes 0 families.
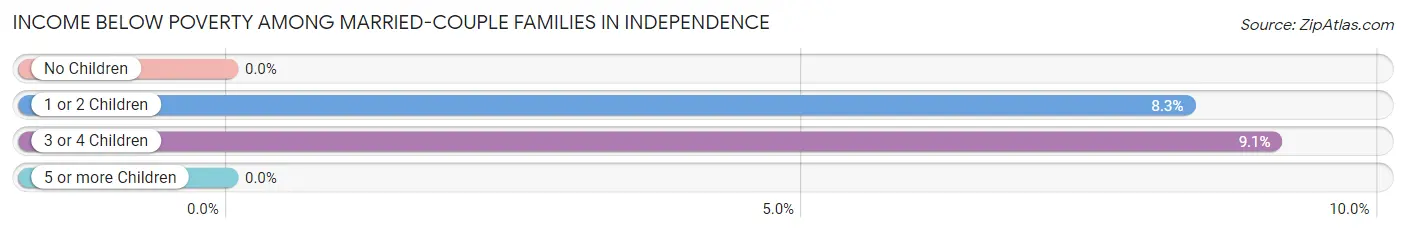
| Children | Above Poverty | Below Poverty |
| No Children | 78 (100.0%) | 0 (0.0%) |
| 1 or 2 Children | 22 (91.7%) | 2 (8.3%) |
| 3 or 4 Children | 10 (90.9%) | 1 (9.1%) |
| 5 or more Children | 0 (0.0%) | 0 (0.0%) |
| Total | 110 (97.4%) | 3 (2.6%) |
Income Below Poverty Among Single-Parent Households in Independence
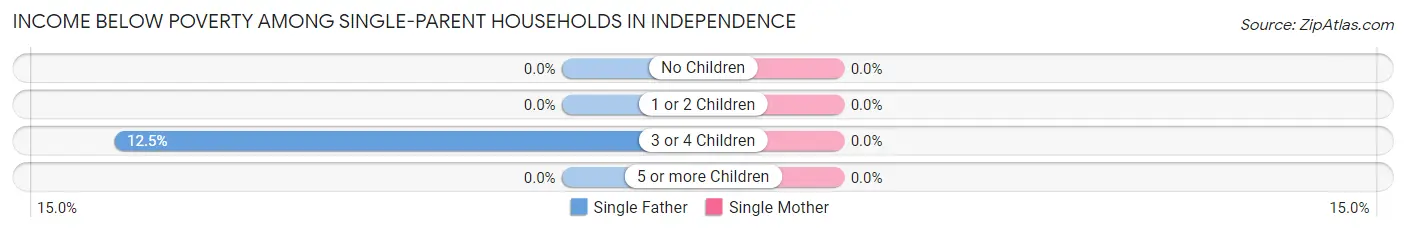
| Children | Single Father | Single Mother |
| No Children | 0 (0.0%) | 0 (0.0%) |
| 1 or 2 Children | 0 (0.0%) | 0 (0.0%) |
| 3 or 4 Children | 2 (12.5%) | 0 (0.0%) |
| 5 or more Children | 0 (0.0%) | 0 (0.0%) |
| Total | 2 (6.7%) | 0 (0.0%) |
Income Below Poverty Among Married-Couple vs Single-Parent Households in Independence
The poverty data for Independence shows that 3 of the married-couple family households (2.6%) and 2 of the single-parent households (4.6%) are living below the poverty level. Within the married-couple family households, those with 3 or 4 children have the highest poverty rate, with 1 households (9.1%) falling below the poverty line. Among the single-parent households, those with 3 or 4 children have the highest poverty rate, with 2 household (12.5%) living below poverty.
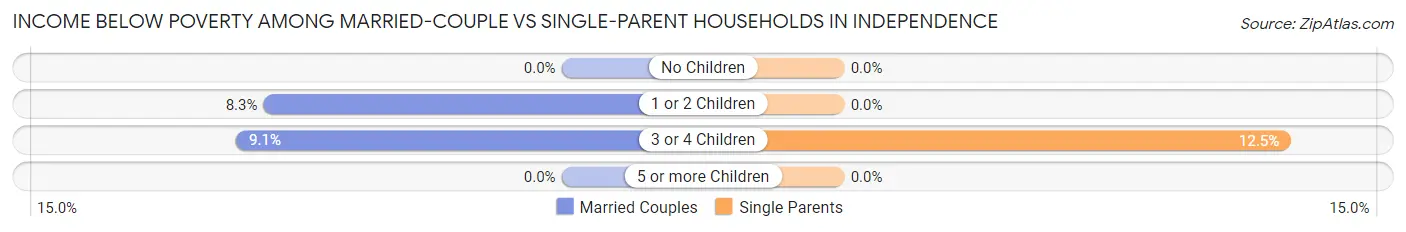
| Children | Married-Couple Families | Single-Parent Households |
| No Children | 0 (0.0%) | 0 (0.0%) |
| 1 or 2 Children | 2 (8.3%) | 0 (0.0%) |
| 3 or 4 Children | 1 (9.1%) | 2 (12.5%) |
| 5 or more Children | 0 (0.0%) | 0 (0.0%) |
| Total | 3 (2.6%) | 2 (4.6%) |
Race in Independence
The most populous races in Independence are White / Caucasian (561 | 66.0%), Two or more Races (121 | 14.2%), and Hispanic or Latino (100 | 11.8%).
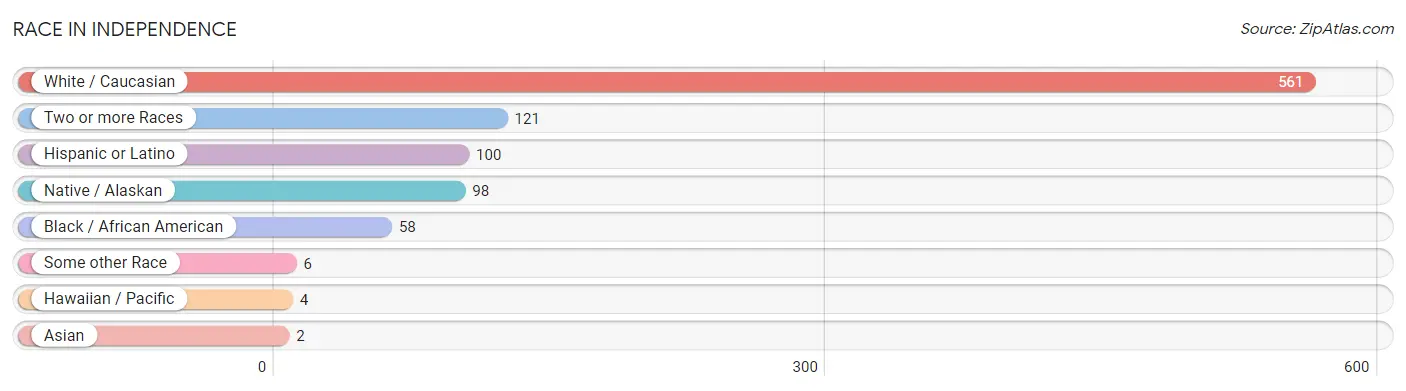
| Race | # Population | % Population |
| Asian | 2 | 0.2% |
| Black / African American | 58 | 6.8% |
| Hawaiian / Pacific | 4 | 0.5% |
| Hispanic or Latino | 100 | 11.8% |
| Native / Alaskan | 98 | 11.5% |
| White / Caucasian | 561 | 66.0% |
| Two or more Races | 121 | 14.2% |
| Some other Race | 6 | 0.7% |
| Total | 850 | 100.0% |
Ancestry in Independence
The most populous ancestries reported in Independence are German (129 | 15.2%), American (92 | 10.8%), English (92 | 10.8%), Mexican (72 | 8.5%), and Paiute (63 | 7.4%), together accounting for 52.7% of all Independence residents.
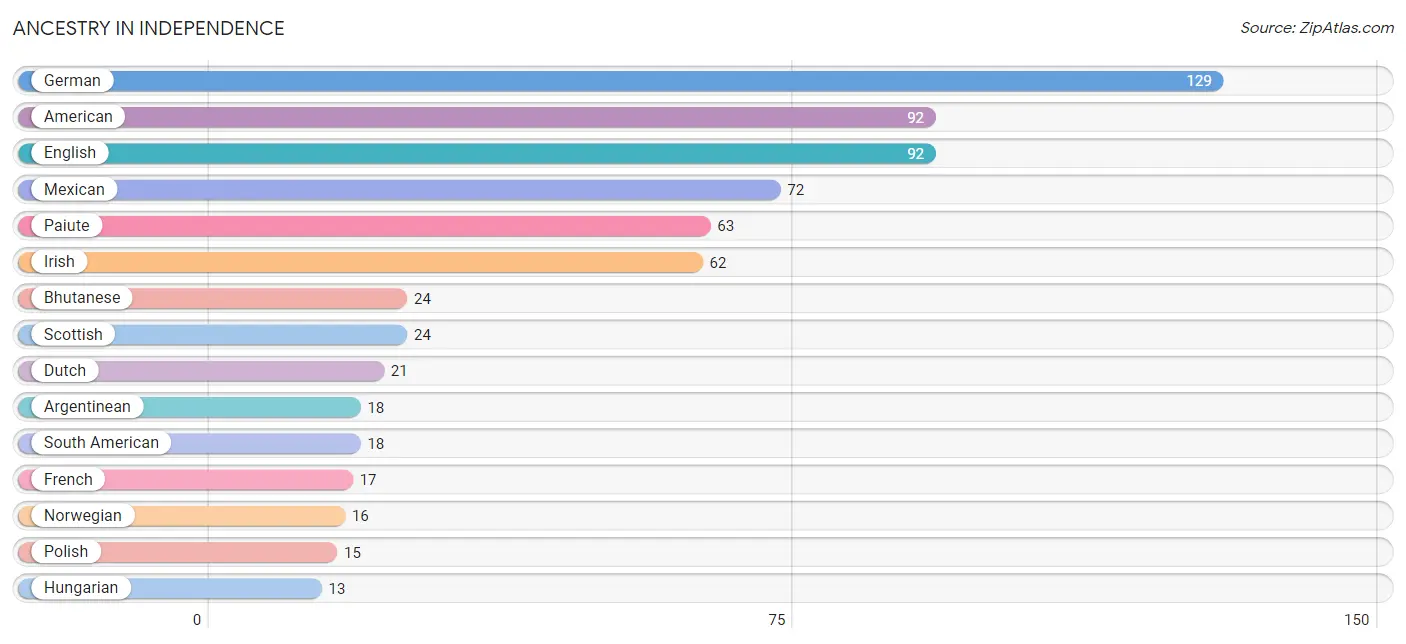
| Ancestry | # Population | % Population |
| American | 92 | 10.8% |
| Argentinean | 18 | 2.1% |
| Bhutanese | 24 | 2.8% |
| British | 9 | 1.1% |
| Celtic | 2 | 0.2% |
| Central American | 1 | 0.1% |
| Chippewa | 8 | 0.9% |
| Comanche | 3 | 0.4% |
| Czech | 1 | 0.1% |
| Danish | 7 | 0.8% |
| Dutch | 21 | 2.5% |
| Eastern European | 9 | 1.1% |
| English | 92 | 10.8% |
| Finnish | 2 | 0.2% |
| French | 17 | 2.0% |
| German | 129 | 15.2% |
| Hungarian | 13 | 1.5% |
| Indian (Asian) | 2 | 0.2% |
| Irish | 62 | 7.3% |
| Italian | 7 | 0.8% |
| Latvian | 3 | 0.4% |
| Lithuanian | 5 | 0.6% |
| Mexican | 72 | 8.5% |
| Navajo | 3 | 0.4% |
| Nicaraguan | 1 | 0.1% |
| Northern European | 2 | 0.2% |
| Norwegian | 16 | 1.9% |
| Paiute | 63 | 7.4% |
| Pima | 2 | 0.2% |
| Polish | 15 | 1.8% |
| Portuguese | 3 | 0.4% |
| Puerto Rican | 8 | 0.9% |
| Scandinavian | 5 | 0.6% |
| Scotch-Irish | 4 | 0.5% |
| Scottish | 24 | 2.8% |
| Sioux | 9 | 1.1% |
| South American | 18 | 2.1% |
| Swedish | 6 | 0.7% |
| Swiss | 7 | 0.8% |
| Ukrainian | 3 | 0.4% |
| Welsh | 2 | 0.2% | View All 41 Rows |
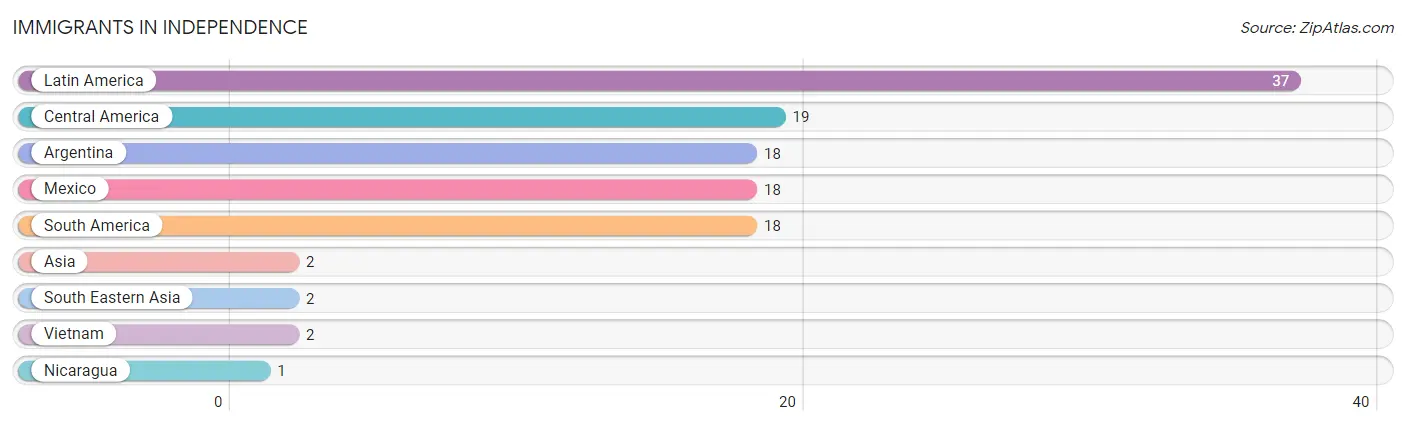
Immigrants in Independence
The most numerous immigrant groups reported in Independence came from Latin America (37 | 4.3%), Central America (19 | 2.2%), Argentina (18 | 2.1%), Mexico (18 | 2.1%), and South America (18 | 2.1%), together accounting for 13.0% of all Independence residents.
| Immigration Origin | # Population | % Population |
| Argentina | 18 | 2.1% |
| Asia | 2 | 0.2% |
| Central America | 19 | 2.2% |
| Latin America | 37 | 4.3% |
| Mexico | 18 | 2.1% |
| Nicaragua | 1 | 0.1% |
| South America | 18 | 2.1% |
| South Eastern Asia | 2 | 0.2% |
| Vietnam | 2 | 0.2% | View All 9 Rows |
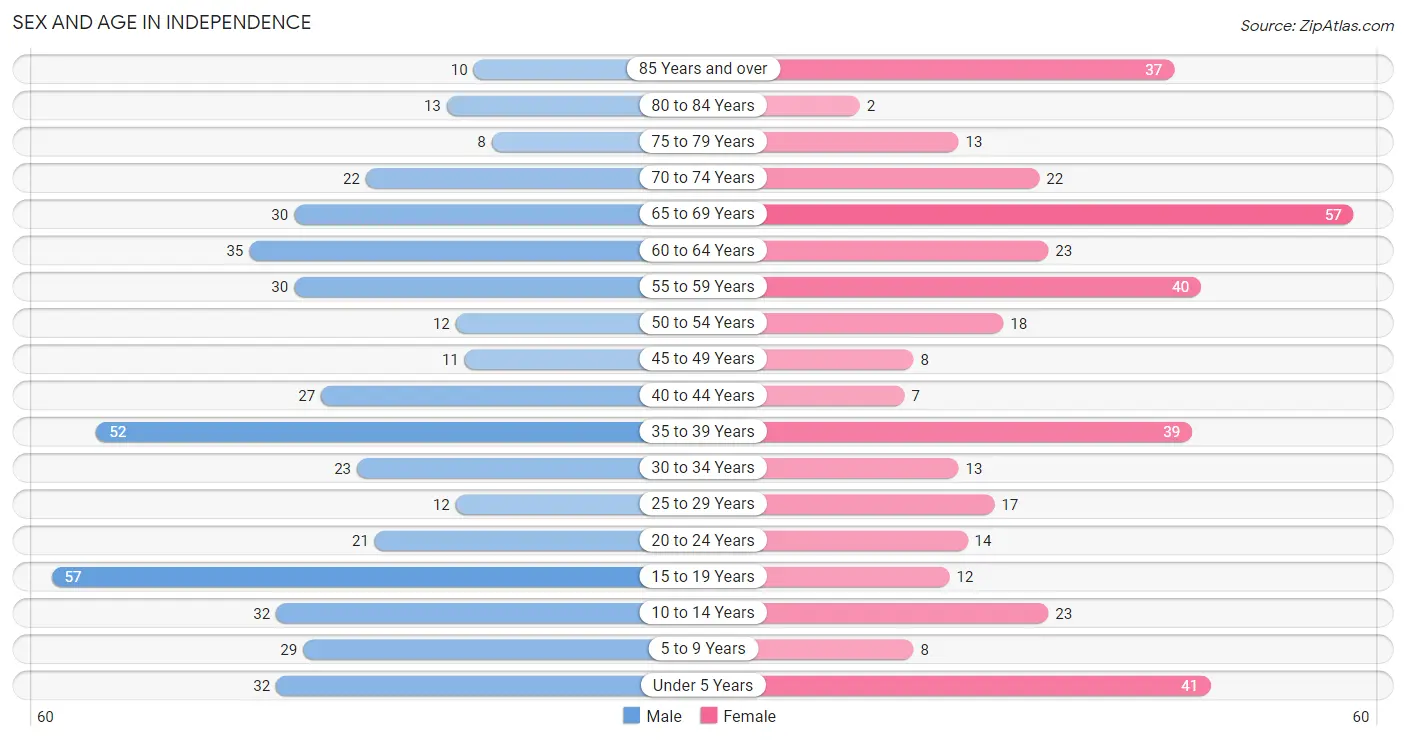
Sex and Age in Independence
Sex and Age in Independence
The most populous age groups in Independence are 15 to 19 Years (57 | 12.5%) for men and 65 to 69 Years (57 | 14.5%) for women.
| Age Bracket | Male | Female |
| Under 5 Years | 32 (7.0%) | 41 (10.4%) |
| 5 to 9 Years | 29 (6.4%) | 8 (2.0%) |
| 10 to 14 Years | 32 (7.0%) | 23 (5.8%) |
| 15 to 19 Years | 57 (12.5%) | 12 (3.0%) |
| 20 to 24 Years | 21 (4.6%) | 14 (3.5%) |
| 25 to 29 Years | 12 (2.6%) | 17 (4.3%) |
| 30 to 34 Years | 23 (5.0%) | 13 (3.3%) |
| 35 to 39 Years | 52 (11.4%) | 39 (9.9%) |
| 40 to 44 Years | 27 (5.9%) | 7 (1.8%) |
| 45 to 49 Years | 11 (2.4%) | 8 (2.0%) |
| 50 to 54 Years | 12 (2.6%) | 18 (4.6%) |
| 55 to 59 Years | 30 (6.6%) | 40 (10.2%) |
| 60 to 64 Years | 35 (7.7%) | 23 (5.8%) |
| 65 to 69 Years | 30 (6.6%) | 57 (14.5%) |
| 70 to 74 Years | 22 (4.8%) | 22 (5.6%) |
| 75 to 79 Years | 8 (1.8%) | 13 (3.3%) |
| 80 to 84 Years | 13 (2.9%) | 2 (0.5%) |
| 85 Years and over | 10 (2.2%) | 37 (9.4%) |
| Total | 456 (100.0%) | 394 (100.0%) |
Families and Households in Independence
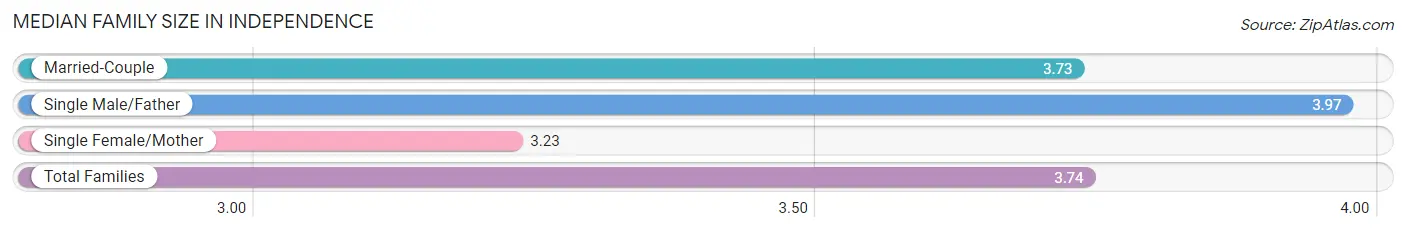
Median Family Size in Independence
The median family size in Independence is 3.74 persons per family, with single male/father families (30 | 19.2%) accounting for the largest median family size of 3.97 persons per family. On the other hand, single female/mother families (13 | 8.3%) represent the smallest median family size with 3.23 persons per family.
| Family Type | # Families | Family Size |
| Married-Couple | 113 (72.4%) | 3.73 |
| Single Male/Father | 30 (19.2%) | 3.97 |
| Single Female/Mother | 13 (8.3%) | 3.23 |
| Total Families | 156 (100.0%) | 3.74 |
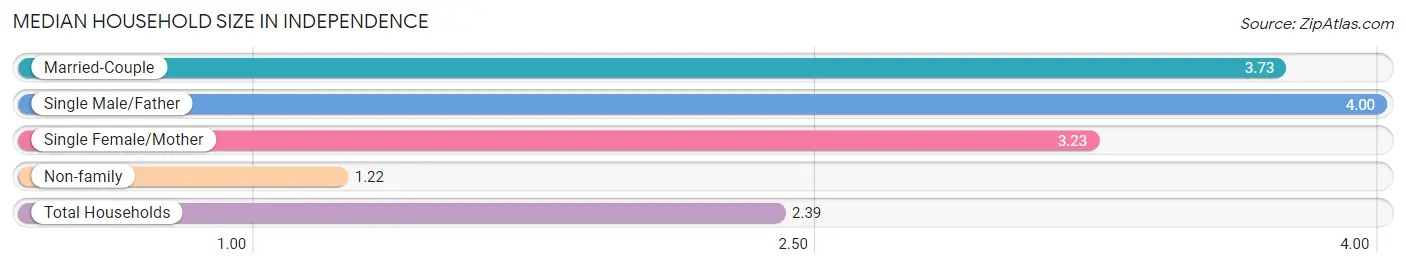
Median Household Size in Independence
The median household size in Independence is 2.39 persons per household, with single male/father households (30 | 8.9%) accounting for the largest median household size of 4 persons per household. non-family households (181 | 53.7%) represent the smallest median household size with 1.22 persons per household.
| Household Type | # Households | Household Size |
| Married-Couple | 113 (33.5%) | 3.73 |
| Single Male/Father | 30 (8.9%) | 4.00 |
| Single Female/Mother | 13 (3.9%) | 3.23 |
| Non-family | 181 (53.7%) | 1.22 |
| Total Households | 337 (100.0%) | 2.39 |
Household Size by Marriage Status in Independence
Out of a total of 337 households in Independence, 156 (46.3%) are family households, while 181 (53.7%) are nonfamily households. The most numerous type of family households are 2-person households, comprising 88, and the most common type of nonfamily households are 1-person households, comprising 152.
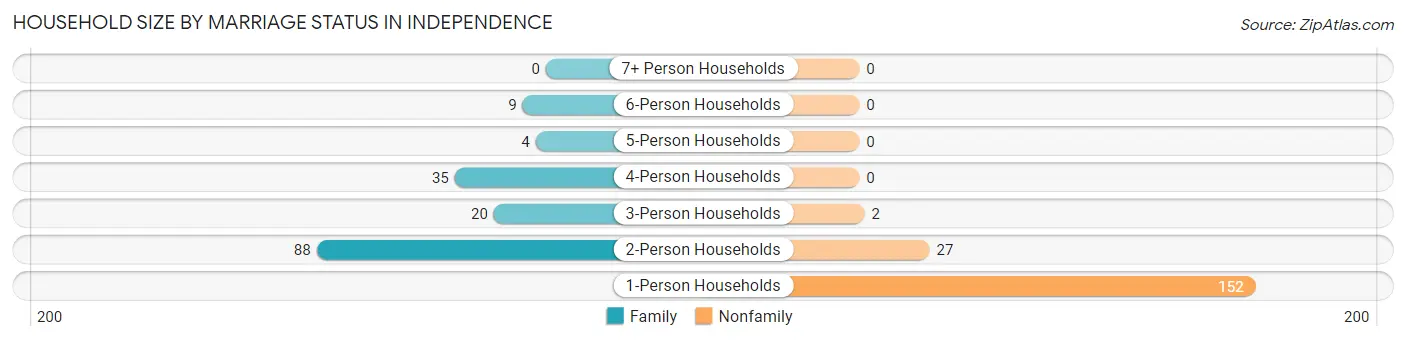
| Household Size | Family Households | Nonfamily Households |
| 1-Person Households | - | 152 (45.1%) |
| 2-Person Households | 88 (26.1%) | 27 (8.0%) |
| 3-Person Households | 20 (5.9%) | 2 (0.6%) |
| 4-Person Households | 35 (10.4%) | 0 (0.0%) |
| 5-Person Households | 4 (1.2%) | 0 (0.0%) |
| 6-Person Households | 9 (2.7%) | 0 (0.0%) |
| 7+ Person Households | 0 (0.0%) | 0 (0.0%) |
| Total | 156 (46.3%) | 181 (53.7%) |
Female Fertility in Independence
Fertility by Age in Independence
Average fertility rate in Independence is 118.0 births per 1,000 women. Women in the age bracket of 20 to 34 years have the highest fertility rate with 136.0 births per 1,000 women. Women in the age bracket of 35 to 50 years acount for 57.1% of all women with births.
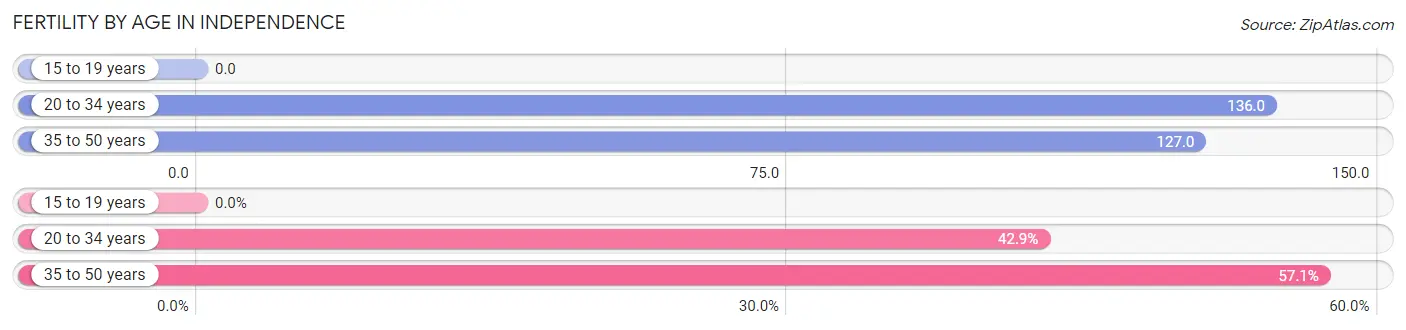
| Age Bracket | Women with Births | Births / 1,000 Women |
| 15 to 19 years | 0 (0.0%) | 0.0 |
| 20 to 34 years | 6 (42.9%) | 136.0 |
| 35 to 50 years | 8 (57.1%) | 127.0 |
| Total | 14 (100.0%) | 118.0 |
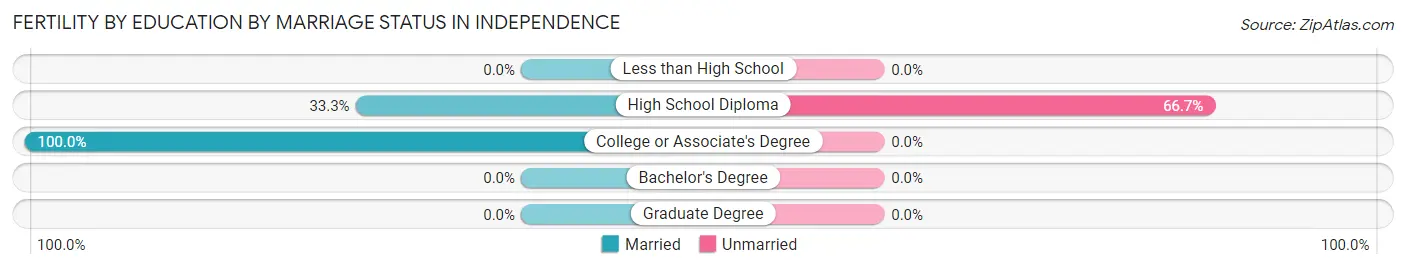
Fertility by Age by Marriage Status in Independence
71.4% of women with births (14) in Independence are married. The highest percentage of unmarried women with births falls into 20 to 34 years age bracket with 66.7% of them unmarried at the time of birth, while the lowest percentage of unmarried women with births belong to 35 to 50 years age bracket with 0.0% of them unmarried.
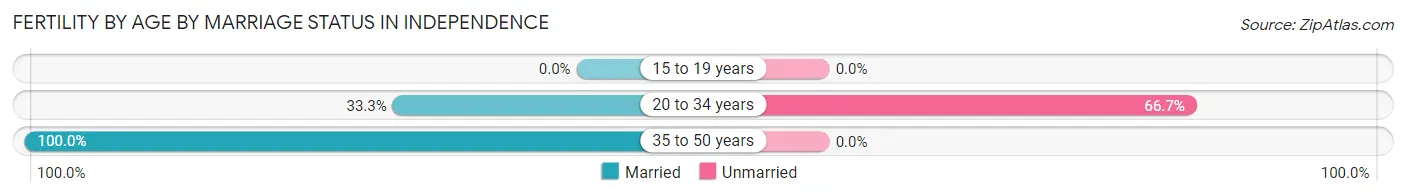
| Age Bracket | Married | Unmarried |
| 15 to 19 years | 0 (0.0%) | 0 (0.0%) |
| 20 to 34 years | 2 (33.3%) | 4 (66.7%) |
| 35 to 50 years | 8 (100.0%) | 0 (0.0%) |
| Total | 10 (71.4%) | 4 (28.6%) |
Fertility by Education in Independence
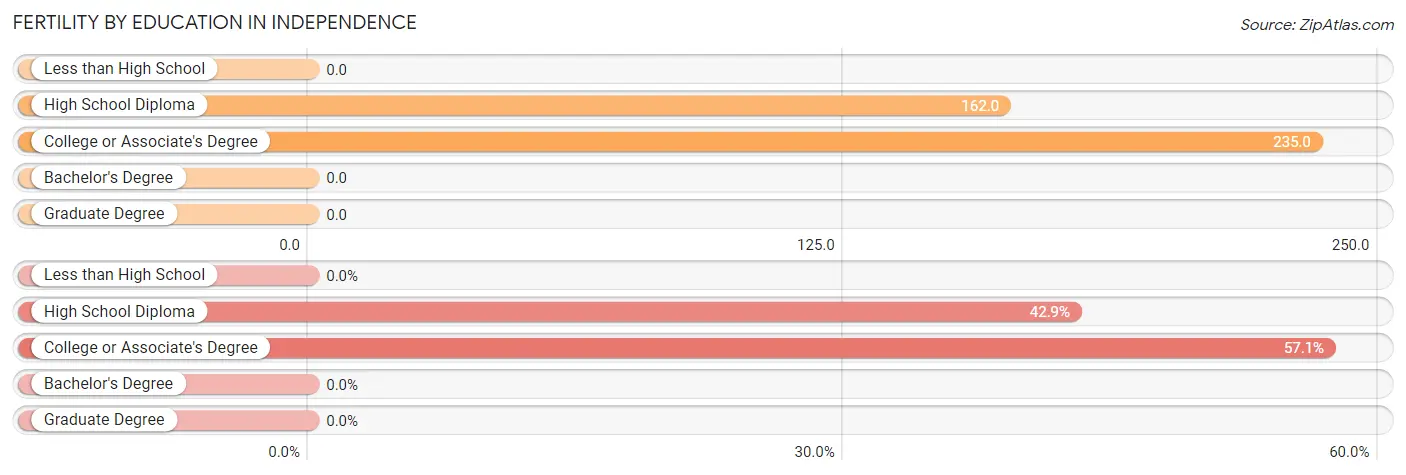
| Educational Attainment | Women with Births | Births / 1,000 Women |
| Less than High School | 0 (0.0%) | 0.0 |
| High School Diploma | 6 (42.9%) | 162.0 |
| College or Associate's Degree | 8 (57.1%) | 235.0 |
| Bachelor's Degree | 0 (0.0%) | 0.0 |
| Graduate Degree | 0 (0.0%) | 0.0 |
| Total | 14 (100.0%) | 118.0 |
Fertility by Education by Marriage Status in Independence
28.6% of women with births in Independence are unmarried. Women with the educational attainment of college or associate's degree are most likely to be married with 100.0% of them married at childbirth, while women with the educational attainment of high school diploma are least likely to be married with 66.7% of them unmarried at childbirth.
| Educational Attainment | Married | Unmarried |
| Less than High School | 0 (0.0%) | 0 (0.0%) |
| High School Diploma | 2 (33.3%) | 4 (66.7%) |
| College or Associate's Degree | 8 (100.0%) | 0 (0.0%) |
| Bachelor's Degree | 0 (0.0%) | 0 (0.0%) |
| Graduate Degree | 0 (0.0%) | 0 (0.0%) |
| Total | 10 (71.4%) | 4 (28.6%) |
Employment Characteristics in Independence
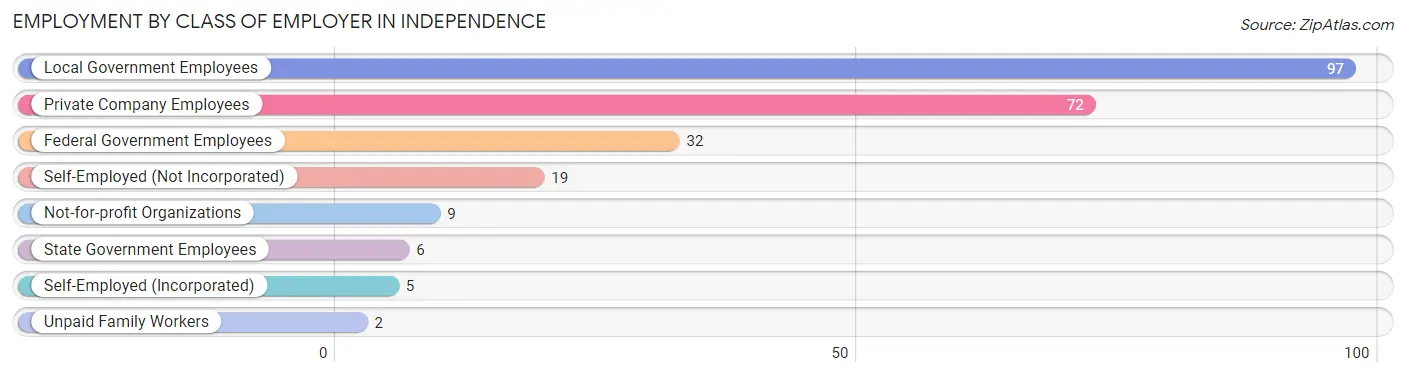
Employment by Class of Employer in Independence
Among the 242 employed individuals in Independence, local government employees (97 | 40.1%), private company employees (72 | 29.7%), and federal government employees (32 | 13.2%) make up the most common classes of employment.
| Employer Class | # Employees | % Employees |
| Private Company Employees | 72 | 29.7% |
| Self-Employed (Incorporated) | 5 | 2.1% |
| Self-Employed (Not Incorporated) | 19 | 7.9% |
| Not-for-profit Organizations | 9 | 3.7% |
| Local Government Employees | 97 | 40.1% |
| State Government Employees | 6 | 2.5% |
| Federal Government Employees | 32 | 13.2% |
| Unpaid Family Workers | 2 | 0.8% |
| Total | 242 | 100.0% |
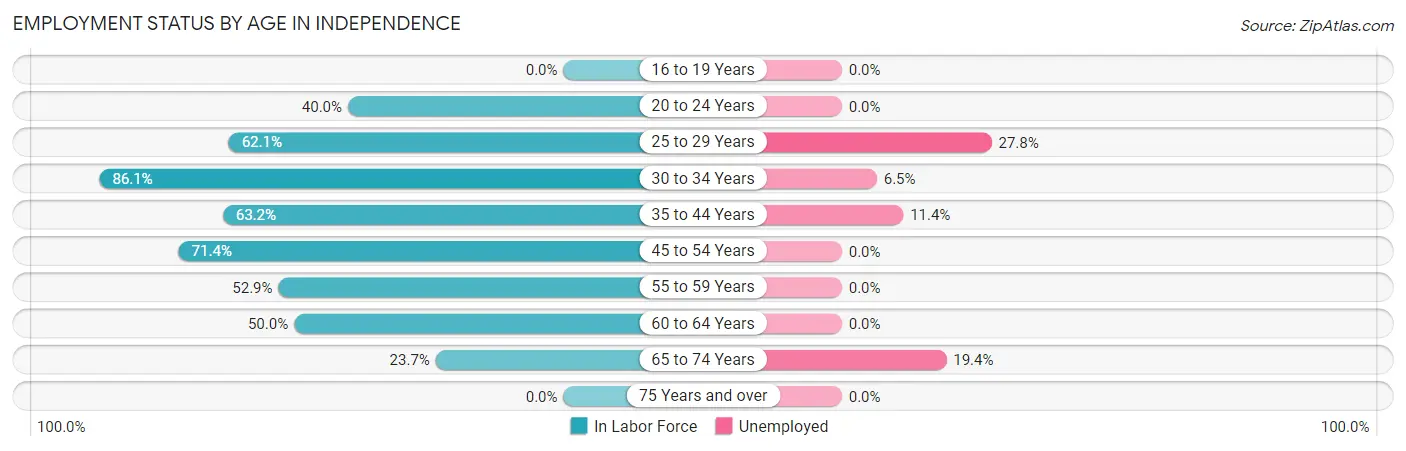
Employment Status by Age in Independence
According to the labor force statistics for Independence, out of the total population over 16 years of age (655), 41.8% or 274 individuals are in the labor force, with 8.0% or 22 of them unemployed. The age group with the highest labor force participation rate is 30 to 34 years, with 86.1% or 31 individuals in the labor force. Within the labor force, the 25 to 29 years age range has the highest percentage of unemployed individuals, with 27.8% or 5 of them being unemployed.
| Age Bracket | In Labor Force | Unemployed |
| 16 to 19 Years | 0 (0.0%) | 0 (0.0%) |
| 20 to 24 Years | 14 (40.0%) | 0 (0.0%) |
| 25 to 29 Years | 18 (62.1%) | 5 (27.8%) |
| 30 to 34 Years | 31 (86.1%) | 2 (6.5%) |
| 35 to 44 Years | 79 (63.2%) | 9 (11.4%) |
| 45 to 54 Years | 35 (71.4%) | 0 (0.0%) |
| 55 to 59 Years | 37 (52.9%) | 0 (0.0%) |
| 60 to 64 Years | 29 (50.0%) | 0 (0.0%) |
| 65 to 74 Years | 31 (23.7%) | 6 (19.4%) |
| 75 Years and over | 0 (0.0%) | 0 (0.0%) |
| Total | 274 (41.8%) | 22 (8.0%) |
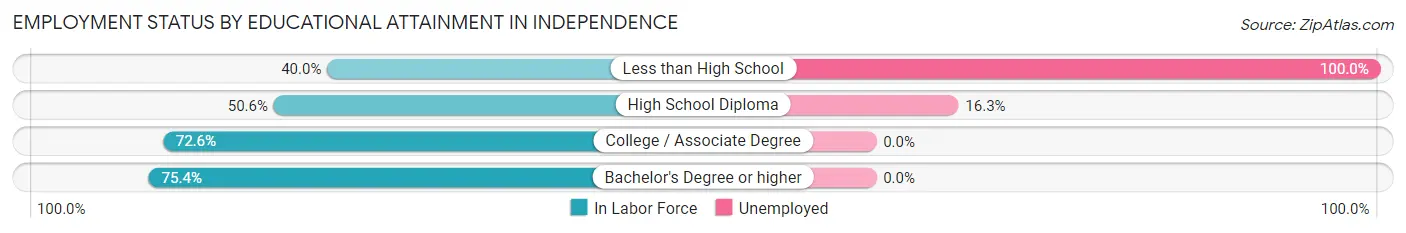
Employment Status by Educational Attainment in Independence
According to labor force statistics for Independence, 62.4% of individuals (229) out of the total population between 25 and 64 years of age (367) are in the labor force, with 7.0% or 16 of them being unemployed. The group with the highest labor force participation rate are those with the educational attainment of bachelor's degree or higher, with 75.4% or 43 individuals in the labor force. Within the labor force, individuals with less than high school education have the highest percentage of unemployment, with 100.0% or 2 of them being unemployed.
| Educational Attainment | In Labor Force | Unemployed |
| Less than High School | 2 (40.0%) | 5 (100.0%) |
| High School Diploma | 86 (50.6%) | 28 (16.3%) |
| College / Associate Degree | 98 (72.6%) | 0 (0.0%) |
| Bachelor's Degree or higher | 43 (75.4%) | 0 (0.0%) |
| Total | 229 (62.4%) | 26 (7.0%) |
Employment Occupations by Sex in Independence
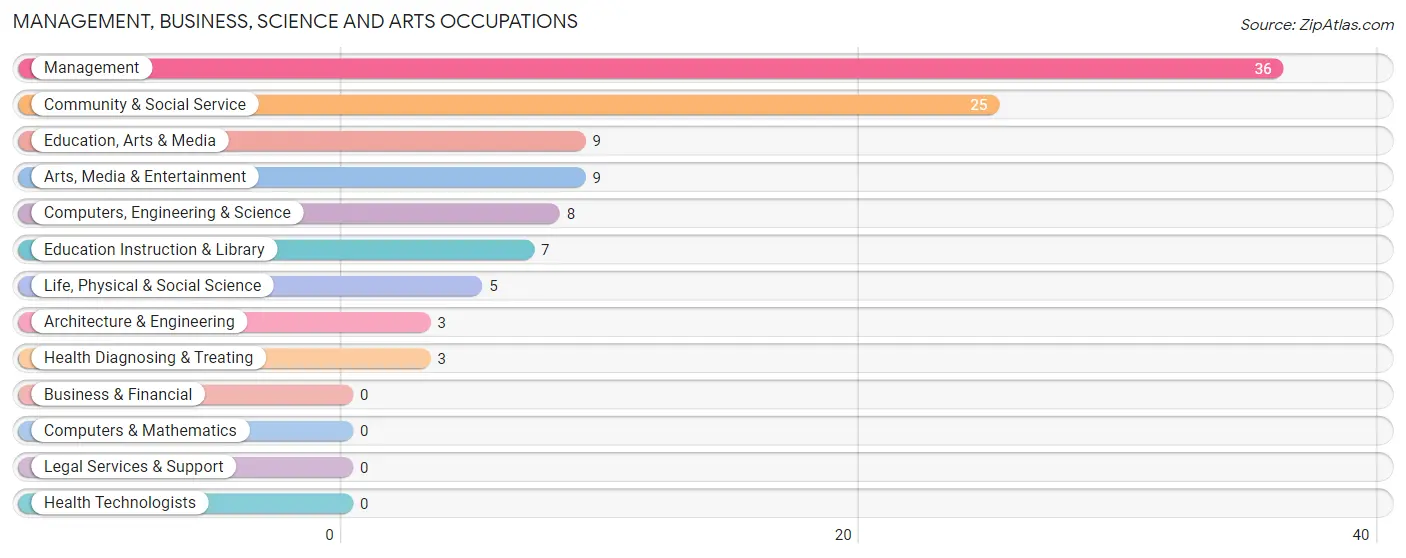
Management, Business, Science and Arts Occupations
The most common Management, Business, Science and Arts occupations in Independence are Management (36 | 14.3%), Community & Social Service (25 | 9.9%), Education, Arts & Media (9 | 3.6%), Arts, Media & Entertainment (9 | 3.6%), and Computers, Engineering & Science (8 | 3.2%).
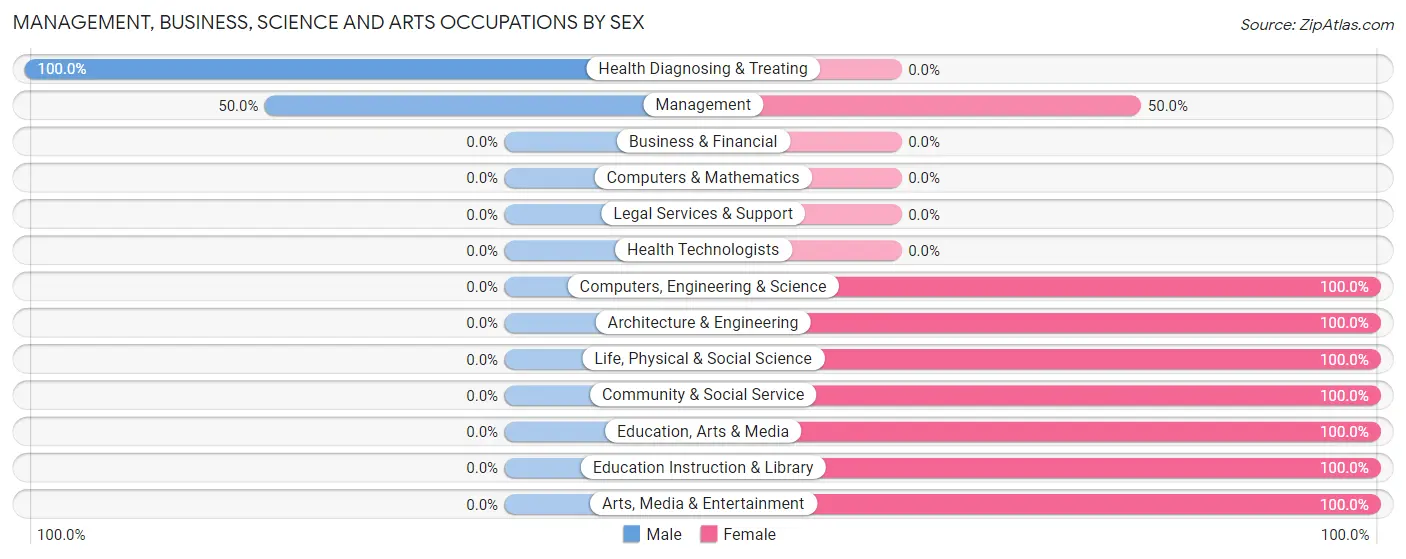
Management, Business, Science and Arts Occupations by Sex
Within the Management, Business, Science and Arts occupations in Independence, the most male-oriented occupations are Health Diagnosing & Treating (100.0%), and Management (50.0%), while the most female-oriented occupations are Computers, Engineering & Science (100.0%), Architecture & Engineering (100.0%), and Life, Physical & Social Science (100.0%).
| Occupation | Male | Female |
| Management | 18 (50.0%) | 18 (50.0%) |
| Business & Financial | 0 (0.0%) | 0 (0.0%) |
| Computers, Engineering & Science | 0 (0.0%) | 8 (100.0%) |
| Computers & Mathematics | 0 (0.0%) | 0 (0.0%) |
| Architecture & Engineering | 0 (0.0%) | 3 (100.0%) |
| Life, Physical & Social Science | 0 (0.0%) | 5 (100.0%) |
| Community & Social Service | 0 (0.0%) | 25 (100.0%) |
| Education, Arts & Media | 0 (0.0%) | 9 (100.0%) |
| Legal Services & Support | 0 (0.0%) | 0 (0.0%) |
| Education Instruction & Library | 0 (0.0%) | 7 (100.0%) |
| Arts, Media & Entertainment | 0 (0.0%) | 9 (100.0%) |
| Health Diagnosing & Treating | 3 (100.0%) | 0 (0.0%) |
| Health Technologists | 0 (0.0%) | 0 (0.0%) |
| Total (Category) | 21 (29.2%) | 51 (70.8%) |
| Total (Overall) | 136 (54.0%) | 116 (46.0%) |
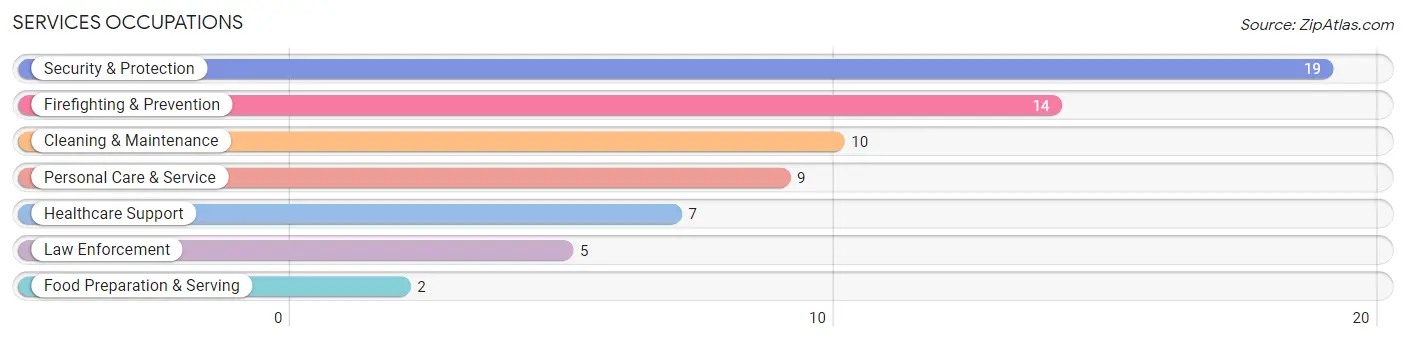
Services Occupations
The most common Services occupations in Independence are Security & Protection (19 | 7.5%), Firefighting & Prevention (14 | 5.6%), Cleaning & Maintenance (10 | 4.0%), Personal Care & Service (9 | 3.6%), and Healthcare Support (7 | 2.8%).
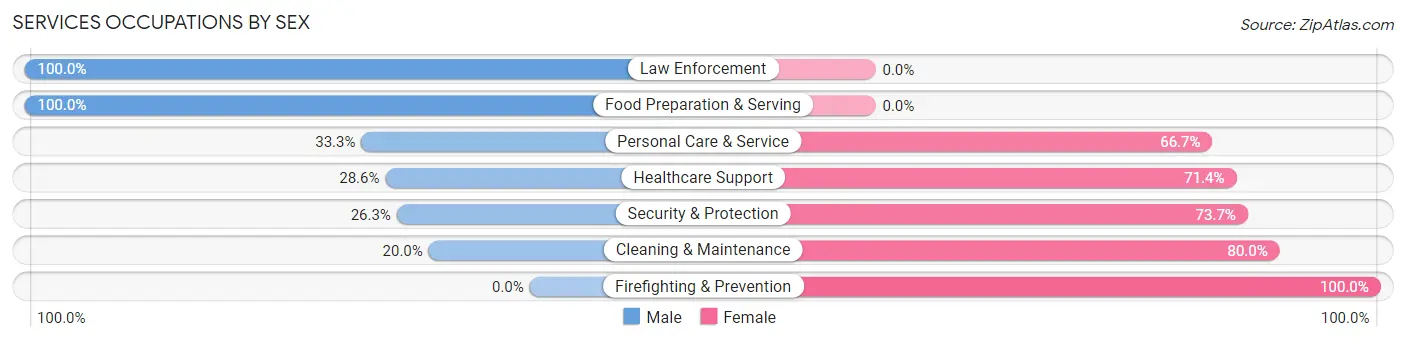
Services Occupations by Sex
Within the Services occupations in Independence, the most male-oriented occupations are Law Enforcement (100.0%), Food Preparation & Serving (100.0%), and Personal Care & Service (33.3%), while the most female-oriented occupations are Firefighting & Prevention (100.0%), Cleaning & Maintenance (80.0%), and Security & Protection (73.7%).
| Occupation | Male | Female |
| Healthcare Support | 2 (28.6%) | 5 (71.4%) |
| Security & Protection | 5 (26.3%) | 14 (73.7%) |
| Firefighting & Prevention | 0 (0.0%) | 14 (100.0%) |
| Law Enforcement | 5 (100.0%) | 0 (0.0%) |
| Food Preparation & Serving | 2 (100.0%) | 0 (0.0%) |
| Cleaning & Maintenance | 2 (20.0%) | 8 (80.0%) |
| Personal Care & Service | 3 (33.3%) | 6 (66.7%) |
| Total (Category) | 14 (29.8%) | 33 (70.2%) |
| Total (Overall) | 136 (54.0%) | 116 (46.0%) |
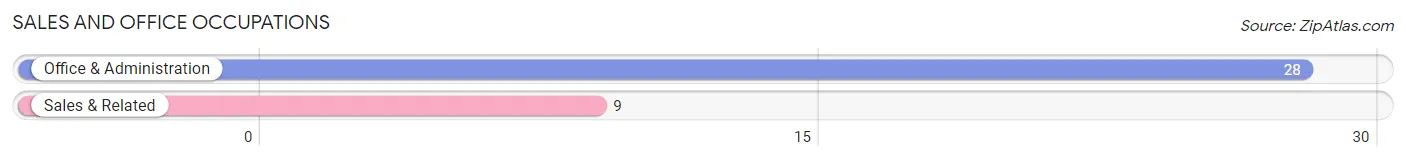
Sales and Office Occupations
The most common Sales and Office occupations in Independence are Office & Administration (28 | 11.1%), and Sales & Related (9 | 3.6%).
Sales and Office Occupations by Sex
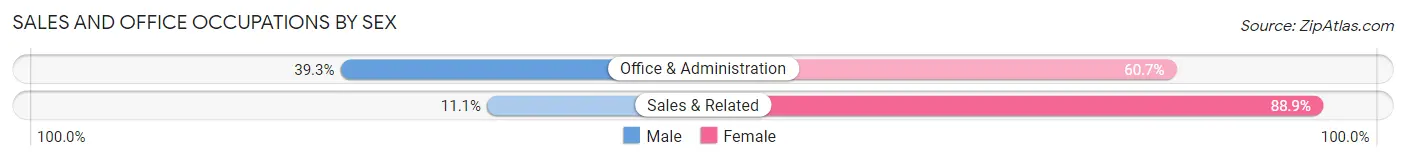
| Occupation | Male | Female |
| Sales & Related | 1 (11.1%) | 8 (88.9%) |
| Office & Administration | 11 (39.3%) | 17 (60.7%) |
| Total (Category) | 12 (32.4%) | 25 (67.6%) |
| Total (Overall) | 136 (54.0%) | 116 (46.0%) |
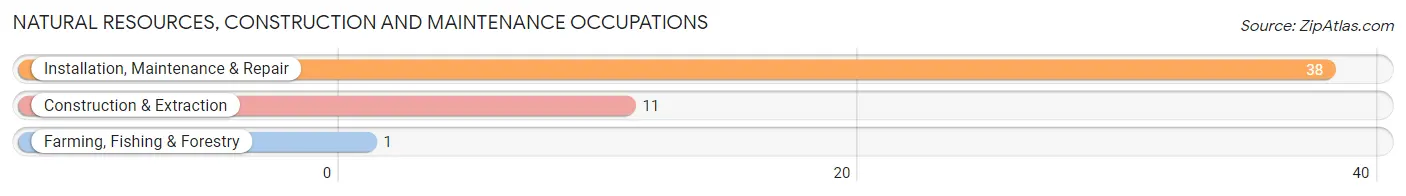
Natural Resources, Construction and Maintenance Occupations
The most common Natural Resources, Construction and Maintenance occupations in Independence are Installation, Maintenance & Repair (38 | 15.1%), Construction & Extraction (11 | 4.4%), and Farming, Fishing & Forestry (1 | 0.4%).
Natural Resources, Construction and Maintenance Occupations by Sex
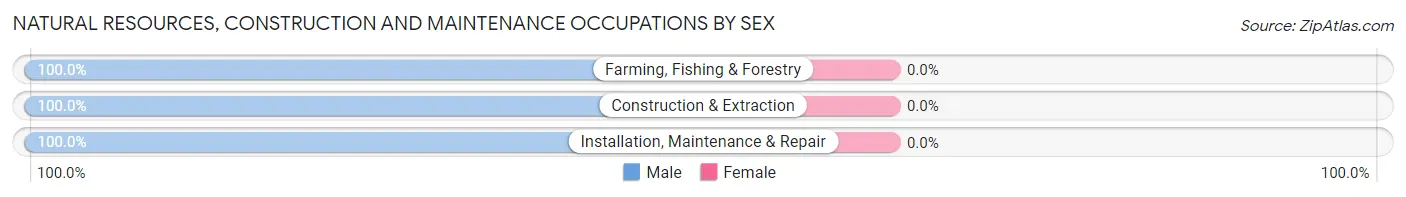
| Occupation | Male | Female |
| Farming, Fishing & Forestry | 1 (100.0%) | 0 (0.0%) |
| Construction & Extraction | 11 (100.0%) | 0 (0.0%) |
| Installation, Maintenance & Repair | 38 (100.0%) | 0 (0.0%) |
| Total (Category) | 50 (100.0%) | 0 (0.0%) |
| Total (Overall) | 136 (54.0%) | 116 (46.0%) |
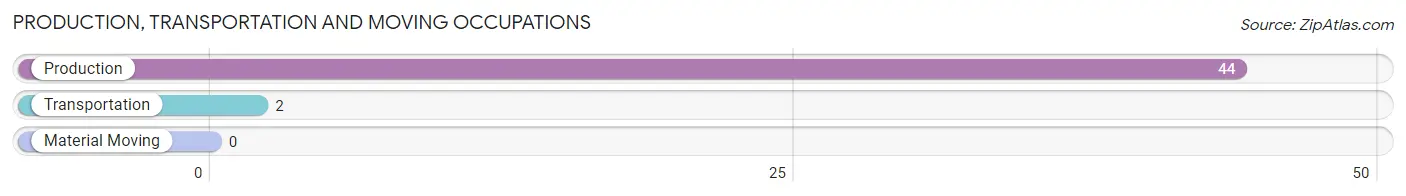
Production, Transportation and Moving Occupations
The most common Production, Transportation and Moving occupations in Independence are Production (44 | 17.5%), and Transportation (2 | 0.8%).
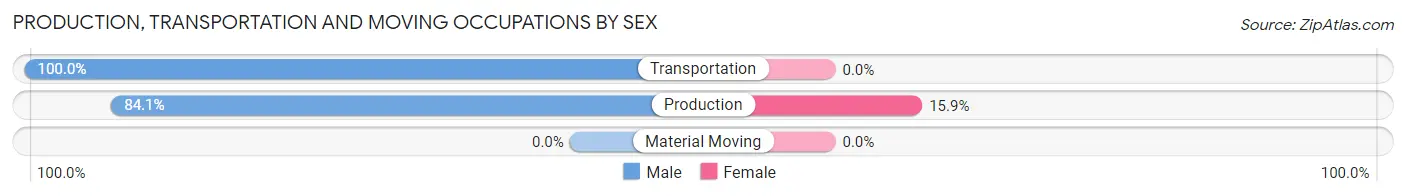
Production, Transportation and Moving Occupations by Sex
| Occupation | Male | Female |
| Production | 37 (84.1%) | 7 (15.9%) |
| Transportation | 2 (100.0%) | 0 (0.0%) |
| Material Moving | 0 (0.0%) | 0 (0.0%) |
| Total (Category) | 39 (84.8%) | 7 (15.2%) |
| Total (Overall) | 136 (54.0%) | 116 (46.0%) |
Employment Industries by Sex in Independence
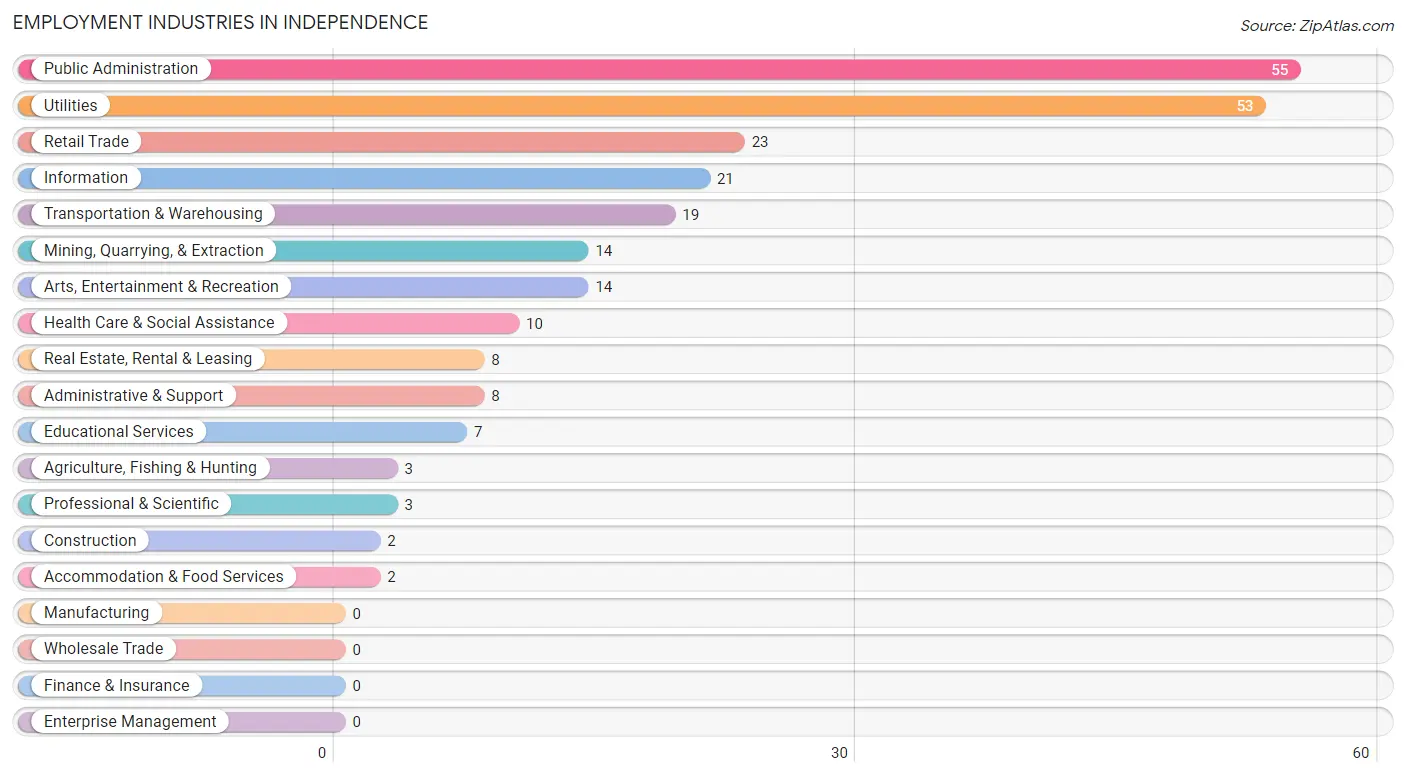
Employment Industries in Independence
The major employment industries in Independence include Public Administration (55 | 21.8%), Utilities (53 | 21.0%), Retail Trade (23 | 9.1%), Information (21 | 8.3%), and Transportation & Warehousing (19 | 7.5%).
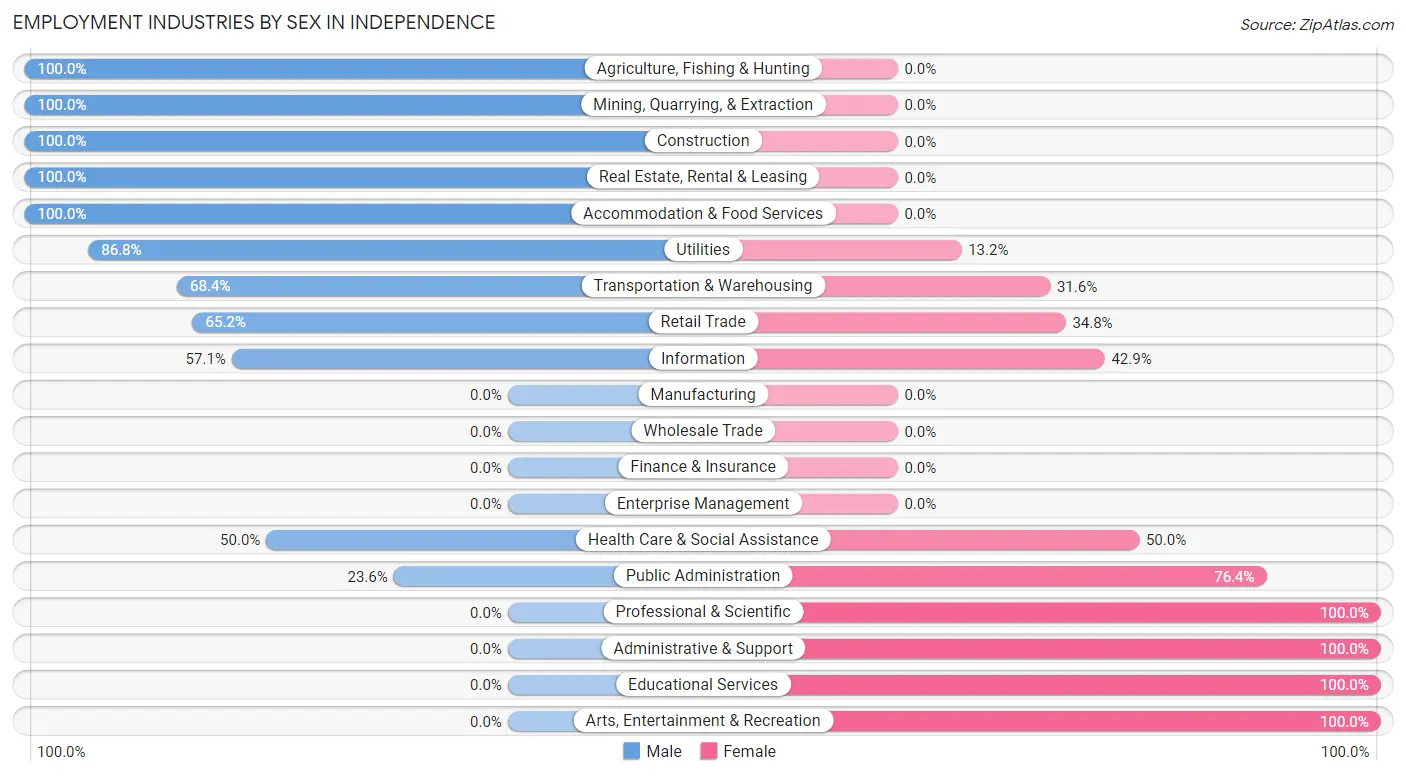
Employment Industries by Sex in Independence
The Independence industries that see more men than women are Agriculture, Fishing & Hunting (100.0%), Mining, Quarrying, & Extraction (100.0%), and Construction (100.0%), whereas the industries that tend to have a higher number of women are Professional & Scientific (100.0%), Administrative & Support (100.0%), and Educational Services (100.0%).
| Industry | Male | Female |
| Agriculture, Fishing & Hunting | 3 (100.0%) | 0 (0.0%) |
| Mining, Quarrying, & Extraction | 14 (100.0%) | 0 (0.0%) |
| Construction | 2 (100.0%) | 0 (0.0%) |
| Manufacturing | 0 (0.0%) | 0 (0.0%) |
| Wholesale Trade | 0 (0.0%) | 0 (0.0%) |
| Retail Trade | 15 (65.2%) | 8 (34.8%) |
| Transportation & Warehousing | 13 (68.4%) | 6 (31.6%) |
| Utilities | 46 (86.8%) | 7 (13.2%) |
| Information | 12 (57.1%) | 9 (42.9%) |
| Finance & Insurance | 0 (0.0%) | 0 (0.0%) |
| Real Estate, Rental & Leasing | 8 (100.0%) | 0 (0.0%) |
| Professional & Scientific | 0 (0.0%) | 3 (100.0%) |
| Enterprise Management | 0 (0.0%) | 0 (0.0%) |
| Administrative & Support | 0 (0.0%) | 8 (100.0%) |
| Educational Services | 0 (0.0%) | 7 (100.0%) |
| Health Care & Social Assistance | 5 (50.0%) | 5 (50.0%) |
| Arts, Entertainment & Recreation | 0 (0.0%) | 14 (100.0%) |
| Accommodation & Food Services | 2 (100.0%) | 0 (0.0%) |
| Public Administration | 13 (23.6%) | 42 (76.4%) |
| Total | 136 (54.0%) | 116 (46.0%) |
Education in Independence
School Enrollment in Independence
The most common levels of schooling among the 201 students in Independence are high school (77 | 38.3%), middle school (39 | 19.4%), and elementary school (29 | 14.4%).
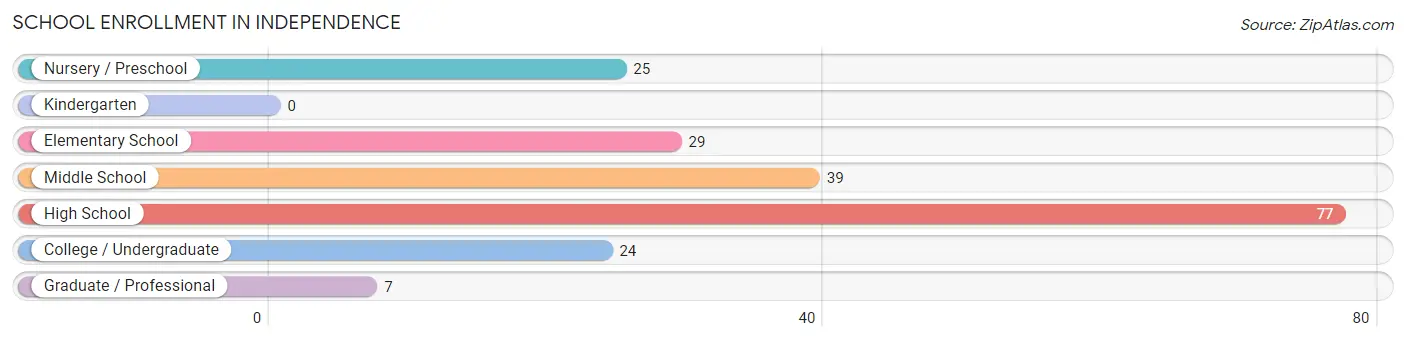
| School Level | # Students | % Students |
| Nursery / Preschool | 25 | 12.4% |
| Kindergarten | 0 | 0.0% |
| Elementary School | 29 | 14.4% |
| Middle School | 39 | 19.4% |
| High School | 77 | 38.3% |
| College / Undergraduate | 24 | 11.9% |
| Graduate / Professional | 7 | 3.5% |
| Total | 201 | 100.0% |
School Enrollment by Age by Funding Source in Independence
Out of a total of 201 students who are enrolled in schools in Independence, 11 (5.5%) attend a private institution, while the remaining 190 (94.5%) are enrolled in public schools. The age group of 35 years and over has the highest likelihood of being enrolled in private schools, with 7 (41.2% in the age bracket) enrolled. Conversely, the age group of 3 to 4 year olds has the lowest likelihood of being enrolled in a private school, with 24 (100.0% in the age bracket) attending a public institution.
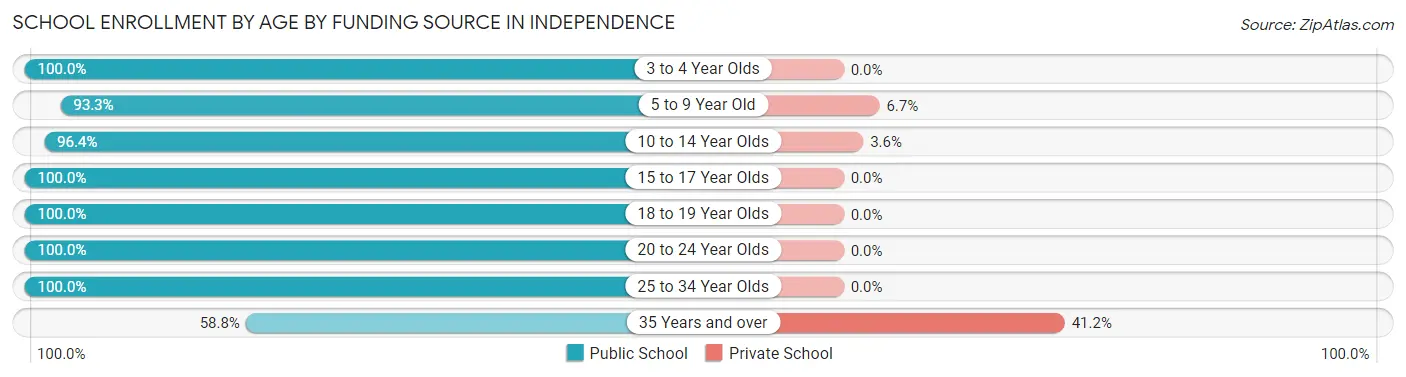
| Age Bracket | Public School | Private School |
| 3 to 4 Year Olds | 24 (100.0%) | 0 (0.0%) |
| 5 to 9 Year Old | 28 (93.3%) | 2 (6.7%) |
| 10 to 14 Year Olds | 53 (96.4%) | 2 (3.6%) |
| 15 to 17 Year Olds | 50 (100.0%) | 0 (0.0%) |
| 18 to 19 Year Olds | 19 (100.0%) | 0 (0.0%) |
| 20 to 24 Year Olds | 3 (100.0%) | 0 (0.0%) |
| 25 to 34 Year Olds | 3 (100.0%) | 0 (0.0%) |
| 35 Years and over | 10 (58.8%) | 7 (41.2%) |
| Total | 190 (94.5%) | 11 (5.5%) |
Educational Attainment by Field of Study in Independence
Literature & languages (27 | 22.5%), business (16 | 13.3%), education (14 | 11.7%), liberal arts & history (14 | 11.7%), and social sciences (13 | 10.8%) are the most common fields of study among 120 individuals in Independence who have obtained a bachelor's degree or higher.
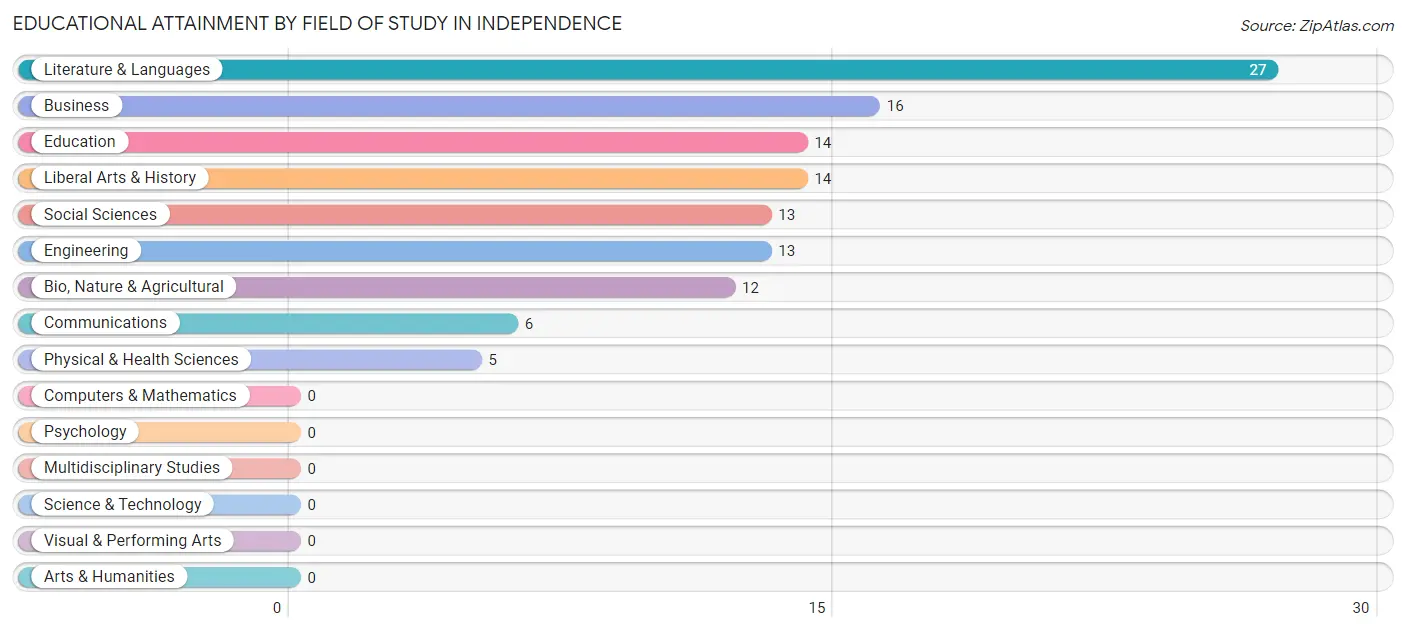
| Field of Study | # Graduates | % Graduates |
| Computers & Mathematics | 0 | 0.0% |
| Bio, Nature & Agricultural | 12 | 10.0% |
| Physical & Health Sciences | 5 | 4.2% |
| Psychology | 0 | 0.0% |
| Social Sciences | 13 | 10.8% |
| Engineering | 13 | 10.8% |
| Multidisciplinary Studies | 0 | 0.0% |
| Science & Technology | 0 | 0.0% |
| Business | 16 | 13.3% |
| Education | 14 | 11.7% |
| Literature & Languages | 27 | 22.5% |
| Liberal Arts & History | 14 | 11.7% |
| Visual & Performing Arts | 0 | 0.0% |
| Communications | 6 | 5.0% |
| Arts & Humanities | 0 | 0.0% |
| Total | 120 | 100.0% |
Transportation & Commute in Independence
Vehicle Availability by Sex in Independence
The most prevalent vehicle ownership categories in Independence are males with 2 vehicles (50, accounting for 36.8%) and females with 2 vehicles (37, making up 47.2%).
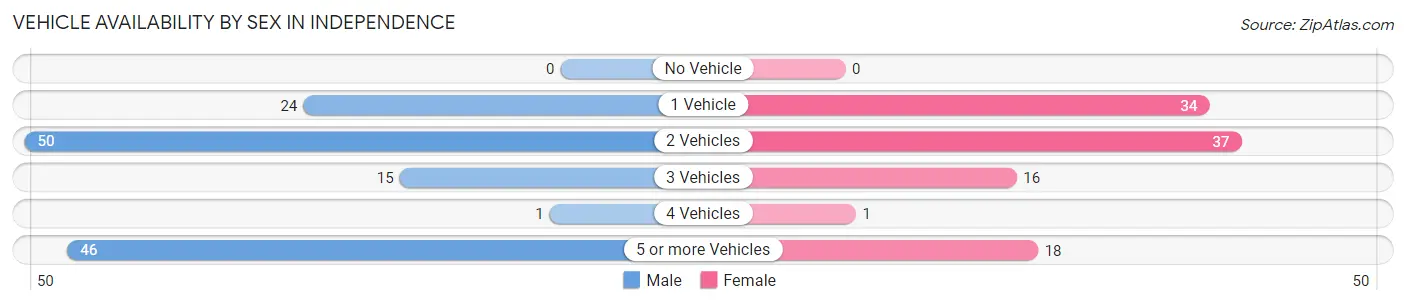
| Vehicles Available | Male | Female |
| No Vehicle | 0 (0.0%) | 0 (0.0%) |
| 1 Vehicle | 24 (17.6%) | 34 (32.1%) |
| 2 Vehicles | 50 (36.8%) | 37 (34.9%) |
| 3 Vehicles | 15 (11.0%) | 16 (15.1%) |
| 4 Vehicles | 1 (0.7%) | 1 (0.9%) |
| 5 or more Vehicles | 46 (33.8%) | 18 (17.0%) |
| Total | 136 (100.0%) | 106 (100.0%) |
Commute Time in Independence
The most frequently occuring commute durations in Independence are less than 5 minutes (91 commuters, 40.3%), 45 to 59 minutes (40 commuters, 17.7%), and 10 to 14 minutes (29 commuters, 12.8%).
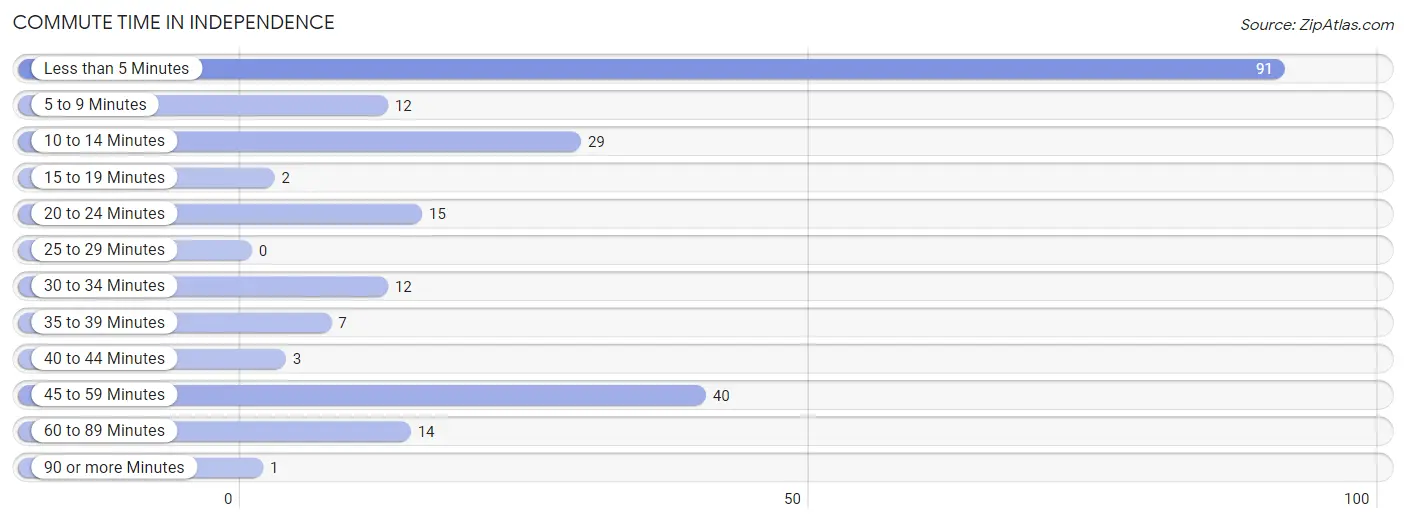
| Commute Time | # Commuters | % Commuters |
| Less than 5 Minutes | 91 | 40.3% |
| 5 to 9 Minutes | 12 | 5.3% |
| 10 to 14 Minutes | 29 | 12.8% |
| 15 to 19 Minutes | 2 | 0.9% |
| 20 to 24 Minutes | 15 | 6.6% |
| 25 to 29 Minutes | 0 | 0.0% |
| 30 to 34 Minutes | 12 | 5.3% |
| 35 to 39 Minutes | 7 | 3.1% |
| 40 to 44 Minutes | 3 | 1.3% |
| 45 to 59 Minutes | 40 | 17.7% |
| 60 to 89 Minutes | 14 | 6.2% |
| 90 or more Minutes | 1 | 0.4% |
Commute Time by Sex in Independence
The most common commute times in Independence are less than 5 minutes (46 commuters, 34.6%) for males and less than 5 minutes (45 commuters, 48.4%) for females.
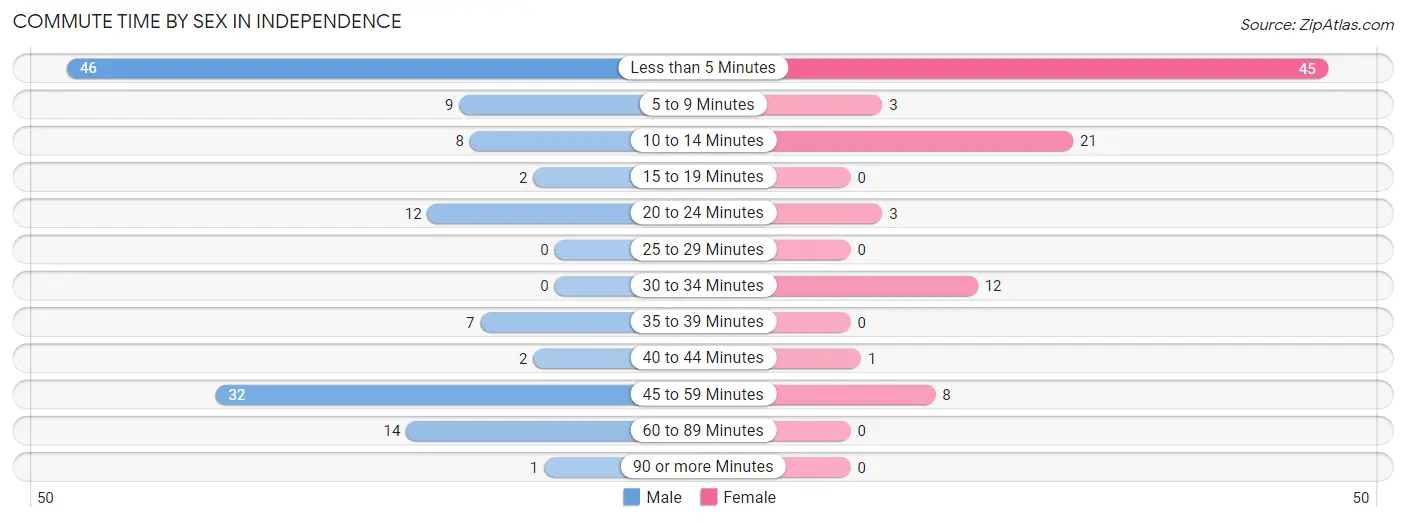
| Commute Time | Male | Female |
| Less than 5 Minutes | 46 (34.6%) | 45 (48.4%) |
| 5 to 9 Minutes | 9 (6.8%) | 3 (3.2%) |
| 10 to 14 Minutes | 8 (6.0%) | 21 (22.6%) |
| 15 to 19 Minutes | 2 (1.5%) | 0 (0.0%) |
| 20 to 24 Minutes | 12 (9.0%) | 3 (3.2%) |
| 25 to 29 Minutes | 0 (0.0%) | 0 (0.0%) |
| 30 to 34 Minutes | 0 (0.0%) | 12 (12.9%) |
| 35 to 39 Minutes | 7 (5.3%) | 0 (0.0%) |
| 40 to 44 Minutes | 2 (1.5%) | 1 (1.1%) |
| 45 to 59 Minutes | 32 (24.1%) | 8 (8.6%) |
| 60 to 89 Minutes | 14 (10.5%) | 0 (0.0%) |
| 90 or more Minutes | 1 (0.7%) | 0 (0.0%) |
Time of Departure to Work by Sex in Independence
The most frequent times of departure to work in Independence are 5:30 AM to 5:59 AM (36, 27.1%) for males and 8:00 AM to 8:29 AM (35, 37.6%) for females.
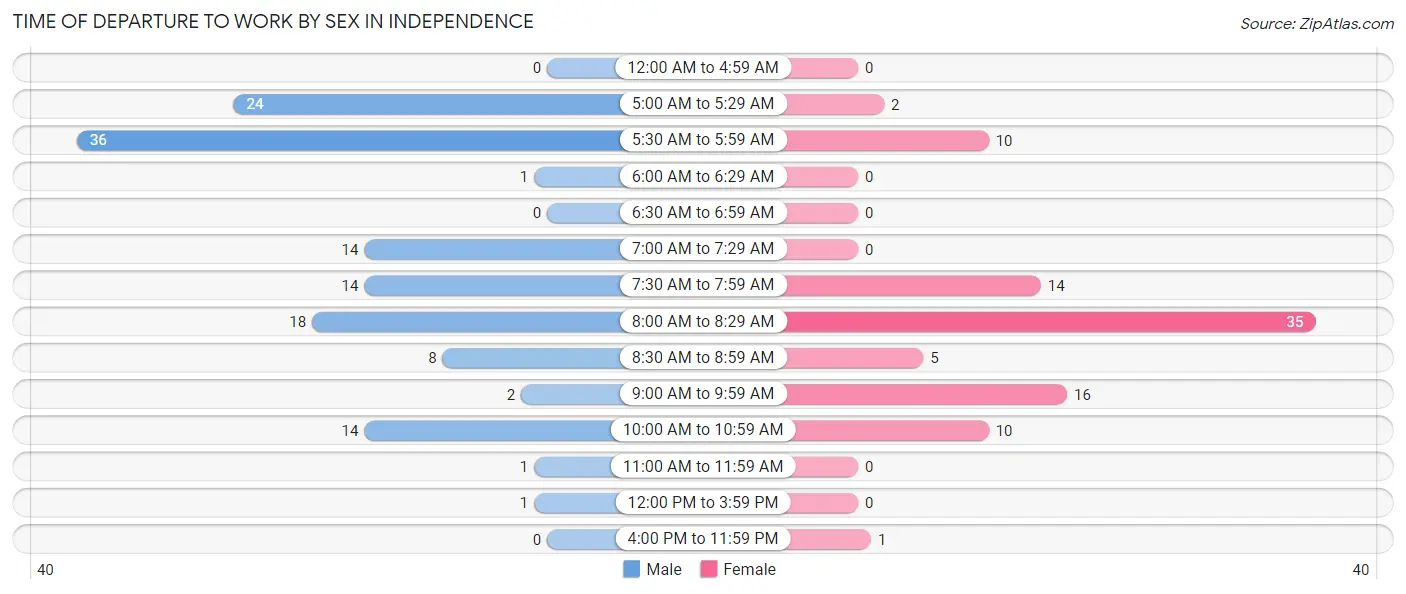
| Time of Departure | Male | Female |
| 12:00 AM to 4:59 AM | 0 (0.0%) | 0 (0.0%) |
| 5:00 AM to 5:29 AM | 24 (18.0%) | 2 (2.1%) |
| 5:30 AM to 5:59 AM | 36 (27.1%) | 10 (10.7%) |
| 6:00 AM to 6:29 AM | 1 (0.7%) | 0 (0.0%) |
| 6:30 AM to 6:59 AM | 0 (0.0%) | 0 (0.0%) |
| 7:00 AM to 7:29 AM | 14 (10.5%) | 0 (0.0%) |
| 7:30 AM to 7:59 AM | 14 (10.5%) | 14 (15.0%) |
| 8:00 AM to 8:29 AM | 18 (13.5%) | 35 (37.6%) |
| 8:30 AM to 8:59 AM | 8 (6.0%) | 5 (5.4%) |
| 9:00 AM to 9:59 AM | 2 (1.5%) | 16 (17.2%) |
| 10:00 AM to 10:59 AM | 14 (10.5%) | 10 (10.7%) |
| 11:00 AM to 11:59 AM | 1 (0.7%) | 0 (0.0%) |
| 12:00 PM to 3:59 PM | 1 (0.7%) | 0 (0.0%) |
| 4:00 PM to 11:59 PM | 0 (0.0%) | 1 (1.1%) |
| Total | 133 (100.0%) | 93 (100.0%) |
Housing Occupancy in Independence
Occupancy by Ownership in Independence
Of the total 337 dwellings in Independence, owner-occupied units account for 243 (72.1%), while renter-occupied units make up 94 (27.9%).
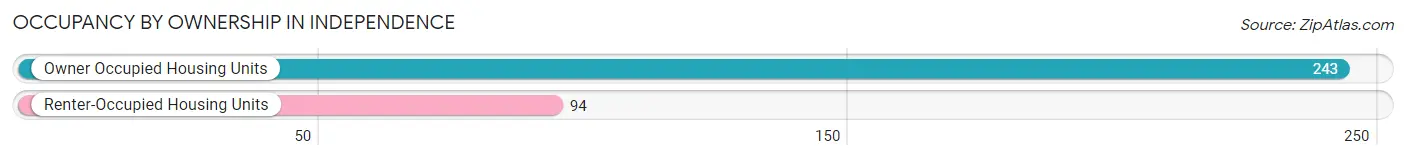
| Occupancy | # Housing Units | % Housing Units |
| Owner Occupied Housing Units | 243 | 72.1% |
| Renter-Occupied Housing Units | 94 | 27.9% |
| Total Occupied Housing Units | 337 | 100.0% |
Occupancy by Household Size in Independence
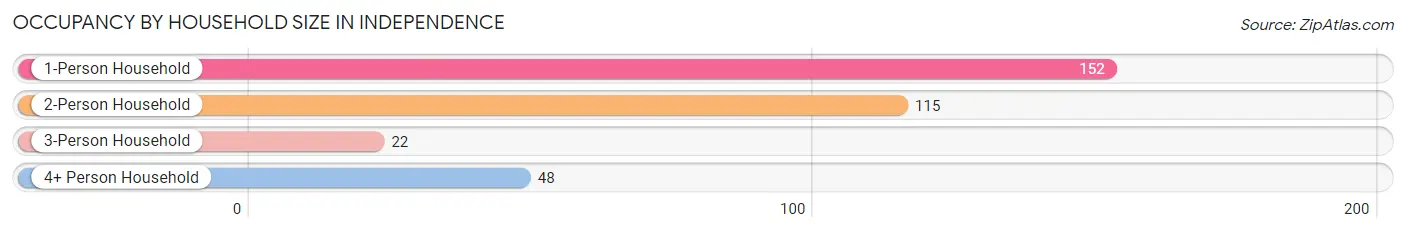
| Household Size | # Housing Units | % Housing Units |
| 1-Person Household | 152 | 45.1% |
| 2-Person Household | 115 | 34.1% |
| 3-Person Household | 22 | 6.5% |
| 4+ Person Household | 48 | 14.2% |
| Total Housing Units | 337 | 100.0% |
Occupancy by Ownership by Household Size in Independence
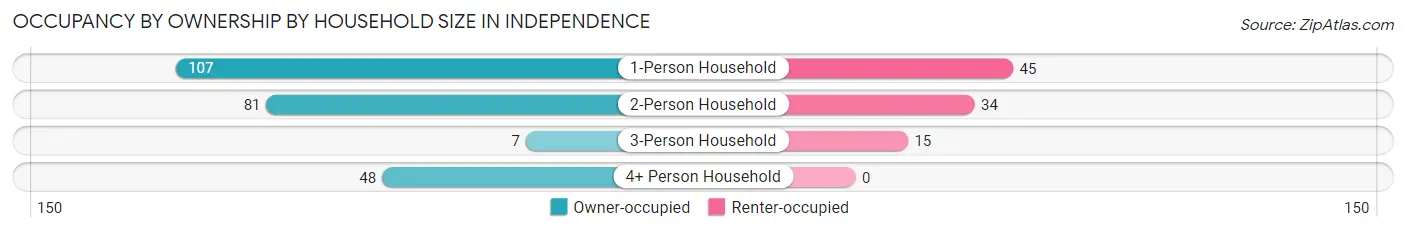
| Household Size | Owner-occupied | Renter-occupied |
| 1-Person Household | 107 (70.4%) | 45 (29.6%) |
| 2-Person Household | 81 (70.4%) | 34 (29.6%) |
| 3-Person Household | 7 (31.8%) | 15 (68.2%) |
| 4+ Person Household | 48 (100.0%) | 0 (0.0%) |
| Total Housing Units | 243 (72.1%) | 94 (27.9%) |
Occupancy by Educational Attainment in Independence
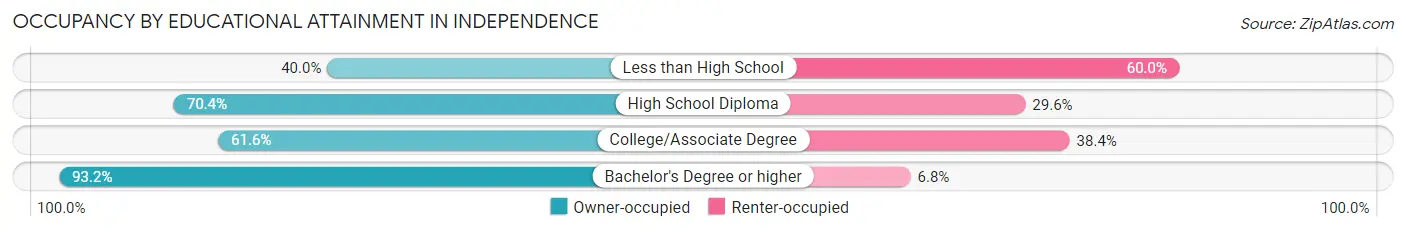
| Household Size | Owner-occupied | Renter-occupied |
| Less than High School | 2 (40.0%) | 3 (60.0%) |
| High School Diploma | 69 (70.4%) | 29 (29.6%) |
| College/Associate Degree | 90 (61.6%) | 56 (38.4%) |
| Bachelor's Degree or higher | 82 (93.2%) | 6 (6.8%) |
Occupancy by Age of Householder in Independence
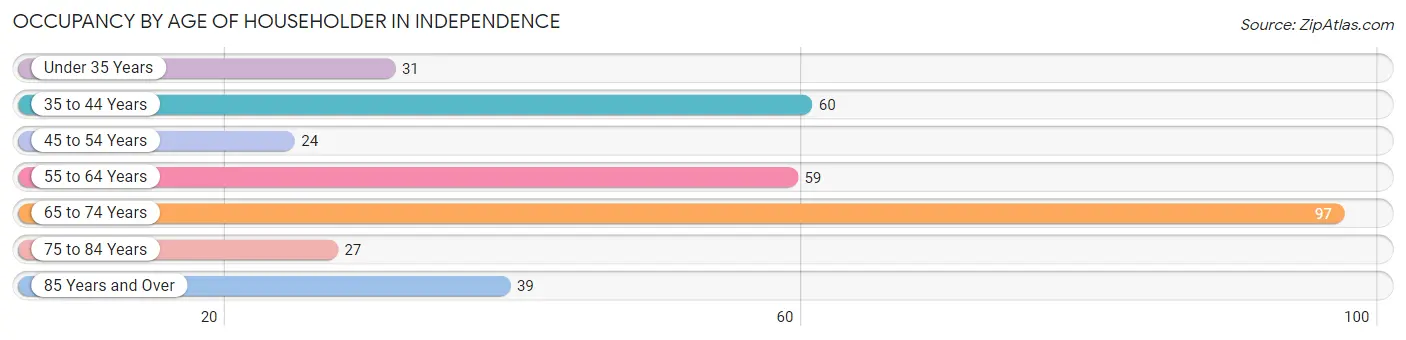
| Age Bracket | # Households | % Households |
| Under 35 Years | 31 | 9.2% |
| 35 to 44 Years | 60 | 17.8% |
| 45 to 54 Years | 24 | 7.1% |
| 55 to 64 Years | 59 | 17.5% |
| 65 to 74 Years | 97 | 28.8% |
| 75 to 84 Years | 27 | 8.0% |
| 85 Years and Over | 39 | 11.6% |
| Total | 337 | 100.0% |
Housing Finances in Independence
Median Income by Occupancy in Independence
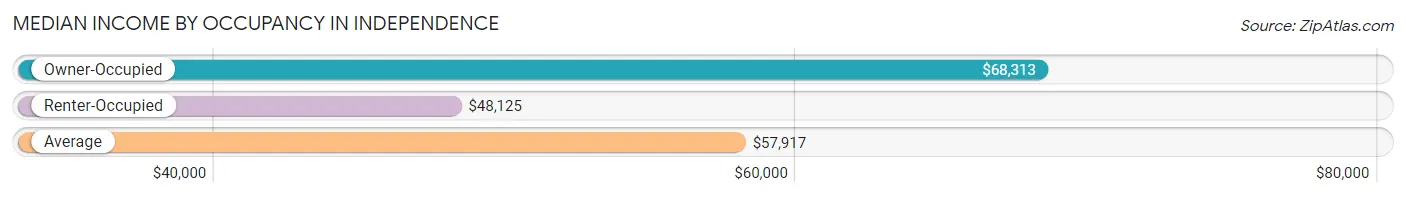
| Occupancy Type | # Households | Median Income |
| Owner-Occupied | 243 (72.1%) | $68,313 |
| Renter-Occupied | 94 (27.9%) | $48,125 |
| Average | 337 (100.0%) | $57,917 |
Occupancy by Householder Income Bracket in Independence
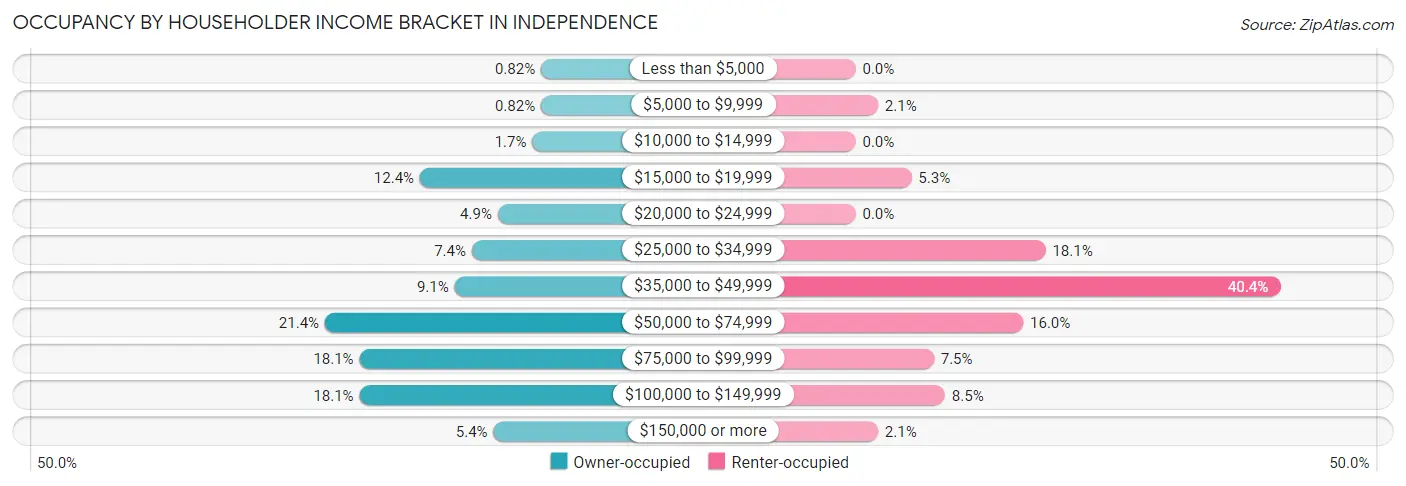
| Income Bracket | Owner-occupied | Renter-occupied |
| Less than $5,000 | 2 (0.8%) | 0 (0.0%) |
| $5,000 to $9,999 | 2 (0.8%) | 2 (2.1%) |
| $10,000 to $14,999 | 4 (1.7%) | 0 (0.0%) |
| $15,000 to $19,999 | 30 (12.3%) | 5 (5.3%) |
| $20,000 to $24,999 | 12 (4.9%) | 0 (0.0%) |
| $25,000 to $34,999 | 18 (7.4%) | 17 (18.1%) |
| $35,000 to $49,999 | 22 (9.0%) | 38 (40.4%) |
| $50,000 to $74,999 | 52 (21.4%) | 15 (16.0%) |
| $75,000 to $99,999 | 44 (18.1%) | 7 (7.4%) |
| $100,000 to $149,999 | 44 (18.1%) | 8 (8.5%) |
| $150,000 or more | 13 (5.3%) | 2 (2.1%) |
| Total | 243 (100.0%) | 94 (100.0%) |
Monthly Housing Cost Tiers in Independence
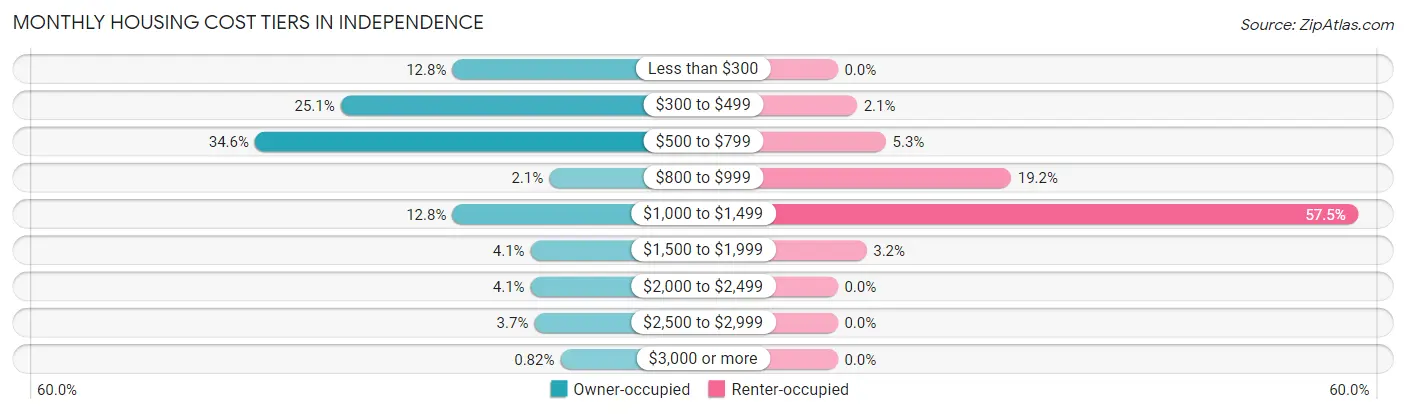
| Monthly Cost | Owner-occupied | Renter-occupied |
| Less than $300 | 31 (12.8%) | 0 (0.0%) |
| $300 to $499 | 61 (25.1%) | 2 (2.1%) |
| $500 to $799 | 84 (34.6%) | 5 (5.3%) |
| $800 to $999 | 5 (2.1%) | 18 (19.2%) |
| $1,000 to $1,499 | 31 (12.8%) | 54 (57.5%) |
| $1,500 to $1,999 | 10 (4.1%) | 3 (3.2%) |
| $2,000 to $2,499 | 10 (4.1%) | 0 (0.0%) |
| $2,500 to $2,999 | 9 (3.7%) | 0 (0.0%) |
| $3,000 or more | 2 (0.8%) | 0 (0.0%) |
| Total | 243 (100.0%) | 94 (100.0%) |
Physical Housing Characteristics in Independence
Housing Structures in Independence
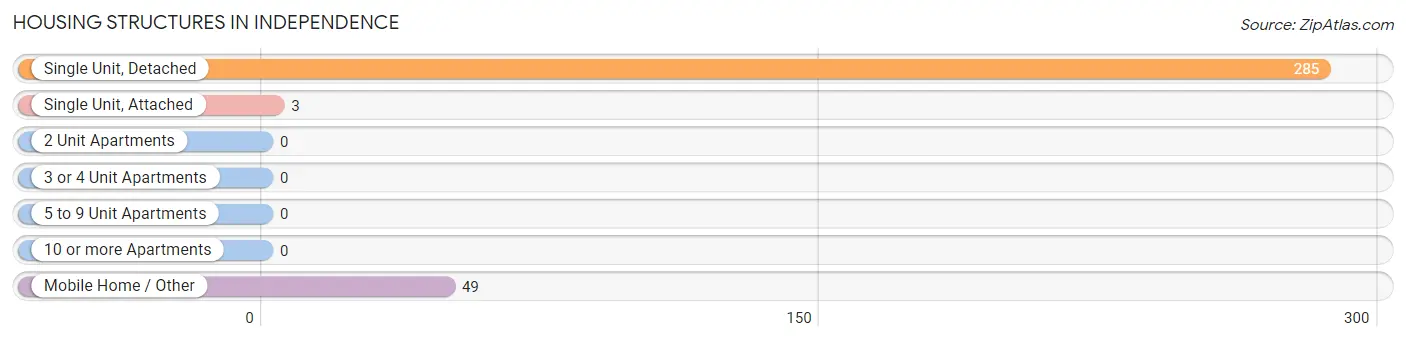
| Structure Type | # Housing Units | % Housing Units |
| Single Unit, Detached | 285 | 84.6% |
| Single Unit, Attached | 3 | 0.9% |
| 2 Unit Apartments | 0 | 0.0% |
| 3 or 4 Unit Apartments | 0 | 0.0% |
| 5 to 9 Unit Apartments | 0 | 0.0% |
| 10 or more Apartments | 0 | 0.0% |
| Mobile Home / Other | 49 | 14.5% |
| Total | 337 | 100.0% |
Housing Structures by Occupancy in Independence
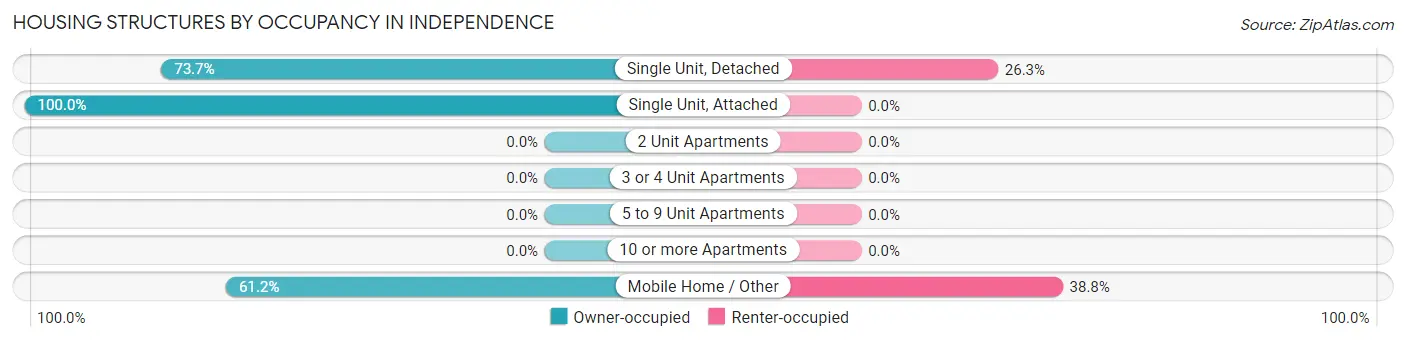
| Structure Type | Owner-occupied | Renter-occupied |
| Single Unit, Detached | 210 (73.7%) | 75 (26.3%) |
| Single Unit, Attached | 3 (100.0%) | 0 (0.0%) |
| 2 Unit Apartments | 0 (0.0%) | 0 (0.0%) |
| 3 or 4 Unit Apartments | 0 (0.0%) | 0 (0.0%) |
| 5 to 9 Unit Apartments | 0 (0.0%) | 0 (0.0%) |
| 10 or more Apartments | 0 (0.0%) | 0 (0.0%) |
| Mobile Home / Other | 30 (61.2%) | 19 (38.8%) |
| Total | 243 (72.1%) | 94 (27.9%) |
Housing Structures by Number of Rooms in Independence
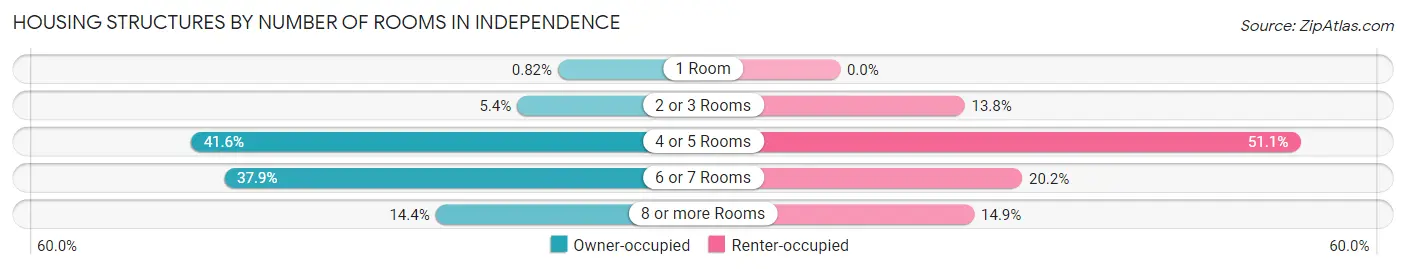
| Number of Rooms | Owner-occupied | Renter-occupied |
| 1 Room | 2 (0.8%) | 0 (0.0%) |
| 2 or 3 Rooms | 13 (5.3%) | 13 (13.8%) |
| 4 or 5 Rooms | 101 (41.6%) | 48 (51.1%) |
| 6 or 7 Rooms | 92 (37.9%) | 19 (20.2%) |
| 8 or more Rooms | 35 (14.4%) | 14 (14.9%) |
| Total | 243 (100.0%) | 94 (100.0%) |
Housing Structure by Heating Type in Independence
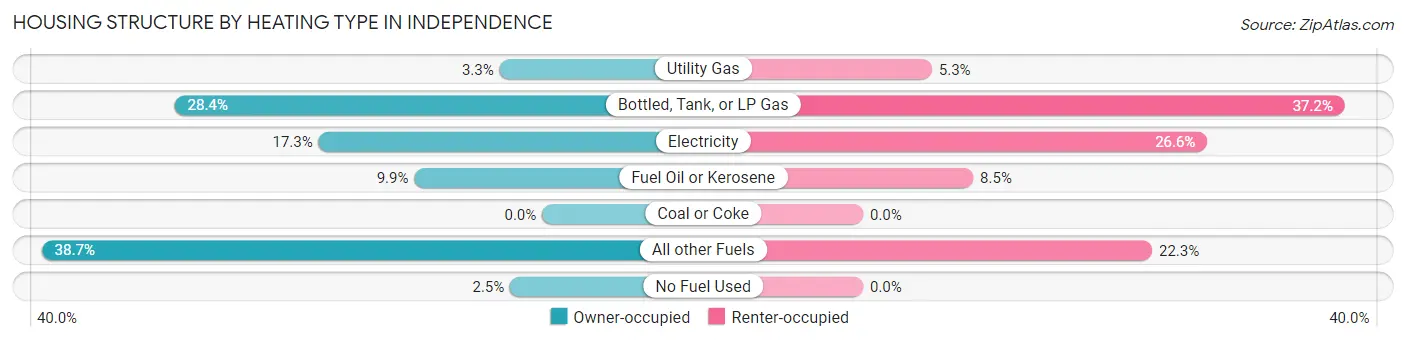
| Heating Type | Owner-occupied | Renter-occupied |
| Utility Gas | 8 (3.3%) | 5 (5.3%) |
| Bottled, Tank, or LP Gas | 69 (28.4%) | 35 (37.2%) |
| Electricity | 42 (17.3%) | 25 (26.6%) |
| Fuel Oil or Kerosene | 24 (9.9%) | 8 (8.5%) |
| Coal or Coke | 0 (0.0%) | 0 (0.0%) |
| All other Fuels | 94 (38.7%) | 21 (22.3%) |
| No Fuel Used | 6 (2.5%) | 0 (0.0%) |
| Total | 243 (100.0%) | 94 (100.0%) |
Household Vehicle Usage in Independence
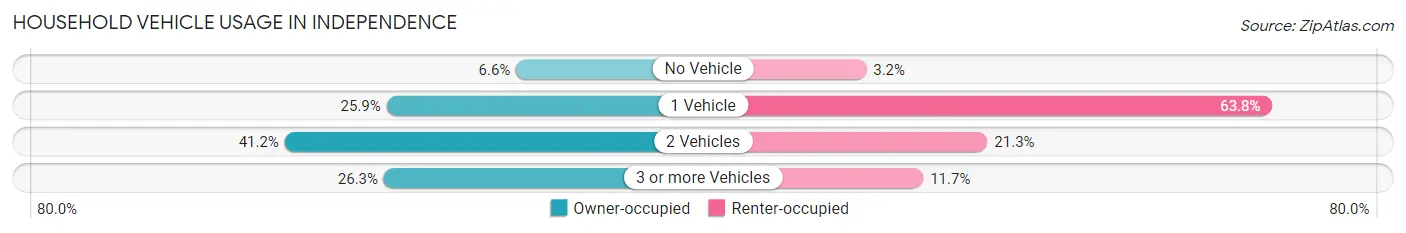
| Vehicles per Household | Owner-occupied | Renter-occupied |
| No Vehicle | 16 (6.6%) | 3 (3.2%) |
| 1 Vehicle | 63 (25.9%) | 60 (63.8%) |
| 2 Vehicles | 100 (41.1%) | 20 (21.3%) |
| 3 or more Vehicles | 64 (26.3%) | 11 (11.7%) |
| Total | 243 (100.0%) | 94 (100.0%) |
Real Estate & Mortgages in Independence
Real Estate and Mortgage Overview in Independence
| Characteristic | Without Mortgage | With Mortgage |
| Housing Units | 180 | 63 |
| Median Property Value | $236,700 | $262,500 |
| Median Household Income | $52,292 | $8 |
| Monthly Housing Costs | $519 | $2 |
| Real Estate Taxes | $1,547 | $0 |
Property Value by Mortgage Status in Independence
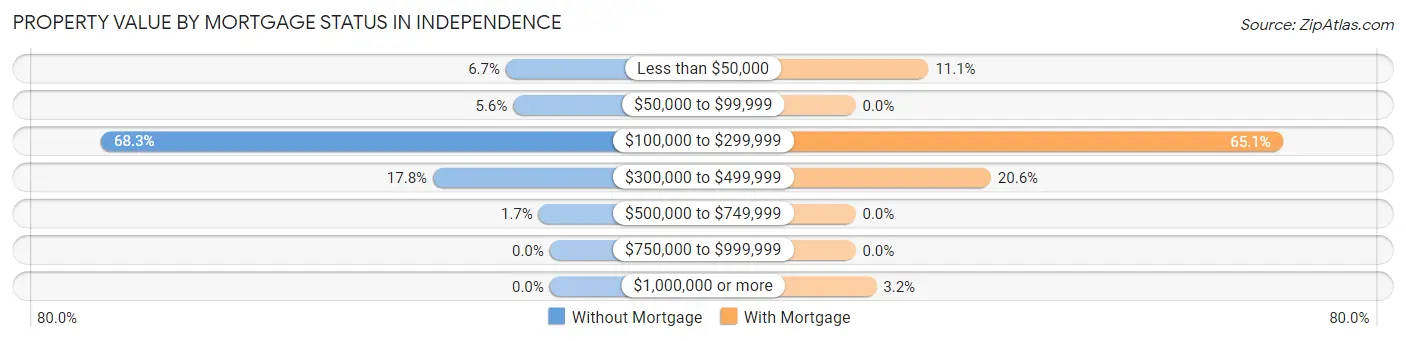
| Property Value | Without Mortgage | With Mortgage |
| Less than $50,000 | 12 (6.7%) | 7 (11.1%) |
| $50,000 to $99,999 | 10 (5.6%) | 0 (0.0%) |
| $100,000 to $299,999 | 123 (68.3%) | 41 (65.1%) |
| $300,000 to $499,999 | 32 (17.8%) | 13 (20.6%) |
| $500,000 to $749,999 | 3 (1.7%) | 0 (0.0%) |
| $750,000 to $999,999 | 0 (0.0%) | 0 (0.0%) |
| $1,000,000 or more | 0 (0.0%) | 2 (3.2%) |
| Total | 180 (100.0%) | 63 (100.0%) |
Household Income by Mortgage Status in Independence
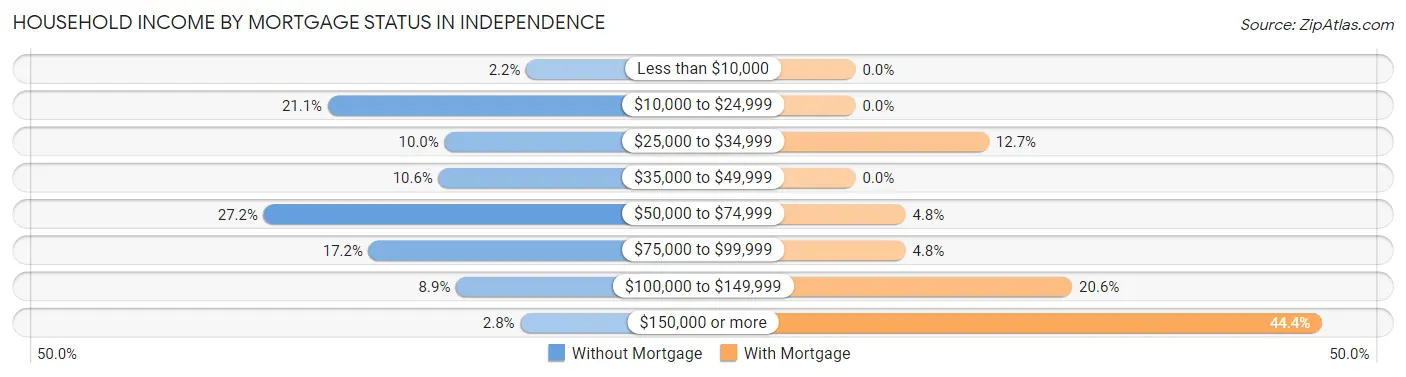
| Household Income | Without Mortgage | With Mortgage |
| Less than $10,000 | 4 (2.2%) | 0 (0.0%) |
| $10,000 to $24,999 | 38 (21.1%) | 0 (0.0%) |
| $25,000 to $34,999 | 18 (10.0%) | 8 (12.7%) |
| $35,000 to $49,999 | 19 (10.6%) | 0 (0.0%) |
| $50,000 to $74,999 | 49 (27.2%) | 3 (4.8%) |
| $75,000 to $99,999 | 31 (17.2%) | 3 (4.8%) |
| $100,000 to $149,999 | 16 (8.9%) | 13 (20.6%) |
| $150,000 or more | 5 (2.8%) | 28 (44.4%) |
| Total | 180 (100.0%) | 63 (100.0%) |
Property Value to Household Income Ratio in Independence
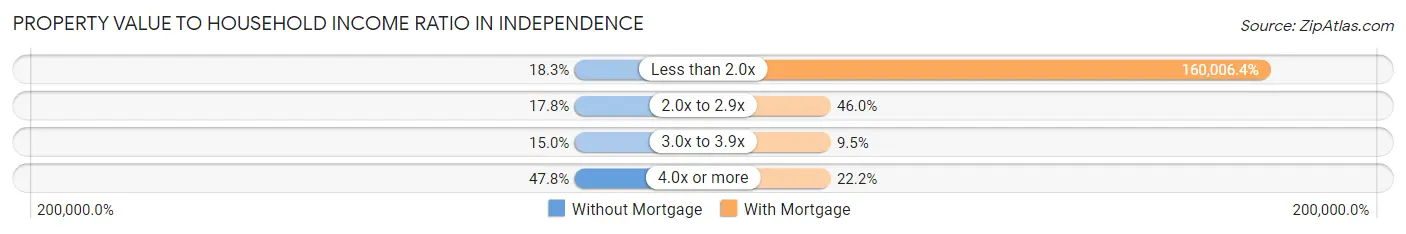
| Value-to-Income Ratio | Without Mortgage | With Mortgage |
| Less than 2.0x | 33 (18.3%) | 100,804 (160,006.3%) |
| 2.0x to 2.9x | 32 (17.8%) | 29 (46.0%) |
| 3.0x to 3.9x | 27 (15.0%) | 6 (9.5%) |
| 4.0x or more | 86 (47.8%) | 14 (22.2%) |
| Total | 180 (100.0%) | 63 (100.0%) |
Real Estate Taxes by Mortgage Status in Independence
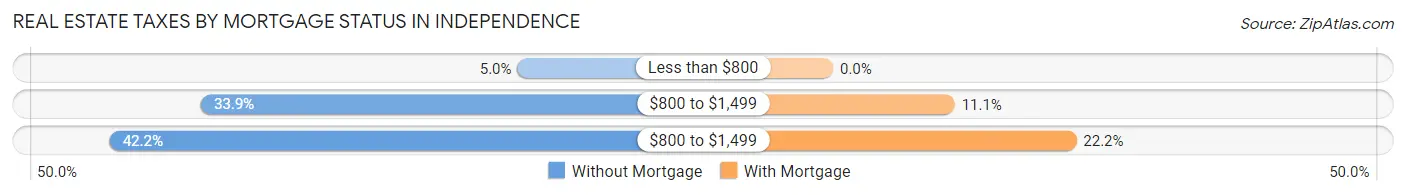
| Property Taxes | Without Mortgage | With Mortgage |
| Less than $800 | 9 (5.0%) | 0 (0.0%) |
| $800 to $1,499 | 61 (33.9%) | 7 (11.1%) |
| $800 to $1,499 | 76 (42.2%) | 14 (22.2%) |
| Total | 180 (100.0%) | 63 (100.0%) |
Health & Disability in Independence
Health Insurance Coverage by Age in Independence
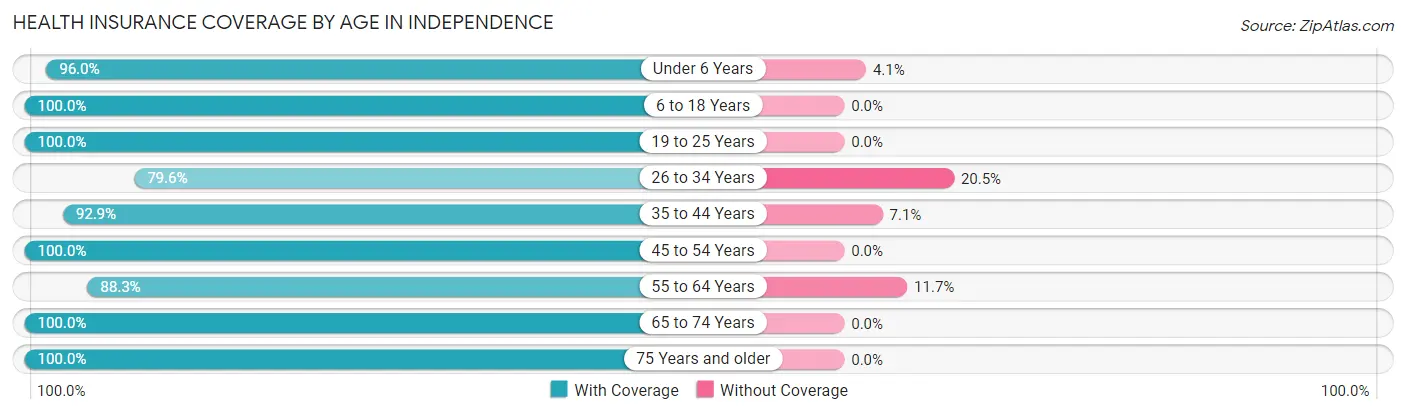
| Age Bracket | With Coverage | Without Coverage |
| Under 6 Years | 71 (96.0%) | 3 (4.1%) |
| 6 to 18 Years | 160 (100.0%) | 0 (0.0%) |
| 19 to 25 Years | 31 (100.0%) | 0 (0.0%) |
| 26 to 34 Years | 35 (79.5%) | 9 (20.4%) |
| 35 to 44 Years | 104 (92.9%) | 8 (7.1%) |
| 45 to 54 Years | 42 (100.0%) | 0 (0.0%) |
| 55 to 64 Years | 113 (88.3%) | 15 (11.7%) |
| 65 to 74 Years | 131 (100.0%) | 0 (0.0%) |
| 75 Years and older | 83 (100.0%) | 0 (0.0%) |
| Total | 770 (95.7%) | 35 (4.3%) |
Health Insurance Coverage by Citizenship Status in Independence
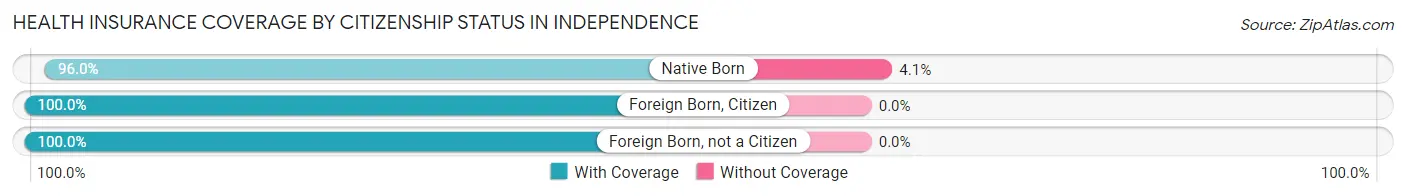
| Citizenship Status | With Coverage | Without Coverage |
| Native Born | 71 (96.0%) | 3 (4.1%) |
| Foreign Born, Citizen | 160 (100.0%) | 0 (0.0%) |
| Foreign Born, not a Citizen | 31 (100.0%) | 0 (0.0%) |
Health Insurance Coverage by Household Income in Independence
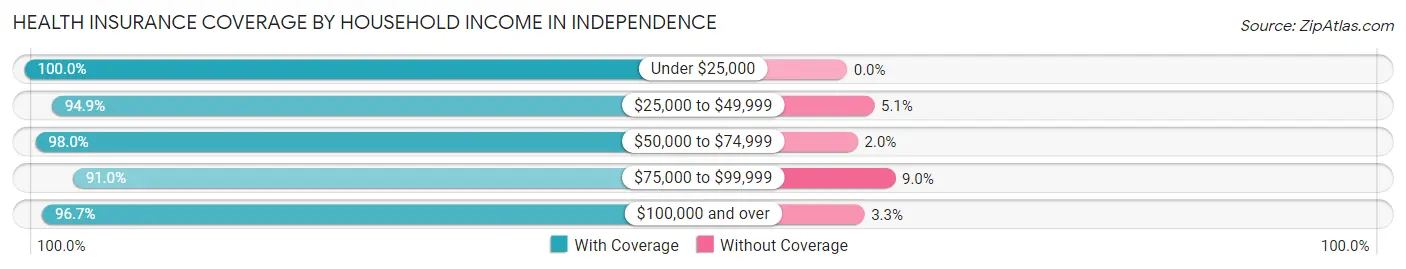
| Household Income | With Coverage | Without Coverage |
| Under $25,000 | 98 (100.0%) | 0 (0.0%) |
| $25,000 to $49,999 | 149 (94.9%) | 8 (5.1%) |
| $50,000 to $74,999 | 145 (98.0%) | 3 (2.0%) |
| $75,000 to $99,999 | 171 (91.0%) | 17 (9.0%) |
| $100,000 and over | 207 (96.7%) | 7 (3.3%) |
Public vs Private Health Insurance Coverage by Age in Independence
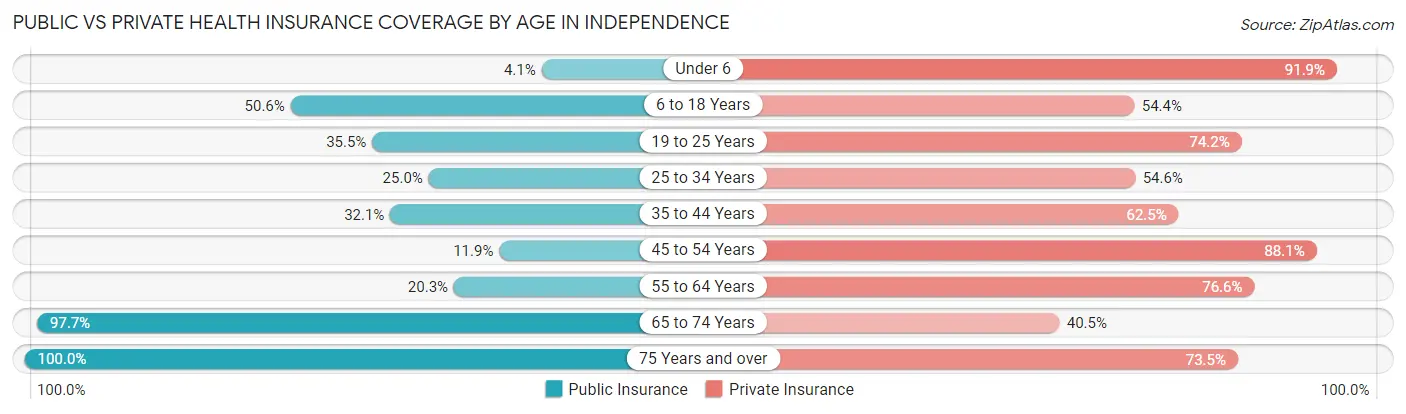
| Age Bracket | Public Insurance | Private Insurance |
| Under 6 | 3 (4.1%) | 68 (91.9%) |
| 6 to 18 Years | 81 (50.6%) | 87 (54.4%) |
| 19 to 25 Years | 11 (35.5%) | 23 (74.2%) |
| 25 to 34 Years | 11 (25.0%) | 24 (54.5%) |
| 35 to 44 Years | 36 (32.1%) | 70 (62.5%) |
| 45 to 54 Years | 5 (11.9%) | 37 (88.1%) |
| 55 to 64 Years | 26 (20.3%) | 98 (76.6%) |
| 65 to 74 Years | 128 (97.7%) | 53 (40.5%) |
| 75 Years and over | 83 (100.0%) | 61 (73.5%) |
| Total | 384 (47.7%) | 521 (64.7%) |
Disability Status by Sex by Age in Independence
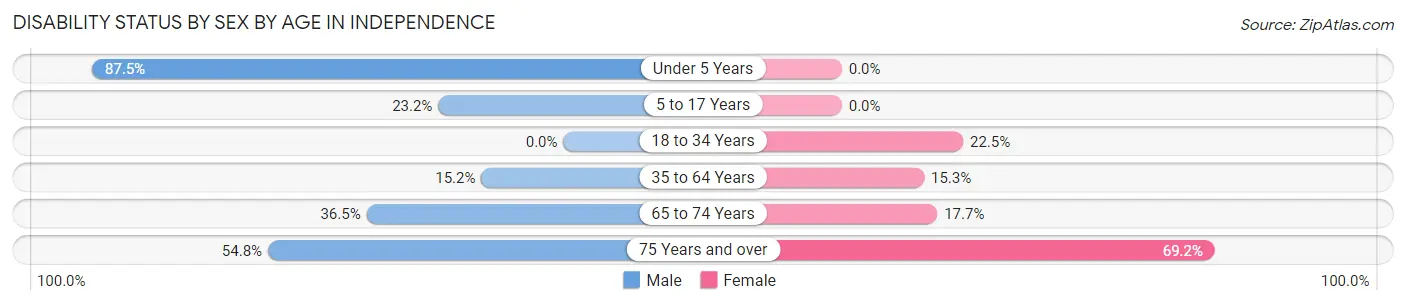
| Age Bracket | Male | Female |
| Under 5 Years | 28 (87.5%) | 0 (0.0%) |
| 5 to 17 Years | 23 (23.2%) | 0 (0.0%) |
| 18 to 34 Years | 0 (0.0%) | 9 (22.5%) |
| 35 to 64 Years | 23 (15.2%) | 20 (15.3%) |
| 65 to 74 Years | 19 (36.5%) | 14 (17.7%) |
| 75 Years and over | 17 (54.8%) | 36 (69.2%) |
Disability Class by Sex by Age in Independence
Disability Class: Hearing Difficulty
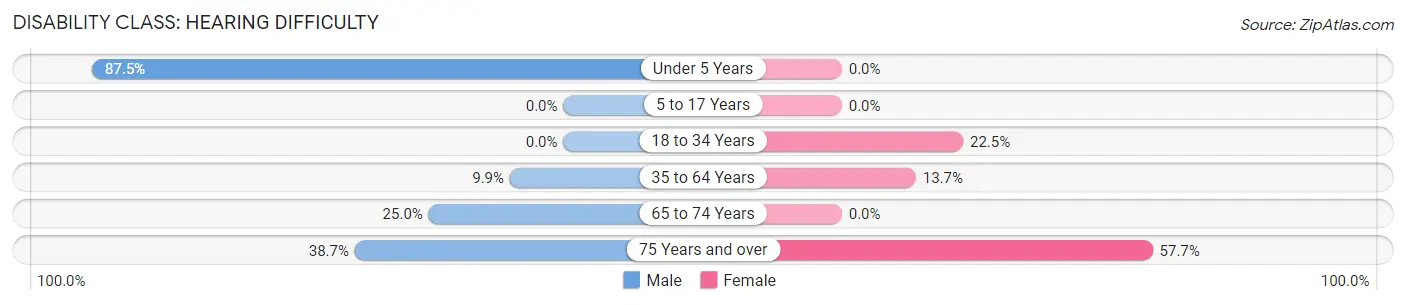
| Age Bracket | Male | Female |
| Under 5 Years | 28 (87.5%) | 0 (0.0%) |
| 5 to 17 Years | 0 (0.0%) | 0 (0.0%) |
| 18 to 34 Years | 0 (0.0%) | 9 (22.5%) |
| 35 to 64 Years | 15 (9.9%) | 18 (13.7%) |
| 65 to 74 Years | 13 (25.0%) | 0 (0.0%) |
| 75 Years and over | 12 (38.7%) | 30 (57.7%) |
Disability Class: Vision Difficulty
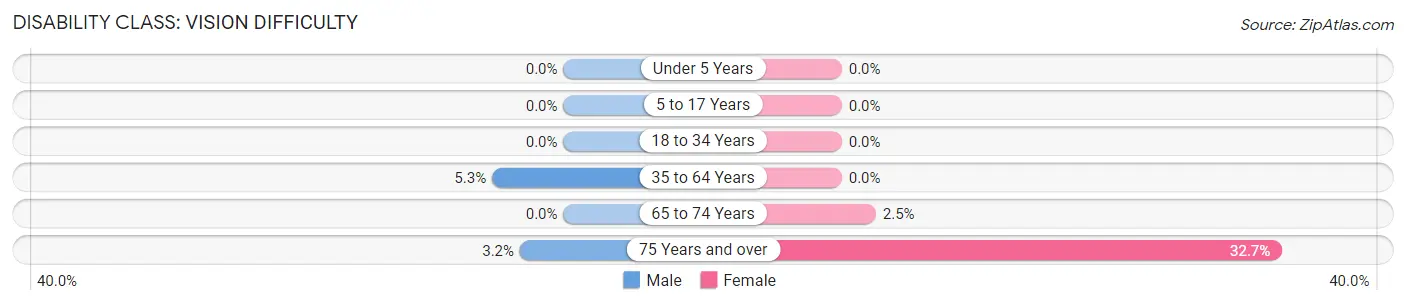
| Age Bracket | Male | Female |
| Under 5 Years | 0 (0.0%) | 0 (0.0%) |
| 5 to 17 Years | 0 (0.0%) | 0 (0.0%) |
| 18 to 34 Years | 0 (0.0%) | 0 (0.0%) |
| 35 to 64 Years | 8 (5.3%) | 0 (0.0%) |
| 65 to 74 Years | 0 (0.0%) | 2 (2.5%) |
| 75 Years and over | 1 (3.2%) | 17 (32.7%) |
Disability Class: Cognitive Difficulty
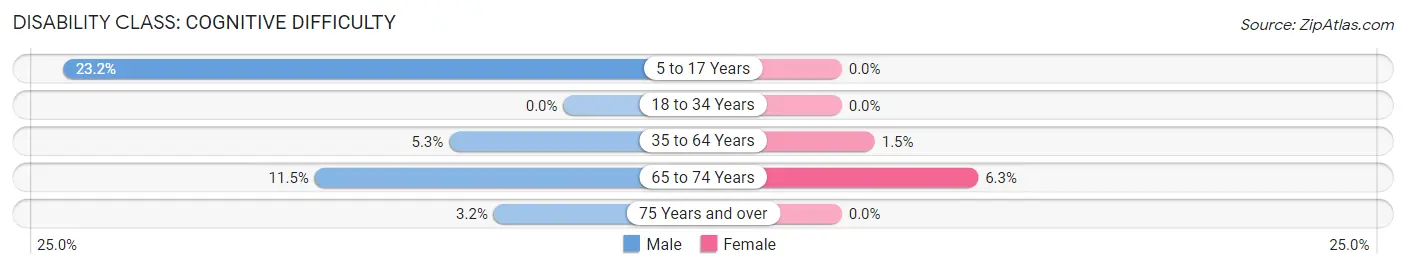
| Age Bracket | Male | Female |
| 5 to 17 Years | 23 (23.2%) | 0 (0.0%) |
| 18 to 34 Years | 0 (0.0%) | 0 (0.0%) |
| 35 to 64 Years | 8 (5.3%) | 2 (1.5%) |
| 65 to 74 Years | 6 (11.5%) | 5 (6.3%) |
| 75 Years and over | 1 (3.2%) | 0 (0.0%) |
Disability Class: Ambulatory Difficulty
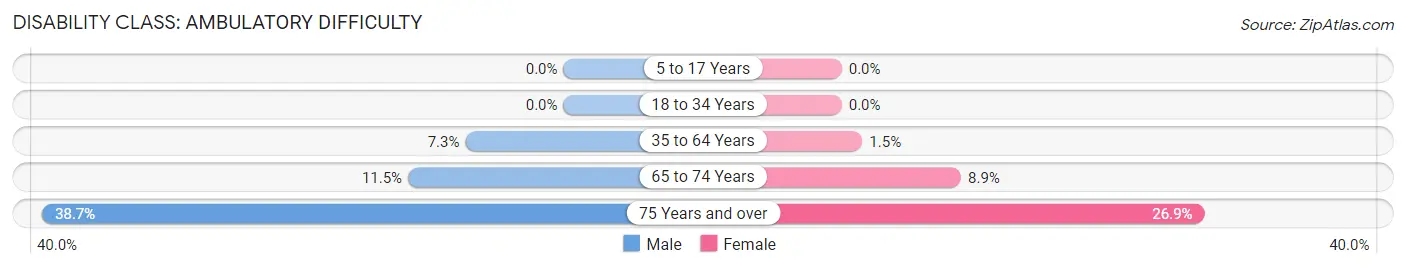
| Age Bracket | Male | Female |
| 5 to 17 Years | 0 (0.0%) | 0 (0.0%) |
| 18 to 34 Years | 0 (0.0%) | 0 (0.0%) |
| 35 to 64 Years | 11 (7.3%) | 2 (1.5%) |
| 65 to 74 Years | 6 (11.5%) | 7 (8.9%) |
| 75 Years and over | 12 (38.7%) | 14 (26.9%) |
Disability Class: Self-Care Difficulty
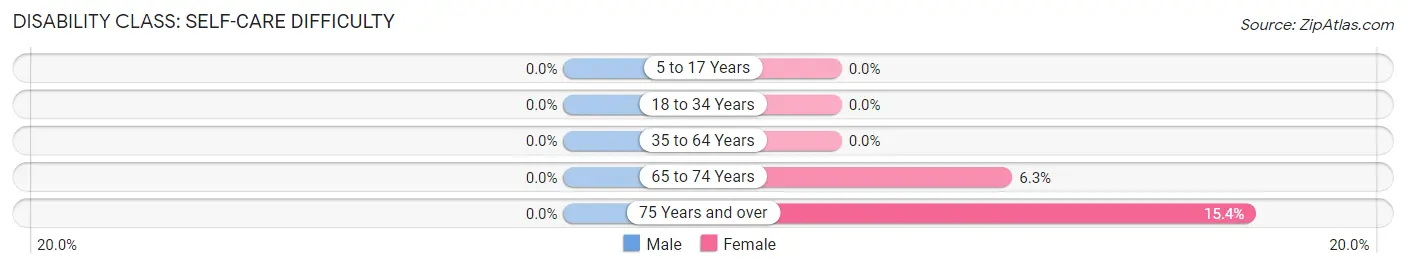
| Age Bracket | Male | Female |
| 5 to 17 Years | 0 (0.0%) | 0 (0.0%) |
| 18 to 34 Years | 0 (0.0%) | 0 (0.0%) |
| 35 to 64 Years | 0 (0.0%) | 0 (0.0%) |
| 65 to 74 Years | 0 (0.0%) | 5 (6.3%) |
| 75 Years and over | 0 (0.0%) | 8 (15.4%) |
Technology Access in Independence
Computing Device Access in Independence
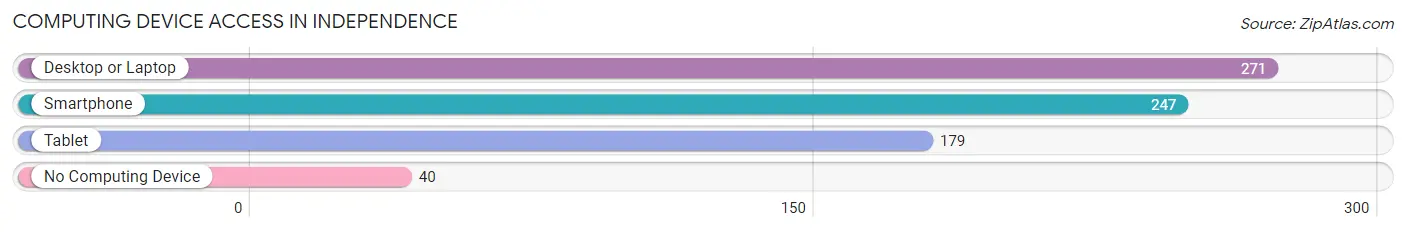
| Device Type | # Households | % Households |
| Desktop or Laptop | 271 | 80.4% |
| Smartphone | 247 | 73.3% |
| Tablet | 179 | 53.1% |
| No Computing Device | 40 | 11.9% |
| Total | 337 | 100.0% |
Internet Access in Independence
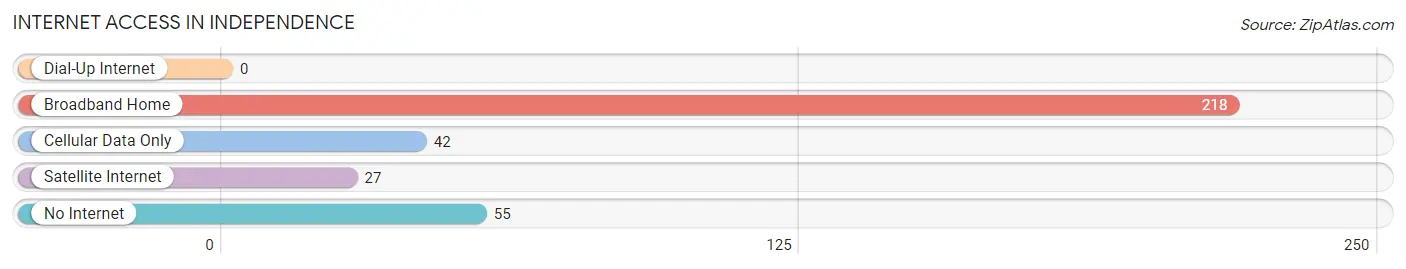
| Internet Type | # Households | % Households |
| Dial-Up Internet | 0 | 0.0% |
| Broadband Home | 218 | 64.7% |
| Cellular Data Only | 42 | 12.5% |
| Satellite Internet | 27 | 8.0% |
| No Internet | 55 | 16.3% |
| Total | 337 | 100.0% |
Independence Summary
Independence is a small town located in Inyo County, California, United States. It is situated in the Owens Valley, near the eastern Sierra Nevada mountain range. The town is located at the base of the White Mountains, and is the gateway to the Owens Valley. The population of Independence was 669 at the 2010 census.
History
Independence was founded in 1861 by a group of miners who were looking for gold in the area. The town was originally called "Fremont", but was later changed to "Independence" in honor of the Fourth of July. The town was incorporated in 1877.
In the late 19th century, Independence was a bustling mining town, with a population of over 1,000. The town was home to several saloons, hotels, and stores. The town was also the site of the first post office in Inyo County.
In the early 20th century, Independence began to decline as the mining industry in the area declined. The population of the town dropped to just over 500 by the 1950s.
Geography
Independence is located at an elevation of 4,000 feet (1,219 m) in the Owens Valley, near the eastern Sierra Nevada mountain range. The town is situated at the base of the White Mountains, and is the gateway to the Owens Valley.
The town is located on U.S. Route 395, which runs north-south through the Owens Valley. The town is also served by State Route 136, which runs east-west through the valley.
The climate in Independence is semi-arid, with hot summers and cold winters. The average annual precipitation is 5.5 inches (140 mm).
Economy
The economy of Independence is largely based on tourism. The town is a popular destination for hikers, campers, and other outdoor enthusiasts. The town is also home to several restaurants, hotels, and other businesses catering to tourists.
The town is also home to several agricultural operations including cattle ranches and vineyards
Demographics
As of the 2010 census, the population of Independence was 669. The racial makeup of the town was 87.3% White, 0.3% African American, 0.7% Native American, 0.3% Asian, 0.1% Pacific Islander, 8.3% from other races, and 3.3% from two or more races. Hispanic or Latino of any race were 16.2% of the population.
The median income for a household in the town was $31,250, and the median income for a family was $37,500. The per capita income for the town was $17,857. About 15.2% of families and 18.2% of the population were below the poverty line, including 25.2% of those under age 18 and 8.3% of those age 65 or over.
Common Questions
What is Per Capita Income in Independence?
Per Capita income in Independence is $28,402.
What is the Median Family Income in Independence?
Median Family Income in Independence is $78,929.
What is the Median Household income in Independence?
Median Household Income in Independence is $57,917.
What is Income or Wage Gap in Independence?
Income or Wage Gap in Independence is 40.2%.
Women in Independence earn 59.8 cents for every dollar earned by a man.
What is Inequality or Gini Index in Independence?
Inequality or Gini Index in Independence is 0.35.
What is the Total Population of Independence?
Total Population of Independence is 850.
What is the Total Male Population of Independence?
Total Male Population of Independence is 456.
What is the Total Female Population of Independence?
Total Female Population of Independence is 394.
What is the Ratio of Males per 100 Females in Independence?
There are 115.74 Males per 100 Females in Independence.
What is the Ratio of Females per 100 Males in Independence?
There are 86.40 Females per 100 Males in Independence.
What is the Median Population Age in Independence?
Median Population Age in Independence is 40.0 Years.
What is the Average Family Size in Independence
Average Family Size in Independence is 3.7 People.
What is the Average Household Size in Independence
Average Household Size in Independence is 2.4 People.
How Large is the Labor Force in Independence?
There are 274 People in the Labor Forcein in Independence.
What is the Percentage of People in the Labor Force in Independence?
41.8% of People are in the Labor Force in Independence.
What is the Unemployment Rate in Independence?
Unemployment Rate in Independence is 8.0%.