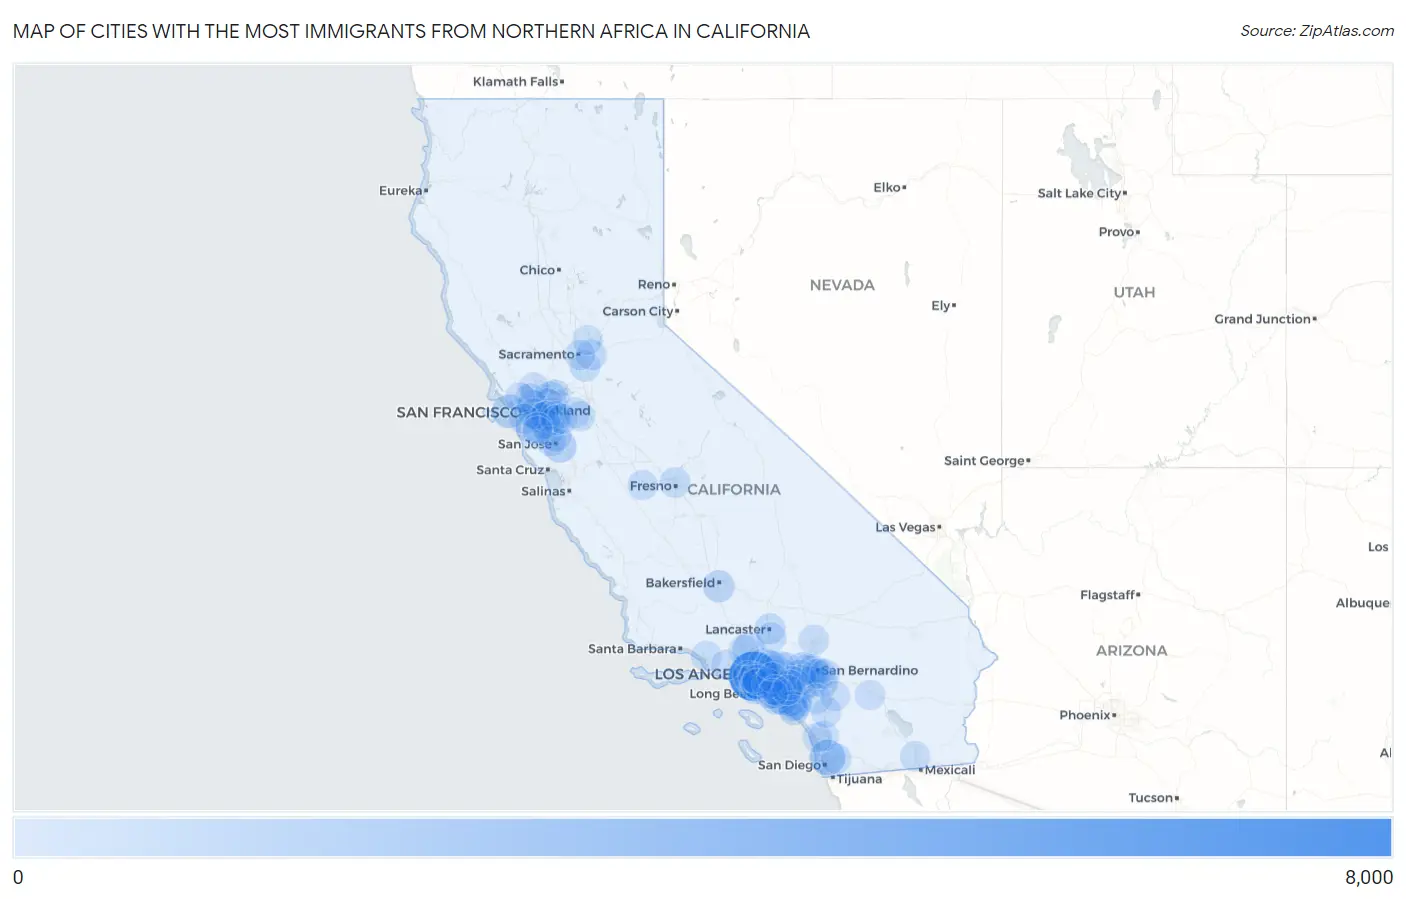
Cities with the Most Immigrants from Northern Africa in California
RELATED REPORTS & OPTIONS
Northern Africa
California
Compare Cities
Map of Cities with the Most Immigrants from Northern Africa in California
0
8,000
Cities with the Most Immigrants from Northern Africa in California
| City | Northern Africa | vs State | vs National | |
| 1. | Los Angeles | 7,970 | 61,708(12.92%)#1 | 421,832(1.89%)#3 |
| 2. | San Diego | 2,321 | 61,708(3.76%)#2 | 421,832(0.55%)#11 |
| 3. | Irvine | 1,731 | 61,708(2.81%)#3 | 421,832(0.41%)#20 |
| 4. | San Francisco | 1,407 | 61,708(2.28%)#4 | 421,832(0.33%)#27 |
| 5. | Anaheim | 1,338 | 61,708(2.17%)#5 | 421,832(0.32%)#29 |
| 6. | San Jose | 1,256 | 61,708(2.04%)#6 | 421,832(0.30%)#30 |
| 7. | Rancho Cucamonga | 1,145 | 61,708(1.86%)#7 | 421,832(0.27%)#34 |
| 8. | Fountain Valley | 928 | 61,708(1.50%)#8 | 421,832(0.22%)#45 |
| 9. | Concord | 896 | 61,708(1.45%)#9 | 421,832(0.21%)#46 |
| 10. | Santa Clarita | 888 | 61,708(1.44%)#10 | 421,832(0.21%)#47 |
| 11. | Bakersfield | 859 | 61,708(1.39%)#11 | 421,832(0.20%)#49 |
| 12. | Fontana | 808 | 61,708(1.31%)#12 | 421,832(0.19%)#55 |
| 13. | Long Beach | 754 | 61,708(1.22%)#13 | 421,832(0.18%)#60 |
| 14. | San Mateo | 698 | 61,708(1.13%)#14 | 421,832(0.17%)#71 |
| 15. | Huntington Beach | 689 | 61,708(1.12%)#15 | 421,832(0.16%)#73 |
| 16. | Glendale | 669 | 61,708(1.08%)#16 | 421,832(0.16%)#78 |
| 17. | Oakland | 665 | 61,708(1.08%)#17 | 421,832(0.16%)#79 |
| 18. | San Ramon | 657 | 61,708(1.06%)#18 | 421,832(0.16%)#81 |
| 19. | Lake Forest | 647 | 61,708(1.05%)#19 | 421,832(0.15%)#82 |
| 20. | Riverside | 604 | 61,708(0.98%)#20 | 421,832(0.14%)#91 |
| 21. | Torrance | 550 | 61,708(0.89%)#21 | 421,832(0.13%)#103 |
| 22. | Hawthorne | 503 | 61,708(0.82%)#22 | 421,832(0.12%)#115 |
| 23. | Corona | 492 | 61,708(0.80%)#23 | 421,832(0.12%)#119 |
| 24. | Rialto | 488 | 61,708(0.79%)#24 | 421,832(0.12%)#121 |
| 25. | Pittsburg | 477 | 61,708(0.77%)#25 | 421,832(0.11%)#123 |
| 26. | Lancaster | 469 | 61,708(0.76%)#26 | 421,832(0.11%)#126 |
| 27. | Westminster | 453 | 61,708(0.73%)#27 | 421,832(0.11%)#130 |
| 28. | Santa Monica | 449 | 61,708(0.73%)#28 | 421,832(0.11%)#132 |
| 29. | Richmond | 443 | 61,708(0.72%)#29 | 421,832(0.11%)#135 |
| 30. | Lawndale | 438 | 61,708(0.71%)#30 | 421,832(0.10%)#138 |
| 31. | Walnut Creek | 435 | 61,708(0.70%)#31 | 421,832(0.10%)#141 |
| 32. | Mission Viejo | 428 | 61,708(0.69%)#32 | 421,832(0.10%)#143 |
| 33. | Fremont | 422 | 61,708(0.68%)#33 | 421,832(0.10%)#147 |
| 34. | El Sobrante Cdp Riverside County | 406 | 61,708(0.66%)#34 | 421,832(0.10%)#153 |
| 35. | Downey | 402 | 61,708(0.65%)#35 | 421,832(0.10%)#154 |
| 36. | San Leandro | 390 | 61,708(0.63%)#36 | 421,832(0.09%)#158 |
| 37. | Moreno Valley | 376 | 61,708(0.61%)#37 | 421,832(0.09%)#164 |
| 38. | Milpitas | 374 | 61,708(0.61%)#38 | 421,832(0.09%)#165 |
| 39. | Elk Grove | 373 | 61,708(0.60%)#39 | 421,832(0.09%)#166 |
| 40. | Fresno | 369 | 61,708(0.60%)#40 | 421,832(0.09%)#170 |
| 41. | Rancho Cordova | 368 | 61,708(0.60%)#41 | 421,832(0.09%)#171 |
| 42. | Hayward | 354 | 61,708(0.57%)#42 | 421,832(0.08%)#181 |
| 43. | Bellflower | 329 | 61,708(0.53%)#43 | 421,832(0.08%)#200 |
| 44. | El Cajon | 325 | 61,708(0.53%)#44 | 421,832(0.08%)#203 |
| 45. | Ontario | 321 | 61,708(0.52%)#45 | 421,832(0.08%)#208 |
| 46. | Berkeley | 312 | 61,708(0.51%)#46 | 421,832(0.07%)#218 |
| 47. | San Buenaventura Ventura | 312 | 61,708(0.51%)#47 | 421,832(0.07%)#219 |
| 48. | Alameda | 307 | 61,708(0.50%)#48 | 421,832(0.07%)#225 |
| 49. | Glendora | 307 | 61,708(0.50%)#49 | 421,832(0.07%)#226 |
| 50. | West Covina | 292 | 61,708(0.47%)#50 | 421,832(0.07%)#239 |
| 51. | Eastvale | 285 | 61,708(0.46%)#51 | 421,832(0.07%)#247 |
| 52. | Duarte | 284 | 61,708(0.46%)#52 | 421,832(0.07%)#249 |
| 53. | Garden Grove | 273 | 61,708(0.44%)#53 | 421,832(0.06%)#256 |
| 54. | Costa Mesa | 269 | 61,708(0.44%)#54 | 421,832(0.06%)#259 |
| 55. | Dublin | 263 | 61,708(0.43%)#55 | 421,832(0.06%)#263 |
| 56. | Castro Valley | 258 | 61,708(0.42%)#56 | 421,832(0.06%)#268 |
| 57. | Del Aire | 239 | 61,708(0.39%)#57 | 421,832(0.06%)#294 |
| 58. | Mountain House | 238 | 61,708(0.39%)#58 | 421,832(0.06%)#297 |
| 59. | Loma Linda | 228 | 61,708(0.37%)#59 | 421,832(0.05%)#307 |
| 60. | Fullerton | 226 | 61,708(0.37%)#60 | 421,832(0.05%)#310 |
| 61. | Imperial | 226 | 61,708(0.37%)#61 | 421,832(0.05%)#312 |
| 62. | Victorville | 225 | 61,708(0.36%)#62 | 421,832(0.05%)#314 |
| 63. | Chino Hills | 221 | 61,708(0.36%)#63 | 421,832(0.05%)#322 |
| 64. | Culver City | 221 | 61,708(0.36%)#64 | 421,832(0.05%)#323 |
| 65. | Tracy | 219 | 61,708(0.35%)#65 | 421,832(0.05%)#327 |
| 66. | Stevenson Ranch | 219 | 61,708(0.35%)#66 | 421,832(0.05%)#329 |
| 67. | Sacramento | 216 | 61,708(0.35%)#67 | 421,832(0.05%)#336 |
| 68. | Mendota | 213 | 61,708(0.35%)#68 | 421,832(0.05%)#340 |
| 69. | Santa Clara | 212 | 61,708(0.34%)#69 | 421,832(0.05%)#341 |
| 70. | Aliso Viejo | 209 | 61,708(0.34%)#70 | 421,832(0.05%)#349 |
| 71. | Stanton | 209 | 61,708(0.34%)#71 | 421,832(0.05%)#350 |
| 72. | Paramount | 205 | 61,708(0.33%)#72 | 421,832(0.05%)#357 |
| 73. | Laguna Niguel | 201 | 61,708(0.33%)#73 | 421,832(0.05%)#362 |
| 74. | Palmdale | 190 | 61,708(0.31%)#74 | 421,832(0.05%)#389 |
| 75. | Yorba Linda | 189 | 61,708(0.31%)#75 | 421,832(0.04%)#392 |
| 76. | Vallejo | 188 | 61,708(0.30%)#76 | 421,832(0.04%)#394 |
| 77. | Yermo | 188 | 61,708(0.30%)#77 | 421,832(0.04%)#397 |
| 78. | Palm Desert | 187 | 61,708(0.30%)#78 | 421,832(0.04%)#399 |
| 79. | Pleasanton | 182 | 61,708(0.29%)#79 | 421,832(0.04%)#410 |
| 80. | Inglewood | 179 | 61,708(0.29%)#80 | 421,832(0.04%)#416 |
| 81. | Thousand Oaks | 175 | 61,708(0.28%)#81 | 421,832(0.04%)#426 |
| 82. | Colton | 175 | 61,708(0.28%)#82 | 421,832(0.04%)#427 |
| 83. | Redlands | 168 | 61,708(0.27%)#83 | 421,832(0.04%)#437 |
| 84. | Lake Elsinore | 165 | 61,708(0.27%)#84 | 421,832(0.04%)#445 |
| 85. | Livermore | 163 | 61,708(0.26%)#85 | 421,832(0.04%)#449 |
| 86. | San Rafael | 161 | 61,708(0.26%)#86 | 421,832(0.04%)#456 |
| 87. | Daly City | 158 | 61,708(0.26%)#87 | 421,832(0.04%)#465 |
| 88. | Roseville | 156 | 61,708(0.25%)#88 | 421,832(0.04%)#467 |
| 89. | Sierra Madre | 156 | 61,708(0.25%)#89 | 421,832(0.04%)#469 |
| 90. | San Marcos | 155 | 61,708(0.25%)#90 | 421,832(0.04%)#470 |
| 91. | Foster City | 154 | 61,708(0.25%)#91 | 421,832(0.04%)#473 |
| 92. | Pasadena | 153 | 61,708(0.25%)#92 | 421,832(0.04%)#478 |
| 93. | Redwood City | 152 | 61,708(0.25%)#93 | 421,832(0.04%)#481 |
| 94. | Pico Rivera | 152 | 61,708(0.25%)#94 | 421,832(0.04%)#483 |
| 95. | Carlsbad | 149 | 61,708(0.24%)#95 | 421,832(0.04%)#492 |
| 96. | Cypress | 149 | 61,708(0.24%)#96 | 421,832(0.04%)#494 |
| 97. | Temecula | 148 | 61,708(0.24%)#97 | 421,832(0.04%)#498 |
| 98. | Orange | 147 | 61,708(0.24%)#98 | 421,832(0.03%)#500 |
| 99. | Hemet | 147 | 61,708(0.24%)#99 | 421,832(0.03%)#502 |
| 100. | Seal Beach | 147 | 61,708(0.24%)#100 | 421,832(0.03%)#504 |
Common Questions
What are the Top 10 Cities with the Most Immigrants from Northern Africa in California?
Top 10 Cities with the Most Immigrants from Northern Africa in California are:
#1
7,970
#2
2,321
#3
1,731
#4
1,407
#5
1,338
#6
1,256
#7
1,145
#8
928
#9
896
#10
888
What city has the Most Immigrants from Northern Africa in California?
Los Angeles has the Most Immigrants from Northern Africa in California with 7,970.
What is the Total Immigrants from Northern Africa in the State of California?
Total Immigrants from Northern Africa in California is 61,708.
What is the Total Immigrants from Northern Africa in the United States?
Total Immigrants from Northern Africa in the United States is 421,832.