Cities with the Largest Inupiat Community in California
RELATED REPORTS & OPTIONS
Inupiat
California
Compare Cities
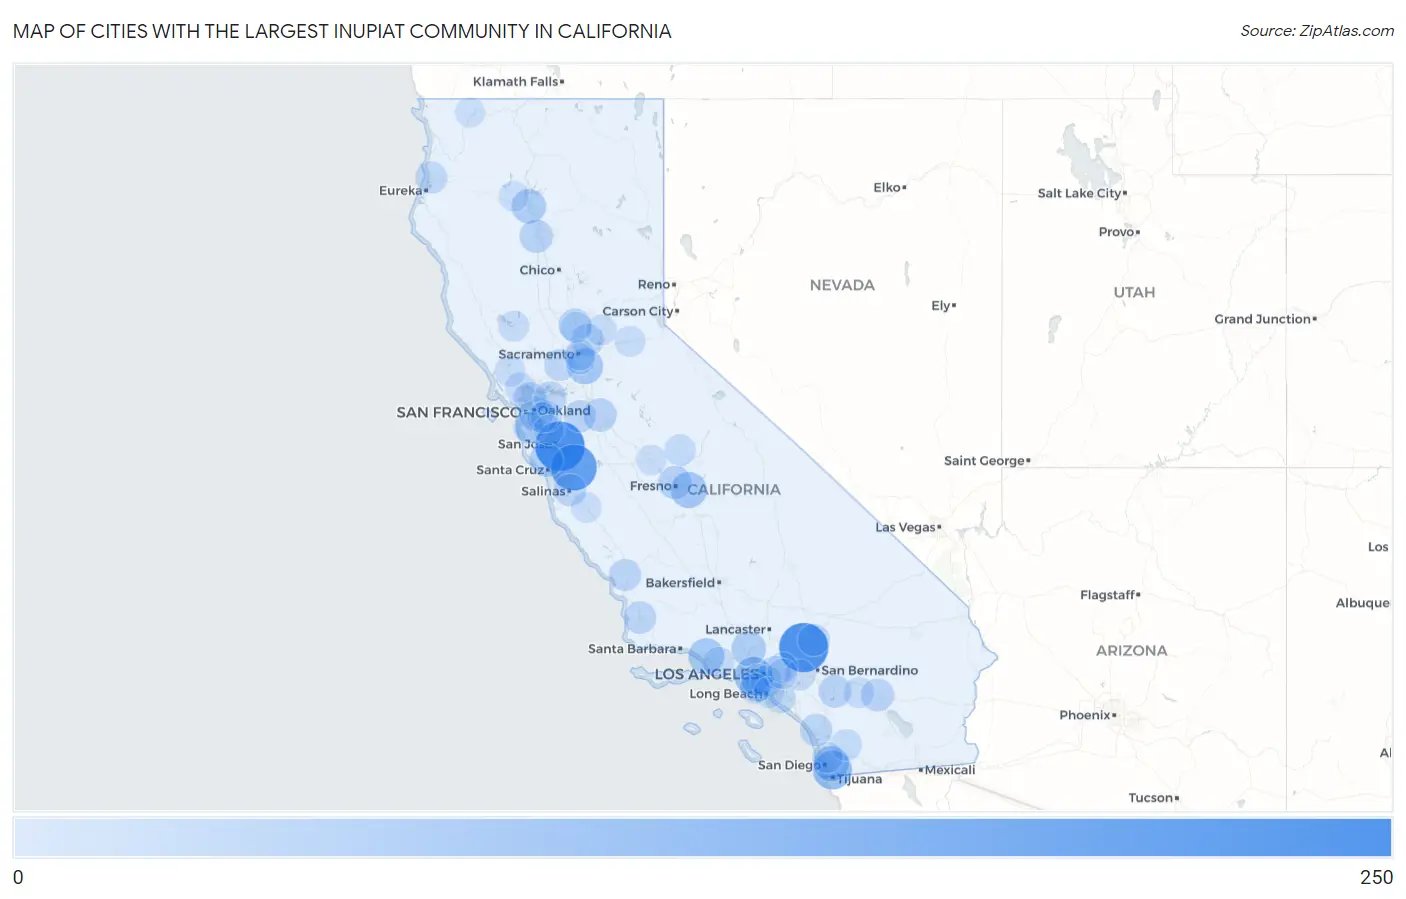
Map of Cities with the Largest Inupiat Community in California
0
250
Cities with the Largest Inupiat Community in California
| City | Inupiat | vs State | vs National | |
| 1. | San Jose | 237 | 2,263(10.47%)#1 | 46,707(0.51%)#30 |
| 2. | Phelan | 232 | 2,263(10.25%)#2 | 46,707(0.50%)#32 |
| 3. | Gilroy | 194 | 2,263(8.57%)#3 | 46,707(0.42%)#38 |
| 4. | Chula Vista | 106 | 2,263(4.68%)#4 | 46,707(0.23%)#64 |
| 5. | Los Angeles | 100 | 2,263(4.42%)#5 | 46,707(0.21%)#69 |
| 6. | Sanger | 71 | 2,263(3.14%)#6 | 46,707(0.15%)#100 |
| 7. | Elk Grove | 70 | 2,263(3.09%)#7 | 46,707(0.15%)#102 |
| 8. | San Buenaventura Ventura | 68 | 2,263(3.00%)#8 | 46,707(0.15%)#105 |
| 9. | Lemon Grove | 63 | 2,263(2.78%)#9 | 46,707(0.13%)#112 |
| 10. | Santa Clarita | 53 | 2,263(2.34%)#10 | 46,707(0.11%)#125 |
| 11. | Redding | 52 | 2,263(2.30%)#11 | 46,707(0.11%)#127 |
| 12. | Oakland | 49 | 2,263(2.17%)#12 | 46,707(0.10%)#133 |
| 13. | Lompico | 44 | 2,263(1.94%)#13 | 46,707(0.09%)#150 |
| 14. | Fresno | 39 | 2,263(1.72%)#14 | 46,707(0.08%)#163 |
| 15. | Richmond | 39 | 2,263(1.72%)#15 | 46,707(0.08%)#164 |
| 16. | Ripon | 38 | 2,263(1.68%)#16 | 46,707(0.08%)#168 |
| 17. | Red Bluff | 38 | 2,263(1.68%)#17 | 46,707(0.08%)#169 |
| 18. | Indio | 33 | 2,263(1.46%)#18 | 46,707(0.07%)#188 |
| 19. | San Jacinto | 32 | 2,263(1.41%)#19 | 46,707(0.07%)#193 |
| 20. | Plumas Lake | 31 | 2,263(1.37%)#20 | 46,707(0.07%)#200 |
| 21. | Lawndale | 30 | 2,263(1.33%)#21 | 46,707(0.06%)#204 |
| 22. | Roseville | 29 | 2,263(1.28%)#22 | 46,707(0.06%)#205 |
| 23. | El Monte | 29 | 2,263(1.28%)#23 | 46,707(0.06%)#206 |
| 24. | Oceanside | 28 | 2,263(1.24%)#24 | 46,707(0.06%)#208 |
| 25. | Orcutt | 28 | 2,263(1.24%)#25 | 46,707(0.06%)#210 |
| 26. | Salinas | 26 | 2,263(1.15%)#26 | 46,707(0.06%)#218 |
| 27. | Concord | 26 | 2,263(1.15%)#27 | 46,707(0.06%)#219 |
| 28. | Victorville | 24 | 2,263(1.06%)#28 | 46,707(0.05%)#236 |
| 29. | Tracy | 24 | 2,263(1.06%)#29 | 46,707(0.05%)#237 |
| 30. | Atascadero | 24 | 2,263(1.06%)#30 | 46,707(0.05%)#240 |
| 31. | Mckinleyville | 23 | 2,263(1.02%)#31 | 46,707(0.05%)#255 |
| 32. | Dixon | 21 | 2,263(0.93%)#32 | 46,707(0.04%)#270 |
| 33. | Inglewood | 20 | 2,263(0.88%)#33 | 46,707(0.04%)#272 |
| 34. | San Mateo | 20 | 2,263(0.88%)#34 | 46,707(0.04%)#273 |
| 35. | South Gate | 17 | 2,263(0.75%)#35 | 46,707(0.04%)#305 |
| 36. | Castro Valley | 17 | 2,263(0.75%)#36 | 46,707(0.04%)#306 |
| 37. | Fountain Valley | 16 | 2,263(0.71%)#37 | 46,707(0.03%)#323 |
| 38. | San Diego Country Estates | 15 | 2,263(0.66%)#38 | 46,707(0.03%)#341 |
| 39. | Coarsegold | 15 | 2,263(0.66%)#39 | 46,707(0.03%)#343 |
| 40. | Rio Oso | 15 | 2,263(0.66%)#40 | 46,707(0.03%)#348 |
| 41. | Camarillo | 12 | 2,263(0.53%)#41 | 46,707(0.03%)#380 |
| 42. | Palm Springs | 11 | 2,263(0.49%)#42 | 46,707(0.02%)#401 |
| 43. | Rohnert Park | 10 | 2,263(0.44%)#43 | 46,707(0.02%)#419 |
| 44. | Hillsborough | 10 | 2,263(0.44%)#44 | 46,707(0.02%)#428 |
| 45. | San Diego | 9 | 2,263(0.40%)#45 | 46,707(0.02%)#441 |
| 46. | Long Beach | 9 | 2,263(0.40%)#46 | 46,707(0.02%)#443 |
| 47. | Ontario | 9 | 2,263(0.40%)#47 | 46,707(0.02%)#446 |
| 48. | Clearlake | 9 | 2,263(0.40%)#48 | 46,707(0.02%)#454 |
| 49. | Lemon Hill | 9 | 2,263(0.40%)#49 | 46,707(0.02%)#456 |
| 50. | Auburn | 9 | 2,263(0.40%)#50 | 46,707(0.02%)#457 |
| 51. | Sacramento | 8 | 2,263(0.35%)#51 | 46,707(0.02%)#467 |
| 52. | Pollock Pines | 8 | 2,263(0.35%)#52 | 46,707(0.02%)#482 |
| 53. | Soledad | 7 | 2,263(0.31%)#53 | 46,707(0.01%)#501 |
| 54. | Torrance | 5 | 2,263(0.22%)#54 | 46,707(0.01%)#552 |
| 55. | Ashland | 5 | 2,263(0.22%)#55 | 46,707(0.01%)#561 |
| 56. | Chowchilla | 5 | 2,263(0.22%)#56 | 46,707(0.01%)#563 |
| 57. | Black Point Green Point | 5 | 2,263(0.22%)#57 | 46,707(0.01%)#571 |
| 58. | Azusa | 4 | 2,263(0.18%)#58 | 46,707(0.01%)#580 |
| 59. | West Covina | 3 | 2,263(0.13%)#59 | 46,707(0.01%)#613 |
| 60. | French Gulch | 3 | 2,263(0.13%)#60 | 46,707(0.01%)#643 |
| 61. | Fremont | 2 | 2,263(0.09%)#61 | 46,707(0.00%)#651 |
| 62. | Happy Camp | 2 | 2,263(0.09%)#62 | 46,707(0.00%)#674 |
Common Questions
What are the Top 10 Cities with the Largest Inupiat Community in California?
Top 10 Cities with the Largest Inupiat Community in California are:
#1
237
#2
232
#3
194
#4
106
#5
100
#6
71
#7
70
#8
68
#9
63
#10
53
What city has the Largest Inupiat Community in California?
San Jose has the Largest Inupiat Community in California with 237.
What is the Total Inupiat Population in the State of California?
Total Inupiat Population in California is 2,263.
What is the Total Inupiat Population in the United States?
Total Inupiat Population in the United States is 46,707.