Cities with the Highest Percentage of Population Employed in Installation, Maintenance & Repair in Texas
RELATED REPORTS & OPTIONS
Installation, Maintenance & Repair
Texas
Compare Cities
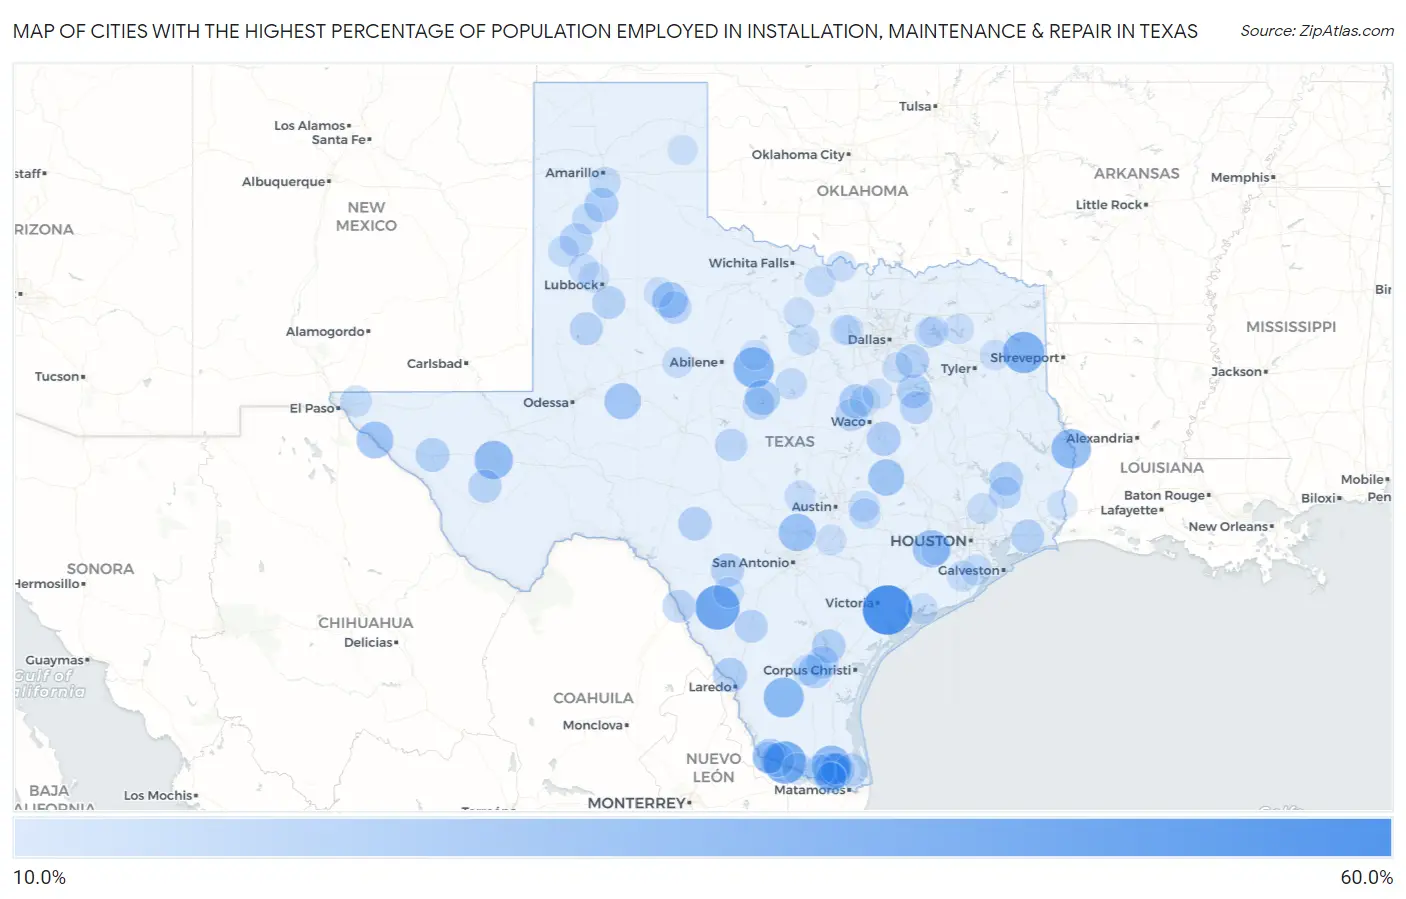
Map of Cities with the Highest Percentage of Population Employed in Installation, Maintenance & Repair in Texas
0.0%
60.0%
Cities with the Highest Percentage of Population Employed in Installation, Maintenance & Repair in Texas
| City | % Employed | vs State | vs National | |
| 1. | Placedo | 58.6% | 3.4%(+55.2)#1 | 3.1%(+55.6)#49 |
| 2. | Brookston | 46.2% | 3.4%(+42.8)#2 | 3.1%(+43.1)#99 |
| 3. | Loma Grande | 45.7% | 3.4%(+42.3)#3 | 3.1%(+42.7)#102 |
| 4. | Pablo Pena | 41.2% | 3.4%(+37.8)#4 | 3.1%(+38.2)#135 |
| 5. | Nesbitt | 38.5% | 3.4%(+35.1)#5 | 3.1%(+35.4)#158 |
| 6. | Putnam | 36.4% | 3.4%(+33.0)#6 | 3.1%(+33.3)#184 |
| 7. | Las Lomitas | 35.5% | 3.4%(+32.1)#7 | 3.1%(+32.4)#192 |
| 8. | South Toledo Bend | 34.0% | 3.4%(+30.6)#8 | 3.1%(+30.9)#212 |
| 9. | Road Runner | 33.8% | 3.4%(+30.4)#9 | 3.1%(+30.8)#213 |
| 10. | Tierra Bonita | 32.8% | 3.4%(+29.4)#10 | 3.1%(+29.7)#239 |
| 11. | Balmorhea | 31.5% | 3.4%(+28.1)#11 | 3.1%(+28.5)#256 |
| 12. | Mccaulley | 30.8% | 3.4%(+27.4)#12 | 3.1%(+27.7)#272 |
| 13. | Red Rock | 30.6% | 3.4%(+27.2)#13 | 3.1%(+27.5)#275 |
| 14. | Sheridan | 29.8% | 3.4%(+26.4)#14 | 3.1%(+26.7)#286 |
| 15. | La Feria North | 29.3% | 3.4%(+25.9)#15 | 3.1%(+26.2)#296 |
| 16. | Spring Branch | 29.1% | 3.4%(+25.7)#16 | 3.1%(+26.1)#301 |
| 17. | Wallis | 28.7% | 3.4%(+25.3)#17 | 3.1%(+25.7)#313 |
| 18. | Sunset Cdp Montague County | 28.6% | 3.4%(+25.2)#18 | 3.1%(+25.5)#314 |
| 19. | Fort Hancock | 27.7% | 3.4%(+24.3)#19 | 3.1%(+24.6)#341 |
| 20. | Milano | 26.4% | 3.4%(+23.0)#20 | 3.1%(+23.4)#368 |
| 21. | Garden City | 26.3% | 3.4%(+22.9)#21 | 3.1%(+23.2)#371 |
| 22. | Juarez | 25.3% | 3.4%(+21.8)#22 | 3.1%(+22.2)#404 |
| 23. | Girard | 25.0% | 3.4%(+21.6)#23 | 3.1%(+21.9)#427 |
| 24. | Yancey | 23.5% | 3.4%(+20.1)#24 | 3.1%(+20.4)#483 |
| 25. | Benjamin Perez | 23.0% | 3.4%(+19.6)#25 | 3.1%(+19.9)#504 |
| 26. | Thunderbird Bay | 22.9% | 3.4%(+19.5)#26 | 3.1%(+19.8)#509 |
| 27. | Ranchos Penitas West | 21.6% | 3.4%(+18.1)#27 | 3.1%(+18.5)#567 |
| 28. | Happy | 21.5% | 3.4%(+18.1)#28 | 3.1%(+18.4)#573 |
| 29. | Garza Salinas Ii | 21.4% | 3.4%(+18.0)#29 | 3.1%(+18.4)#574 |
| 30. | Marlin | 21.2% | 3.4%(+17.8)#30 | 3.1%(+18.1)#591 |
| 31. | Laguna Park | 21.2% | 3.4%(+17.8)#31 | 3.1%(+18.1)#592 |
| 32. | Valera | 20.8% | 3.4%(+17.4)#32 | 3.1%(+17.8)#617 |
| 33. | Van Horn | 20.6% | 3.4%(+17.2)#33 | 3.1%(+17.5)#629 |
| 34. | Rancho Alegre | 20.5% | 3.4%(+17.1)#34 | 3.1%(+17.4)#638 |
| 35. | Lakeshore Gardens Hidden Acres | 20.4% | 3.4%(+17.0)#35 | 3.1%(+17.3)#643 |
| 36. | Navarro | 20.3% | 3.4%(+16.9)#36 | 3.1%(+17.2)#655 |
| 37. | Indian Springs | 20.3% | 3.4%(+16.9)#37 | 3.1%(+17.2)#656 |
| 38. | Rocksprings | 20.0% | 3.4%(+16.6)#38 | 3.1%(+16.9)#670 |
| 39. | Cottonwood | 19.8% | 3.4%(+16.4)#39 | 3.1%(+16.7)#688 |
| 40. | Winnie | 19.8% | 3.4%(+16.4)#40 | 3.1%(+16.7)#690 |
| 41. | Knippa | 19.4% | 3.4%(+16.0)#41 | 3.1%(+16.3)#709 |
| 42. | Fort Davis | 19.2% | 3.4%(+15.8)#42 | 3.1%(+16.1)#725 |
| 43. | Springlake | 19.0% | 3.4%(+15.6)#43 | 3.1%(+16.0)#731 |
| 44. | Wilson | 18.9% | 3.4%(+15.5)#44 | 3.1%(+15.9)#734 |
| 45. | La Tina Ranch | 18.8% | 3.4%(+15.4)#45 | 3.1%(+15.8)#738 |
| 46. | Welch | 18.8% | 3.4%(+15.4)#46 | 3.1%(+15.8)#739 |
| 47. | Cotulla | 18.7% | 3.4%(+15.3)#47 | 3.1%(+15.7)#756 |
| 48. | Kirvin | 18.2% | 3.4%(+14.8)#48 | 3.1%(+15.1)#799 |
| 49. | Seco Mines | 18.1% | 3.4%(+14.7)#49 | 3.1%(+15.0)#813 |
| 50. | Alfred | 18.1% | 3.4%(+14.7)#50 | 3.1%(+15.0)#815 |
| 51. | Melvin | 17.6% | 3.4%(+14.2)#51 | 3.1%(+14.5)#856 |
| 52. | Jayton | 17.5% | 3.4%(+14.1)#52 | 3.1%(+14.4)#861 |
| 53. | Valley Mills | 16.9% | 3.4%(+13.5)#53 | 3.1%(+13.8)#909 |
| 54. | Bluff Dale | 16.7% | 3.4%(+13.3)#54 | 3.1%(+13.6)#942 |
| 55. | Lake Brownwood | 16.6% | 3.4%(+13.2)#55 | 3.1%(+13.6)#958 |
| 56. | Big Thicket Lake Estates | 16.5% | 3.4%(+13.1)#56 | 3.1%(+13.5)#966 |
| 57. | Los Barreras | 16.0% | 3.4%(+12.6)#57 | 3.1%(+12.9)#1,027 |
| 58. | Santa Maria | 15.8% | 3.4%(+12.4)#58 | 3.1%(+12.7)#1,038 |
| 59. | Homestead Meadows North | 15.3% | 3.4%(+11.9)#59 | 3.1%(+12.2)#1,103 |
| 60. | Abram | 15.2% | 3.4%(+11.8)#60 | 3.1%(+12.2)#1,115 |
| 61. | Palisades | 15.0% | 3.4%(+11.6)#61 | 3.1%(+11.9)#1,152 |
| 62. | De Leon | 15.0% | 3.4%(+11.6)#62 | 3.1%(+11.9)#1,169 |
| 63. | Nazareth | 14.5% | 3.4%(+11.1)#63 | 3.1%(+11.4)#1,238 |
| 64. | Sudan | 14.4% | 3.4%(+11.0)#64 | 3.1%(+11.3)#1,252 |
| 65. | Round Mountain | 14.3% | 3.4%(+10.9)#65 | 3.1%(+11.2)#1,277 |
| 66. | Midway North | 14.3% | 3.4%(+10.9)#66 | 3.1%(+11.2)#1,285 |
| 67. | San Diego | 14.3% | 3.4%(+10.9)#67 | 3.1%(+11.2)#1,286 |
| 68. | Mcdade | 14.2% | 3.4%(+10.8)#68 | 3.1%(+11.2)#1,292 |
| 69. | Bellevue | 14.1% | 3.4%(+10.7)#69 | 3.1%(+11.1)#1,305 |
| 70. | Circle D Kc Estates | 14.1% | 3.4%(+10.7)#70 | 3.1%(+11.1)#1,308 |
| 71. | Liverpool | 14.0% | 3.4%(+10.6)#71 | 3.1%(+11.0)#1,329 |
| 72. | Palo Pinto | 14.0% | 3.4%(+10.6)#72 | 3.1%(+10.9)#1,334 |
| 73. | Splendora | 13.9% | 3.4%(+10.5)#73 | 3.1%(+10.9)#1,346 |
| 74. | Holiday Lakes | 13.9% | 3.4%(+10.5)#74 | 3.1%(+10.8)#1,357 |
| 75. | Las Palmas Ii | 13.7% | 3.4%(+10.3)#75 | 3.1%(+10.6)#1,394 |
| 76. | Aquilla | 13.6% | 3.4%(+10.2)#76 | 3.1%(+10.6)#1,406 |
| 77. | Whitharral | 13.5% | 3.4%(+10.1)#77 | 3.1%(+10.4)#1,435 |
| 78. | Batesville | 13.4% | 3.4%(+10.00)#78 | 3.1%(+10.3)#1,467 |
| 79. | Garrett | 13.4% | 3.4%(+9.99)#79 | 3.1%(+10.3)#1,468 |
| 80. | Roscoe | 13.3% | 3.4%(+9.93)#80 | 3.1%(+10.3)#1,478 |
| 81. | Palacios | 13.3% | 3.4%(+9.88)#81 | 3.1%(+10.2)#1,499 |
| 82. | Hawk Cove | 13.2% | 3.4%(+9.81)#82 | 3.1%(+10.1)#1,512 |
| 83. | Shallowater | 13.2% | 3.4%(+9.80)#83 | 3.1%(+10.1)#1,517 |
| 84. | Anton | 13.1% | 3.4%(+9.73)#84 | 3.1%(+10.1)#1,528 |
| 85. | Bryson | 13.0% | 3.4%(+9.63)#85 | 3.1%(+9.96)#1,564 |
| 86. | Staples | 13.0% | 3.4%(+9.61)#86 | 3.1%(+9.95)#1,569 |
| 87. | Yantis | 12.9% | 3.4%(+9.54)#87 | 3.1%(+9.87)#1,586 |
| 88. | Spur | 12.9% | 3.4%(+9.53)#88 | 3.1%(+9.86)#1,589 |
| 89. | Alanreed | 12.9% | 3.4%(+9.50)#89 | 3.1%(+9.84)#1,600 |
| 90. | Nocona Hills | 12.9% | 3.4%(+9.46)#90 | 3.1%(+9.80)#1,608 |
| 91. | Gladewater | 12.7% | 3.4%(+9.27)#91 | 3.1%(+9.60)#1,652 |
| 92. | West Tawakoni | 12.6% | 3.4%(+9.15)#92 | 3.1%(+9.49)#1,683 |
| 93. | Orchard | 12.5% | 3.4%(+9.10)#93 | 3.1%(+9.43)#1,691 |
| 94. | Moran | 12.5% | 3.4%(+9.10)#94 | 3.1%(+9.43)#1,698 |
| 95. | Pelican Bay | 12.4% | 3.4%(+8.95)#95 | 3.1%(+9.29)#1,736 |
| 96. | Sanctuary | 12.3% | 3.4%(+8.89)#96 | 3.1%(+9.23)#1,746 |
| 97. | Deweyville | 12.2% | 3.4%(+8.79)#97 | 3.1%(+9.13)#1,780 |
| 98. | Bluetown | 12.1% | 3.4%(+8.74)#98 | 3.1%(+9.08)#1,788 |
| 99. | Mobeetie | 12.1% | 3.4%(+8.67)#99 | 3.1%(+9.00)#1,807 |
| 100. | Bynum | 12.0% | 3.4%(+8.63)#100 | 3.1%(+8.97)#1,816 |
Common Questions
What are the Top 10 Cities with the Highest Percentage of Population Employed in Installation, Maintenance & Repair in Texas?
Top 10 Cities with the Highest Percentage of Population Employed in Installation, Maintenance & Repair in Texas are:
#1
58.6%
#2
45.7%
#3
41.2%
#4
38.5%
#5
36.4%
#6
35.5%
#7
34.0%
#8
32.8%
#9
31.5%
#10
29.3%
What city has the Highest Percentage of Population Employed in Installation, Maintenance & Repair in Texas?
Placedo has the Highest Percentage of Population Employed in Installation, Maintenance & Repair in Texas with 58.6%.
What is the Percentage of Population Employed in Installation, Maintenance & Repair in the State of Texas?
Percentage of Population Employed in Installation, Maintenance & Repair in Texas is 3.4%.
What is the Percentage of Population Employed in Installation, Maintenance & Repair in the United States?
Percentage of Population Employed in Installation, Maintenance & Repair in the United States is 3.1%.