Cities with the Highest Poverty Level Among Children Under the Age of 16 in California
RELATED REPORTS & OPTIONS
Highest Poverty | Child 0-16
California
Compare Cities
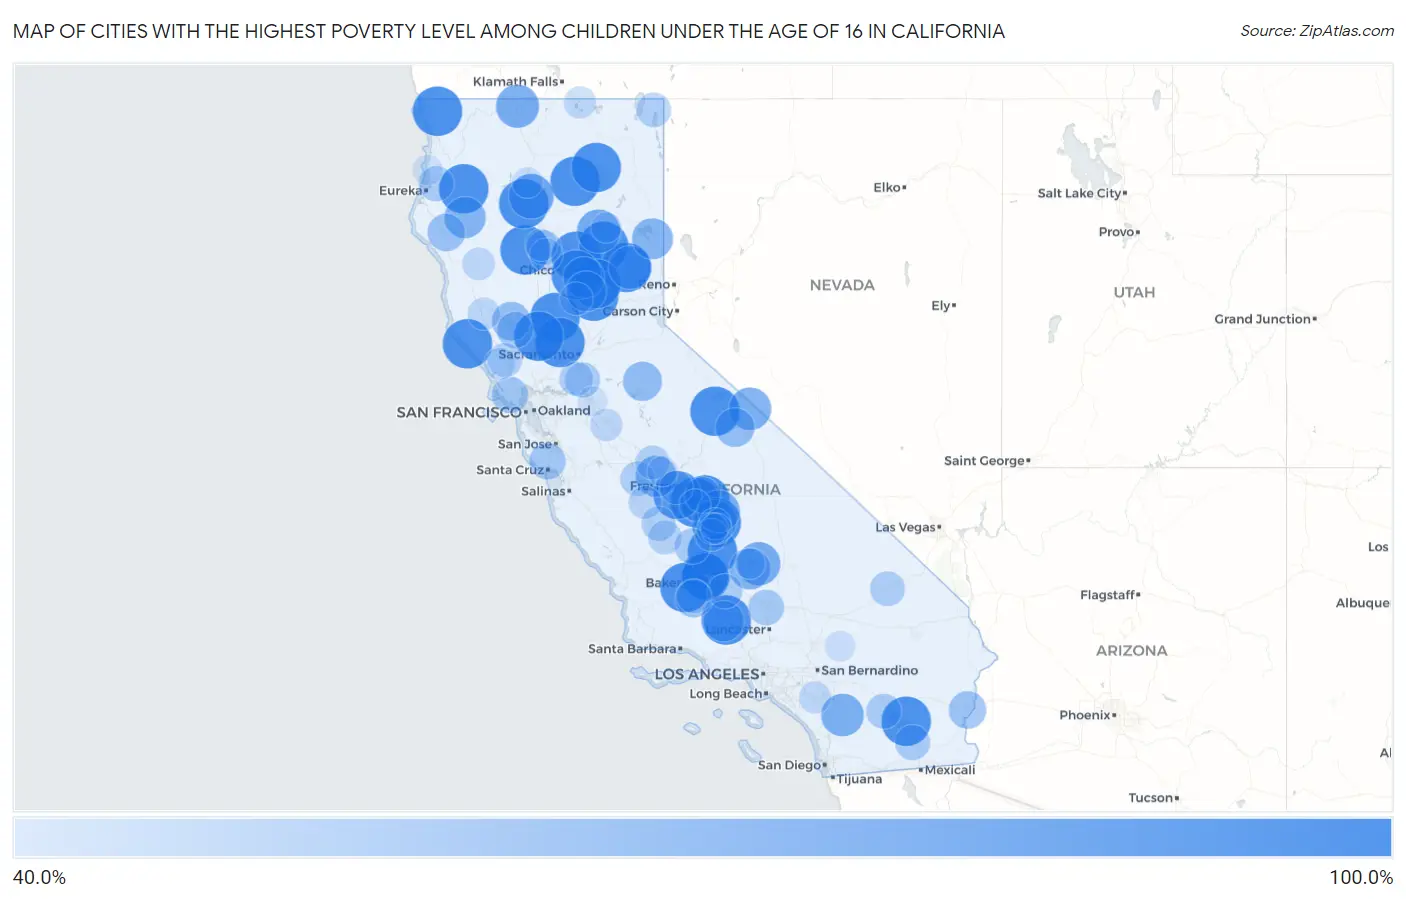
Map of Cities with the Highest Poverty Level Among Children Under the Age of 16 in California
0.0%
100.0%
Cities with the Highest Poverty Level Among Children Under the Age of 16 in California
| City | Child Poverty | vs State | vs National | |
| 1. | Sea Ranch | 100.0% | 15.7%(+84.3)#1 | 16.9%(+83.1)#18 |
| 2. | Delft Colony | 100.0% | 15.7%(+84.3)#2 | 16.9%(+83.1)#26 |
| 3. | Lebec | 100.0% | 15.7%(+84.3)#3 | 16.9%(+83.1)#38 |
| 4. | Rancho Tehama Reserve | 100.0% | 15.7%(+84.3)#4 | 16.9%(+83.1)#49 |
| 5. | Stirling City | 100.0% | 15.7%(+84.3)#5 | 16.9%(+83.1)#88 |
| 6. | Edison | 100.0% | 15.7%(+84.3)#6 | 16.9%(+83.1)#89 |
| 7. | East Orosi | 100.0% | 15.7%(+84.3)#7 | 16.9%(+83.1)#104 |
| 8. | Dobbins | 100.0% | 15.7%(+84.3)#8 | 16.9%(+83.1)#105 |
| 9. | Graeagle | 100.0% | 15.7%(+84.3)#9 | 16.9%(+83.1)#109 |
| 10. | Gasquet | 100.0% | 15.7%(+84.3)#10 | 16.9%(+83.1)#119 |
| 11. | Grimes | 100.0% | 15.7%(+84.3)#11 | 16.9%(+83.1)#122 |
| 12. | Twain | 100.0% | 15.7%(+84.3)#12 | 16.9%(+83.1)#131 |
| 13. | Clipper Mills | 100.0% | 15.7%(+84.3)#13 | 16.9%(+83.1)#135 |
| 14. | Mexican Colony | 100.0% | 15.7%(+84.3)#15 | 16.9%(+83.1)#143 |
| 15. | June Lake | 100.0% | 15.7%(+84.3)#16 | 16.9%(+83.1)#144 |
| 16. | Yolo | 100.0% | 15.7%(+84.3)#17 | 16.9%(+83.1)#160 |
| 17. | Bombay Beach | 100.0% | 15.7%(+84.3)#18 | 16.9%(+83.1)#183 |
| 18. | Burnt Ranch | 100.0% | 15.7%(+84.3)#19 | 16.9%(+83.1)#193 |
| 19. | Cassel | 100.0% | 15.7%(+84.3)#20 | 16.9%(+83.1)#194 |
| 20. | Cherokee | 100.0% | 15.7%(+84.3)#21 | 16.9%(+83.1)#214 |
| 21. | Guinda | 100.0% | 15.7%(+84.3)#22 | 16.9%(+83.1)#225 |
| 22. | La Grange | 100.0% | 15.7%(+84.3)#23 | 16.9%(+83.1)#276 |
| 23. | Keswick | 100.0% | 15.7%(+84.3)#24 | 16.9%(+83.1)#288 |
| 24. | Mckittrick | 100.0% | 15.7%(+84.3)#25 | 16.9%(+83.1)#356 |
| 25. | El Rancho | 100.0% | 15.7%(+84.3)#26 | 16.9%(+83.1)#407 |
| 26. | Rodriguez Camp | 100.0% | 15.7%(+84.3)#27 | 16.9%(+83.1)#427 |
| 27. | Nubieber | 100.0% | 15.7%(+84.3)#28 | 16.9%(+83.1)#450 |
| 28. | Wautec | 100.0% | 15.7%(+84.3)#29 | 16.9%(+83.1)#488 |
| 29. | Bowles | 96.0% | 15.7%(+80.3)#30 | 16.9%(+79.1)#506 |
| 30. | Cherokee Strip | 92.5% | 15.7%(+76.8)#31 | 16.9%(+75.6)#538 |
| 31. | Weitchpec | 89.5% | 15.7%(+73.8)#32 | 16.9%(+72.5)#587 |
| 32. | Mountain Gate | 87.0% | 15.7%(+71.3)#33 | 16.9%(+70.1)#647 |
| 33. | Lake Almanor Country Club | 83.3% | 15.7%(+67.7)#34 | 16.9%(+66.4)#750 |
| 34. | Weldon | 82.5% | 15.7%(+66.8)#35 | 16.9%(+65.5)#770 |
| 35. | Clio | 82.0% | 15.7%(+66.3)#36 | 16.9%(+65.1)#777 |
| 36. | Hornbrook | 81.8% | 15.7%(+66.1)#37 | 16.9%(+64.9)#780 |
| 37. | Tonyville | 81.8% | 15.7%(+66.1)#38 | 16.9%(+64.8)#792 |
| 38. | Aguanga | 80.8% | 15.7%(+65.1)#39 | 16.9%(+63.9)#814 |
| 39. | Benton | 80.4% | 15.7%(+64.7)#40 | 16.9%(+63.4)#835 |
| 40. | Lemon Cove | 79.7% | 15.7%(+64.0)#41 | 16.9%(+62.7)#855 |
| 41. | Bodfish | 77.2% | 15.7%(+61.6)#42 | 16.9%(+60.3)#932 |
| 42. | Mad River | 77.1% | 15.7%(+61.5)#43 | 16.9%(+60.2)#937 |
| 43. | La Vina | 77.0% | 15.7%(+61.4)#44 | 16.9%(+60.1)#942 |
| 44. | Berry Creek | 76.7% | 15.7%(+61.0)#45 | 16.9%(+59.8)#952 |
| 45. | Patton Village | 76.2% | 15.7%(+60.5)#46 | 16.9%(+59.3)#972 |
| 46. | Frazier Park | 75.0% | 15.7%(+59.3)#47 | 16.9%(+58.1)#1,011 |
| 47. | Rackerby | 74.0% | 15.7%(+58.3)#48 | 16.9%(+57.1)#1,058 |
| 48. | Avery | 70.9% | 15.7%(+55.2)#49 | 16.9%(+54.0)#1,199 |
| 49. | Crowley Lake | 70.5% | 15.7%(+54.8)#50 | 16.9%(+53.5)#1,225 |
| 50. | Clearlake Oaks | 69.8% | 15.7%(+54.2)#51 | 16.9%(+52.9)#1,254 |
| 51. | Miranda | 66.8% | 15.7%(+51.1)#52 | 16.9%(+49.9)#1,389 |
| 52. | Ripley | 66.7% | 15.7%(+51.0)#53 | 16.9%(+49.7)#1,393 |
| 53. | South Taft | 66.3% | 15.7%(+50.6)#54 | 16.9%(+49.4)#1,428 |
| 54. | Oak Run | 64.4% | 15.7%(+48.7)#55 | 16.9%(+47.4)#1,545 |
| 55. | Zayante | 63.6% | 15.7%(+48.0)#56 | 16.9%(+46.7)#1,581 |
| 56. | Lagunitas Forest Knolls | 63.5% | 15.7%(+47.8)#57 | 16.9%(+46.6)#1,597 |
| 57. | Lower Lake | 62.9% | 15.7%(+47.3)#58 | 16.9%(+46.0)#1,641 |
| 58. | Orange Cove | 61.8% | 15.7%(+46.1)#59 | 16.9%(+44.9)#1,714 |
| 59. | Mojave | 61.5% | 15.7%(+45.8)#60 | 16.9%(+44.5)#1,749 |
| 60. | Alpaugh | 61.1% | 15.7%(+45.5)#61 | 16.9%(+44.2)#1,763 |
| 61. | Westmorland | 60.5% | 15.7%(+44.8)#62 | 16.9%(+43.5)#1,807 |
| 62. | Blue Lake | 60.0% | 15.7%(+44.3)#63 | 16.9%(+43.1)#1,842 |
| 63. | Thornton | 59.8% | 15.7%(+44.1)#64 | 16.9%(+42.9)#1,874 |
| 64. | Oasis | 59.7% | 15.7%(+44.0)#65 | 16.9%(+42.8)#1,891 |
| 65. | Baker | 59.3% | 15.7%(+43.7)#66 | 16.9%(+42.4)#1,916 |
| 66. | Weedpatch | 59.1% | 15.7%(+43.4)#67 | 16.9%(+42.1)#1,938 |
| 67. | Los Molinos | 58.6% | 15.7%(+43.0)#68 | 16.9%(+41.7)#1,963 |
| 68. | Fort Bidwell | 58.6% | 15.7%(+42.9)#69 | 16.9%(+41.7)#1,967 |
| 69. | Huron | 58.4% | 15.7%(+42.7)#70 | 16.9%(+41.4)#1,982 |
| 70. | Firebaugh | 58.4% | 15.7%(+42.7)#71 | 16.9%(+41.4)#1,983 |
| 71. | Ford City | 57.8% | 15.7%(+42.2)#72 | 16.9%(+40.9)#2,032 |
| 72. | Fulton | 57.2% | 15.7%(+41.6)#73 | 16.9%(+40.3)#2,083 |
| 73. | Fairmead | 57.1% | 15.7%(+41.4)#74 | 16.9%(+40.2)#2,103 |
| 74. | Walnut Grove | 57.0% | 15.7%(+41.3)#75 | 16.9%(+40.1)#2,111 |
| 75. | Kettleman City | 56.9% | 15.7%(+41.2)#76 | 16.9%(+39.9)#2,120 |
| 76. | Calwa | 55.4% | 15.7%(+39.8)#77 | 16.9%(+38.5)#2,234 |
| 77. | Cantua Creek | 54.4% | 15.7%(+38.7)#78 | 16.9%(+37.5)#2,333 |
| 78. | Vina | 54.4% | 15.7%(+38.7)#79 | 16.9%(+37.4)#2,338 |
| 79. | Honcut | 53.8% | 15.7%(+38.2)#80 | 16.9%(+36.9)#2,382 |
| 80. | Covelo | 53.0% | 15.7%(+37.4)#81 | 16.9%(+36.1)#2,448 |
| 81. | Talmage | 53.0% | 15.7%(+37.3)#82 | 16.9%(+36.0)#2,457 |
| 82. | Bret Harte | 52.4% | 15.7%(+36.7)#83 | 16.9%(+35.4)#2,516 |
| 83. | Tulelake | 52.3% | 15.7%(+36.6)#84 | 16.9%(+35.4)#2,523 |
| 84. | Warm Springs | 51.9% | 15.7%(+36.2)#85 | 16.9%(+34.9)#2,568 |
| 85. | Poplar Cotton Center | 51.8% | 15.7%(+36.1)#86 | 16.9%(+34.8)#2,583 |
| 86. | Gerber | 51.4% | 15.7%(+35.7)#87 | 16.9%(+34.4)#2,623 |
| 87. | Graton | 51.0% | 15.7%(+35.3)#88 | 16.9%(+34.1)#2,666 |
| 88. | East Bakersfield | 51.0% | 15.7%(+35.3)#89 | 16.9%(+34.0)#2,670 |
| 89. | London | 50.0% | 15.7%(+34.3)#90 | 16.9%(+33.1)#2,746 |
| 90. | Lindsay | 49.8% | 15.7%(+34.2)#91 | 16.9%(+32.9)#2,833 |
| 91. | Plainview | 49.1% | 15.7%(+33.4)#92 | 16.9%(+32.2)#2,893 |
| 92. | Rexland Acres | 48.9% | 15.7%(+33.2)#93 | 16.9%(+31.9)#2,920 |
| 93. | Lakehead | 48.3% | 15.7%(+32.6)#94 | 16.9%(+31.3)#2,988 |
| 94. | Strathmore | 48.1% | 15.7%(+32.4)#95 | 16.9%(+31.2)#3,006 |
| 95. | Lucerne Valley | 47.9% | 15.7%(+32.2)#96 | 16.9%(+31.0)#3,033 |
| 96. | Westwood | 47.4% | 15.7%(+31.8)#97 | 16.9%(+30.5)#3,094 |
| 97. | Trinidad | 47.1% | 15.7%(+31.4)#98 | 16.9%(+30.1)#3,145 |
| 98. | Lake Isabella | 47.0% | 15.7%(+31.3)#99 | 16.9%(+30.0)#3,160 |
| 99. | Parksdale | 46.9% | 15.7%(+31.2)#100 | 16.9%(+29.9)#3,168 |
| 100. | Kennedy | 46.8% | 15.7%(+31.1)#101 | 16.9%(+29.8)#3,185 |
Common Questions
What are the Top 10 Cities with the Highest Poverty Level Among Children Under the Age of 16 in California?
Top 10 Cities with the Highest Poverty Level Among Children Under the Age of 16 in California are:
#1
100.0%
#2
100.0%
#3
100.0%
#4
100.0%
#5
100.0%
#6
100.0%
#7
100.0%
#8
100.0%
#9
100.0%
#10
100.0%
What city has the Highest Poverty Level Among Children Under the Age of 16 in California?
Sea Ranch has the Highest Poverty Level Among Children Under the Age of 16 in California with 100.0%.
What is the Poverty Level Among Children Under the Age of 16 in the State of California?
Poverty Level Among Children Under the Age of 16 in California is 15.7%.
What is the Poverty Level Among Children Under the Age of 16 in the United States?
Poverty Level Among Children Under the Age of 16 in the United States is 16.9%.