Cities with the Most Immigrants from Bangladesh in California
RELATED REPORTS & OPTIONS
Bangladesh
California
Compare Cities
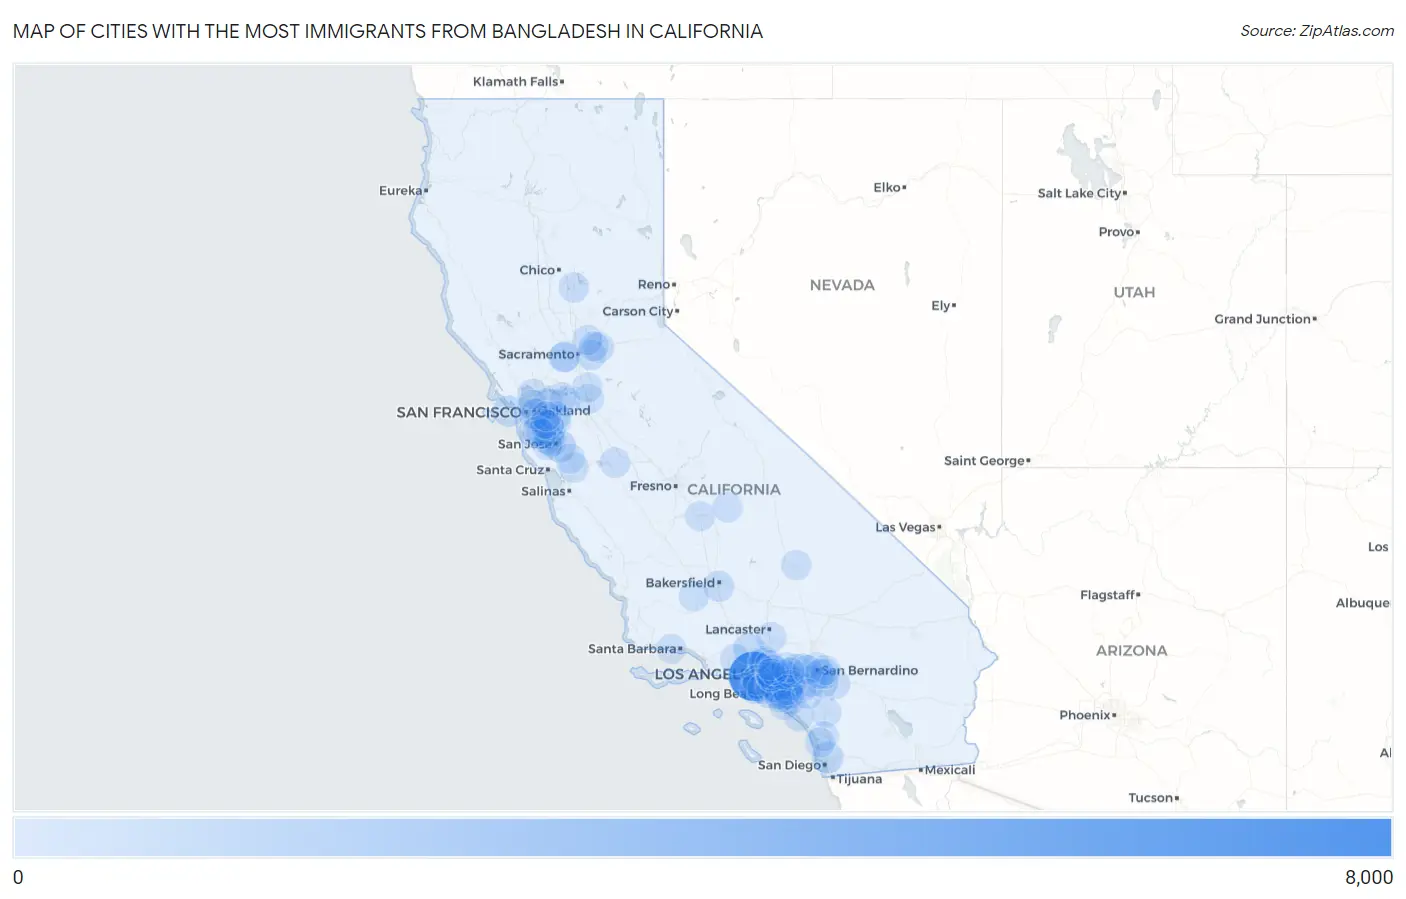
Map of Cities with the Most Immigrants from Bangladesh in California
0
8,000
Cities with the Most Immigrants from Bangladesh in California
| City | Bangladesh | vs State | vs National | |
| 1. | Los Angeles | 6,001 | 18,366(32.67%)#1 | 271,479(2.21%)#2 |
| 2. | Fremont | 859 | 18,366(4.68%)#2 | 271,479(0.32%)#17 |
| 3. | San Jose | 583 | 18,366(3.17%)#3 | 271,479(0.21%)#32 |
| 4. | Anaheim | 514 | 18,366(2.80%)#4 | 271,479(0.19%)#39 |
| 5. | San Diego | 500 | 18,366(2.72%)#5 | 271,479(0.18%)#40 |
| 6. | Santa Clarita | 408 | 18,366(2.22%)#6 | 271,479(0.15%)#55 |
| 7. | San Francisco | 406 | 18,366(2.21%)#7 | 271,479(0.15%)#57 |
| 8. | Sunnyvale | 330 | 18,366(1.80%)#8 | 271,479(0.12%)#76 |
| 9. | Long Beach | 322 | 18,366(1.75%)#9 | 271,479(0.12%)#79 |
| 10. | Riverside | 304 | 18,366(1.66%)#10 | 271,479(0.11%)#87 |
| 11. | Irvine | 261 | 18,366(1.42%)#11 | 271,479(0.10%)#105 |
| 12. | Downey | 237 | 18,366(1.29%)#12 | 271,479(0.09%)#117 |
| 13. | Bakersfield | 236 | 18,366(1.28%)#13 | 271,479(0.09%)#118 |
| 14. | Pleasanton | 216 | 18,366(1.18%)#14 | 271,479(0.08%)#132 |
| 15. | Bellflower | 212 | 18,366(1.15%)#15 | 271,479(0.08%)#138 |
| 16. | Santa Clara | 202 | 18,366(1.10%)#16 | 271,479(0.07%)#147 |
| 17. | Davis | 194 | 18,366(1.06%)#17 | 271,479(0.07%)#153 |
| 18. | Glendale | 192 | 18,366(1.05%)#18 | 271,479(0.07%)#156 |
| 19. | Walnut Creek | 192 | 18,366(1.05%)#19 | 271,479(0.07%)#158 |
| 20. | Folsom | 189 | 18,366(1.03%)#20 | 271,479(0.07%)#159 |
| 21. | Moreno Valley | 186 | 18,366(1.01%)#21 | 271,479(0.07%)#161 |
| 22. | Tustin | 147 | 18,366(0.80%)#22 | 271,479(0.05%)#214 |
| 23. | Cerritos | 133 | 18,366(0.72%)#23 | 271,479(0.05%)#233 |
| 24. | La Crescenta Montrose | 133 | 18,366(0.72%)#24 | 271,479(0.05%)#234 |
| 25. | Inglewood | 118 | 18,366(0.64%)#25 | 271,479(0.04%)#264 |
| 26. | Rancho Cordova | 114 | 18,366(0.62%)#26 | 271,479(0.04%)#272 |
| 27. | Palmdale | 113 | 18,366(0.62%)#27 | 271,479(0.04%)#273 |
| 28. | Diamond Bar | 109 | 18,366(0.59%)#28 | 271,479(0.04%)#289 |
| 29. | Chino Hills | 103 | 18,366(0.56%)#29 | 271,479(0.04%)#304 |
| 30. | Hawthorne | 101 | 18,366(0.55%)#30 | 271,479(0.04%)#308 |
| 31. | Santa Ana | 100 | 18,366(0.54%)#31 | 271,479(0.04%)#313 |
| 32. | Roseville | 99 | 18,366(0.54%)#32 | 271,479(0.04%)#317 |
| 33. | Rancho Cucamonga | 97 | 18,366(0.53%)#33 | 271,479(0.04%)#322 |
| 34. | Corona | 96 | 18,366(0.52%)#34 | 271,479(0.04%)#324 |
| 35. | Garden Grove | 94 | 18,366(0.51%)#35 | 271,479(0.03%)#331 |
| 36. | Alameda | 93 | 18,366(0.51%)#36 | 271,479(0.03%)#333 |
| 37. | Los Banos | 81 | 18,366(0.44%)#37 | 271,479(0.03%)#392 |
| 38. | Oroville | 80 | 18,366(0.44%)#38 | 271,479(0.03%)#395 |
| 39. | Torrance | 79 | 18,366(0.43%)#39 | 271,479(0.03%)#398 |
| 40. | San Leandro | 76 | 18,366(0.41%)#40 | 271,479(0.03%)#412 |
| 41. | Fullerton | 75 | 18,366(0.41%)#41 | 271,479(0.03%)#415 |
| 42. | San Carlos | 74 | 18,366(0.40%)#42 | 271,479(0.03%)#418 |
| 43. | Oakland | 73 | 18,366(0.40%)#43 | 271,479(0.03%)#420 |
| 44. | Norwalk | 73 | 18,366(0.40%)#44 | 271,479(0.03%)#421 |
| 45. | Brentwood | 73 | 18,366(0.40%)#45 | 271,479(0.03%)#423 |
| 46. | Dublin | 72 | 18,366(0.39%)#46 | 271,479(0.03%)#427 |
| 47. | Lakewood | 70 | 18,366(0.38%)#47 | 271,479(0.03%)#438 |
| 48. | Berkeley | 69 | 18,366(0.38%)#48 | 271,479(0.03%)#441 |
| 49. | Union City | 67 | 18,366(0.36%)#49 | 271,479(0.02%)#452 |
| 50. | Monterey Park | 67 | 18,366(0.36%)#50 | 271,479(0.02%)#453 |
| 51. | San Bernardino | 65 | 18,366(0.35%)#51 | 271,479(0.02%)#465 |
| 52. | San Clemente | 63 | 18,366(0.34%)#52 | 271,479(0.02%)#471 |
| 53. | Buena Park | 61 | 18,366(0.33%)#53 | 271,479(0.02%)#483 |
| 54. | Pico Rivera | 60 | 18,366(0.33%)#54 | 271,479(0.02%)#495 |
| 55. | Cupertino | 60 | 18,366(0.33%)#55 | 271,479(0.02%)#496 |
| 56. | Beaumont | 56 | 18,366(0.30%)#56 | 271,479(0.02%)#529 |
| 57. | Hacienda Heights | 54 | 18,366(0.29%)#57 | 271,479(0.02%)#550 |
| 58. | Menlo Park | 54 | 18,366(0.29%)#58 | 271,479(0.02%)#551 |
| 59. | Redwood City | 53 | 18,366(0.29%)#59 | 271,479(0.02%)#556 |
| 60. | Ford City | 53 | 18,366(0.29%)#60 | 271,479(0.02%)#558 |
| 61. | Carson | 52 | 18,366(0.28%)#61 | 271,479(0.02%)#560 |
| 62. | Walnut | 50 | 18,366(0.27%)#62 | 271,479(0.02%)#580 |
| 63. | Temecula | 49 | 18,366(0.27%)#63 | 271,479(0.02%)#585 |
| 64. | Stockton | 46 | 18,366(0.25%)#64 | 271,479(0.02%)#608 |
| 65. | San Marcos | 46 | 18,366(0.25%)#65 | 271,479(0.02%)#611 |
| 66. | West Covina | 45 | 18,366(0.25%)#66 | 271,479(0.02%)#622 |
| 67. | Antioch | 43 | 18,366(0.23%)#67 | 271,479(0.02%)#634 |
| 68. | Encinitas | 43 | 18,366(0.23%)#68 | 271,479(0.02%)#635 |
| 69. | South San Gabriel | 43 | 18,366(0.23%)#69 | 271,479(0.02%)#642 |
| 70. | Gilroy | 42 | 18,366(0.23%)#70 | 271,479(0.02%)#645 |
| 71. | Redlands | 40 | 18,366(0.22%)#71 | 271,479(0.01%)#658 |
| 72. | Yorba Linda | 40 | 18,366(0.22%)#72 | 271,479(0.01%)#660 |
| 73. | Glendora | 40 | 18,366(0.22%)#73 | 271,479(0.01%)#661 |
| 74. | North Tustin | 38 | 18,366(0.21%)#74 | 271,479(0.01%)#684 |
| 75. | Rancho Mission Viejo | 36 | 18,366(0.20%)#75 | 271,479(0.01%)#708 |
| 76. | Upland | 35 | 18,366(0.19%)#76 | 271,479(0.01%)#717 |
| 77. | Montebello | 35 | 18,366(0.19%)#77 | 271,479(0.01%)#719 |
| 78. | Visalia | 34 | 18,366(0.19%)#78 | 271,479(0.01%)#730 |
| 79. | Ridgecrest | 34 | 18,366(0.19%)#79 | 271,479(0.01%)#733 |
| 80. | Hercules | 34 | 18,366(0.19%)#80 | 271,479(0.01%)#734 |
| 81. | Hayward | 33 | 18,366(0.18%)#81 | 271,479(0.01%)#742 |
| 82. | Orange | 33 | 18,366(0.18%)#82 | 271,479(0.01%)#743 |
| 83. | Newport Beach | 33 | 18,366(0.18%)#83 | 271,479(0.01%)#744 |
| 84. | Orangevale | 33 | 18,366(0.18%)#84 | 271,479(0.01%)#748 |
| 85. | Castro Valley | 32 | 18,366(0.17%)#85 | 271,479(0.01%)#759 |
| 86. | Morgan Hill | 32 | 18,366(0.17%)#86 | 271,479(0.01%)#760 |
| 87. | University Of California-Santa Barbara | 32 | 18,366(0.17%)#87 | 271,479(0.01%)#763 |
| 88. | Pasadena | 31 | 18,366(0.17%)#88 | 271,479(0.01%)#766 |
| 89. | Pomona | 30 | 18,366(0.16%)#89 | 271,479(0.01%)#772 |
| 90. | Isla Vista | 30 | 18,366(0.16%)#90 | 271,479(0.01%)#784 |
| 91. | Simi Valley | 29 | 18,366(0.16%)#91 | 271,479(0.01%)#789 |
| 92. | Highland | 29 | 18,366(0.16%)#92 | 271,479(0.01%)#791 |
| 93. | Fontana | 28 | 18,366(0.15%)#93 | 271,479(0.01%)#802 |
| 94. | Fountain Valley | 28 | 18,366(0.15%)#94 | 271,479(0.01%)#803 |
| 95. | Temescal Valley | 28 | 18,366(0.15%)#95 | 271,479(0.01%)#807 |
| 96. | Lodi | 27 | 18,366(0.15%)#96 | 271,479(0.01%)#815 |
| 97. | Temple City | 27 | 18,366(0.15%)#97 | 271,479(0.01%)#816 |
| 98. | Loma Linda | 27 | 18,366(0.15%)#98 | 271,479(0.01%)#817 |
| 99. | University Of California Davis | 27 | 18,366(0.15%)#99 | 271,479(0.01%)#825 |
| 100. | Three Rivers | 27 | 18,366(0.15%)#100 | 271,479(0.01%)#827 |
Common Questions
What are the Top 10 Cities with the Most Immigrants from Bangladesh in California?
Top 10 Cities with the Most Immigrants from Bangladesh in California are:
#1
6,001
#2
859
#3
583
#4
514
#5
500
#6
408
#7
406
#8
330
#9
322
#10
304
What city has the Most Immigrants from Bangladesh in California?
Los Angeles has the Most Immigrants from Bangladesh in California with 6,001.
What is the Total Immigrants from Bangladesh in the State of California?
Total Immigrants from Bangladesh in California is 18,366.
What is the Total Immigrants from Bangladesh in the United States?
Total Immigrants from Bangladesh in the United States is 271,479.