Cities with the Lowest Poverty Level Among Single Females in California
RELATED REPORTS & OPTIONS
Lowest Poverty | Single Female
California
Compare Cities
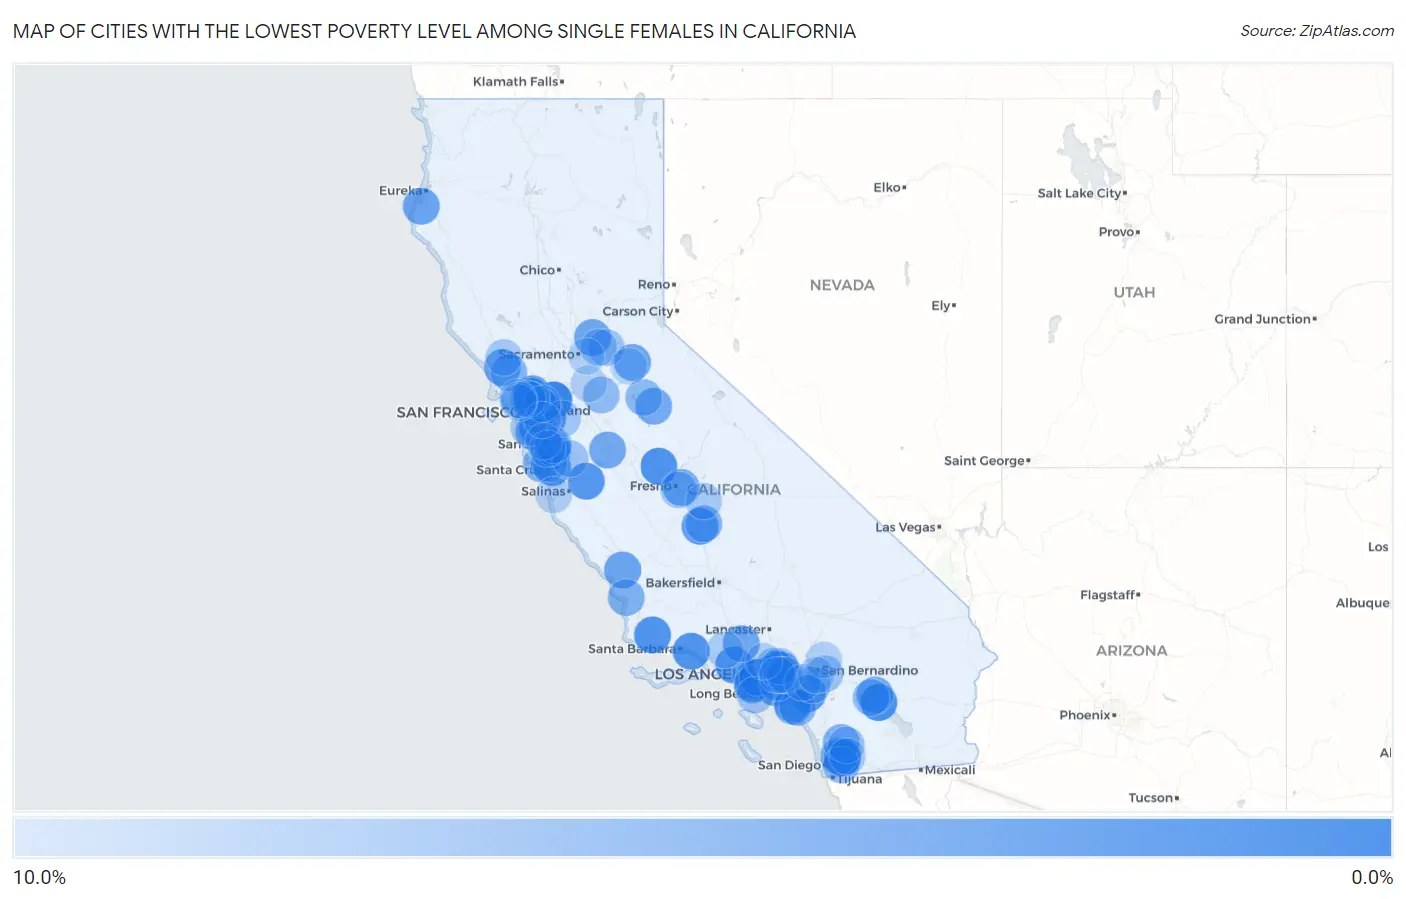
Map of Cities with the Lowest Poverty Level Among Single Females in California
10.0%
0.0%
Cities with the Lowest Poverty Level Among Single Females in California
| City | Single Female Poverty | vs State | vs National | |
| 1. | Clayton | 0.70% | 20.3%(-19.6)#1 | 24.1%(-23.4)#9 |
| 2. | Harbison Canyon | 0.76% | 20.3%(-19.5)#2 | 24.1%(-23.3)#10 |
| 3. | Ladera Heights | 1.7% | 20.3%(-18.6)#3 | 24.1%(-22.4)#57 |
| 4. | Vincent | 1.7% | 20.3%(-18.6)#4 | 24.1%(-22.3)#61 |
| 5. | Vista Santa Rosa | 1.9% | 20.3%(-18.5)#5 | 24.1%(-22.2)#76 |
| 6. | Madera Acres | 1.9% | 20.3%(-18.4)#6 | 24.1%(-22.2)#84 |
| 7. | Carpinteria | 2.0% | 20.3%(-18.3)#7 | 24.1%(-22.0)#94 |
| 8. | Foster City | 2.0% | 20.3%(-18.3)#8 | 24.1%(-22.0)#95 |
| 9. | Buellton | 2.1% | 20.3%(-18.2)#9 | 24.1%(-22.0)#101 |
| 10. | Temescal Valley | 2.4% | 20.3%(-17.9)#10 | 24.1%(-21.7)#139 |
| 11. | Ridgemark | 2.5% | 20.3%(-17.8)#11 | 24.1%(-21.6)#148 |
| 12. | Pinole | 2.7% | 20.3%(-17.6)#12 | 24.1%(-21.4)#179 |
| 13. | Oak Park | 2.8% | 20.3%(-17.5)#13 | 24.1%(-21.3)#193 |
| 14. | Monte Sereno | 2.8% | 20.3%(-17.5)#14 | 24.1%(-21.2)#200 |
| 15. | Rancho Mission Viejo | 2.9% | 20.3%(-17.4)#15 | 24.1%(-21.2)#211 |
| 16. | La Palma | 2.9% | 20.3%(-17.4)#16 | 24.1%(-21.2)#218 |
| 17. | Matheny | 3.1% | 20.3%(-17.2)#17 | 24.1%(-21.0)#247 |
| 18. | Soquel | 3.2% | 20.3%(-17.1)#18 | 24.1%(-20.9)#273 |
| 19. | Bayview Cdp Contra Costa County | 3.3% | 20.3%(-17.0)#19 | 24.1%(-20.8)#290 |
| 20. | Fairview | 3.4% | 20.3%(-16.9)#20 | 24.1%(-20.7)#305 |
| 21. | Ferndale | 3.7% | 20.3%(-16.6)#21 | 24.1%(-20.4)#372 |
| 22. | Templeton | 3.7% | 20.3%(-16.6)#22 | 24.1%(-20.4)#377 |
| 23. | Buckhorn | 3.8% | 20.3%(-16.5)#23 | 24.1%(-20.3)#390 |
| 24. | Culver City | 3.8% | 20.3%(-16.5)#24 | 24.1%(-20.3)#396 |
| 25. | Los Gatos | 3.9% | 20.3%(-16.4)#25 | 24.1%(-20.2)#422 |
| 26. | Castaic | 3.9% | 20.3%(-16.4)#26 | 24.1%(-20.2)#428 |
| 27. | Sebastopol | 4.0% | 20.3%(-16.3)#27 | 24.1%(-20.1)#439 |
| 28. | Rocklin | 4.0% | 20.3%(-16.3)#28 | 24.1%(-20.1)#444 |
| 29. | Manhattan Beach | 4.0% | 20.3%(-16.3)#29 | 24.1%(-20.1)#455 |
| 30. | Gustine | 4.1% | 20.3%(-16.2)#30 | 24.1%(-20.0)#468 |
| 31. | Pine Mountain Lake | 4.2% | 20.3%(-16.1)#31 | 24.1%(-19.8)#490 |
| 32. | La Mirada | 4.3% | 20.3%(-16.0)#32 | 24.1%(-19.8)#499 |
| 33. | Sunnyside | 4.3% | 20.3%(-16.0)#33 | 24.1%(-19.8)#503 |
| 34. | Hercules | 4.3% | 20.3%(-16.0)#34 | 24.1%(-19.8)#505 |
| 35. | Bermuda Dunes | 4.5% | 20.3%(-15.8)#35 | 24.1%(-19.6)#563 |
| 36. | Laguna Woods | 4.7% | 20.3%(-15.6)#36 | 24.1%(-19.4)#609 |
| 37. | Winter Gardens | 4.8% | 20.3%(-15.5)#37 | 24.1%(-19.3)#657 |
| 38. | South San Gabriel | 4.9% | 20.3%(-15.4)#38 | 24.1%(-19.2)#671 |
| 39. | Ramona | 4.9% | 20.3%(-15.4)#39 | 24.1%(-19.2)#675 |
| 40. | Johnson Park | 4.9% | 20.3%(-15.4)#40 | 24.1%(-19.2)#681 |
| 41. | Pismo Beach | 5.0% | 20.3%(-15.3)#41 | 24.1%(-19.1)#690 |
| 42. | East Tulare Villa | 5.0% | 20.3%(-15.3)#42 | 24.1%(-19.1)#703 |
| 43. | El Segundo | 5.0% | 20.3%(-15.3)#43 | 24.1%(-19.0)#718 |
| 44. | Aliso Viejo | 5.1% | 20.3%(-15.2)#44 | 24.1%(-19.0)#729 |
| 45. | Bonny Doon | 5.1% | 20.3%(-15.2)#45 | 24.1%(-19.0)#730 |
| 46. | San Carlos | 5.1% | 20.3%(-15.2)#46 | 24.1%(-19.0)#732 |
| 47. | Cotati | 5.3% | 20.3%(-15.0)#47 | 24.1%(-18.8)#796 |
| 48. | Ladera Ranch | 5.3% | 20.3%(-15.0)#48 | 24.1%(-18.7)#804 |
| 49. | Moraga | 5.4% | 20.3%(-14.9)#49 | 24.1%(-18.7)#811 |
| 50. | Irwindale | 5.6% | 20.3%(-14.7)#50 | 24.1%(-18.4)#888 |
| 51. | Scotts Valley | 5.7% | 20.3%(-14.7)#51 | 24.1%(-18.4)#892 |
| 52. | Indian Wells | 5.7% | 20.3%(-14.6)#52 | 24.1%(-18.4)#904 |
| 53. | East Sonora | 5.7% | 20.3%(-14.6)#53 | 24.1%(-18.4)#908 |
| 54. | Orinda | 5.7% | 20.3%(-14.6)#54 | 24.1%(-18.4)#916 |
| 55. | Emeryville | 5.9% | 20.3%(-14.5)#55 | 24.1%(-18.2)#945 |
| 56. | Linden | 5.9% | 20.3%(-14.4)#56 | 24.1%(-18.2)#984 |
| 57. | Jamul | 6.0% | 20.3%(-14.4)#57 | 24.1%(-18.1)#991 |
| 58. | Tara Hills | 6.1% | 20.3%(-14.2)#58 | 24.1%(-18.0)#1,032 |
| 59. | Campbell | 6.1% | 20.3%(-14.2)#59 | 24.1%(-17.9)#1,051 |
| 60. | View Park Windsor Hills | 6.5% | 20.3%(-13.9)#60 | 24.1%(-17.6)#1,143 |
| 61. | Redlands | 6.5% | 20.3%(-13.8)#61 | 24.1%(-17.6)#1,164 |
| 62. | San Diego Country Estates | 6.5% | 20.3%(-13.8)#62 | 24.1%(-17.5)#1,173 |
| 63. | East Whittier | 6.6% | 20.3%(-13.7)#63 | 24.1%(-17.5)#1,188 |
| 64. | Woodcrest | 6.6% | 20.3%(-13.7)#64 | 24.1%(-17.4)#1,199 |
| 65. | Cameron Park | 6.6% | 20.3%(-13.7)#65 | 24.1%(-17.4)#1,204 |
| 66. | Sierra Madre | 6.7% | 20.3%(-13.6)#66 | 24.1%(-17.4)#1,249 |
| 67. | Mayflower Village | 6.7% | 20.3%(-13.6)#67 | 24.1%(-17.3)#1,255 |
| 68. | Morgan Hill | 6.8% | 20.3%(-13.5)#68 | 24.1%(-17.3)#1,259 |
| 69. | Rancho Palos Verdes | 6.8% | 20.3%(-13.5)#69 | 24.1%(-17.3)#1,267 |
| 70. | Folsom | 6.8% | 20.3%(-13.5)#70 | 24.1%(-17.2)#1,274 |
| 71. | Livermore | 6.9% | 20.3%(-13.4)#71 | 24.1%(-17.2)#1,283 |
| 72. | Valinda | 6.9% | 20.3%(-13.4)#72 | 24.1%(-17.2)#1,288 |
| 73. | San Anselmo | 6.9% | 20.3%(-13.4)#73 | 24.1%(-17.1)#1,312 |
| 74. | Fruitdale | 7.0% | 20.3%(-13.4)#74 | 24.1%(-17.1)#1,315 |
| 75. | Malaga | 7.0% | 20.3%(-13.3)#75 | 24.1%(-17.1)#1,331 |
| 76. | Hillsborough | 7.2% | 20.3%(-13.1)#76 | 24.1%(-16.9)#1,408 |
| 77. | Windsor | 7.2% | 20.3%(-13.1)#77 | 24.1%(-16.9)#1,411 |
| 78. | Duarte | 7.3% | 20.3%(-13.0)#78 | 24.1%(-16.8)#1,440 |
| 79. | Cutler | 7.4% | 20.3%(-13.0)#79 | 24.1%(-16.7)#1,450 |
| 80. | Walnut | 7.4% | 20.3%(-12.9)#80 | 24.1%(-16.6)#1,487 |
| 81. | East Richmond Heights | 7.4% | 20.3%(-12.9)#81 | 24.1%(-16.6)#1,492 |
| 82. | Lafayette | 7.5% | 20.3%(-12.8)#82 | 24.1%(-16.6)#1,499 |
| 83. | Norco | 7.5% | 20.3%(-12.8)#83 | 24.1%(-16.6)#1,511 |
| 84. | Fillmore | 7.6% | 20.3%(-12.7)#84 | 24.1%(-16.5)#1,535 |
| 85. | Los Altos | 7.6% | 20.3%(-12.7)#85 | 24.1%(-16.4)#1,549 |
| 86. | North Richmond | 7.7% | 20.3%(-12.6)#86 | 24.1%(-16.4)#1,557 |
| 87. | Highlands | 7.7% | 20.3%(-12.6)#87 | 24.1%(-16.4)#1,560 |
| 88. | Pacific Grove | 7.8% | 20.3%(-12.6)#88 | 24.1%(-16.3)#1,614 |
| 89. | La Crescenta Montrose | 7.8% | 20.3%(-12.5)#89 | 24.1%(-16.3)#1,642 |
| 90. | Saratoga | 7.8% | 20.3%(-12.5)#90 | 24.1%(-16.2)#1,649 |
| 91. | Alpine | 7.9% | 20.3%(-12.4)#91 | 24.1%(-16.2)#1,656 |
| 92. | Lake Arrowhead | 7.9% | 20.3%(-12.4)#92 | 24.1%(-16.1)#1,683 |
| 93. | San Lorenzo | 7.9% | 20.3%(-12.4)#93 | 24.1%(-16.1)#1,686 |
| 94. | Woodbridge | 8.0% | 20.3%(-12.4)#94 | 24.1%(-16.1)#1,689 |
| 95. | Mill Valley | 8.0% | 20.3%(-12.3)#95 | 24.1%(-16.1)#1,699 |
| 96. | Rosemont | 8.0% | 20.3%(-12.3)#96 | 24.1%(-16.1)#1,701 |
| 97. | Grand Terrace | 8.1% | 20.3%(-12.3)#97 | 24.1%(-16.0)#1,724 |
| 98. | Red Corral | 8.1% | 20.3%(-12.2)#98 | 24.1%(-16.0)#1,742 |
| 99. | Avocado Heights | 8.1% | 20.3%(-12.2)#99 | 24.1%(-15.9)#1,750 |
| 100. | Kentfield | 8.2% | 20.3%(-12.1)#100 | 24.1%(-15.9)#1,760 |
Common Questions
What are the Top 10 Cities with the Lowest Poverty Level Among Single Females in California?
Top 10 Cities with the Lowest Poverty Level Among Single Females in California are:
#1
0.70%
#2
0.76%
#3
1.7%
#4
1.7%
#5
1.9%
#6
1.9%
#7
2.0%
#8
2.0%
#9
2.1%
#10
2.4%
What city has the Lowest Poverty Level Among Single Females in California?
Clayton has the Lowest Poverty Level Among Single Females in California with 0.70%.
What is the Poverty Level Among Single Females in the State of California?
Poverty Level Among Single Females in California is 20.3%.
What is the Poverty Level Among Single Females in the United States?
Poverty Level Among Single Females in the United States is 24.1%.