Cities with the Highest Percentage of Population Employed in Educational Services in California
RELATED REPORTS & OPTIONS
Educational Services
California
Compare Cities
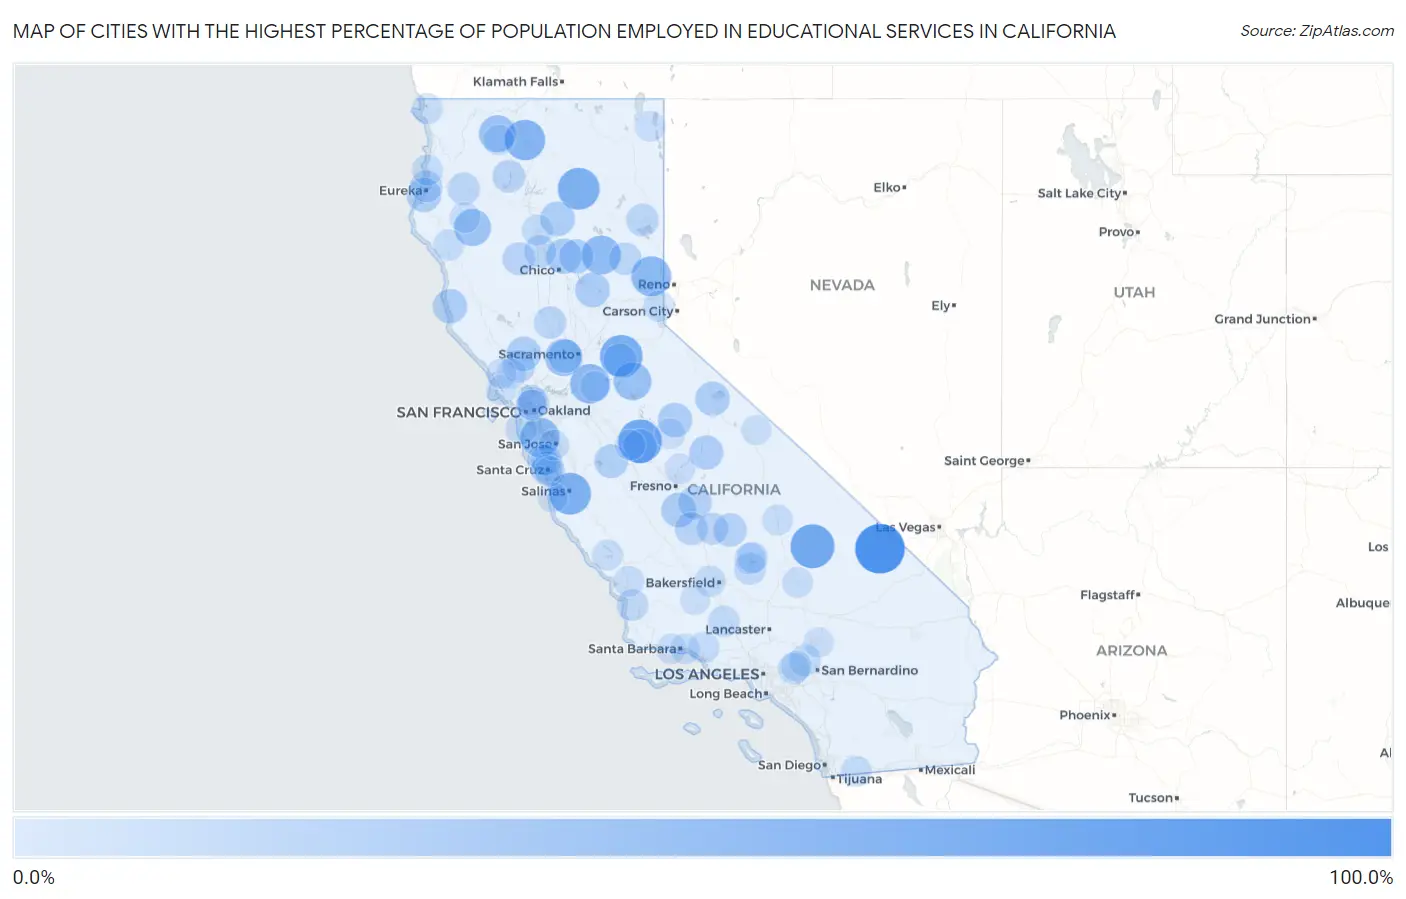
Map of Cities with the Highest Percentage of Population Employed in Educational Services in California
0.0%
100.0%
Cities with the Highest Percentage of Population Employed in Educational Services in California
| City | % Employed | vs State | vs National | |
| 1. | Tecopa | 100.0% | 8.6%(+91.4)#1 | 9.3%(+90.7)#4 |
| 2. | Foresta | 100.0% | 8.6%(+91.4)#2 | 9.3%(+90.7)#10 |
| 3. | Strawberry Cdp Tuolumne County | 100.0% | 8.6%(+91.4)#3 | 9.3%(+90.7)#12 |
| 4. | Homewood Canyon | 75.5% | 8.6%(+66.9)#4 | 9.3%(+66.2)#57 |
| 5. | University Of California Merced | 74.5% | 8.6%(+65.8)#5 | 9.3%(+65.1)#58 |
| 6. | Pepperdine University | 71.9% | 8.6%(+63.3)#6 | 9.3%(+62.6)#64 |
| 7. | River Pines | 69.9% | 8.6%(+61.2)#7 | 9.3%(+60.5)#71 |
| 8. | Spreckels | 66.7% | 8.6%(+58.1)#8 | 9.3%(+57.4)#79 |
| 9. | Hat Creek | 66.7% | 8.6%(+58.1)#9 | 9.3%(+57.4)#81 |
| 10. | Edgewood | 61.1% | 8.6%(+52.5)#10 | 9.3%(+51.8)#107 |
| 11. | Sierra Brooks | 59.1% | 8.6%(+50.5)#11 | 9.3%(+49.8)#124 |
| 12. | University Of California-Santa Barbara | 57.6% | 8.6%(+49.0)#12 | 9.3%(+48.3)#132 |
| 13. | Acampo | 56.6% | 8.6%(+47.9)#13 | 9.3%(+47.2)#142 |
| 14. | Stanford | 55.7% | 8.6%(+47.1)#14 | 9.3%(+46.4)#149 |
| 15. | Meadow Valley | 55.1% | 8.6%(+46.5)#15 | 9.3%(+45.8)#158 |
| 16. | Mountain Ranch | 50.0% | 8.6%(+41.4)#16 | 9.3%(+40.7)#201 |
| 17. | University Of California Davis | 48.1% | 8.6%(+39.5)#17 | 9.3%(+38.8)#237 |
| 18. | Sonoma State University | 46.8% | 8.6%(+38.2)#18 | 9.3%(+37.5)#254 |
| 19. | Greenview | 46.7% | 8.6%(+38.1)#19 | 9.3%(+37.4)#258 |
| 20. | Ruth | 46.4% | 8.6%(+37.8)#20 | 9.3%(+37.1)#262 |
| 21. | Camp Pendleton Mainside | 39.0% | 8.6%(+30.4)#21 | 9.3%(+29.7)#419 |
| 22. | California Polytechnic State University | 38.5% | 8.6%(+29.8)#22 | 9.3%(+29.1)#437 |
| 23. | Cohasset | 38.3% | 8.6%(+29.7)#23 | 9.3%(+29.0)#442 |
| 24. | Hardwick | 37.2% | 8.6%(+28.6)#24 | 9.3%(+27.9)#471 |
| 25. | Challenge Brownsville | 36.6% | 8.6%(+28.0)#25 | 9.3%(+27.3)#499 |
| 26. | Manton | 36.4% | 8.6%(+27.7)#26 | 9.3%(+27.0)#504 |
| 27. | Fields Landing | 35.6% | 8.6%(+27.0)#27 | 9.3%(+26.3)#532 |
| 28. | Lee Vining | 35.5% | 8.6%(+26.9)#28 | 9.3%(+26.2)#537 |
| 29. | Angwin | 35.5% | 8.6%(+26.8)#29 | 9.3%(+26.1)#540 |
| 30. | El Portal | 35.5% | 8.6%(+26.8)#30 | 9.3%(+26.1)#541 |
| 31. | Albion | 35.4% | 8.6%(+26.8)#31 | 9.3%(+26.1)#542 |
| 32. | Big Creek | 34.8% | 8.6%(+26.2)#32 | 9.3%(+25.5)#577 |
| 33. | Bear Creek | 34.7% | 8.6%(+26.1)#33 | 9.3%(+25.4)#582 |
| 34. | Stirling City | 34.5% | 8.6%(+25.9)#34 | 9.3%(+25.2)#598 |
| 35. | Volta | 33.1% | 8.6%(+24.5)#35 | 9.3%(+23.8)#660 |
| 36. | Delft Colony | 32.3% | 8.6%(+23.7)#36 | 9.3%(+23.0)#697 |
| 37. | Davis | 31.7% | 8.6%(+23.1)#37 | 9.3%(+22.4)#719 |
| 38. | Springville | 31.1% | 8.6%(+22.5)#38 | 9.3%(+21.8)#755 |
| 39. | Fiddletown | 30.0% | 8.6%(+21.4)#39 | 9.3%(+20.7)#823 |
| 40. | Waukena | 29.6% | 8.6%(+21.0)#40 | 9.3%(+20.3)#847 |
| 41. | Trinity Center | 29.3% | 8.6%(+20.7)#41 | 9.3%(+20.0)#866 |
| 42. | Paskenta | 28.6% | 8.6%(+20.0)#42 | 9.3%(+19.3)#925 |
| 43. | Litchfield | 28.4% | 8.6%(+19.7)#43 | 9.3%(+19.0)#938 |
| 44. | College City | 27.8% | 8.6%(+19.2)#44 | 9.3%(+18.5)#991 |
| 45. | Cromberg | 27.7% | 8.6%(+19.1)#45 | 9.3%(+18.4)#1,002 |
| 46. | Paradise Park | 27.5% | 8.6%(+18.9)#46 | 9.3%(+18.2)#1,015 |
| 47. | Kenwood | 27.4% | 8.6%(+18.8)#47 | 9.3%(+18.1)#1,018 |
| 48. | Burnt Ranch | 27.3% | 8.6%(+18.7)#48 | 9.3%(+18.0)#1,031 |
| 49. | Mountain Meadows | 27.2% | 8.6%(+18.6)#49 | 9.3%(+17.9)#1,047 |
| 50. | Richfield | 26.9% | 8.6%(+18.3)#50 | 9.3%(+17.6)#1,062 |
| 51. | Manila | 26.2% | 8.6%(+17.6)#51 | 9.3%(+16.9)#1,121 |
| 52. | Plainview | 26.1% | 8.6%(+17.5)#52 | 9.3%(+16.8)#1,136 |
| 53. | Bayview Cdp Contra Costa County | 25.8% | 8.6%(+17.2)#53 | 9.3%(+16.5)#1,160 |
| 54. | Bodfish | 25.6% | 8.6%(+17.0)#54 | 9.3%(+16.3)#1,191 |
| 55. | Blacklake | 24.5% | 8.6%(+15.9)#55 | 9.3%(+15.2)#1,309 |
| 56. | Lytle Creek | 24.0% | 8.6%(+15.4)#56 | 9.3%(+14.7)#1,370 |
| 57. | Claremont | 23.7% | 8.6%(+15.1)#57 | 9.3%(+14.4)#1,413 |
| 58. | Frazier Park | 23.5% | 8.6%(+14.8)#58 | 9.3%(+14.1)#1,453 |
| 59. | Montara | 23.3% | 8.6%(+14.7)#59 | 9.3%(+14.0)#1,479 |
| 60. | Modjeska | 22.7% | 8.6%(+14.1)#60 | 9.3%(+13.4)#1,574 |
| 61. | Wofford Heights | 22.5% | 8.6%(+13.9)#61 | 9.3%(+13.2)#1,600 |
| 62. | Mira Monte | 22.5% | 8.6%(+13.9)#62 | 9.3%(+13.2)#1,605 |
| 63. | Kernville | 22.4% | 8.6%(+13.8)#63 | 9.3%(+13.1)#1,624 |
| 64. | Benbow | 22.4% | 8.6%(+13.8)#64 | 9.3%(+13.1)#1,634 |
| 65. | Rosedale | 22.2% | 8.6%(+13.6)#65 | 9.3%(+12.9)#1,661 |
| 66. | Bend | 22.1% | 8.6%(+13.5)#66 | 9.3%(+12.8)#1,675 |
| 67. | Brookdale | 22.0% | 8.6%(+13.4)#67 | 9.3%(+12.7)#1,683 |
| 68. | Carnelian Bay | 22.0% | 8.6%(+13.4)#68 | 9.3%(+12.7)#1,686 |
| 69. | Potrero | 21.9% | 8.6%(+13.3)#69 | 9.3%(+12.6)#1,706 |
| 70. | Lompico | 21.8% | 8.6%(+13.2)#70 | 9.3%(+12.5)#1,715 |
| 71. | Trinidad | 21.7% | 8.6%(+13.1)#71 | 9.3%(+12.4)#1,739 |
| 72. | Fort Dick | 21.2% | 8.6%(+12.6)#72 | 9.3%(+11.9)#1,825 |
| 73. | Oak Shores | 21.1% | 8.6%(+12.5)#73 | 9.3%(+11.8)#1,852 |
| 74. | Olancha | 20.9% | 8.6%(+12.3)#74 | 9.3%(+11.6)#1,897 |
| 75. | Berkeley | 20.9% | 8.6%(+12.3)#75 | 9.3%(+11.6)#1,907 |
| 76. | Mad River | 20.9% | 8.6%(+12.3)#76 | 9.3%(+11.6)#1,908 |
| 77. | Kensington | 20.8% | 8.6%(+12.2)#77 | 9.3%(+11.5)#1,918 |
| 78. | Johannesburg | 20.6% | 8.6%(+12.0)#78 | 9.3%(+11.3)#1,982 |
| 79. | Santa Cruz | 20.4% | 8.6%(+11.8)#79 | 9.3%(+11.1)#2,019 |
| 80. | San Antonio Heights | 20.4% | 8.6%(+11.8)#80 | 9.3%(+11.1)#2,021 |
| 81. | Santa Margarita | 20.4% | 8.6%(+11.7)#81 | 9.3%(+11.0)#2,037 |
| 82. | Fruitdale | 20.3% | 8.6%(+11.6)#82 | 9.3%(+10.9)#2,059 |
| 83. | Mcswain | 20.2% | 8.6%(+11.6)#83 | 9.3%(+10.9)#2,073 |
| 84. | Etna | 20.1% | 8.6%(+11.5)#84 | 9.3%(+10.8)#2,091 |
| 85. | Lake City | 20.0% | 8.6%(+11.4)#85 | 9.3%(+10.7)#2,128 |
| 86. | East Richmond Heights | 19.9% | 8.6%(+11.3)#86 | 9.3%(+10.6)#2,144 |
| 87. | Bootjack | 19.9% | 8.6%(+11.3)#87 | 9.3%(+10.6)#2,152 |
| 88. | Friant | 19.8% | 8.6%(+11.2)#88 | 9.3%(+10.5)#2,183 |
| 89. | Penngrove | 19.7% | 8.6%(+11.1)#89 | 9.3%(+10.4)#2,214 |
| 90. | Isla Vista | 19.2% | 8.6%(+10.6)#90 | 9.3%(+9.88)#2,340 |
| 91. | Montecito | 18.9% | 8.6%(+10.3)#91 | 9.3%(+9.59)#2,412 |
| 92. | Chalfant | 18.9% | 8.6%(+10.3)#92 | 9.3%(+9.57)#2,420 |
| 93. | Spring Valley Lake | 18.6% | 8.6%(+10.0)#93 | 9.3%(+9.31)#2,514 |
| 94. | Del Monte Forest | 18.5% | 8.6%(+9.90)#94 | 9.3%(+9.20)#2,556 |
| 95. | Albany | 18.5% | 8.6%(+9.88)#95 | 9.3%(+9.18)#2,565 |
| 96. | Inverness | 18.5% | 8.6%(+9.87)#96 | 9.3%(+9.17)#2,566 |
| 97. | Victor | 18.4% | 8.6%(+9.83)#97 | 9.3%(+9.13)#2,579 |
| 98. | Twin Lakes | 18.4% | 8.6%(+9.75)#98 | 9.3%(+9.05)#2,612 |
| 99. | Bloomfield | 18.3% | 8.6%(+9.72)#99 | 9.3%(+9.02)#2,631 |
| 100. | Taft | 18.1% | 8.6%(+9.52)#100 | 9.3%(+8.82)#2,706 |
Common Questions
What are the Top 10 Cities with the Highest Percentage of Population Employed in Educational Services in California?
Top 10 Cities with the Highest Percentage of Population Employed in Educational Services in California are:
#1
100.0%
#2
75.5%
#3
74.5%
#4
69.9%
#5
66.7%
#6
66.7%
#7
61.1%
#8
59.1%
#9
56.6%
#10
55.7%
What city has the Highest Percentage of Population Employed in Educational Services in California?
Tecopa has the Highest Percentage of Population Employed in Educational Services in California with 100.0%.
What is the Percentage of Population Employed in Educational Services in the State of California?
Percentage of Population Employed in Educational Services in California is 8.6%.
What is the Percentage of Population Employed in Educational Services in the United States?
Percentage of Population Employed in Educational Services in the United States is 9.3%.