Cherokee, CA Map & Demographics
Cherokee Map
Cherokee Overview
$25,949
PER CAPITA INCOME
$65,850
AVG HOUSEHOLD INCOME
0.28
INEQUALITY / GINI INDEX
205
TOTAL POPULATION
94
MALE POPULATION
111
FEMALE POPULATION
84.68
MALES / 100 FEMALES
118.09
FEMALES / 100 MALES
51.4
MEDIAN AGE
3.9
AVG FAMILY SIZE
2.6
AVG HOUSEHOLD SIZE
59
LABOR FORCE [ PEOPLE ]
44.0%
PERCENT IN LABOR FORCE
Income in Cherokee
Income Overview in Cherokee
| Characteristic | Number | Measure |
| Per Capita Income | 205 | $25,949 |
| Median Family Income | 44 | $0 |
| Mean Family Income | 44 | $76,109 |
| Median Household Income | 79 | $65,850 |
| Mean Household Income | 79 | $67,720 |
| Income Deficit | 44 | $0 |
| Wage / Income Gap (%) | 205 | 0.00% |
| Wage / Income Gap ($) | 205 | 100.00¢ per $1 |
| Gini / Inequality Index | 205 | 0.28 |
Earnings by Sex in Cherokee
| Sex | Number | Average Earnings |
| Male | 23 (39.0%) | $0 |
| Female | 36 (61.0%) | $0 |
| Total | 59 (100.0%) | $0 |
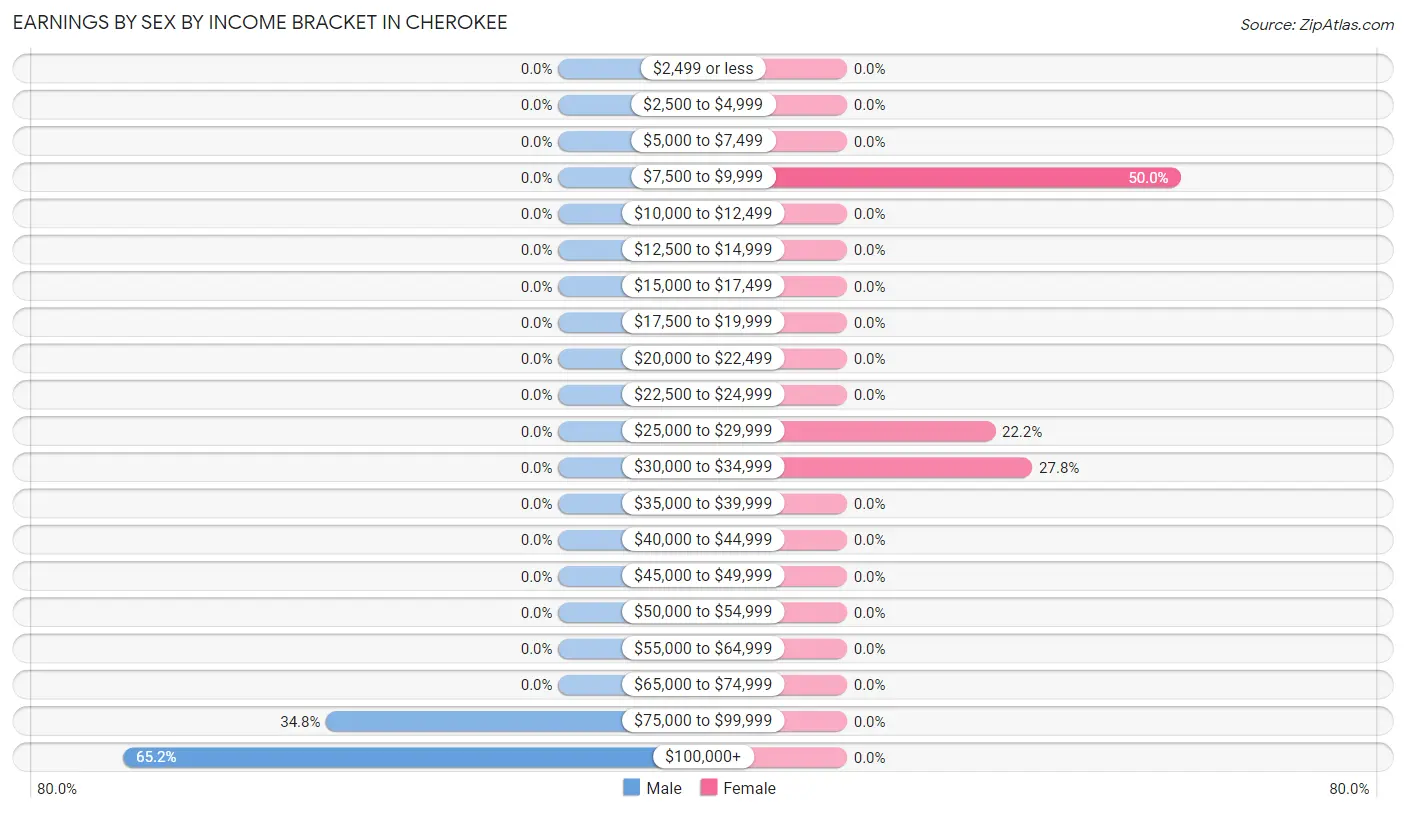
Earnings by Sex by Income Bracket in Cherokee
The most common earnings brackets in Cherokee are $100,000+ for men (15 | 65.2%) and $7,500 to $9,999 for women (18 | 50.0%).
| Income | Male | Female |
| $2,499 or less | 0 (0.0%) | 0 (0.0%) |
| $2,500 to $4,999 | 0 (0.0%) | 0 (0.0%) |
| $5,000 to $7,499 | 0 (0.0%) | 0 (0.0%) |
| $7,500 to $9,999 | 0 (0.0%) | 18 (50.0%) |
| $10,000 to $12,499 | 0 (0.0%) | 0 (0.0%) |
| $12,500 to $14,999 | 0 (0.0%) | 0 (0.0%) |
| $15,000 to $17,499 | 0 (0.0%) | 0 (0.0%) |
| $17,500 to $19,999 | 0 (0.0%) | 0 (0.0%) |
| $20,000 to $22,499 | 0 (0.0%) | 0 (0.0%) |
| $22,500 to $24,999 | 0 (0.0%) | 0 (0.0%) |
| $25,000 to $29,999 | 0 (0.0%) | 8 (22.2%) |
| $30,000 to $34,999 | 0 (0.0%) | 10 (27.8%) |
| $35,000 to $39,999 | 0 (0.0%) | 0 (0.0%) |
| $40,000 to $44,999 | 0 (0.0%) | 0 (0.0%) |
| $45,000 to $49,999 | 0 (0.0%) | 0 (0.0%) |
| $50,000 to $54,999 | 0 (0.0%) | 0 (0.0%) |
| $55,000 to $64,999 | 0 (0.0%) | 0 (0.0%) |
| $65,000 to $74,999 | 0 (0.0%) | 0 (0.0%) |
| $75,000 to $99,999 | 8 (34.8%) | 0 (0.0%) |
| $100,000+ | 15 (65.2%) | 0 (0.0%) |
| Total | 23 (100.0%) | 36 (100.0%) |
Earnings by Sex by Educational Attainment in Cherokee
| Educational Attainment | Male Income | Female Income |
| Less than High School | - | - |
| High School Diploma | - | - |
| College or Associate's Degree | - | - |
| Bachelor's Degree | - | - |
| Graduate Degree | - | - |
| Total | - | - |
Family Income in Cherokee
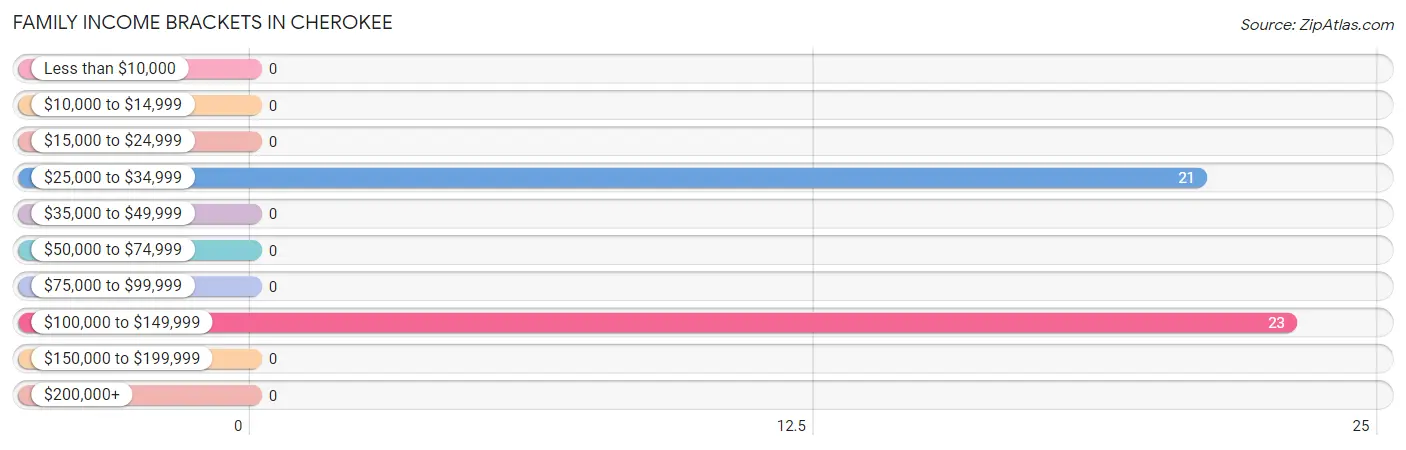
Family Income Brackets in Cherokee
According to the Cherokee family income data, there are 23 families falling into the $100,000 to $149,999 income range, which is the most common income bracket and makes up 52.3% of all families.
| Income Bracket | # Families | % Families |
| Less than $10,000 | 0 | 0.0% |
| $10,000 to $14,999 | 0 | 0.0% |
| $15,000 to $24,999 | 0 | 0.0% |
| $25,000 to $34,999 | 21 | 47.7% |
| $35,000 to $49,999 | 0 | 0.0% |
| $50,000 to $74,999 | 0 | 0.0% |
| $75,000 to $99,999 | 0 | 0.0% |
| $100,000 to $149,999 | 23 | 52.3% |
| $150,000 to $199,999 | 0 | 0.0% |
| $200,000+ | 0 | 0.0% |
Family Income by Famaliy Size in Cherokee
| Income Bracket | # Families | Median Income |
| 2-Person Families | 8 (18.2%) | $0 |
| 3-Person Families | 15 (34.1%) | $0 |
| 4-Person Families | 0 (0.0%) | $0 |
| 5-Person Families | 21 (47.7%) | $0 |
| 6-Person Families | 0 (0.0%) | $0 |
| 7+ Person Families | 0 (0.0%) | $0 |
| Total | 44 (100.0%) | $0 |
Family Income by Number of Earners in Cherokee
| Number of Earners | # Families | Median Income |
| No Earners | 0 (0.0%) | $0 |
| 1 Earner | 36 (81.8%) | $0 |
| 2 Earners | 8 (18.2%) | $0 |
| 3+ Earners | 0 (0.0%) | $0 |
| Total | 44 (100.0%) | $0 |
Household Income in Cherokee
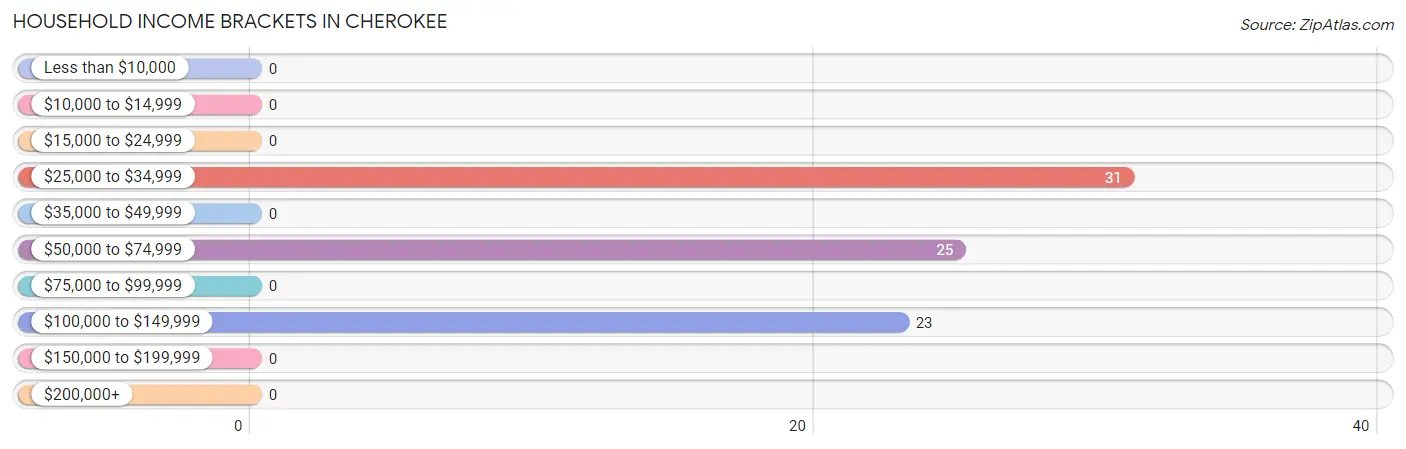
Household Income Brackets in Cherokee
With 31 households falling in the category, the $25,000 to $34,999 income range is the most frequent in Cherokee, accounting for 39.2% of all households.
| Income Bracket | # Households | % Households |
| Less than $10,000 | 0 | 0.0% |
| $10,000 to $14,999 | 0 | 0.0% |
| $15,000 to $24,999 | 0 | 0.0% |
| $25,000 to $34,999 | 31 | 39.2% |
| $35,000 to $49,999 | 0 | 0.0% |
| $50,000 to $74,999 | 25 | 31.6% |
| $75,000 to $99,999 | 0 | 0.0% |
| $100,000 to $149,999 | 23 | 29.1% |
| $150,000 to $199,999 | 0 | 0.0% |
| $200,000+ | 0 | 0.0% |
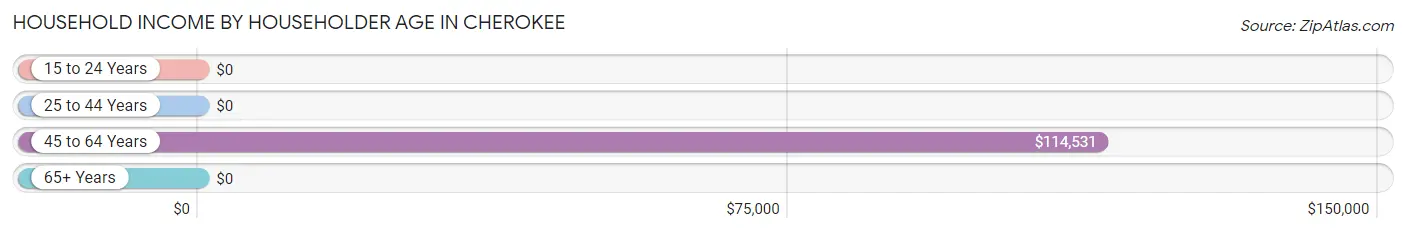
Household Income by Householder Age in Cherokee
The median household income in Cherokee is $65,850, with the highest median household income of $114,531 found in the 45 to 64 years age bracket for the primary householder. A total of 33 households (41.8%) fall into this category.
| Income Bracket | # Households | Median Income |
| 15 to 24 Years | 0 (0.0%) | $0 |
| 25 to 44 Years | 0 (0.0%) | $0 |
| 45 to 64 Years | 33 (41.8%) | $114,531 |
| 65+ Years | 46 (58.2%) | $0 |
| Total | 79 (100.0%) | $65,850 |
Poverty in Cherokee
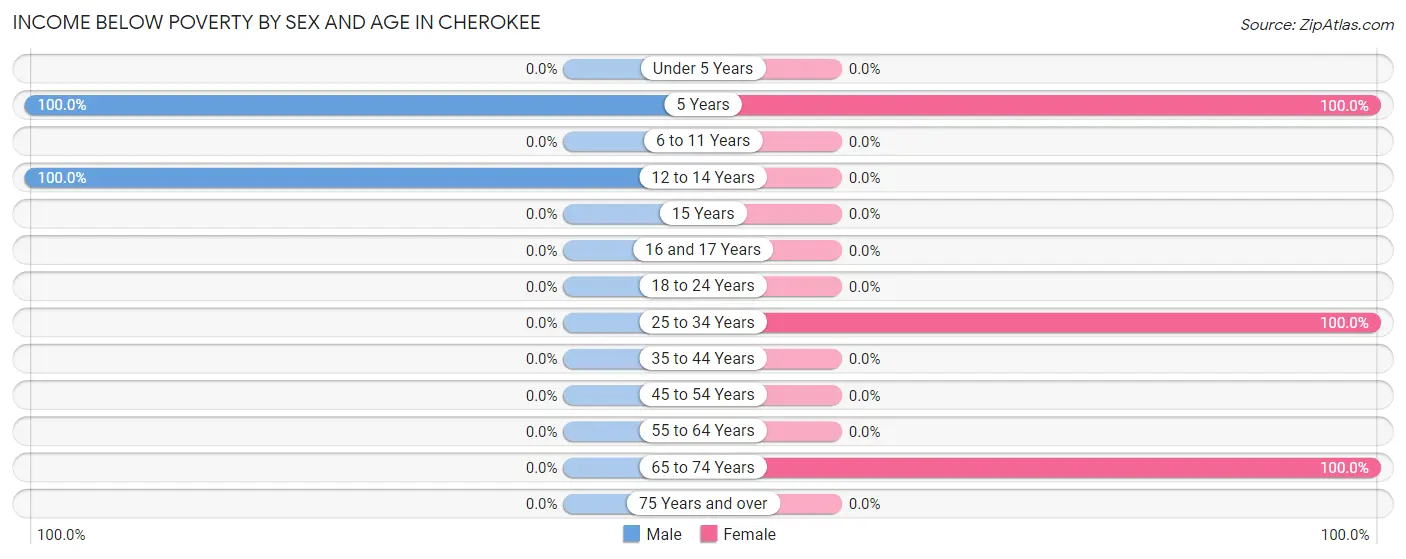
Income Below Poverty by Sex and Age in Cherokee
With 48.9% poverty level for males and 57.7% for females among the residents of Cherokee, 5 year old males and 5 year old females are the most vulnerable to poverty, with 23 males (100.0%) and 25 females (100.0%) in their respective age groups living below the poverty level.
| Age Bracket | Male | Female |
| Under 5 Years | 0 (0.0%) | 0 (0.0%) |
| 5 Years | 23 (100.0%) | 25 (100.0%) |
| 6 to 11 Years | 0 (0.0%) | 0 (0.0%) |
| 12 to 14 Years | 23 (100.0%) | 0 (0.0%) |
| 15 Years | 0 (0.0%) | 0 (0.0%) |
| 16 and 17 Years | 0 (0.0%) | 0 (0.0%) |
| 18 to 24 Years | 0 (0.0%) | 0 (0.0%) |
| 25 to 34 Years | 0 (0.0%) | 18 (100.0%) |
| 35 to 44 Years | 0 (0.0%) | 0 (0.0%) |
| 45 to 54 Years | 0 (0.0%) | 0 (0.0%) |
| 55 to 64 Years | 0 (0.0%) | 0 (0.0%) |
| 65 to 74 Years | 0 (0.0%) | 21 (100.0%) |
| 75 Years and over | 0 (0.0%) | 0 (0.0%) |
| Total | 46 (48.9%) | 64 (57.7%) |
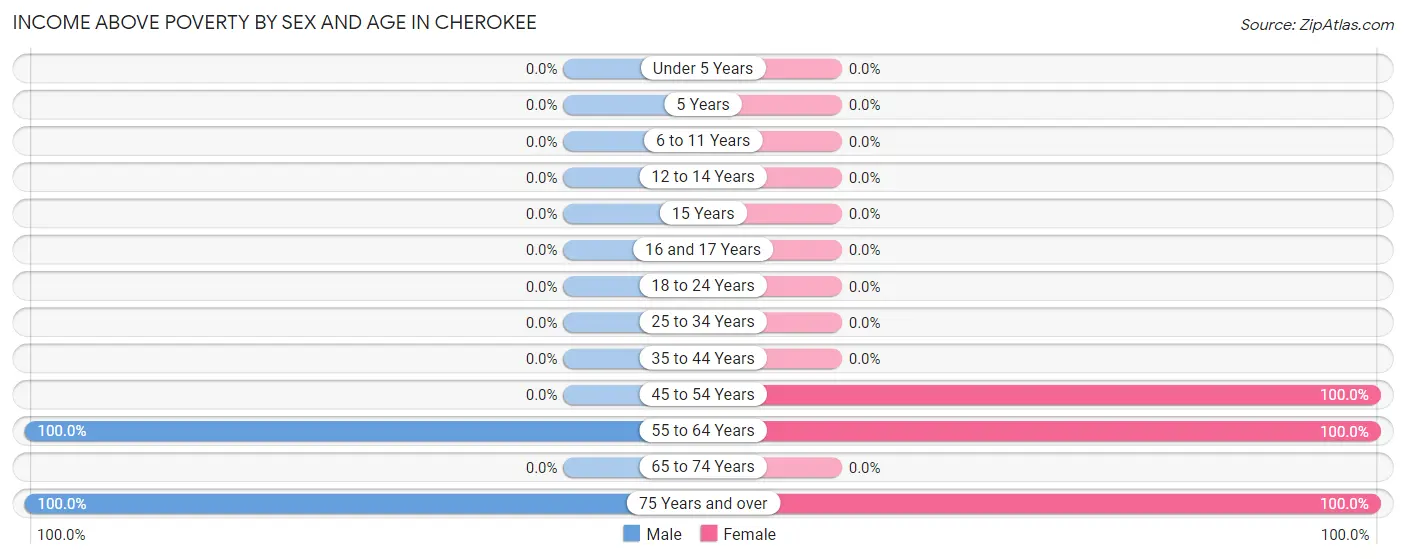
Income Above Poverty by Sex and Age in Cherokee
According to the poverty statistics in Cherokee, males aged 55 to 64 years and females aged 45 to 54 years are the age groups that are most secure financially, with 100.0% of males and 100.0% of females in these age groups living above the poverty line.
| Age Bracket | Male | Female |
| Under 5 Years | 0 (0.0%) | 0 (0.0%) |
| 5 Years | 0 (0.0%) | 0 (0.0%) |
| 6 to 11 Years | 0 (0.0%) | 0 (0.0%) |
| 12 to 14 Years | 0 (0.0%) | 0 (0.0%) |
| 15 Years | 0 (0.0%) | 0 (0.0%) |
| 16 and 17 Years | 0 (0.0%) | 0 (0.0%) |
| 18 to 24 Years | 0 (0.0%) | 0 (0.0%) |
| 25 to 34 Years | 0 (0.0%) | 0 (0.0%) |
| 35 to 44 Years | 0 (0.0%) | 0 (0.0%) |
| 45 to 54 Years | 0 (0.0%) | 18 (100.0%) |
| 55 to 64 Years | 23 (100.0%) | 16 (100.0%) |
| 65 to 74 Years | 0 (0.0%) | 0 (0.0%) |
| 75 Years and over | 25 (100.0%) | 13 (100.0%) |
| Total | 48 (51.1%) | 47 (42.3%) |
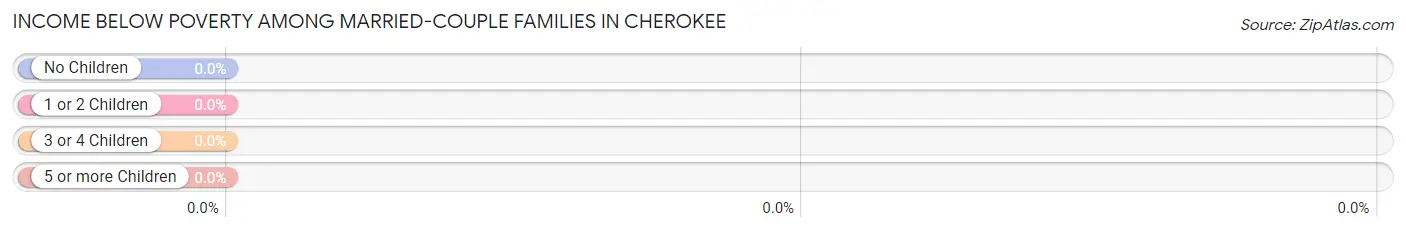
Income Below Poverty Among Married-Couple Families in Cherokee
| Children | Above Poverty | Below Poverty |
| No Children | 8 (100.0%) | 0 (0.0%) |
| 1 or 2 Children | 0 (0.0%) | 0 (0.0%) |
| 3 or 4 Children | 0 (0.0%) | 0 (0.0%) |
| 5 or more Children | 0 (0.0%) | 0 (0.0%) |
| Total | 8 (100.0%) | 0 (0.0%) |
Income Below Poverty Among Single-Parent Households in Cherokee
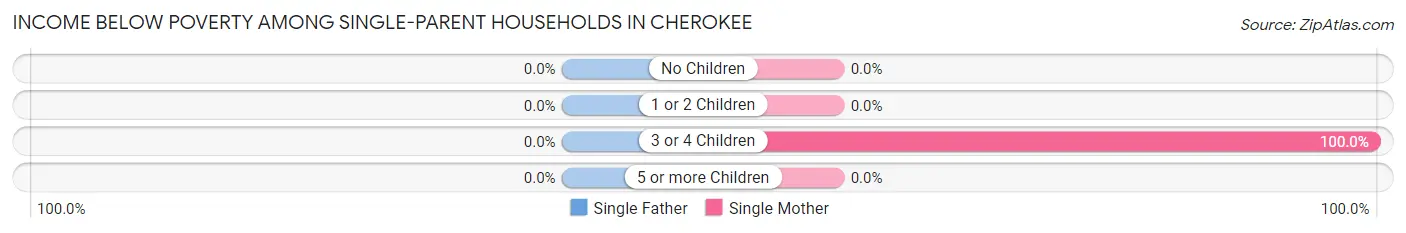
| Children | Single Father | Single Mother |
| No Children | 0 (0.0%) | 0 (0.0%) |
| 1 or 2 Children | 0 (0.0%) | 0 (0.0%) |
| 3 or 4 Children | 0 (0.0%) | 21 (100.0%) |
| 5 or more Children | 0 (0.0%) | 0 (0.0%) |
| Total | 0 (0.0%) | 21 (100.0%) |
Income Below Poverty Among Married-Couple vs Single-Parent Households in Cherokee
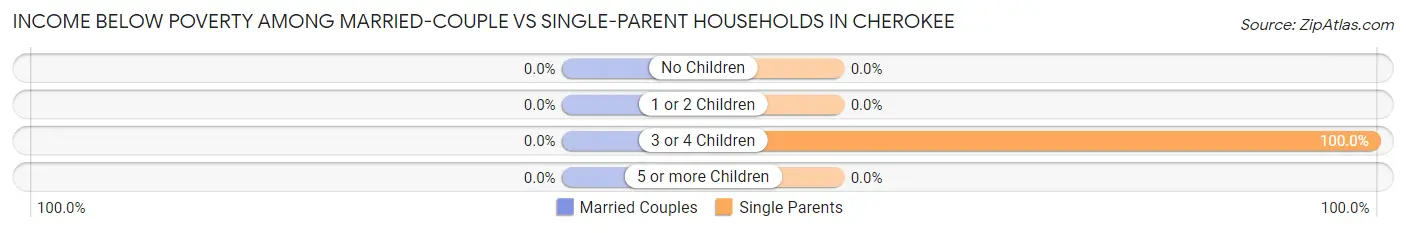
| Children | Married-Couple Families | Single-Parent Households |
| No Children | 0 (0.0%) | 0 (0.0%) |
| 1 or 2 Children | 0 (0.0%) | 0 (0.0%) |
| 3 or 4 Children | 0 (0.0%) | 21 (100.0%) |
| 5 or more Children | 0 (0.0%) | 0 (0.0%) |
| Total | 0 (0.0%) | 21 (58.3%) |
Race in Cherokee
The most populous races in Cherokee are , and White / Caucasian (205 | 100.0%).
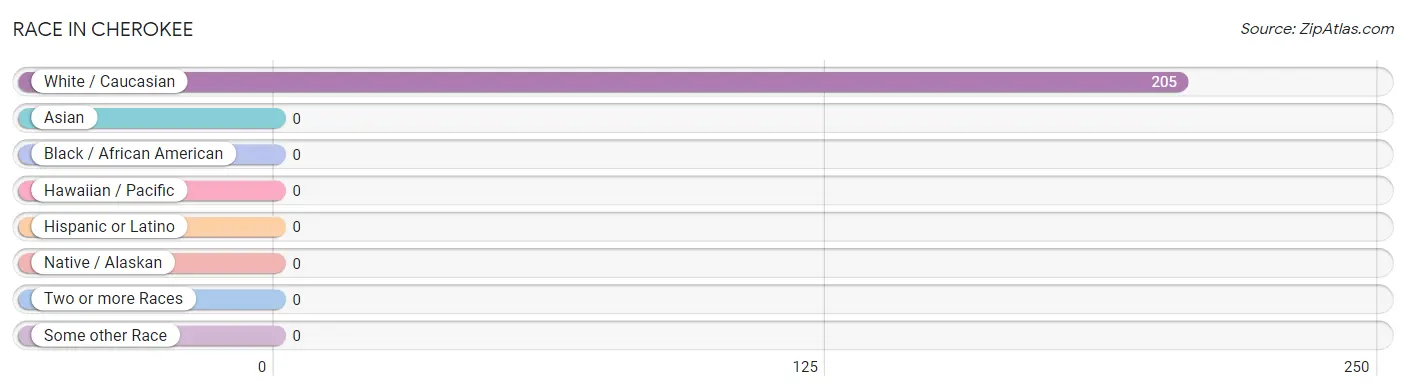
| Race | # Population | % Population |
| Asian | 0 | 0.0% |
| Black / African American | 0 | 0.0% |
| Hawaiian / Pacific | 0 | 0.0% |
| Hispanic or Latino | 0 | 0.0% |
| Native / Alaskan | 0 | 0.0% |
| White / Caucasian | 205 | 100.0% |
| Two or more Races | 0 | 0.0% |
| Some other Race | 0 | 0.0% |
| Total | 205 | 100.0% |
Ancestry in Cherokee
The most populous ancestries reported in Cherokee are English (110 | 53.7%), American (40 | 19.5%), French Canadian (8 | 3.9%), Italian (8 | 3.9%), and Scottish (8 | 3.9%), together accounting for 84.9% of all Cherokee residents.
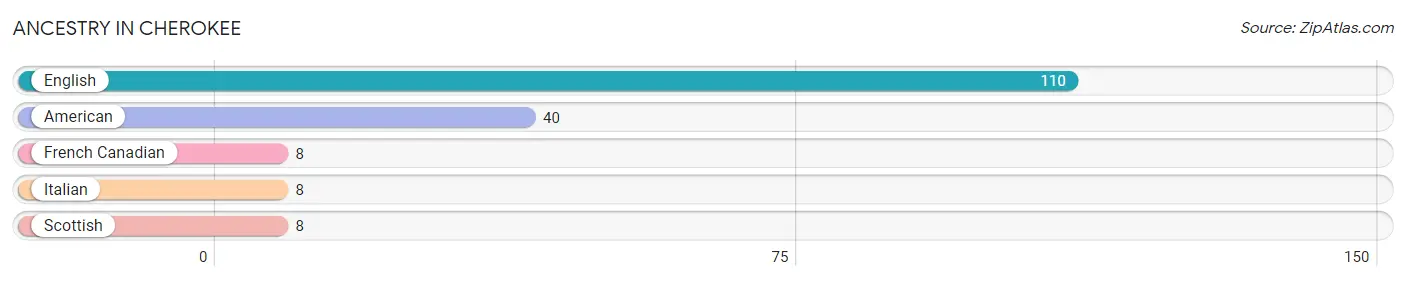
| Ancestry | # Population | % Population |
| American | 40 | 19.5% |
| English | 110 | 53.7% |
| French Canadian | 8 | 3.9% |
| Italian | 8 | 3.9% |
| Scottish | 8 | 3.9% | View All 5 Rows |
Immigrants in Cherokee

| Immigration Origin | # Population | % Population | View All 0 Rows |
Sex and Age in Cherokee
Sex and Age in Cherokee
The most populous age groups in Cherokee are 75 to 79 Years (25 | 26.6%) for men and 5 to 9 Years (25 | 22.5%) for women.
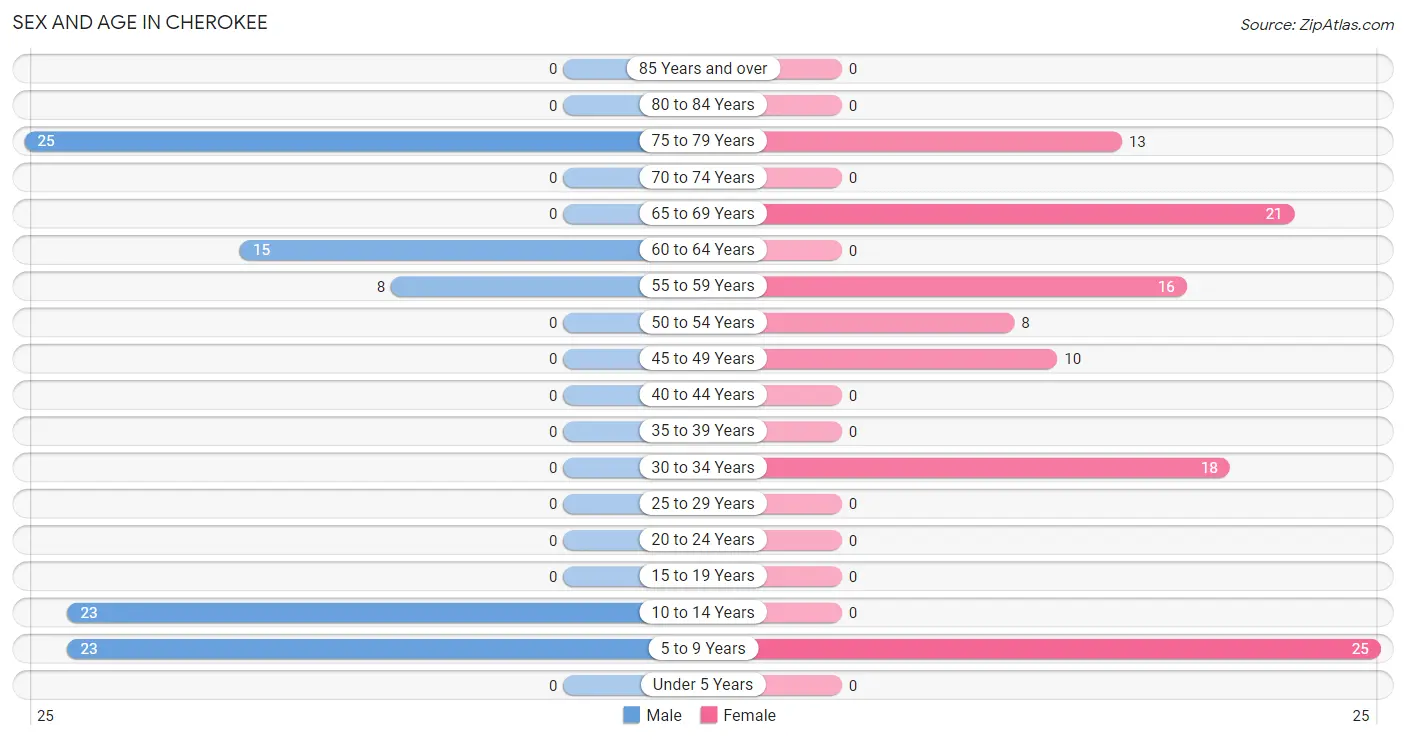
| Age Bracket | Male | Female |
| Under 5 Years | 0 (0.0%) | 0 (0.0%) |
| 5 to 9 Years | 23 (24.5%) | 25 (22.5%) |
| 10 to 14 Years | 23 (24.5%) | 0 (0.0%) |
| 15 to 19 Years | 0 (0.0%) | 0 (0.0%) |
| 20 to 24 Years | 0 (0.0%) | 0 (0.0%) |
| 25 to 29 Years | 0 (0.0%) | 0 (0.0%) |
| 30 to 34 Years | 0 (0.0%) | 18 (16.2%) |
| 35 to 39 Years | 0 (0.0%) | 0 (0.0%) |
| 40 to 44 Years | 0 (0.0%) | 0 (0.0%) |
| 45 to 49 Years | 0 (0.0%) | 10 (9.0%) |
| 50 to 54 Years | 0 (0.0%) | 8 (7.2%) |
| 55 to 59 Years | 8 (8.5%) | 16 (14.4%) |
| 60 to 64 Years | 15 (16.0%) | 0 (0.0%) |
| 65 to 69 Years | 0 (0.0%) | 21 (18.9%) |
| 70 to 74 Years | 0 (0.0%) | 0 (0.0%) |
| 75 to 79 Years | 25 (26.6%) | 13 (11.7%) |
| 80 to 84 Years | 0 (0.0%) | 0 (0.0%) |
| 85 Years and over | 0 (0.0%) | 0 (0.0%) |
| Total | 94 (100.0%) | 111 (100.0%) |
Families and Households in Cherokee
Median Family Size in Cherokee
The median family size in Cherokee is 3.86 persons per family, with single female/mother families (21 | 47.7%) accounting for the largest median family size of 5.24 persons per family. On the other hand, married-couple families (8 | 18.2%) represent the smallest median family size with 2.00 persons per family.
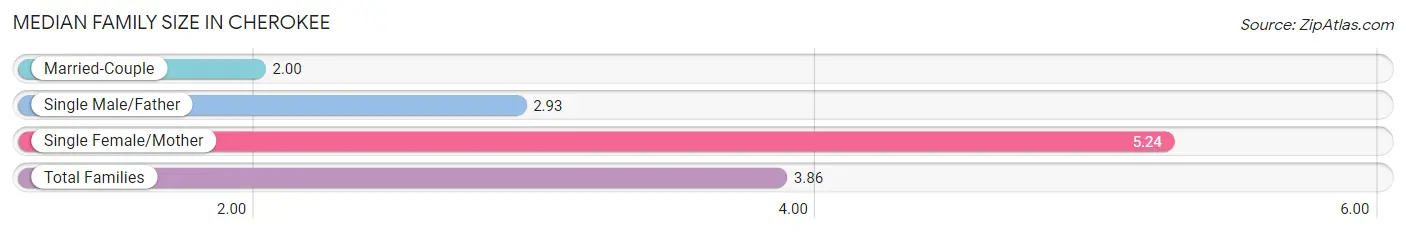
| Family Type | # Families | Family Size |
| Married-Couple | 8 (18.2%) | 2.00 |
| Single Male/Father | 15 (34.1%) | 2.93 |
| Single Female/Mother | 21 (47.7%) | 5.24 |
| Total Families | 44 (100.0%) | 3.86 |
Median Household Size in Cherokee
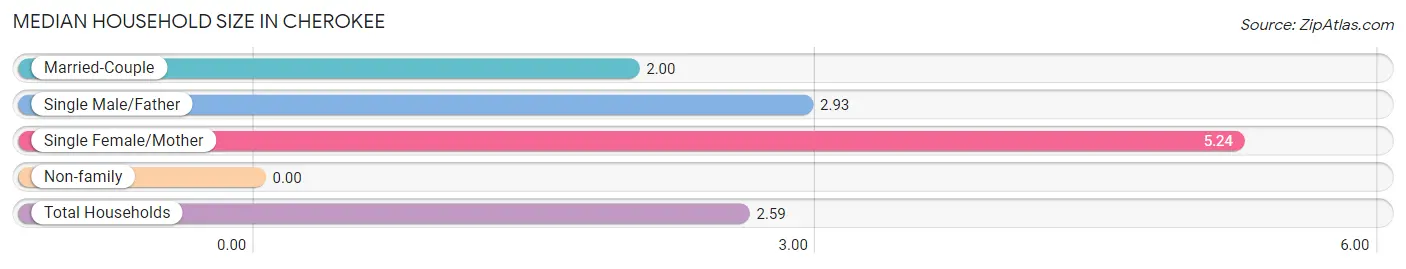
| Household Type | # Households | Household Size |
| Married-Couple | 8 (10.1%) | 2.00 |
| Single Male/Father | 15 (19.0%) | 2.93 |
| Single Female/Mother | 21 (26.6%) | 5.24 |
| Non-family | 35 (44.3%) | - |
| Total Households | 79 (100.0%) | 2.59 |
Household Size by Marriage Status in Cherokee
Out of a total of 79 households in Cherokee, 44 (55.7%) are family households, while 35 (44.3%) are nonfamily households. The most numerous type of family households are 5-person households, comprising 21, and the most common type of nonfamily households are 1-person households, comprising 35.
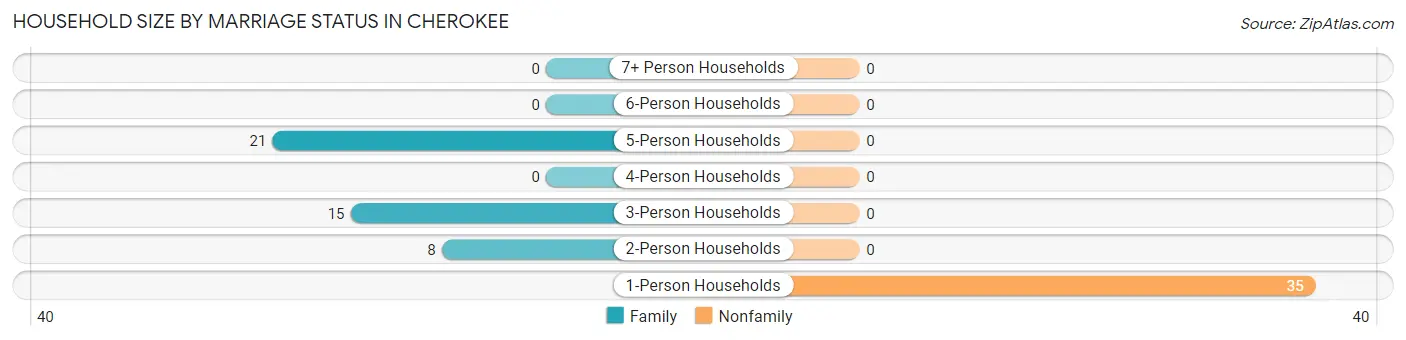
| Household Size | Family Households | Nonfamily Households |
| 1-Person Households | - | 35 (44.3%) |
| 2-Person Households | 8 (10.1%) | 0 (0.0%) |
| 3-Person Households | 15 (19.0%) | 0 (0.0%) |
| 4-Person Households | 0 (0.0%) | 0 (0.0%) |
| 5-Person Households | 21 (26.6%) | 0 (0.0%) |
| 6-Person Households | 0 (0.0%) | 0 (0.0%) |
| 7+ Person Households | 0 (0.0%) | 0 (0.0%) |
| Total | 44 (55.7%) | 35 (44.3%) |
Female Fertility in Cherokee
Fertility by Age in Cherokee
| Age Bracket | Women with Births | Births / 1,000 Women |
| 15 to 19 years | 0 (0.0%) | 0.0 |
| 20 to 34 years | 0 (0.0%) | 0.0 |
| 35 to 50 years | 0 (0.0%) | 0.0 |
| Total | 0 (0.0%) | 0.0 |
Fertility by Age by Marriage Status in Cherokee
| Age Bracket | Married | Unmarried |
| 15 to 19 years | 0 (0.0%) | 0 (0.0%) |
| 20 to 34 years | 0 (0.0%) | 0 (0.0%) |
| 35 to 50 years | 0 (0.0%) | 0 (0.0%) |
| Total | 0 (0.0%) | 0 (0.0%) |
Fertility by Education in Cherokee
| Educational Attainment | Women with Births | Births / 1,000 Women |
| Less than High School | 0 (0.0%) | 0.0 |
| High School Diploma | 0 (0.0%) | 0.0 |
| College or Associate's Degree | 0 (0.0%) | 0.0 |
| Bachelor's Degree | 0 (0.0%) | 0.0 |
| Graduate Degree | 0 (0.0%) | 0.0 |
| Total | 0 (0.0%) | 0.0 |
Fertility by Education by Marriage Status in Cherokee
| Educational Attainment | Married | Unmarried |
| Less than High School | 0 (0.0%) | 0 (0.0%) |
| High School Diploma | 0 (0.0%) | 0 (0.0%) |
| College or Associate's Degree | 0 (0.0%) | 0 (0.0%) |
| Bachelor's Degree | 0 (0.0%) | 0 (0.0%) |
| Graduate Degree | 0 (0.0%) | 0 (0.0%) |
| Total | 0 (0.0%) | 0 (0.0%) |
Employment Characteristics in Cherokee
Employment by Class of Employer in Cherokee
Among the 43 employed individuals in Cherokee, private company employees (33 | 76.7%), and federal government employees (10 | 23.3%) make up the most common classes of employment.
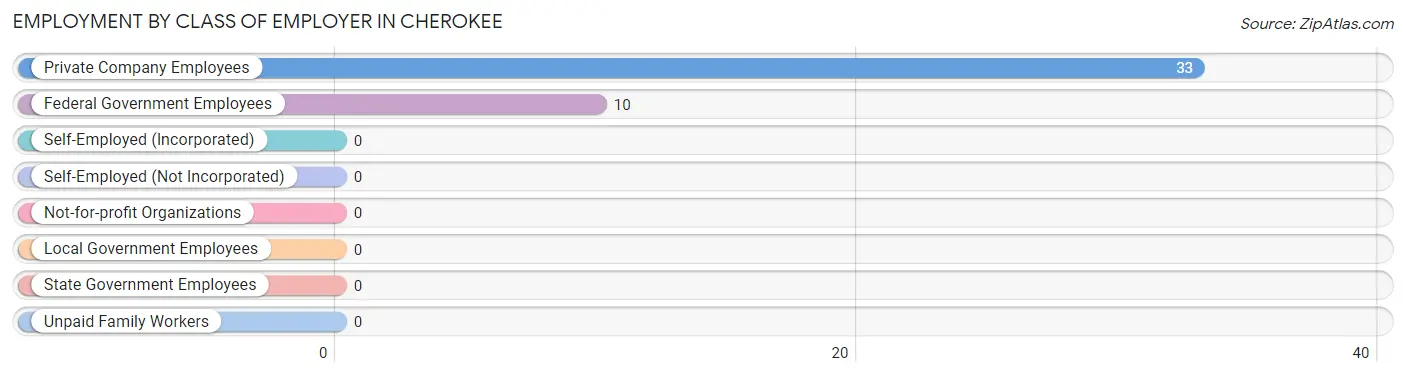
| Employer Class | # Employees | % Employees |
| Private Company Employees | 33 | 76.7% |
| Self-Employed (Incorporated) | 0 | 0.0% |
| Self-Employed (Not Incorporated) | 0 | 0.0% |
| Not-for-profit Organizations | 0 | 0.0% |
| Local Government Employees | 0 | 0.0% |
| State Government Employees | 0 | 0.0% |
| Federal Government Employees | 10 | 23.3% |
| Unpaid Family Workers | 0 | 0.0% |
| Total | 43 | 100.0% |
Employment Status by Age in Cherokee
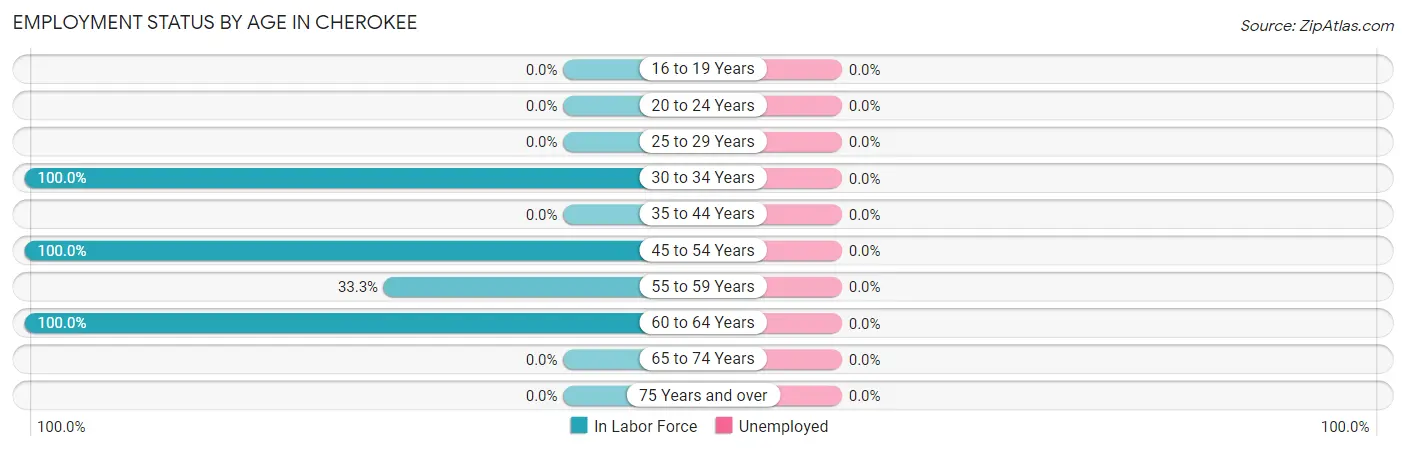
| Age Bracket | In Labor Force | Unemployed |
| 16 to 19 Years | 0 (0.0%) | 0 (0.0%) |
| 20 to 24 Years | 0 (0.0%) | 0 (0.0%) |
| 25 to 29 Years | 0 (0.0%) | 0 (0.0%) |
| 30 to 34 Years | 18 (100.0%) | 0 (0.0%) |
| 35 to 44 Years | 0 (0.0%) | 0 (0.0%) |
| 45 to 54 Years | 18 (100.0%) | 0 (0.0%) |
| 55 to 59 Years | 8 (33.3%) | 0 (0.0%) |
| 60 to 64 Years | 15 (100.0%) | 0 (0.0%) |
| 65 to 74 Years | 0 (0.0%) | 0 (0.0%) |
| 75 Years and over | 0 (0.0%) | 0 (0.0%) |
| Total | 59 (44.0%) | 0 (0.0%) |
Employment Status by Educational Attainment in Cherokee
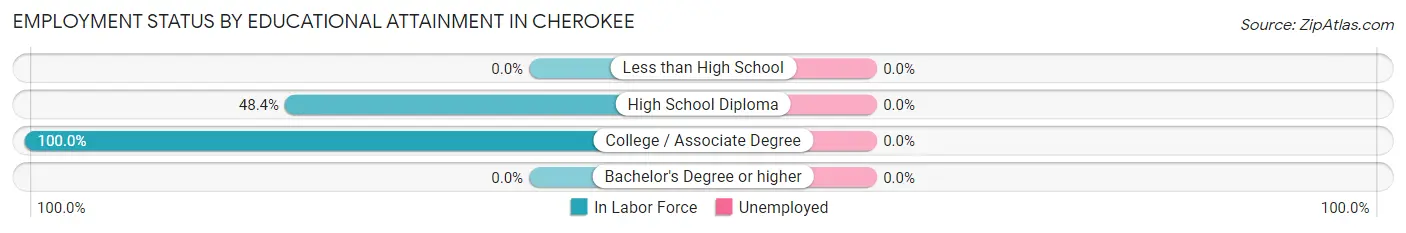
| Educational Attainment | In Labor Force | Unemployed |
| Less than High School | 0 (0.0%) | 0 (0.0%) |
| High School Diploma | 15 (48.4%) | 0 (0.0%) |
| College / Associate Degree | 44 (100.0%) | 0 (0.0%) |
| Bachelor's Degree or higher | 0 (0.0%) | 0 (0.0%) |
| Total | 59 (78.7%) | 0 (0.0%) |
Employment Occupations by Sex in Cherokee
Management, Business, Science and Arts Occupations
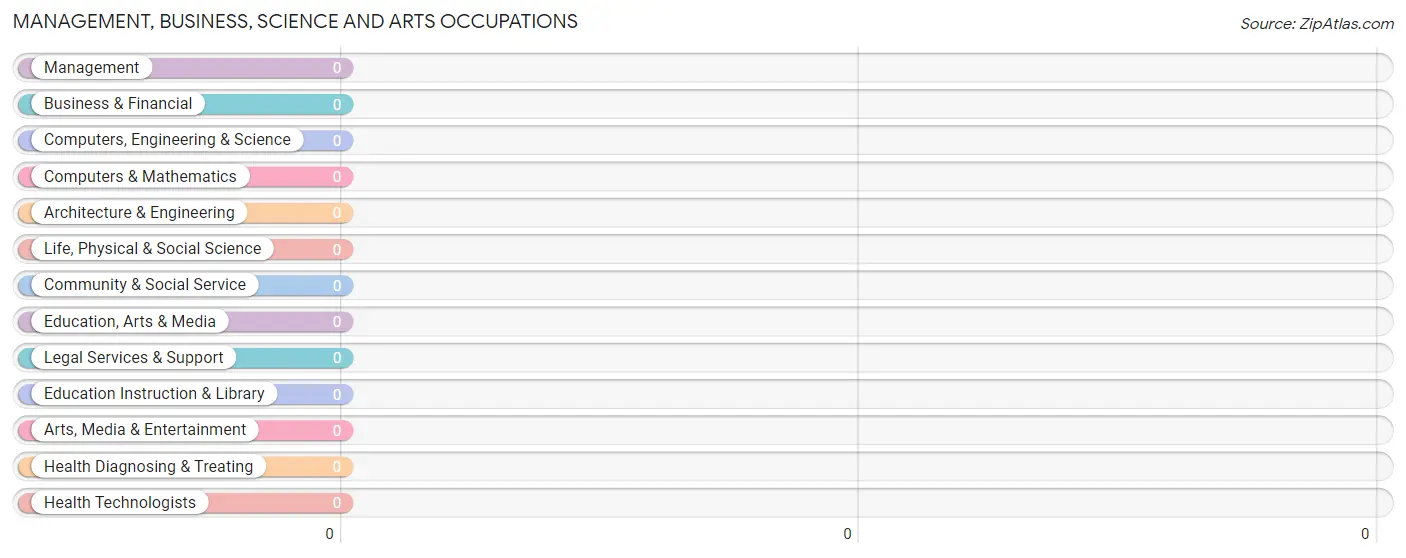
Management, Business, Science and Arts Occupations by Sex
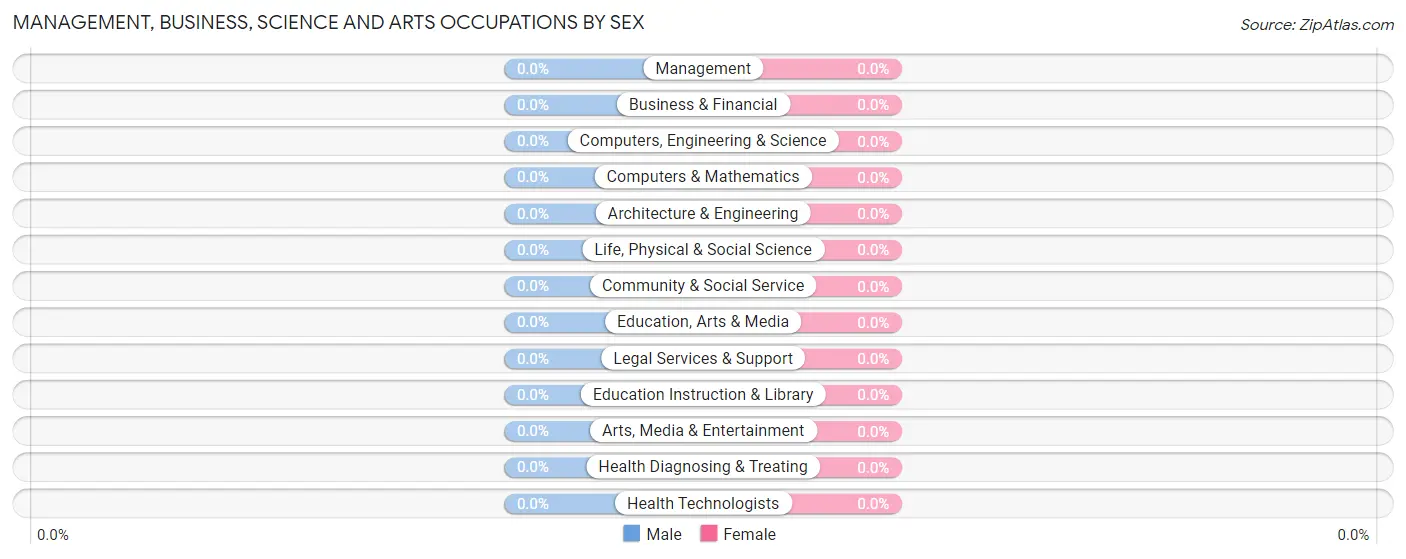
| Occupation | Male | Female |
| Management | 0 (0.0%) | 0 (0.0%) |
| Business & Financial | 0 (0.0%) | 0 (0.0%) |
| Computers, Engineering & Science | 0 (0.0%) | 0 (0.0%) |
| Computers & Mathematics | 0 (0.0%) | 0 (0.0%) |
| Architecture & Engineering | 0 (0.0%) | 0 (0.0%) |
| Life, Physical & Social Science | 0 (0.0%) | 0 (0.0%) |
| Community & Social Service | 0 (0.0%) | 0 (0.0%) |
| Education, Arts & Media | 0 (0.0%) | 0 (0.0%) |
| Legal Services & Support | 0 (0.0%) | 0 (0.0%) |
| Education Instruction & Library | 0 (0.0%) | 0 (0.0%) |
| Arts, Media & Entertainment | 0 (0.0%) | 0 (0.0%) |
| Health Diagnosing & Treating | 0 (0.0%) | 0 (0.0%) |
| Health Technologists | 0 (0.0%) | 0 (0.0%) |
| Total (Category) | 0 (0.0%) | 0 (0.0%) |
| Total (Overall) | 23 (39.0%) | 36 (61.0%) |
Services Occupations
The most common Services occupations in Cherokee are , and Healthcare Support (8 | 13.6%).
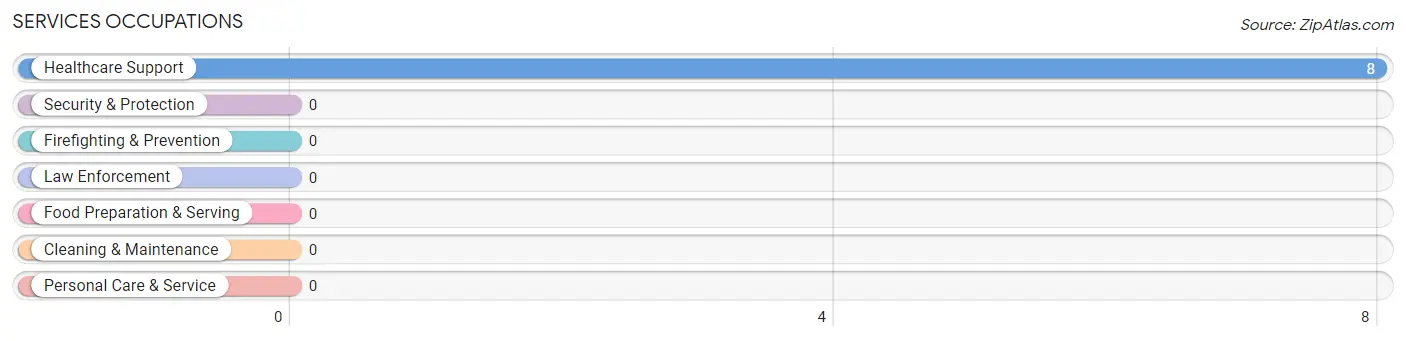
Services Occupations by Sex
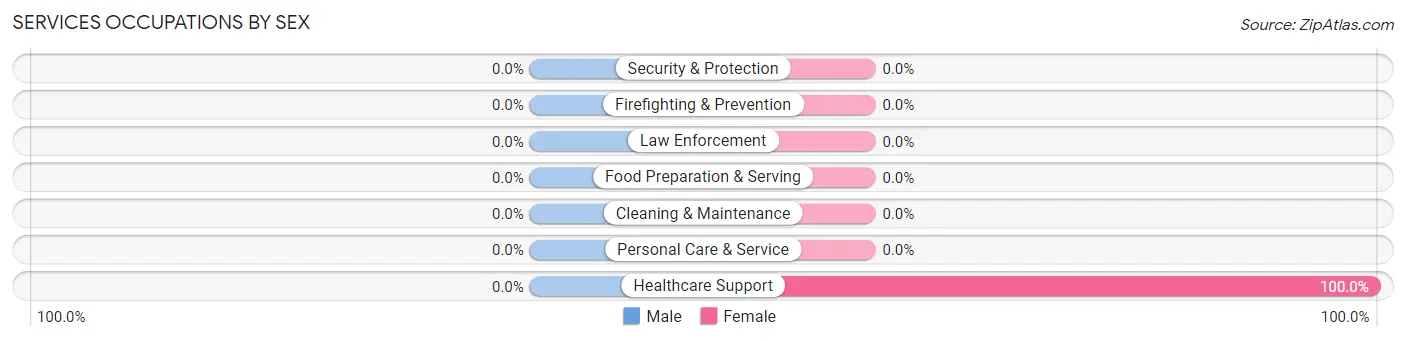
| Occupation | Male | Female |
| Healthcare Support | 0 (0.0%) | 8 (100.0%) |
| Security & Protection | 0 (0.0%) | 0 (0.0%) |
| Firefighting & Prevention | 0 (0.0%) | 0 (0.0%) |
| Law Enforcement | 0 (0.0%) | 0 (0.0%) |
| Food Preparation & Serving | 0 (0.0%) | 0 (0.0%) |
| Cleaning & Maintenance | 0 (0.0%) | 0 (0.0%) |
| Personal Care & Service | 0 (0.0%) | 0 (0.0%) |
| Total (Category) | 0 (0.0%) | 8 (100.0%) |
| Total (Overall) | 23 (39.0%) | 36 (61.0%) |
Sales and Office Occupations
The most common Sales and Office occupations in Cherokee are , and Office & Administration (10 | 17.0%).
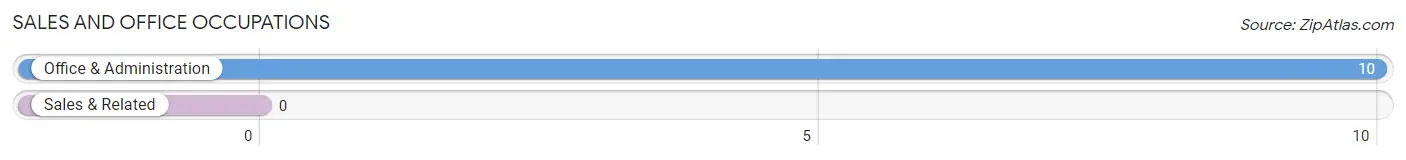
Sales and Office Occupations by Sex
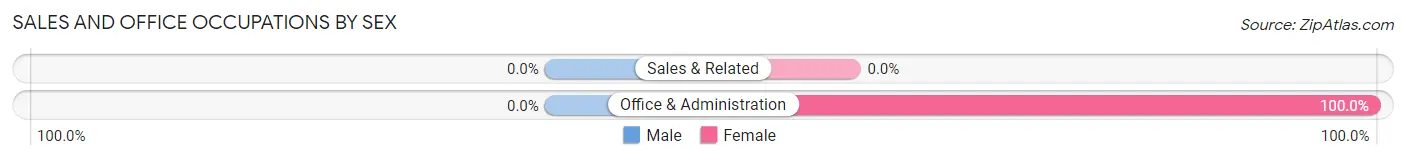
| Occupation | Male | Female |
| Sales & Related | 0 (0.0%) | 0 (0.0%) |
| Office & Administration | 0 (0.0%) | 10 (100.0%) |
| Total (Category) | 0 (0.0%) | 10 (100.0%) |
| Total (Overall) | 23 (39.0%) | 36 (61.0%) |
Natural Resources, Construction and Maintenance Occupations
The most common Natural Resources, Construction and Maintenance occupations in Cherokee are , and Installation, Maintenance & Repair (8 | 13.6%).
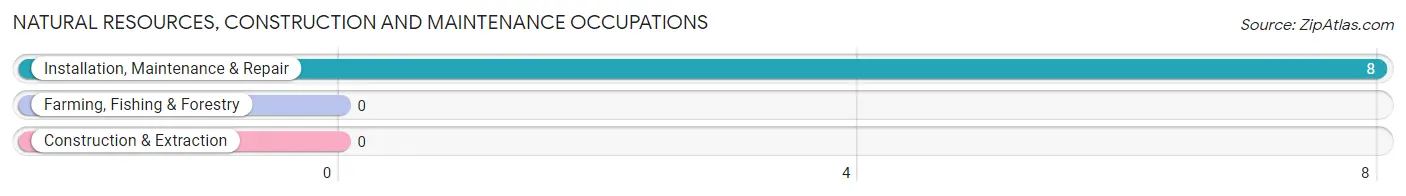
Natural Resources, Construction and Maintenance Occupations by Sex
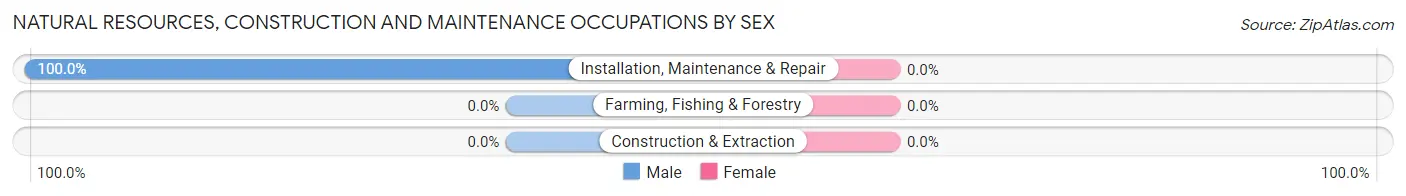
| Occupation | Male | Female |
| Farming, Fishing & Forestry | 0 (0.0%) | 0 (0.0%) |
| Construction & Extraction | 0 (0.0%) | 0 (0.0%) |
| Installation, Maintenance & Repair | 8 (100.0%) | 0 (0.0%) |
| Total (Category) | 8 (100.0%) | 0 (0.0%) |
| Total (Overall) | 23 (39.0%) | 36 (61.0%) |
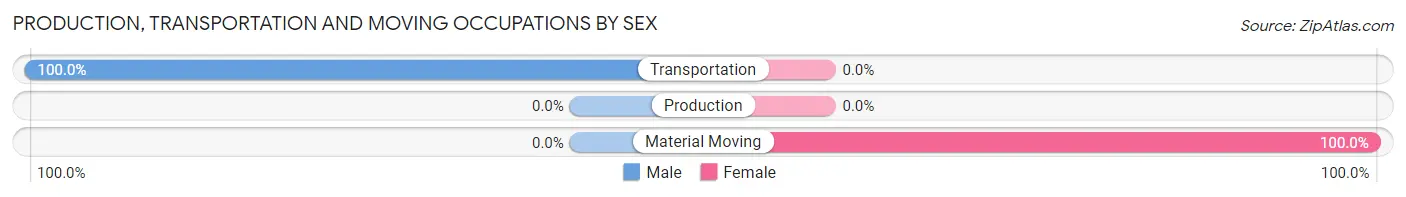
Production, Transportation and Moving Occupations
The most common Production, Transportation and Moving occupations in Cherokee are Material Moving (18 | 30.5%), and Transportation (15 | 25.4%).
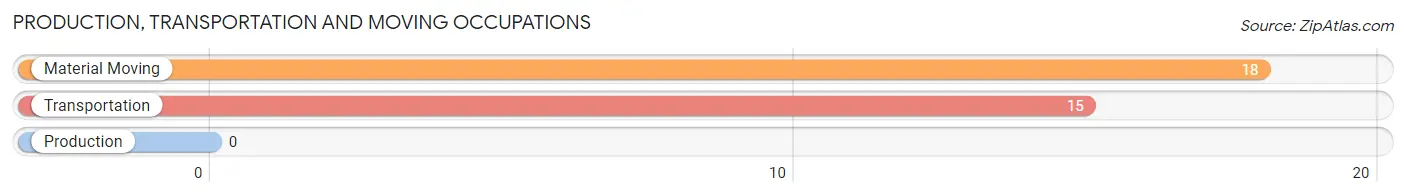
Production, Transportation and Moving Occupations by Sex
| Occupation | Male | Female |
| Production | 0 (0.0%) | 0 (0.0%) |
| Transportation | 15 (100.0%) | 0 (0.0%) |
| Material Moving | 0 (0.0%) | 18 (100.0%) |
| Total (Category) | 15 (45.5%) | 18 (54.5%) |
| Total (Overall) | 23 (39.0%) | 36 (61.0%) |
Employment Industries by Sex in Cherokee
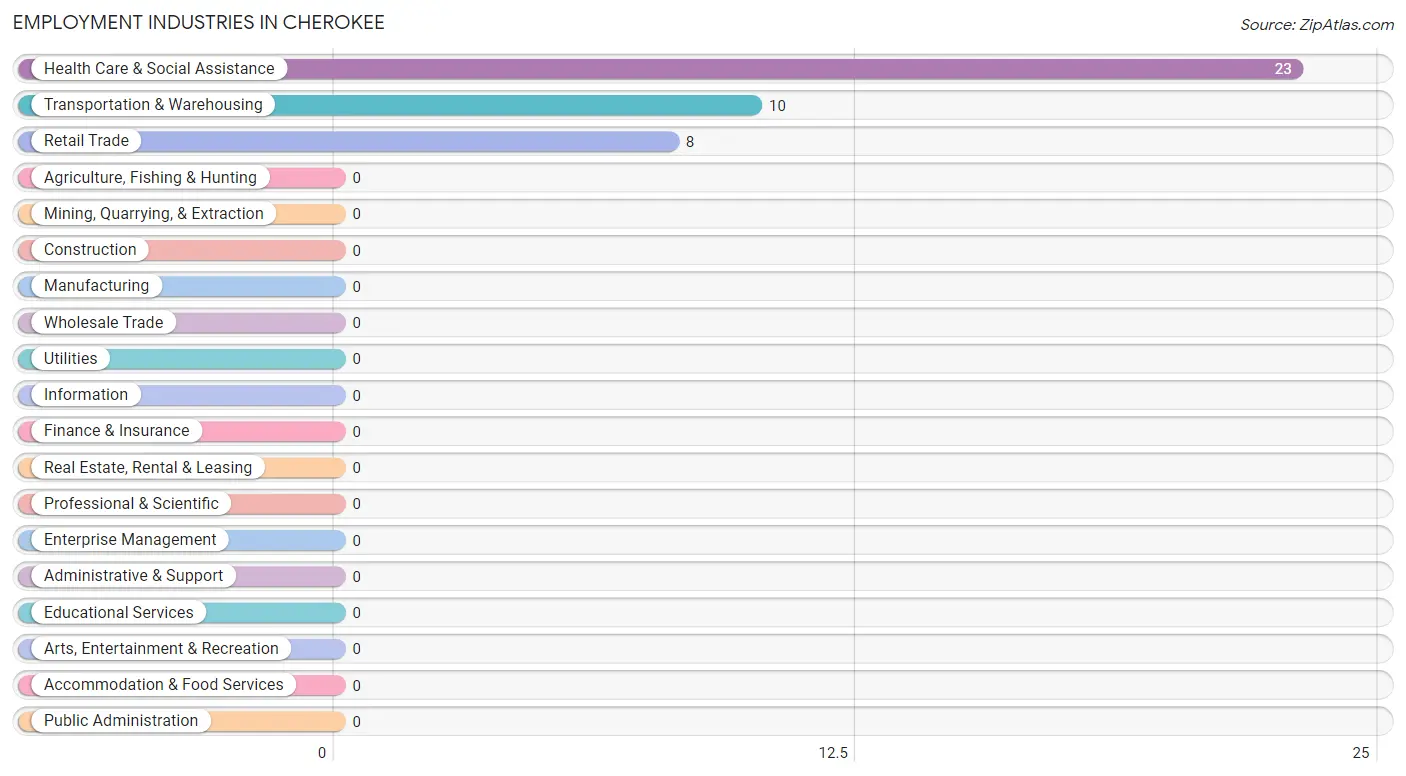
Employment Industries in Cherokee
The major employment industries in Cherokee include Health Care & Social Assistance (23 | 39.0%), Transportation & Warehousing (10 | 17.0%), and Retail Trade (8 | 13.6%).
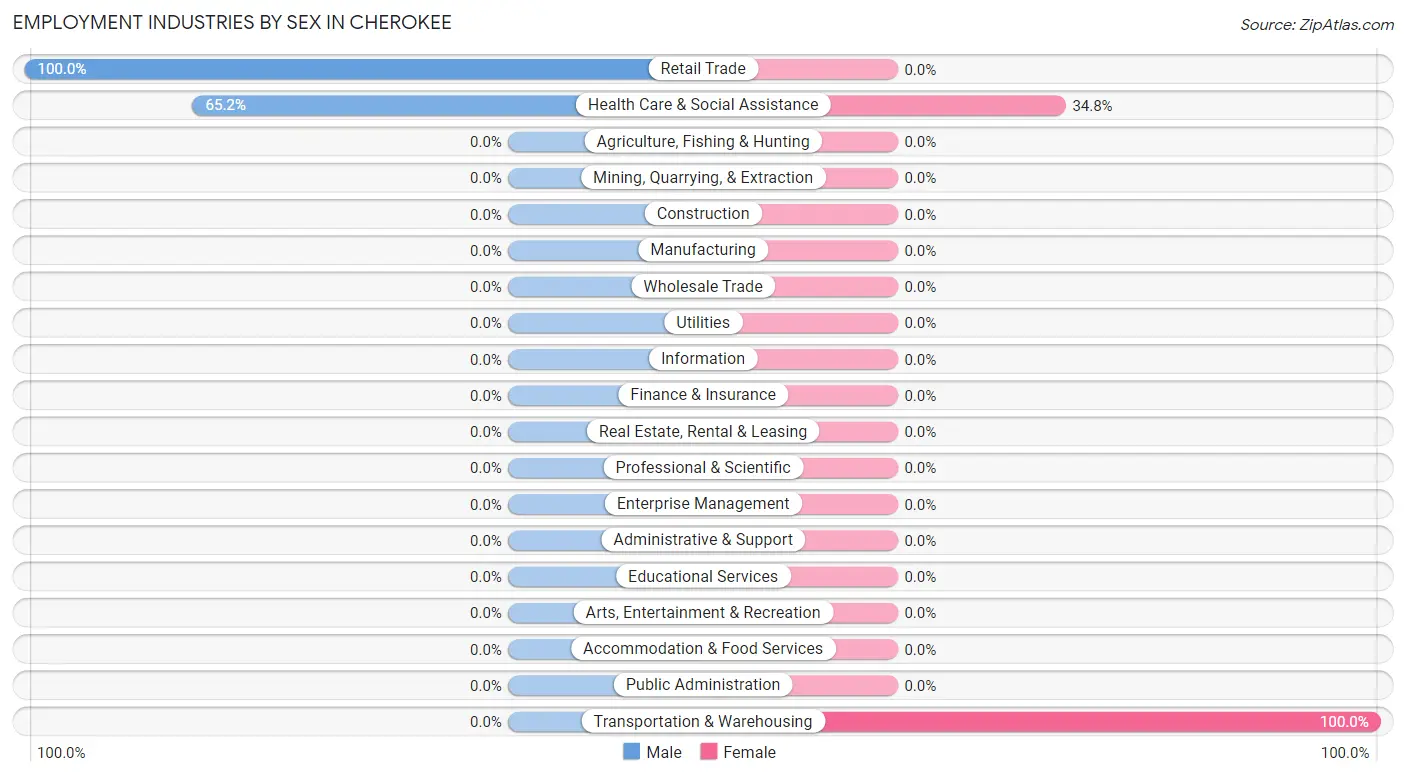
Employment Industries by Sex in Cherokee
The Cherokee industries that see more men than women are Retail Trade (100.0%), and Health Care & Social Assistance (65.2%), whereas the industries that tend to have a higher number of women are Transportation & Warehousing (100.0%), and Health Care & Social Assistance (34.8%).
| Industry | Male | Female |
| Agriculture, Fishing & Hunting | 0 (0.0%) | 0 (0.0%) |
| Mining, Quarrying, & Extraction | 0 (0.0%) | 0 (0.0%) |
| Construction | 0 (0.0%) | 0 (0.0%) |
| Manufacturing | 0 (0.0%) | 0 (0.0%) |
| Wholesale Trade | 0 (0.0%) | 0 (0.0%) |
| Retail Trade | 8 (100.0%) | 0 (0.0%) |
| Transportation & Warehousing | 0 (0.0%) | 10 (100.0%) |
| Utilities | 0 (0.0%) | 0 (0.0%) |
| Information | 0 (0.0%) | 0 (0.0%) |
| Finance & Insurance | 0 (0.0%) | 0 (0.0%) |
| Real Estate, Rental & Leasing | 0 (0.0%) | 0 (0.0%) |
| Professional & Scientific | 0 (0.0%) | 0 (0.0%) |
| Enterprise Management | 0 (0.0%) | 0 (0.0%) |
| Administrative & Support | 0 (0.0%) | 0 (0.0%) |
| Educational Services | 0 (0.0%) | 0 (0.0%) |
| Health Care & Social Assistance | 15 (65.2%) | 8 (34.8%) |
| Arts, Entertainment & Recreation | 0 (0.0%) | 0 (0.0%) |
| Accommodation & Food Services | 0 (0.0%) | 0 (0.0%) |
| Public Administration | 0 (0.0%) | 0 (0.0%) |
| Total | 23 (39.0%) | 36 (61.0%) |
Education in Cherokee
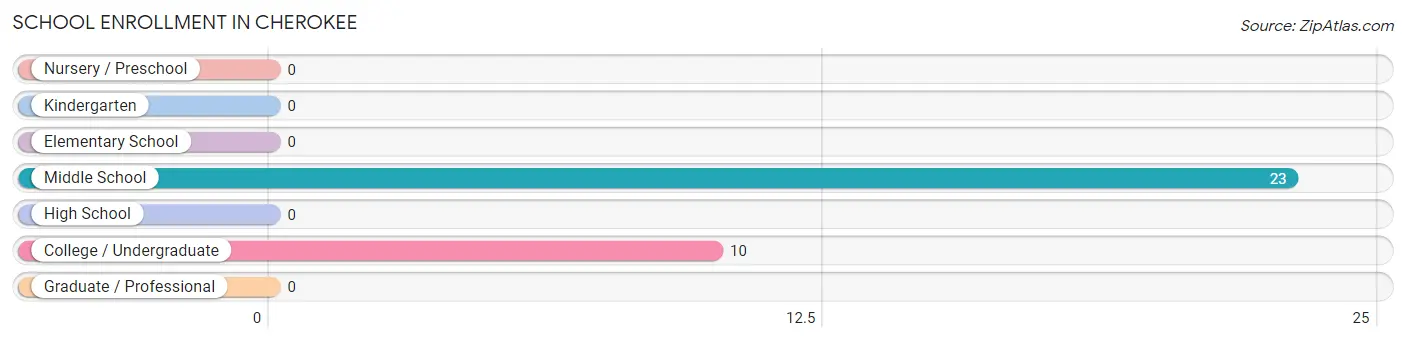
School Enrollment in Cherokee
The most common levels of schooling among the 33 students in Cherokee are middle school (23 | 69.7%), and college / undergraduate (10 | 30.3%).
| School Level | # Students | % Students |
| Nursery / Preschool | 0 | 0.0% |
| Kindergarten | 0 | 0.0% |
| Elementary School | 0 | 0.0% |
| Middle School | 23 | 69.7% |
| High School | 0 | 0.0% |
| College / Undergraduate | 10 | 30.3% |
| Graduate / Professional | 0 | 0.0% |
| Total | 33 | 100.0% |
School Enrollment by Age by Funding Source in Cherokee
Out of a total of 33 students who are enrolled in schools in Cherokee, 23 (69.7%) attend a private institution, while the remaining 10 (30.3%) are enrolled in public schools. The age group of 10 to 14 year olds has the highest likelihood of being enrolled in private schools, with 23 (100.0% in the age bracket) enrolled. Conversely, the age group of 35 years and over has the lowest likelihood of being enrolled in a private school, with 10 (100.0% in the age bracket) attending a public institution.
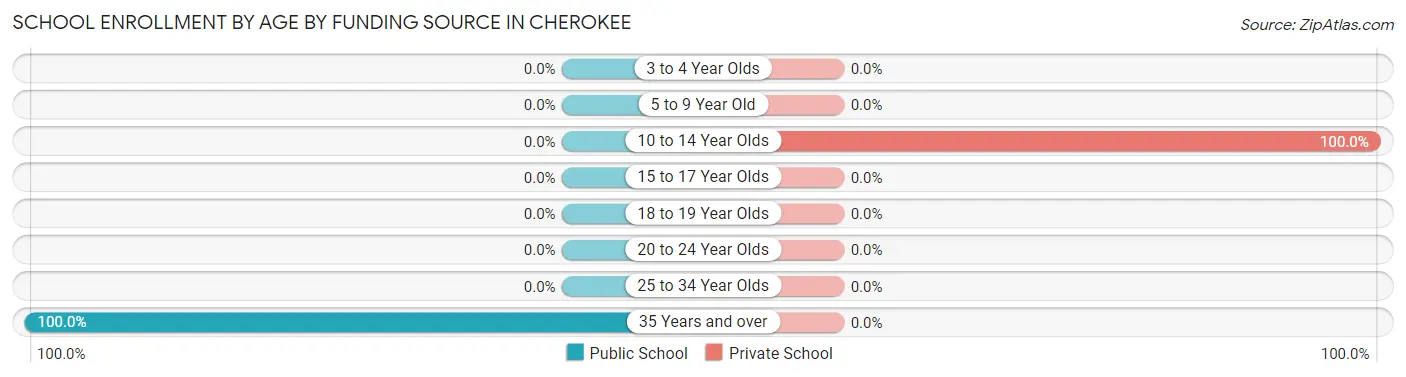
| Age Bracket | Public School | Private School |
| 3 to 4 Year Olds | 0 (0.0%) | 0 (0.0%) |
| 5 to 9 Year Old | 0 (0.0%) | 0 (0.0%) |
| 10 to 14 Year Olds | 0 (0.0%) | 23 (100.0%) |
| 15 to 17 Year Olds | 0 (0.0%) | 0 (0.0%) |
| 18 to 19 Year Olds | 0 (0.0%) | 0 (0.0%) |
| 20 to 24 Year Olds | 0 (0.0%) | 0 (0.0%) |
| 25 to 34 Year Olds | 0 (0.0%) | 0 (0.0%) |
| 35 Years and over | 10 (100.0%) | 0 (0.0%) |
| Total | 10 (30.3%) | 23 (69.7%) |
Educational Attainment by Field of Study in Cherokee
, and arts & humanities (25 | 100.0%) are the most common fields of study among 25 individuals in Cherokee who have obtained a bachelor's degree or higher.
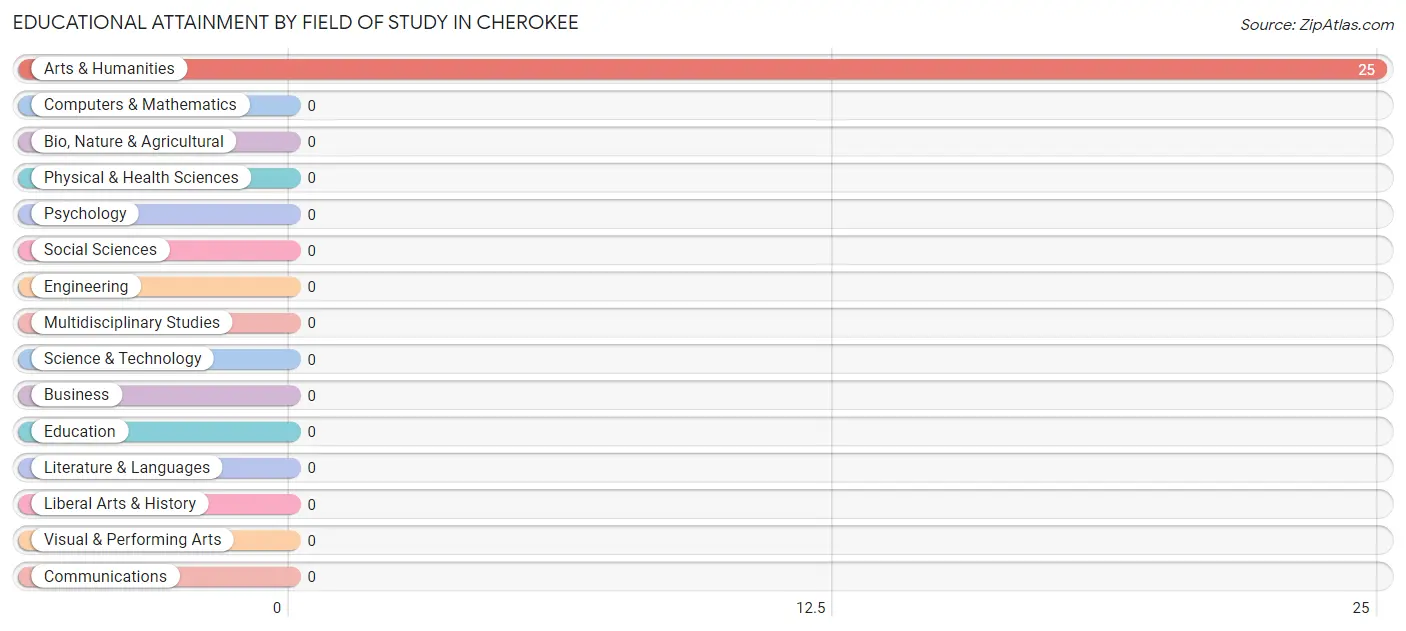
| Field of Study | # Graduates | % Graduates |
| Computers & Mathematics | 0 | 0.0% |
| Bio, Nature & Agricultural | 0 | 0.0% |
| Physical & Health Sciences | 0 | 0.0% |
| Psychology | 0 | 0.0% |
| Social Sciences | 0 | 0.0% |
| Engineering | 0 | 0.0% |
| Multidisciplinary Studies | 0 | 0.0% |
| Science & Technology | 0 | 0.0% |
| Business | 0 | 0.0% |
| Education | 0 | 0.0% |
| Literature & Languages | 0 | 0.0% |
| Liberal Arts & History | 0 | 0.0% |
| Visual & Performing Arts | 0 | 0.0% |
| Communications | 0 | 0.0% |
| Arts & Humanities | 25 | 100.0% |
| Total | 25 | 100.0% |
Transportation & Commute in Cherokee
Vehicle Availability by Sex in Cherokee
The most prevalent vehicle ownership categories in Cherokee are males with 2 vehicles (15, accounting for 100.0%) and females with 2 vehicles (28, making up 53.6%).
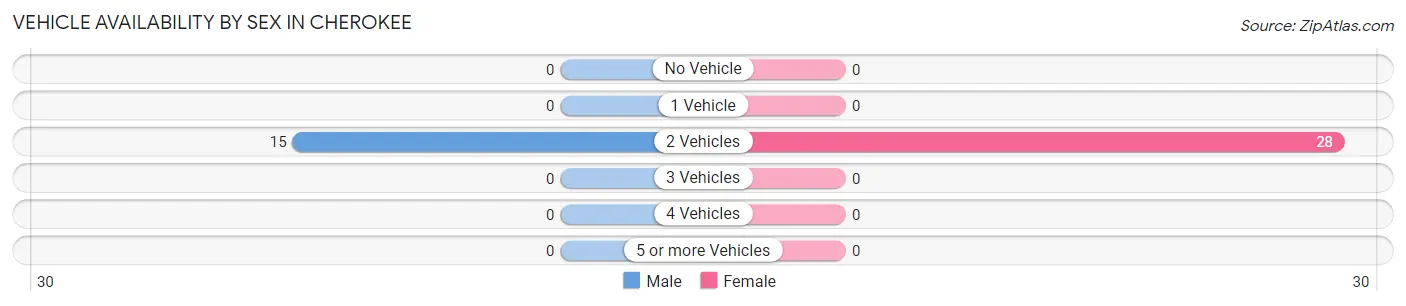
| Vehicles Available | Male | Female |
| No Vehicle | 0 (0.0%) | 0 (0.0%) |
| 1 Vehicle | 0 (0.0%) | 0 (0.0%) |
| 2 Vehicles | 15 (100.0%) | 28 (100.0%) |
| 3 Vehicles | 0 (0.0%) | 0 (0.0%) |
| 4 Vehicles | 0 (0.0%) | 0 (0.0%) |
| 5 or more Vehicles | 0 (0.0%) | 0 (0.0%) |
| Total | 15 (100.0%) | 28 (100.0%) |
Commute Time in Cherokee
The most frequently occuring commute durations in Cherokee are 15 to 19 minutes (18 commuters, 41.9%), 60 to 89 minutes (15 commuters, 34.9%), and 5 to 9 minutes (10 commuters, 23.3%).
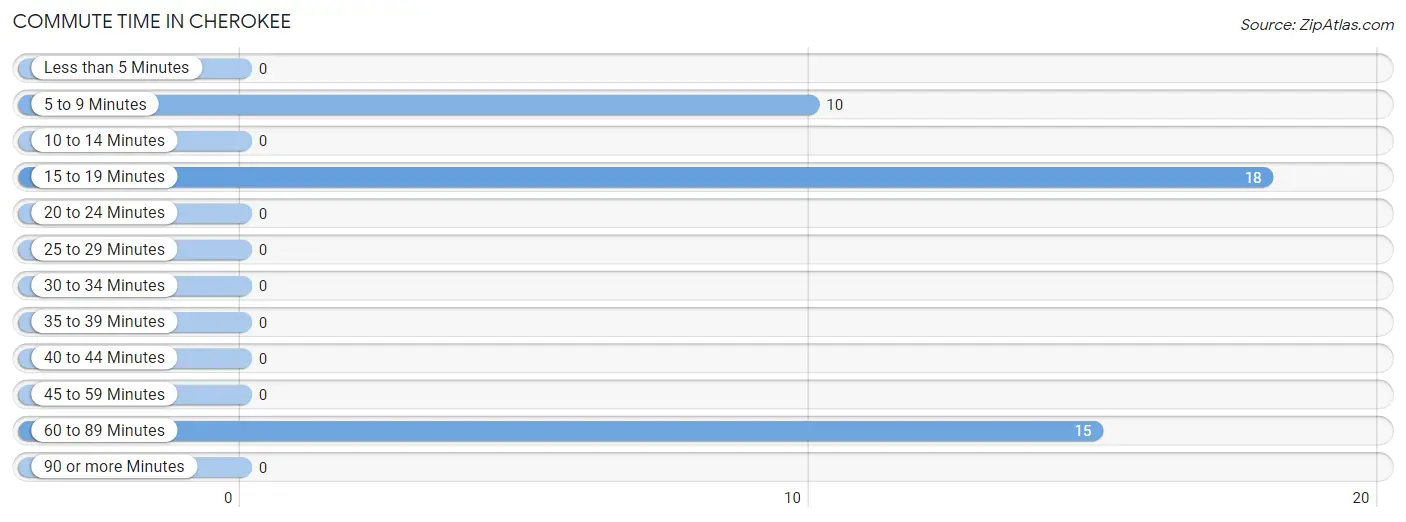
| Commute Time | # Commuters | % Commuters |
| Less than 5 Minutes | 0 | 0.0% |
| 5 to 9 Minutes | 10 | 23.3% |
| 10 to 14 Minutes | 0 | 0.0% |
| 15 to 19 Minutes | 18 | 41.9% |
| 20 to 24 Minutes | 0 | 0.0% |
| 25 to 29 Minutes | 0 | 0.0% |
| 30 to 34 Minutes | 0 | 0.0% |
| 35 to 39 Minutes | 0 | 0.0% |
| 40 to 44 Minutes | 0 | 0.0% |
| 45 to 59 Minutes | 0 | 0.0% |
| 60 to 89 Minutes | 15 | 34.9% |
| 90 or more Minutes | 0 | 0.0% |
Commute Time by Sex in Cherokee
The most common commute times in Cherokee are 60 to 89 minutes (15 commuters, 100.0%) for males and 15 to 19 minutes (18 commuters, 64.3%) for females.
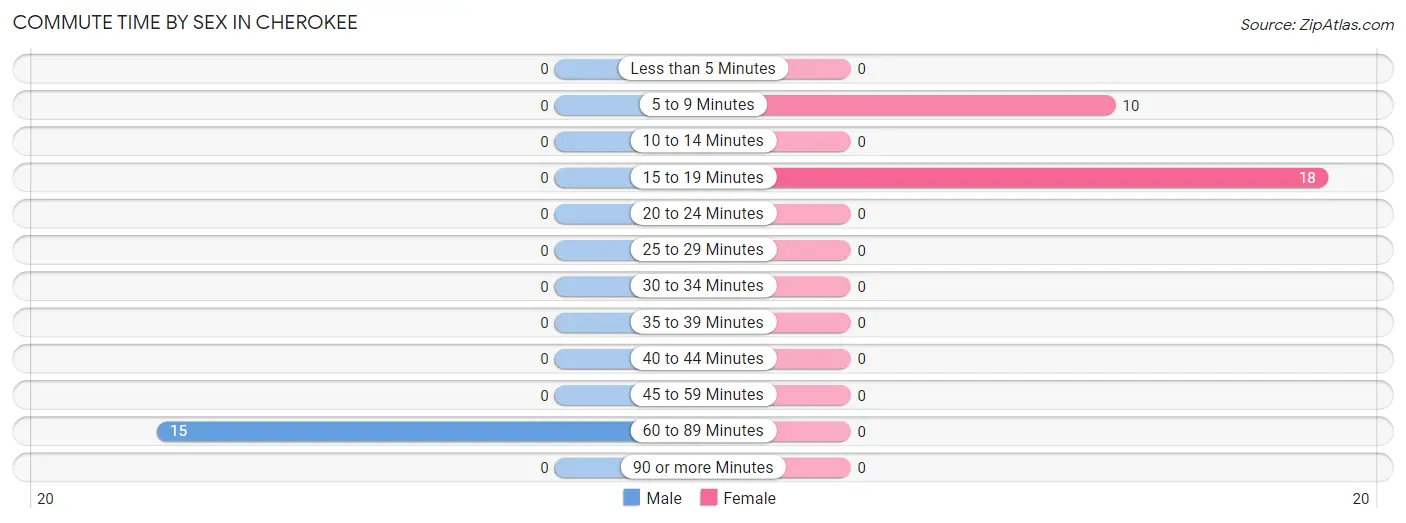
| Commute Time | Male | Female |
| Less than 5 Minutes | 0 (0.0%) | 0 (0.0%) |
| 5 to 9 Minutes | 0 (0.0%) | 10 (35.7%) |
| 10 to 14 Minutes | 0 (0.0%) | 0 (0.0%) |
| 15 to 19 Minutes | 0 (0.0%) | 18 (64.3%) |
| 20 to 24 Minutes | 0 (0.0%) | 0 (0.0%) |
| 25 to 29 Minutes | 0 (0.0%) | 0 (0.0%) |
| 30 to 34 Minutes | 0 (0.0%) | 0 (0.0%) |
| 35 to 39 Minutes | 0 (0.0%) | 0 (0.0%) |
| 40 to 44 Minutes | 0 (0.0%) | 0 (0.0%) |
| 45 to 59 Minutes | 0 (0.0%) | 0 (0.0%) |
| 60 to 89 Minutes | 15 (100.0%) | 0 (0.0%) |
| 90 or more Minutes | 0 (0.0%) | 0 (0.0%) |
Time of Departure to Work by Sex in Cherokee
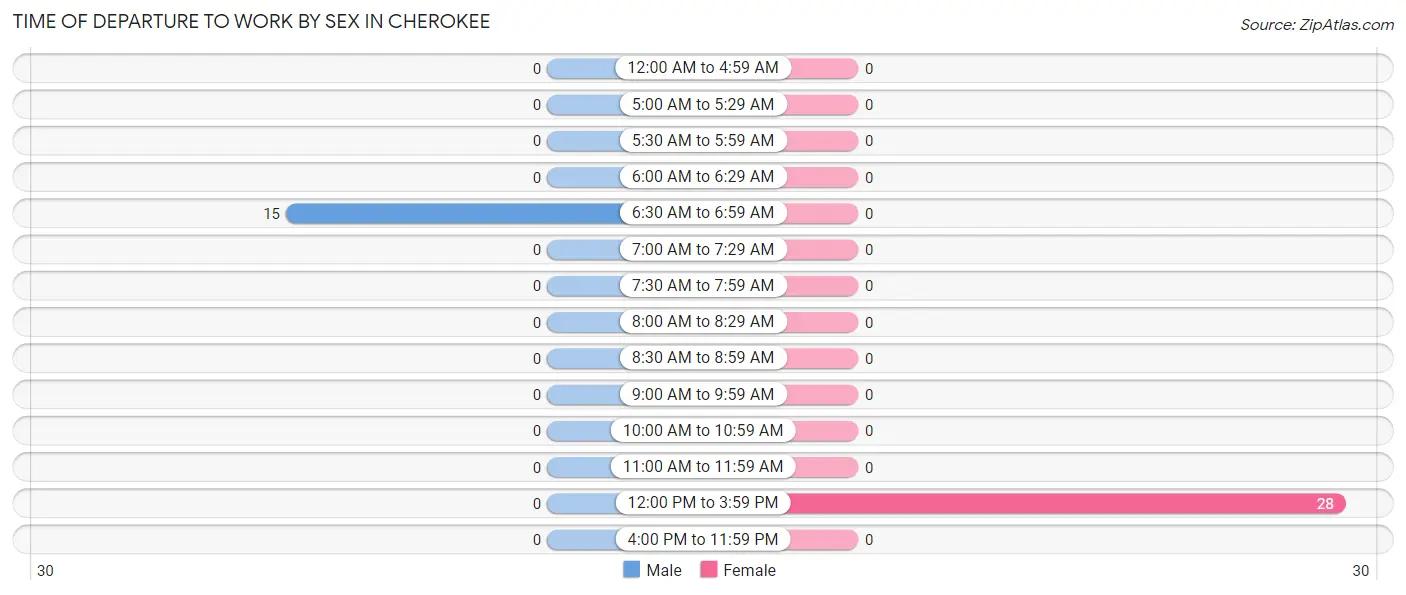
The most frequent times of departure to work in Cherokee are 6:30 AM to 6:59 AM (15, 100.0%) for males and 12:00 PM to 3:59 PM (28, 100.0%) for females.
| Time of Departure | Male | Female |
| 12:00 AM to 4:59 AM | 0 (0.0%) | 0 (0.0%) |
| 5:00 AM to 5:29 AM | 0 (0.0%) | 0 (0.0%) |
| 5:30 AM to 5:59 AM | 0 (0.0%) | 0 (0.0%) |
| 6:00 AM to 6:29 AM | 0 (0.0%) | 0 (0.0%) |
| 6:30 AM to 6:59 AM | 15 (100.0%) | 0 (0.0%) |
| 7:00 AM to 7:29 AM | 0 (0.0%) | 0 (0.0%) |
| 7:30 AM to 7:59 AM | 0 (0.0%) | 0 (0.0%) |
| 8:00 AM to 8:29 AM | 0 (0.0%) | 0 (0.0%) |
| 8:30 AM to 8:59 AM | 0 (0.0%) | 0 (0.0%) |
| 9:00 AM to 9:59 AM | 0 (0.0%) | 0 (0.0%) |
| 10:00 AM to 10:59 AM | 0 (0.0%) | 0 (0.0%) |
| 11:00 AM to 11:59 AM | 0 (0.0%) | 0 (0.0%) |
| 12:00 PM to 3:59 PM | 0 (0.0%) | 28 (100.0%) |
| 4:00 PM to 11:59 PM | 0 (0.0%) | 0 (0.0%) |
| Total | 15 (100.0%) | 28 (100.0%) |
Housing Occupancy in Cherokee
Occupancy by Ownership in Cherokee
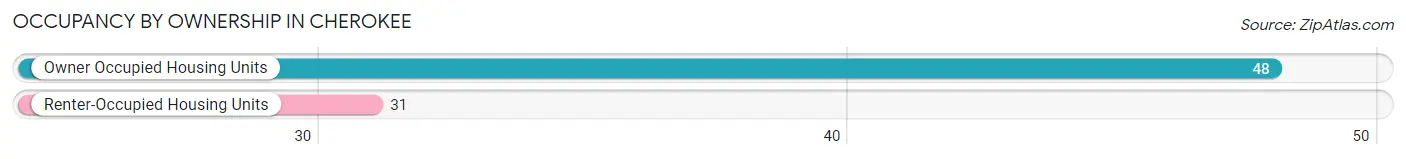
Of the total 79 dwellings in Cherokee, owner-occupied units account for 48 (60.8%), while renter-occupied units make up 31 (39.2%).
| Occupancy | # Housing Units | % Housing Units |
| Owner Occupied Housing Units | 48 | 60.8% |
| Renter-Occupied Housing Units | 31 | 39.2% |
| Total Occupied Housing Units | 79 | 100.0% |
Occupancy by Household Size in Cherokee
| Household Size | # Housing Units | % Housing Units |
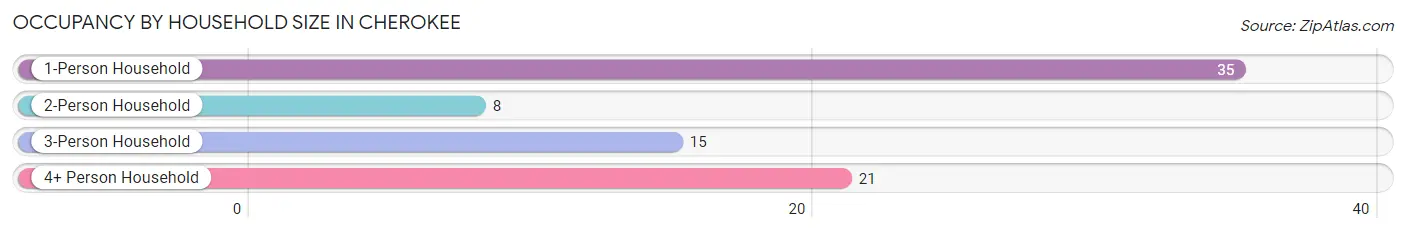
| 1-Person Household | 35 | 44.3% |
| 2-Person Household | 8 | 10.1% |
| 3-Person Household | 15 | 19.0% |
| 4+ Person Household | 21 | 26.6% |
| Total Housing Units | 79 | 100.0% |
Occupancy by Ownership by Household Size in Cherokee
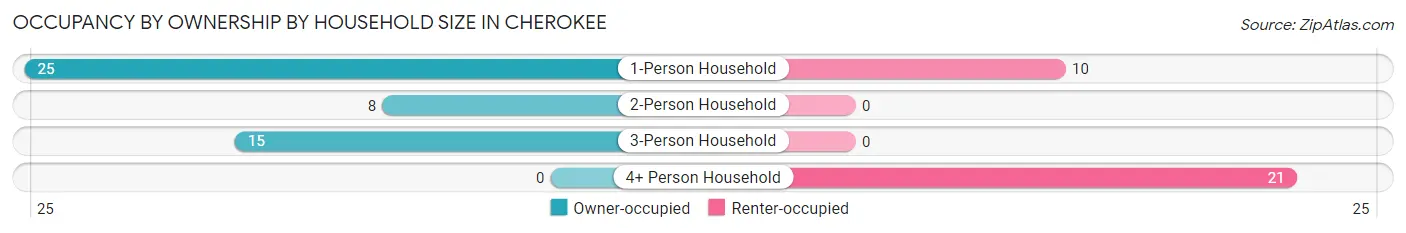
| Household Size | Owner-occupied | Renter-occupied |
| 1-Person Household | 25 (71.4%) | 10 (28.6%) |
| 2-Person Household | 8 (100.0%) | 0 (0.0%) |
| 3-Person Household | 15 (100.0%) | 0 (0.0%) |
| 4+ Person Household | 0 (0.0%) | 21 (100.0%) |
| Total Housing Units | 48 (60.8%) | 31 (39.2%) |
Occupancy by Educational Attainment in Cherokee
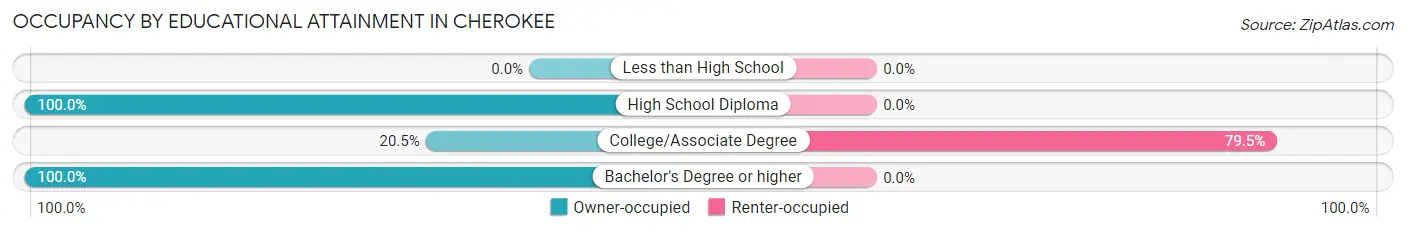
| Household Size | Owner-occupied | Renter-occupied |
| Less than High School | 0 (0.0%) | 0 (0.0%) |
| High School Diploma | 15 (100.0%) | 0 (0.0%) |
| College/Associate Degree | 8 (20.5%) | 31 (79.5%) |
| Bachelor's Degree or higher | 25 (100.0%) | 0 (0.0%) |
Occupancy by Age of Householder in Cherokee
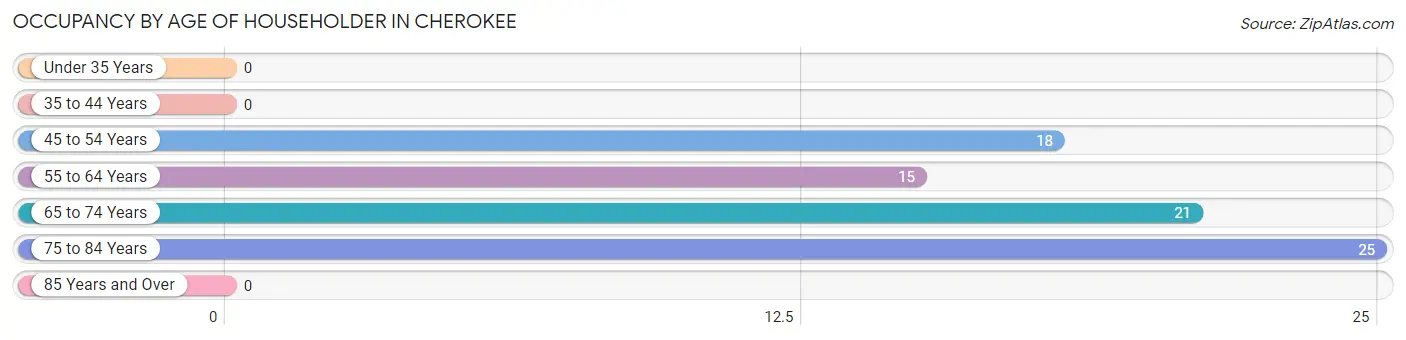
| Age Bracket | # Households | % Households |
| Under 35 Years | 0 | 0.0% |
| 35 to 44 Years | 0 | 0.0% |
| 45 to 54 Years | 18 | 22.8% |
| 55 to 64 Years | 15 | 19.0% |
| 65 to 74 Years | 21 | 26.6% |
| 75 to 84 Years | 25 | 31.7% |
| 85 Years and Over | 0 | 0.0% |
| Total | 79 | 100.0% |
Housing Finances in Cherokee
Median Income by Occupancy in Cherokee
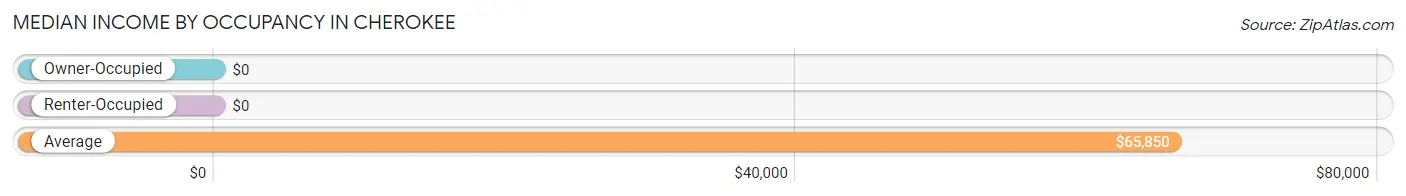
| Occupancy Type | # Households | Median Income |
| Owner-Occupied | 48 (60.8%) | $0 |
| Renter-Occupied | 31 (39.2%) | $0 |
| Average | 79 (100.0%) | $65,850 |
Occupancy by Householder Income Bracket in Cherokee
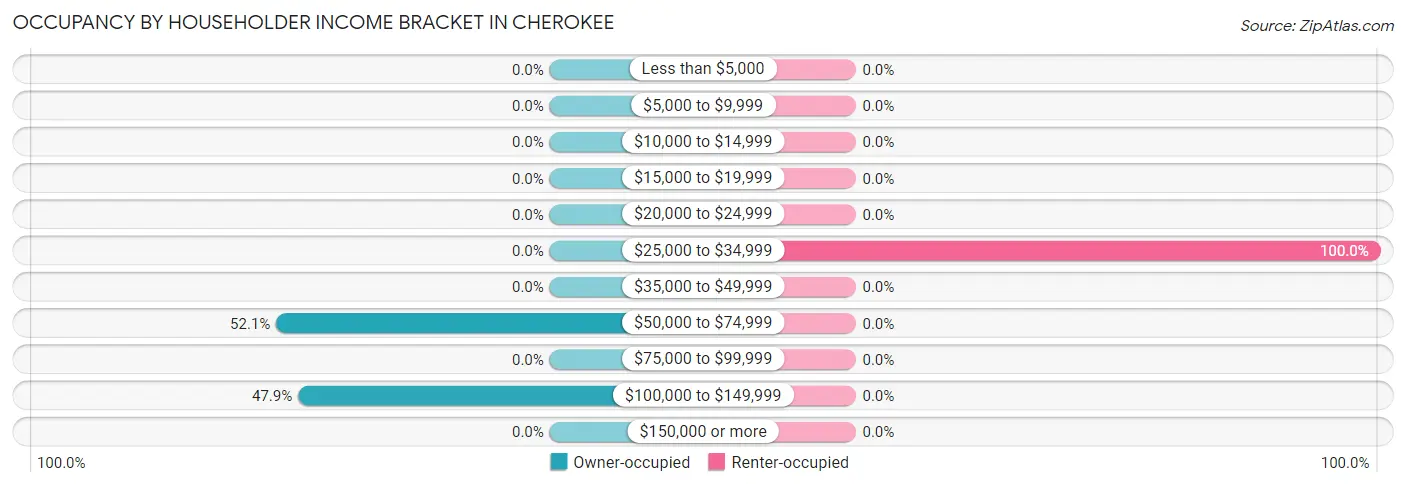
| Income Bracket | Owner-occupied | Renter-occupied |
| Less than $5,000 | 0 (0.0%) | 0 (0.0%) |
| $5,000 to $9,999 | 0 (0.0%) | 0 (0.0%) |
| $10,000 to $14,999 | 0 (0.0%) | 0 (0.0%) |
| $15,000 to $19,999 | 0 (0.0%) | 0 (0.0%) |
| $20,000 to $24,999 | 0 (0.0%) | 0 (0.0%) |
| $25,000 to $34,999 | 0 (0.0%) | 31 (100.0%) |
| $35,000 to $49,999 | 0 (0.0%) | 0 (0.0%) |
| $50,000 to $74,999 | 25 (52.1%) | 0 (0.0%) |
| $75,000 to $99,999 | 0 (0.0%) | 0 (0.0%) |
| $100,000 to $149,999 | 23 (47.9%) | 0 (0.0%) |
| $150,000 or more | 0 (0.0%) | 0 (0.0%) |
| Total | 48 (100.0%) | 31 (100.0%) |
Monthly Housing Cost Tiers in Cherokee
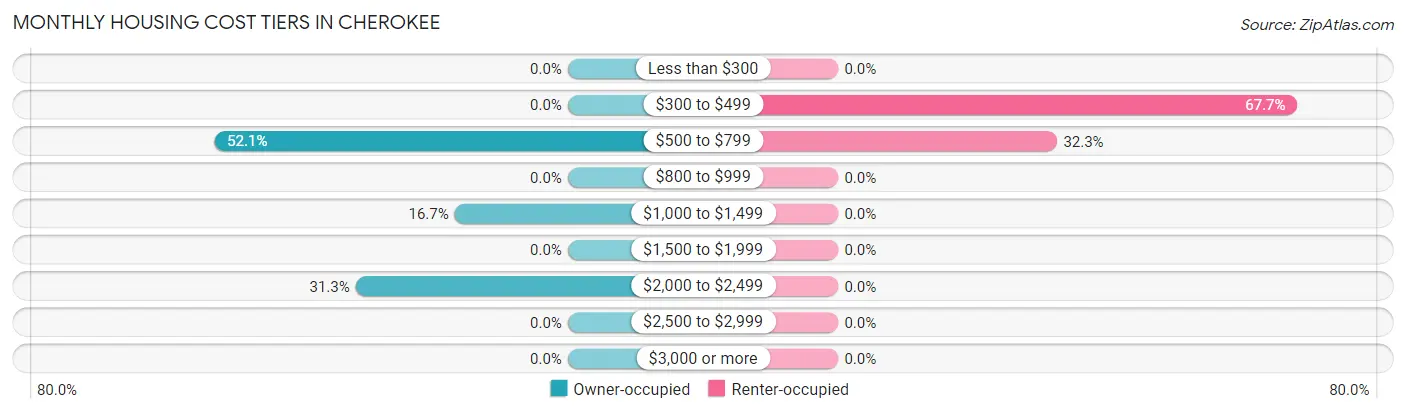
| Monthly Cost | Owner-occupied | Renter-occupied |
| Less than $300 | 0 (0.0%) | 0 (0.0%) |
| $300 to $499 | 0 (0.0%) | 21 (67.7%) |
| $500 to $799 | 25 (52.1%) | 10 (32.3%) |
| $800 to $999 | 0 (0.0%) | 0 (0.0%) |
| $1,000 to $1,499 | 8 (16.7%) | 0 (0.0%) |
| $1,500 to $1,999 | 0 (0.0%) | 0 (0.0%) |
| $2,000 to $2,499 | 15 (31.2%) | 0 (0.0%) |
| $2,500 to $2,999 | 0 (0.0%) | 0 (0.0%) |
| $3,000 or more | 0 (0.0%) | 0 (0.0%) |
| Total | 48 (100.0%) | 31 (100.0%) |
Physical Housing Characteristics in Cherokee
Housing Structures in Cherokee
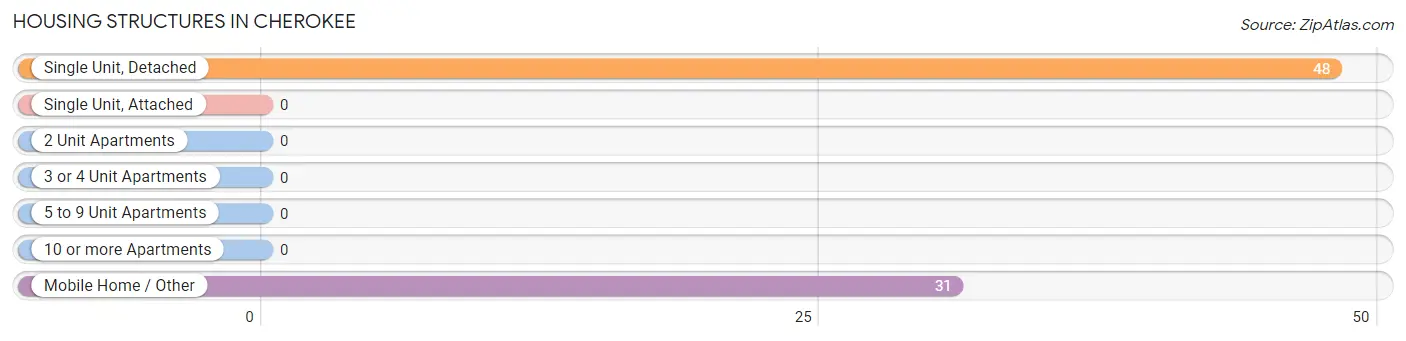
| Structure Type | # Housing Units | % Housing Units |
| Single Unit, Detached | 48 | 60.8% |
| Single Unit, Attached | 0 | 0.0% |
| 2 Unit Apartments | 0 | 0.0% |
| 3 or 4 Unit Apartments | 0 | 0.0% |
| 5 to 9 Unit Apartments | 0 | 0.0% |
| 10 or more Apartments | 0 | 0.0% |
| Mobile Home / Other | 31 | 39.2% |
| Total | 79 | 100.0% |
Housing Structures by Occupancy in Cherokee
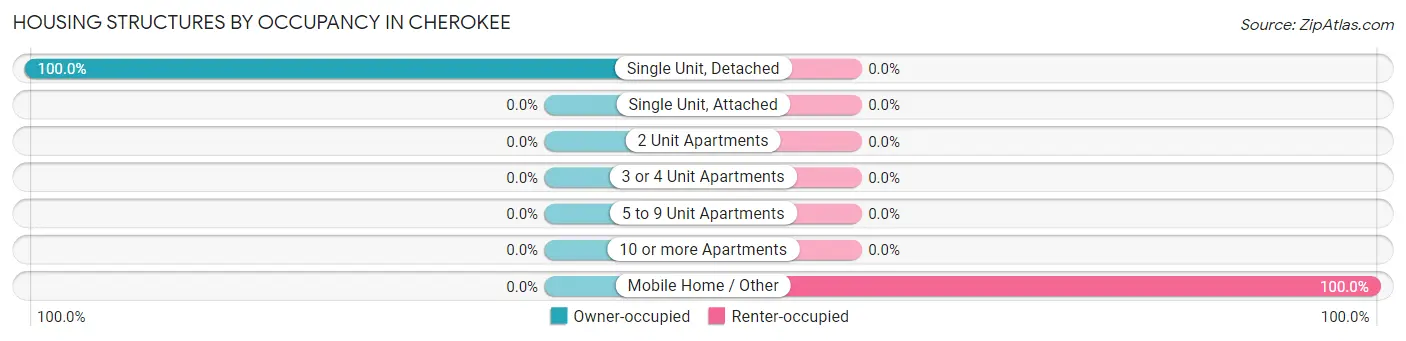
| Structure Type | Owner-occupied | Renter-occupied |
| Single Unit, Detached | 48 (100.0%) | 0 (0.0%) |
| Single Unit, Attached | 0 (0.0%) | 0 (0.0%) |
| 2 Unit Apartments | 0 (0.0%) | 0 (0.0%) |
| 3 or 4 Unit Apartments | 0 (0.0%) | 0 (0.0%) |
| 5 to 9 Unit Apartments | 0 (0.0%) | 0 (0.0%) |
| 10 or more Apartments | 0 (0.0%) | 0 (0.0%) |
| Mobile Home / Other | 0 (0.0%) | 31 (100.0%) |
| Total | 48 (60.8%) | 31 (39.2%) |
Housing Structures by Number of Rooms in Cherokee
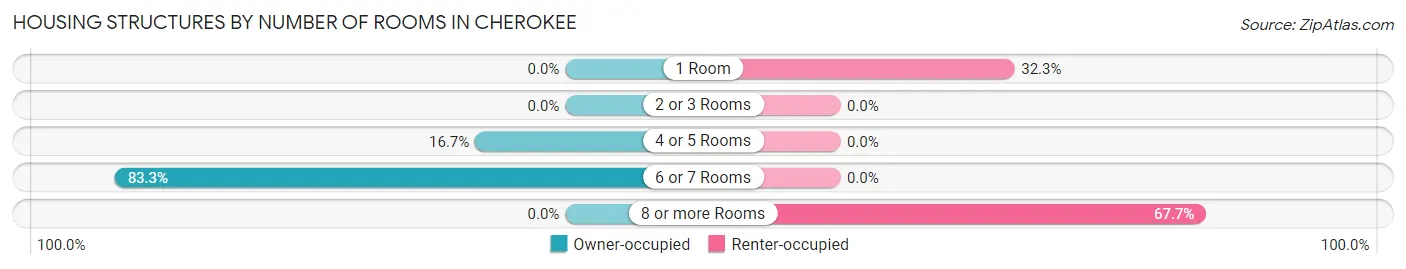
| Number of Rooms | Owner-occupied | Renter-occupied |
| 1 Room | 0 (0.0%) | 10 (32.3%) |
| 2 or 3 Rooms | 0 (0.0%) | 0 (0.0%) |
| 4 or 5 Rooms | 8 (16.7%) | 0 (0.0%) |
| 6 or 7 Rooms | 40 (83.3%) | 0 (0.0%) |
| 8 or more Rooms | 0 (0.0%) | 21 (67.7%) |
| Total | 48 (100.0%) | 31 (100.0%) |
Housing Structure by Heating Type in Cherokee
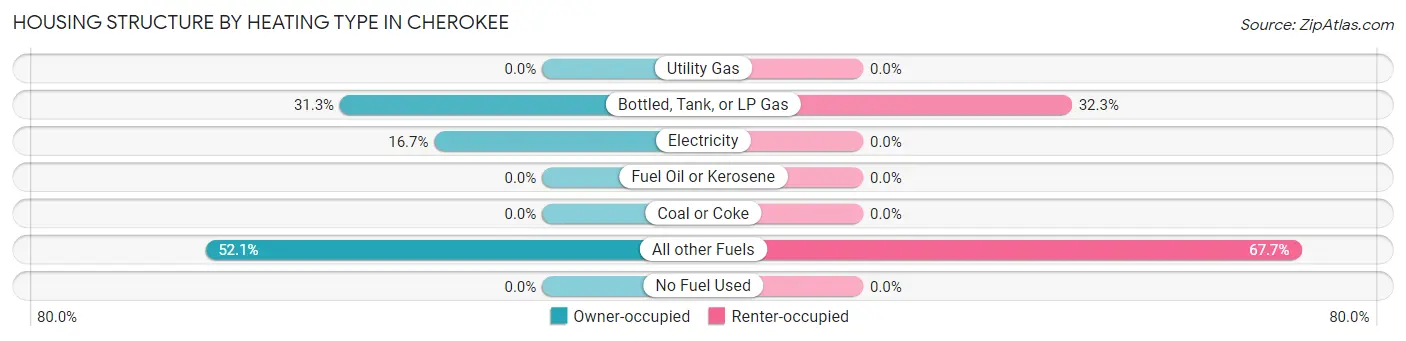
| Heating Type | Owner-occupied | Renter-occupied |
| Utility Gas | 0 (0.0%) | 0 (0.0%) |
| Bottled, Tank, or LP Gas | 15 (31.2%) | 10 (32.3%) |
| Electricity | 8 (16.7%) | 0 (0.0%) |
| Fuel Oil or Kerosene | 0 (0.0%) | 0 (0.0%) |
| Coal or Coke | 0 (0.0%) | 0 (0.0%) |
| All other Fuels | 25 (52.1%) | 21 (67.7%) |
| No Fuel Used | 0 (0.0%) | 0 (0.0%) |
| Total | 48 (100.0%) | 31 (100.0%) |
Household Vehicle Usage in Cherokee
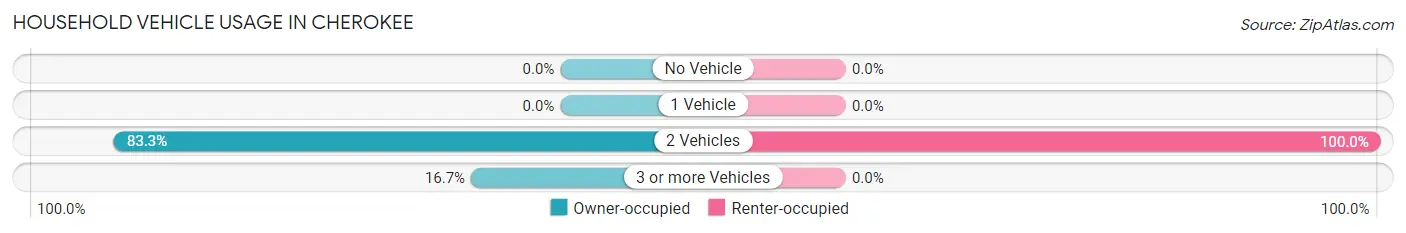
| Vehicles per Household | Owner-occupied | Renter-occupied |
| No Vehicle | 0 (0.0%) | 0 (0.0%) |
| 1 Vehicle | 0 (0.0%) | 0 (0.0%) |
| 2 Vehicles | 40 (83.3%) | 31 (100.0%) |
| 3 or more Vehicles | 8 (16.7%) | 0 (0.0%) |
| Total | 48 (100.0%) | 31 (100.0%) |
Real Estate & Mortgages in Cherokee
Real Estate and Mortgage Overview in Cherokee
| Characteristic | Without Mortgage | With Mortgage |
| Housing Units | 25 | 23 |
| Median Property Value | - | - |
| Median Household Income | - | - |
| Monthly Housing Costs | - | - |
| Real Estate Taxes | - | - |
Property Value by Mortgage Status in Cherokee
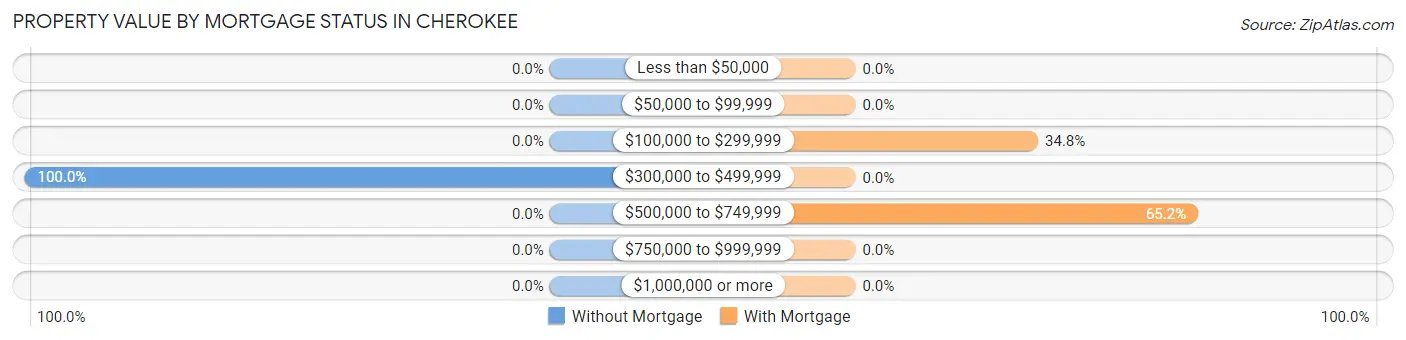
| Property Value | Without Mortgage | With Mortgage |
| Less than $50,000 | 0 (0.0%) | 0 (0.0%) |
| $50,000 to $99,999 | 0 (0.0%) | 0 (0.0%) |
| $100,000 to $299,999 | 0 (0.0%) | 8 (34.8%) |
| $300,000 to $499,999 | 25 (100.0%) | 0 (0.0%) |
| $500,000 to $749,999 | 0 (0.0%) | 15 (65.2%) |
| $750,000 to $999,999 | 0 (0.0%) | 0 (0.0%) |
| $1,000,000 or more | 0 (0.0%) | 0 (0.0%) |
| Total | 25 (100.0%) | 23 (100.0%) |
Household Income by Mortgage Status in Cherokee
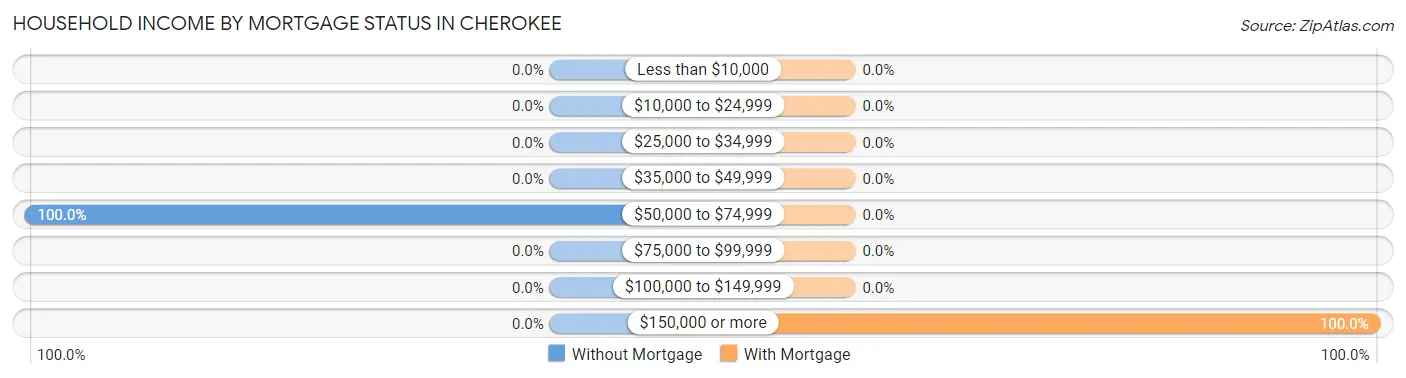
| Household Income | Without Mortgage | With Mortgage |
| Less than $10,000 | 0 (0.0%) | 0 (0.0%) |
| $10,000 to $24,999 | 0 (0.0%) | 0 (0.0%) |
| $25,000 to $34,999 | 0 (0.0%) | 0 (0.0%) |
| $35,000 to $49,999 | 0 (0.0%) | 0 (0.0%) |
| $50,000 to $74,999 | 25 (100.0%) | 0 (0.0%) |
| $75,000 to $99,999 | 0 (0.0%) | 0 (0.0%) |
| $100,000 to $149,999 | 0 (0.0%) | 0 (0.0%) |
| $150,000 or more | 0 (0.0%) | 23 (100.0%) |
| Total | 25 (100.0%) | 23 (100.0%) |
Property Value to Household Income Ratio in Cherokee
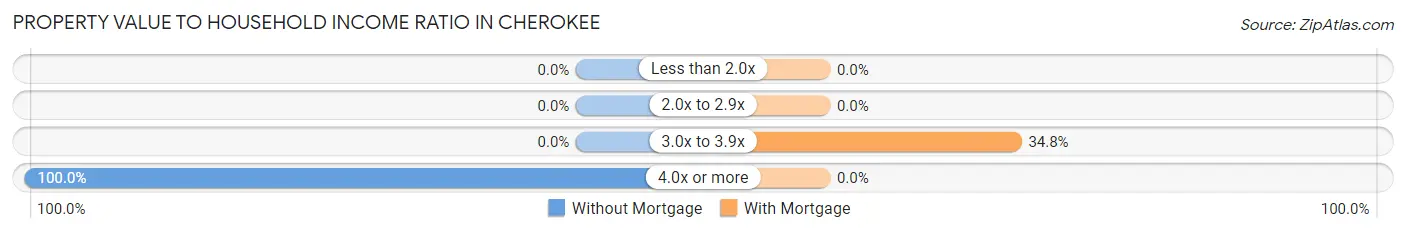
| Value-to-Income Ratio | Without Mortgage | With Mortgage |
| Less than 2.0x | 0 (0.0%) | 0 (0.0%) |
| 2.0x to 2.9x | 0 (0.0%) | 0 (0.0%) |
| 3.0x to 3.9x | 0 (0.0%) | 8 (34.8%) |
| 4.0x or more | 25 (100.0%) | 0 (0.0%) |
| Total | 25 (100.0%) | 23 (100.0%) |
Real Estate Taxes by Mortgage Status in Cherokee
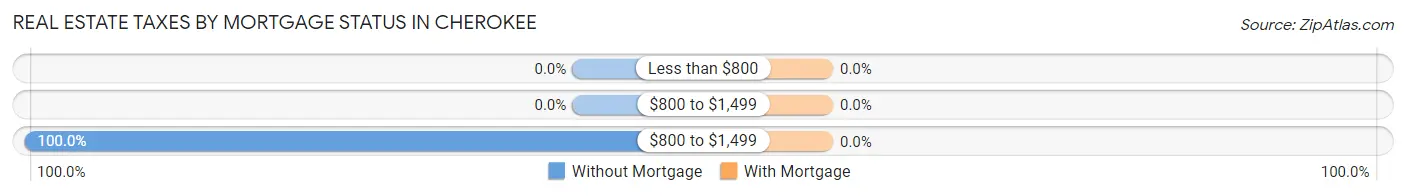
| Property Taxes | Without Mortgage | With Mortgage |
| Less than $800 | 0 (0.0%) | 0 (0.0%) |
| $800 to $1,499 | 0 (0.0%) | 0 (0.0%) |
| $800 to $1,499 | 25 (100.0%) | 0 (0.0%) |
| Total | 25 (100.0%) | 23 (100.0%) |
Health & Disability in Cherokee
Health Insurance Coverage by Age in Cherokee
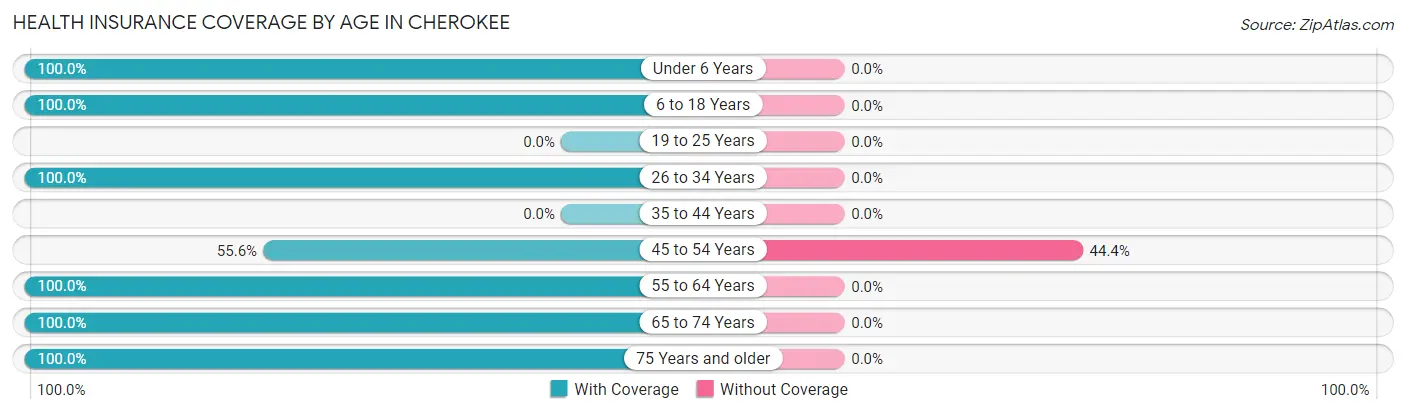
| Age Bracket | With Coverage | Without Coverage |
| Under 6 Years | 48 (100.0%) | 0 (0.0%) |
| 6 to 18 Years | 23 (100.0%) | 0 (0.0%) |
| 19 to 25 Years | 0 (0.0%) | 0 (0.0%) |
| 26 to 34 Years | 18 (100.0%) | 0 (0.0%) |
| 35 to 44 Years | 0 (0.0%) | 0 (0.0%) |
| 45 to 54 Years | 10 (55.6%) | 8 (44.4%) |
| 55 to 64 Years | 39 (100.0%) | 0 (0.0%) |
| 65 to 74 Years | 21 (100.0%) | 0 (0.0%) |
| 75 Years and older | 38 (100.0%) | 0 (0.0%) |
| Total | 197 (96.1%) | 8 (3.9%) |
Health Insurance Coverage by Citizenship Status in Cherokee
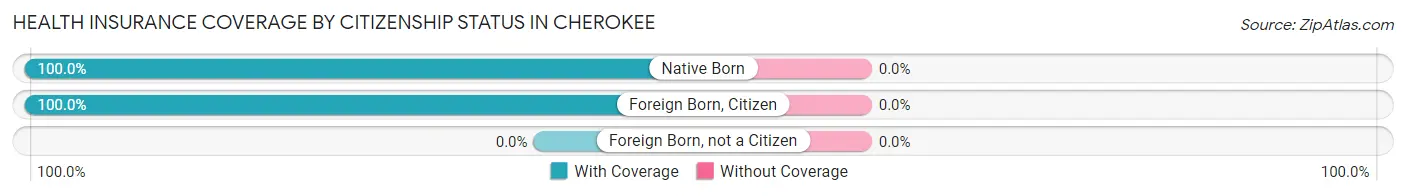
| Citizenship Status | With Coverage | Without Coverage |
| Native Born | 48 (100.0%) | 0 (0.0%) |
| Foreign Born, Citizen | 23 (100.0%) | 0 (0.0%) |
| Foreign Born, not a Citizen | 0 (0.0%) | 0 (0.0%) |
Health Insurance Coverage by Household Income in Cherokee
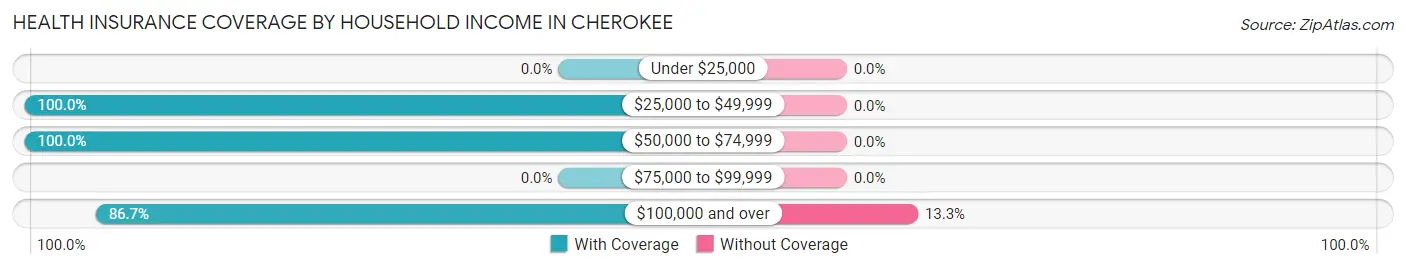
| Household Income | With Coverage | Without Coverage |
| Under $25,000 | 0 (0.0%) | 0 (0.0%) |
| $25,000 to $49,999 | 120 (100.0%) | 0 (0.0%) |
| $50,000 to $74,999 | 25 (100.0%) | 0 (0.0%) |
| $75,000 to $99,999 | 0 (0.0%) | 0 (0.0%) |
| $100,000 and over | 52 (86.7%) | 8 (13.3%) |
Public vs Private Health Insurance Coverage by Age in Cherokee
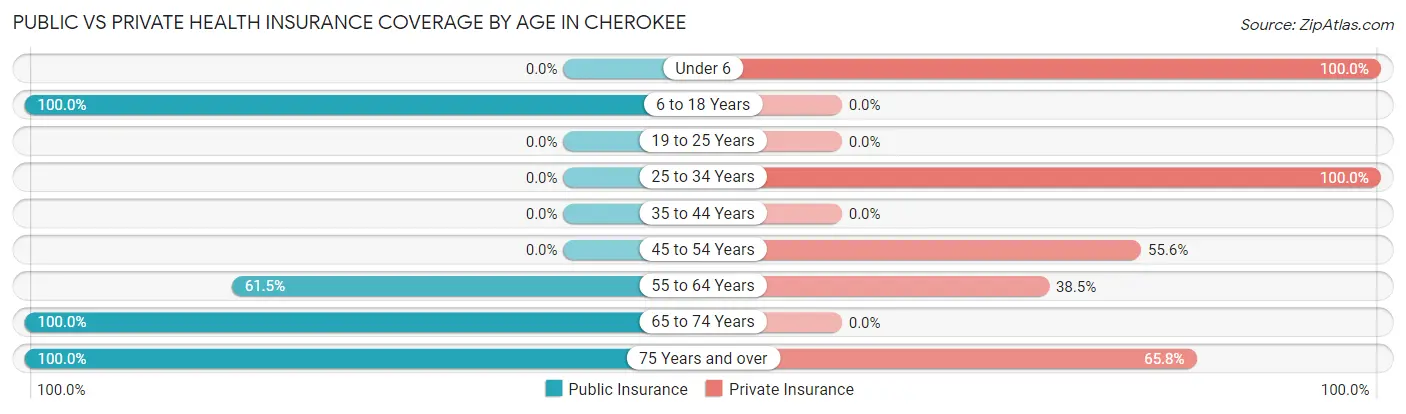
| Age Bracket | Public Insurance | Private Insurance |
| Under 6 | 0 (0.0%) | 48 (100.0%) |
| 6 to 18 Years | 23 (100.0%) | 0 (0.0%) |
| 19 to 25 Years | 0 (0.0%) | 0 (0.0%) |
| 25 to 34 Years | 0 (0.0%) | 18 (100.0%) |
| 35 to 44 Years | 0 (0.0%) | 0 (0.0%) |
| 45 to 54 Years | 0 (0.0%) | 10 (55.6%) |
| 55 to 64 Years | 24 (61.5%) | 15 (38.5%) |
| 65 to 74 Years | 21 (100.0%) | 0 (0.0%) |
| 75 Years and over | 38 (100.0%) | 25 (65.8%) |
| Total | 106 (51.7%) | 116 (56.6%) |
Disability Status by Sex by Age in Cherokee
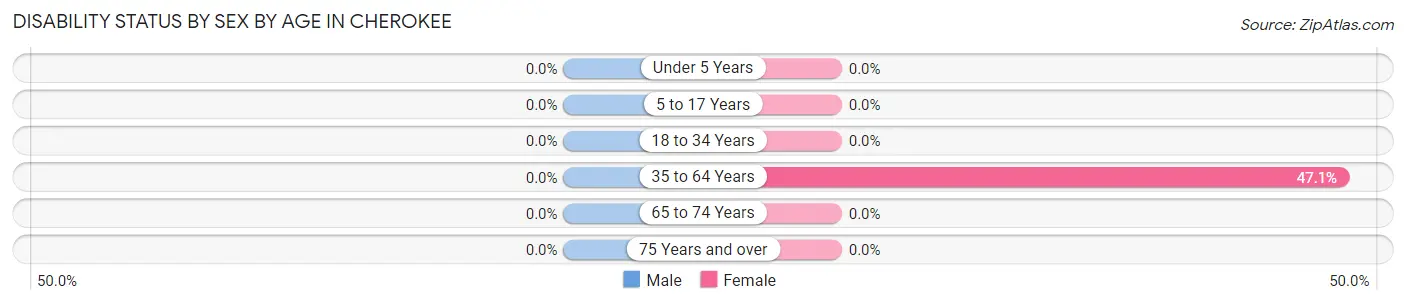
| Age Bracket | Male | Female |
| Under 5 Years | 0 (0.0%) | 0 (0.0%) |
| 5 to 17 Years | 0 (0.0%) | 0 (0.0%) |
| 18 to 34 Years | 0 (0.0%) | 0 (0.0%) |
| 35 to 64 Years | 0 (0.0%) | 16 (47.1%) |
| 65 to 74 Years | 0 (0.0%) | 0 (0.0%) |
| 75 Years and over | 0 (0.0%) | 0 (0.0%) |
Disability Class by Sex by Age in Cherokee
Disability Class: Hearing Difficulty
| Age Bracket | Male | Female |
| Under 5 Years | 0 (0.0%) | 0 (0.0%) |
| 5 to 17 Years | 0 (0.0%) | 0 (0.0%) |
| 18 to 34 Years | 0 (0.0%) | 0 (0.0%) |
| 35 to 64 Years | 0 (0.0%) | 0 (0.0%) |
| 65 to 74 Years | 0 (0.0%) | 0 (0.0%) |
| 75 Years and over | 0 (0.0%) | 0 (0.0%) |
Disability Class: Vision Difficulty
| Age Bracket | Male | Female |
| Under 5 Years | 0 (0.0%) | 0 (0.0%) |
| 5 to 17 Years | 0 (0.0%) | 0 (0.0%) |
| 18 to 34 Years | 0 (0.0%) | 0 (0.0%) |
| 35 to 64 Years | 0 (0.0%) | 0 (0.0%) |
| 65 to 74 Years | 0 (0.0%) | 0 (0.0%) |
| 75 Years and over | 0 (0.0%) | 0 (0.0%) |
Disability Class: Cognitive Difficulty
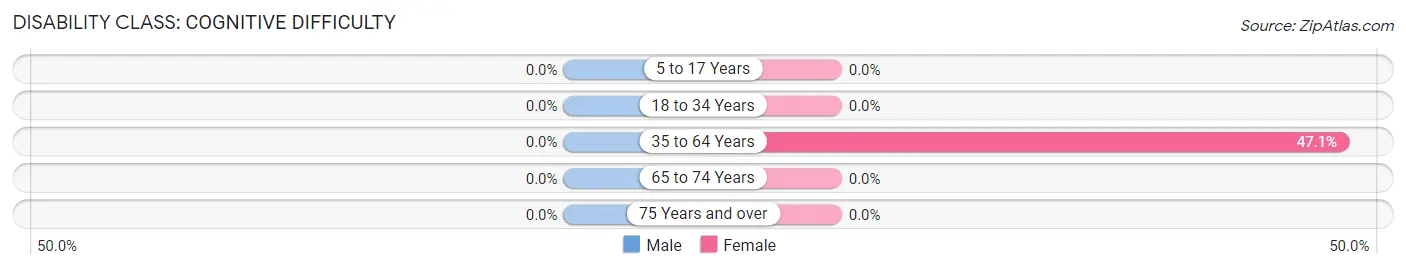
| Age Bracket | Male | Female |
| 5 to 17 Years | 0 (0.0%) | 0 (0.0%) |
| 18 to 34 Years | 0 (0.0%) | 0 (0.0%) |
| 35 to 64 Years | 0 (0.0%) | 16 (47.1%) |
| 65 to 74 Years | 0 (0.0%) | 0 (0.0%) |
| 75 Years and over | 0 (0.0%) | 0 (0.0%) |
Disability Class: Ambulatory Difficulty
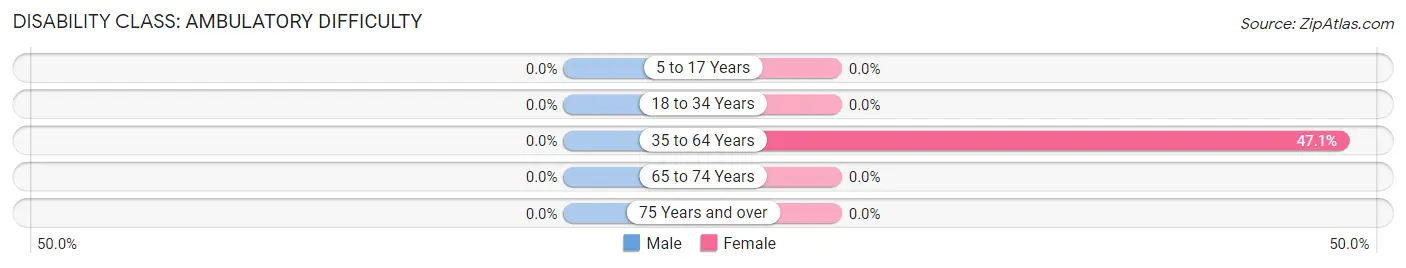
| Age Bracket | Male | Female |
| 5 to 17 Years | 0 (0.0%) | 0 (0.0%) |
| 18 to 34 Years | 0 (0.0%) | 0 (0.0%) |
| 35 to 64 Years | 0 (0.0%) | 16 (47.1%) |
| 65 to 74 Years | 0 (0.0%) | 0 (0.0%) |
| 75 Years and over | 0 (0.0%) | 0 (0.0%) |
Disability Class: Self-Care Difficulty
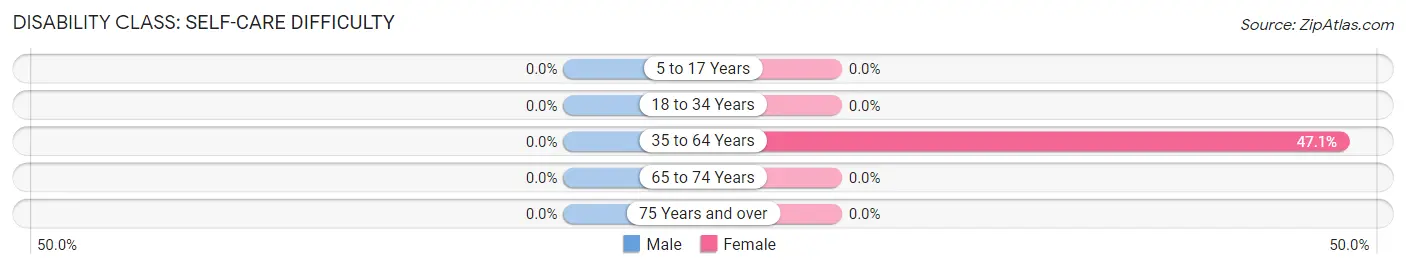
| Age Bracket | Male | Female |
| 5 to 17 Years | 0 (0.0%) | 0 (0.0%) |
| 18 to 34 Years | 0 (0.0%) | 0 (0.0%) |
| 35 to 64 Years | 0 (0.0%) | 16 (47.1%) |
| 65 to 74 Years | 0 (0.0%) | 0 (0.0%) |
| 75 Years and over | 0 (0.0%) | 0 (0.0%) |
Technology Access in Cherokee
Computing Device Access in Cherokee
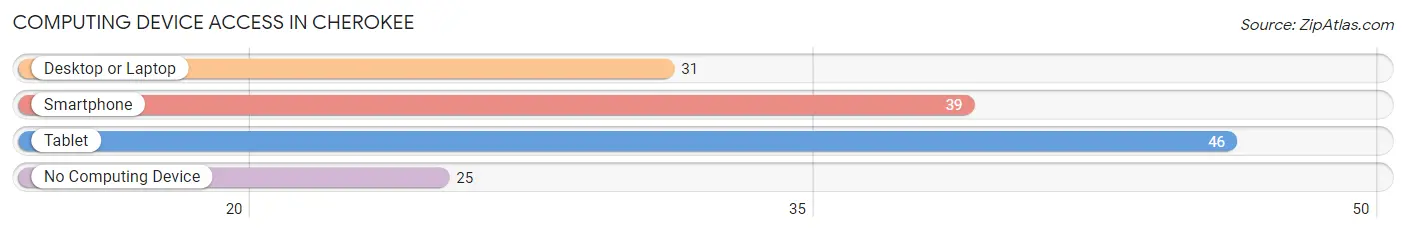
| Device Type | # Households | % Households |
| Desktop or Laptop | 31 | 39.2% |
| Smartphone | 39 | 49.4% |
| Tablet | 46 | 58.2% |
| No Computing Device | 25 | 31.7% |
| Total | 79 | 100.0% |
Internet Access in Cherokee
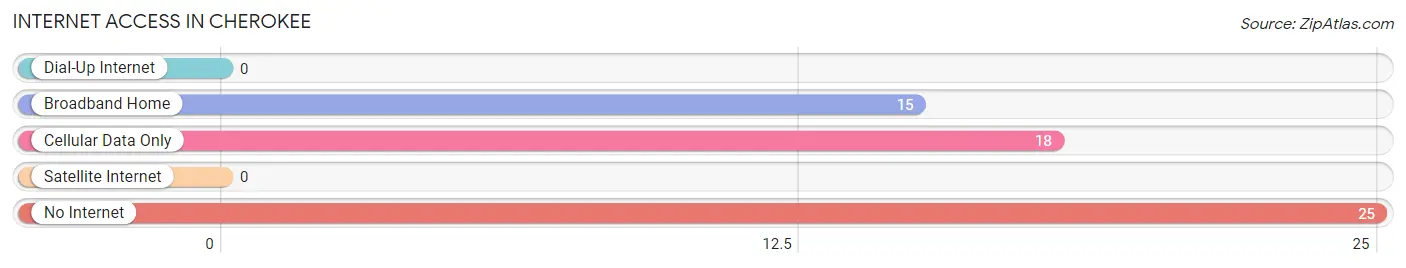
| Internet Type | # Households | % Households |
| Dial-Up Internet | 0 | 0.0% |
| Broadband Home | 15 | 19.0% |
| Cellular Data Only | 18 | 22.8% |
| Satellite Internet | 0 | 0.0% |
| No Internet | 25 | 31.7% |
| Total | 79 | 100.0% |
Cherokee Summary
Cherokee is a small unincorporated community located in the Sierra Nevada foothills of California, in El Dorado County. It is situated at an elevation of 2,400 feet (731 m) and is located approximately 25 miles (40 km) east of Placerville and about 40 miles (64 km) northeast of Sacramento. The population of Cherokee was estimated to be around 1,000 in 2020.
History
Cherokee was first settled in the 1850s by miners and ranchers. The town was named after the Cherokee Indians who lived in the area. The town was originally known as "Cherokee Flat" and was a popular stop for travelers on the stagecoach route between Placerville and Sacramento.
In the late 1800s, Cherokee was a bustling mining town with a population of over 1,000. The town had several stores, saloons, hotels, and a post office. The town was also home to a number of Chinese immigrants who worked in the mines and on the railroads.
In the early 1900s, the town began to decline as the gold mines were depleted and the railroad bypassed the town. By the 1950s, the population had dwindled to just a few hundred people.
Geography
Cherokee is located in the Sierra Nevada foothills of California, in El Dorado County. It is situated at an elevation of 2,400 feet (731 m) and is located approximately 25 miles (40 km) east of Placerville and about 40 miles (64 km) northeast of Sacramento.
The town is surrounded by the Eldorado National Forest and is located near the South Fork of the American River. The area is known for its scenic beauty and is popular with hikers, campers, and other outdoor enthusiasts.
Economy
The economy of Cherokee is largely based on tourism. The town is a popular destination for outdoor recreation, such as hiking, camping, fishing, and rafting. The town is also home to several wineries and vineyards, as well as a number of restaurants and shops.
Demographics
As of the 2010 census, the population of Cherokee was estimated to be around 1,000. The racial makeup of the town was 94.2% White, 0.7% African American, 0.7% Native American, 0.7% Asian, 0.7% from other races, and 2.7% from two or more races. Hispanic or Latino of any race were 3.7% of the population.
The median household income in Cherokee was $50,000, and the median family income was $54,000. The per capita income for the town was $25,000. About 10.7% of families and 14.3% of the population were below the poverty line, including 18.2% of those under age 18 and none of those age 65 or over.
Common Questions
What is Per Capita Income in Cherokee?
Per Capita income in Cherokee is $25,949.
What is the Median Household income in Cherokee?
Median Household Income in Cherokee is $65,850.
What is Inequality or Gini Index in Cherokee?
Inequality or Gini Index in Cherokee is 0.28.
What is the Total Population of Cherokee?
Total Population of Cherokee is 205.
What is the Total Male Population of Cherokee?
Total Male Population of Cherokee is 94.
What is the Total Female Population of Cherokee?
Total Female Population of Cherokee is 111.
What is the Ratio of Males per 100 Females in Cherokee?
There are 84.68 Males per 100 Females in Cherokee.
What is the Ratio of Females per 100 Males in Cherokee?
There are 118.09 Females per 100 Males in Cherokee.
What is the Median Population Age in Cherokee?
Median Population Age in Cherokee is 51.4 Years.
What is the Average Family Size in Cherokee
Average Family Size in Cherokee is 3.9 People.
What is the Average Household Size in Cherokee
Average Household Size in Cherokee is 2.6 People.
How Large is the Labor Force in Cherokee?
There are 59 People in the Labor Forcein in Cherokee.
What is the Percentage of People in the Labor Force in Cherokee?
44.0% of People are in the Labor Force in Cherokee.