Cities with the Highest Percentage of Salvadoran Population in California
RELATED REPORTS & OPTIONS
Salvadoran
California
Compare Cities
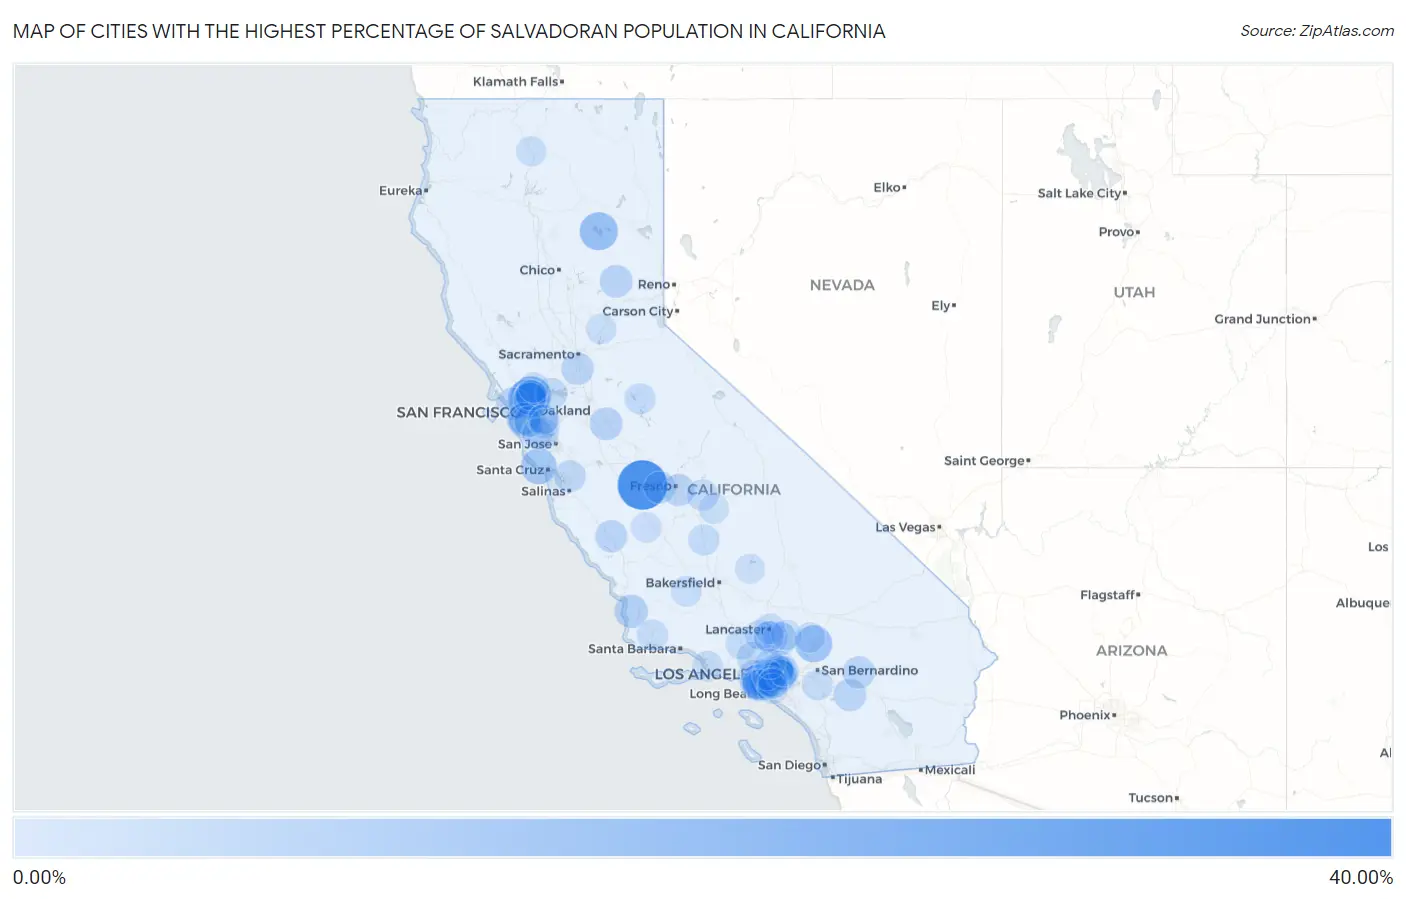
Map of Cities with the Highest Percentage of Salvadoran Population in California
0.00%
40.00%
Cities with the Highest Percentage of Salvadoran Population in California
| City | Salvadoran | vs State | vs National | |
| 1. | Mendota | 37.43% | 1.91%(+35.5)#1 | 0.72%(+36.7)#6 |
| 2. | Montalvin Manor | 19.86% | 1.91%(+18.0)#2 | 0.72%(+19.1)#43 |
| 3. | North Richmond | 18.24% | 1.91%(+16.3)#3 | 0.72%(+17.5)#55 |
| 4. | Lake Almanor Country Club | 16.64% | 1.91%(+14.7)#4 | 0.72%(+15.9)#65 |
| 5. | Vernon | 14.89% | 1.91%(+13.0)#5 | 0.72%(+14.2)#80 |
| 6. | Mountain View Acres | 14.69% | 1.91%(+12.8)#6 | 0.72%(+14.0)#82 |
| 7. | Rollingwood | 13.12% | 1.91%(+11.2)#7 | 0.72%(+12.4)#99 |
| 8. | Davenport | 12.77% | 1.91%(+10.9)#8 | 0.72%(+12.0)#104 |
| 9. | Westmont | 11.33% | 1.91%(+9.42)#9 | 0.72%(+10.6)#121 |
| 10. | Colma | 10.32% | 1.91%(+8.41)#10 | 0.72%(+9.60)#134 |
| 11. | Maywood | 9.08% | 1.91%(+7.17)#11 | 0.72%(+8.36)#162 |
| 12. | Florence Graham | 9.05% | 1.91%(+7.14)#12 | 0.72%(+8.32)#163 |
| 13. | Cudahy | 8.90% | 1.91%(+6.99)#13 | 0.72%(+8.18)#165 |
| 14. | Sun Village | 8.71% | 1.91%(+6.80)#14 | 0.72%(+7.99)#170 |
| 15. | Guadalupe | 8.53% | 1.91%(+6.63)#15 | 0.72%(+7.81)#172 |
| 16. | Palmdale | 8.12% | 1.91%(+6.21)#16 | 0.72%(+7.40)#183 |
| 17. | Huntington Park | 8.02% | 1.91%(+6.11)#17 | 0.72%(+7.30)#187 |
| 18. | Bell Gardens | 7.80% | 1.91%(+5.89)#18 | 0.72%(+7.08)#198 |
| 19. | Downieville | 7.62% | 1.91%(+5.71)#19 | 0.72%(+6.90)#204 |
| 20. | Rouse | 7.58% | 1.91%(+5.67)#20 | 0.72%(+6.86)#205 |
| 21. | Richmond | 7.42% | 1.91%(+5.51)#21 | 0.72%(+6.70)#208 |
| 22. | Bell | 7.32% | 1.91%(+5.41)#22 | 0.72%(+6.59)#211 |
| 23. | Stinson Beach | 7.28% | 1.91%(+5.37)#23 | 0.72%(+6.56)#215 |
| 24. | Idyllwild Pine Cove | 7.19% | 1.91%(+5.28)#24 | 0.72%(+6.47)#221 |
| 25. | Walnut Park | 7.12% | 1.91%(+5.21)#25 | 0.72%(+6.40)#224 |
| 26. | Hood | 7.01% | 1.91%(+5.10)#26 | 0.72%(+6.28)#229 |
| 27. | Los Angeles | 6.88% | 1.91%(+4.98)#27 | 0.72%(+6.16)#233 |
| 28. | Industry | 6.84% | 1.91%(+4.93)#28 | 0.72%(+6.12)#236 |
| 29. | San Ardo | 6.73% | 1.91%(+4.82)#29 | 0.72%(+6.01)#243 |
| 30. | Morongo Valley | 6.70% | 1.91%(+4.79)#30 | 0.72%(+5.98)#244 |
| 31. | Lynwood | 6.57% | 1.91%(+4.67)#31 | 0.72%(+5.85)#251 |
| 32. | Malaga | 6.51% | 1.91%(+4.60)#32 | 0.72%(+5.79)#254 |
| 33. | Kerman | 6.49% | 1.91%(+4.58)#33 | 0.72%(+5.77)#255 |
| 34. | West Rancho Dominguez | 6.42% | 1.91%(+4.51)#34 | 0.72%(+5.70)#256 |
| 35. | Lawndale | 6.31% | 1.91%(+4.40)#35 | 0.72%(+5.59)#262 |
| 36. | San Pablo | 6.28% | 1.91%(+4.37)#36 | 0.72%(+5.56)#263 |
| 37. | Tara Hills | 6.27% | 1.91%(+4.36)#37 | 0.72%(+5.55)#264 |
| 38. | San Bruno | 6.15% | 1.91%(+4.25)#38 | 0.72%(+5.43)#271 |
| 39. | Lennox | 6.08% | 1.91%(+4.17)#39 | 0.72%(+5.36)#277 |
| 40. | North El Monte | 6.08% | 1.91%(+4.17)#40 | 0.72%(+5.35)#278 |
| 41. | East Palo Alto | 6.04% | 1.91%(+4.14)#41 | 0.72%(+5.32)#279 |
| 42. | South Gate | 6.03% | 1.91%(+4.12)#42 | 0.72%(+5.31)#280 |
| 43. | Daly City | 5.70% | 1.91%(+3.79)#43 | 0.72%(+4.98)#291 |
| 44. | Aromas | 5.65% | 1.91%(+3.74)#44 | 0.72%(+4.93)#294 |
| 45. | Willowbrook | 5.61% | 1.91%(+3.70)#45 | 0.72%(+4.89)#295 |
| 46. | Commerce | 5.53% | 1.91%(+3.62)#46 | 0.72%(+4.80)#303 |
| 47. | Bay Point | 5.38% | 1.91%(+3.48)#47 | 0.72%(+4.66)#312 |
| 48. | South San Jose Hills | 5.38% | 1.91%(+3.47)#48 | 0.72%(+4.66)#313 |
| 49. | Orange Cove | 5.31% | 1.91%(+3.41)#49 | 0.72%(+4.59)#319 |
| 50. | Casa Loma | 5.17% | 1.91%(+3.26)#50 | 0.72%(+4.45)#330 |
| 51. | South San Francisco | 4.87% | 1.91%(+2.96)#51 | 0.72%(+4.15)#354 |
| 52. | Bayview Cdp Contra Costa County | 4.86% | 1.91%(+2.96)#52 | 0.72%(+4.14)#356 |
| 53. | Castaic | 4.86% | 1.91%(+2.95)#53 | 0.72%(+4.14)#357 |
| 54. | La Puente | 4.84% | 1.91%(+2.93)#54 | 0.72%(+4.12)#359 |
| 55. | San Fernando | 4.79% | 1.91%(+2.88)#55 | 0.72%(+4.07)#362 |
| 56. | Jamestown | 4.70% | 1.91%(+2.80)#56 | 0.72%(+3.98)#366 |
| 57. | Inglewood | 4.65% | 1.91%(+2.74)#57 | 0.72%(+3.93)#370 |
| 58. | Pixley | 4.59% | 1.91%(+2.68)#58 | 0.72%(+3.87)#379 |
| 59. | North Fair Oaks | 4.49% | 1.91%(+2.58)#59 | 0.72%(+3.77)#385 |
| 60. | Duarte | 4.43% | 1.91%(+2.52)#60 | 0.72%(+3.71)#394 |
| 61. | Benton Park | 4.39% | 1.91%(+2.48)#61 | 0.72%(+3.66)#396 |
| 62. | Buellton | 4.29% | 1.91%(+2.38)#62 | 0.72%(+3.57)#410 |
| 63. | Montebello | 4.22% | 1.91%(+2.31)#63 | 0.72%(+3.50)#418 |
| 64. | Channel Islands Beach | 4.10% | 1.91%(+2.19)#64 | 0.72%(+3.38)#432 |
| 65. | Derby Acres | 4.09% | 1.91%(+2.18)#65 | 0.72%(+3.36)#433 |
| 66. | South Monrovia Island | 4.08% | 1.91%(+2.18)#66 | 0.72%(+3.36)#434 |
| 67. | West Puente Valley | 4.04% | 1.91%(+2.13)#67 | 0.72%(+3.32)#439 |
| 68. | Paramount | 4.03% | 1.91%(+2.13)#68 | 0.72%(+3.31)#440 |
| 69. | Compton | 4.02% | 1.91%(+2.11)#69 | 0.72%(+3.30)#444 |
| 70. | March Arb | 4.00% | 1.91%(+2.09)#70 | 0.72%(+3.28)#446 |
| 71. | Leona Valley | 3.95% | 1.91%(+2.04)#71 | 0.72%(+3.23)#454 |
| 72. | Irwindale | 3.95% | 1.91%(+2.04)#72 | 0.72%(+3.22)#455 |
| 73. | Lancaster | 3.84% | 1.91%(+1.94)#73 | 0.72%(+3.12)#463 |
| 74. | Pinole | 3.82% | 1.91%(+1.91)#74 | 0.72%(+3.10)#468 |
| 75. | Lake Los Angeles | 3.74% | 1.91%(+1.83)#75 | 0.72%(+3.02)#478 |
| 76. | Desert View Highlands | 3.73% | 1.91%(+1.82)#76 | 0.72%(+3.00)#481 |
| 77. | Alondra Park | 3.72% | 1.91%(+1.81)#77 | 0.72%(+2.99)#483 |
| 78. | Coalinga | 3.71% | 1.91%(+1.80)#78 | 0.72%(+2.98)#484 |
| 79. | Gardena | 3.69% | 1.91%(+1.78)#79 | 0.72%(+2.96)#486 |
| 80. | Whitmore | 3.68% | 1.91%(+1.77)#80 | 0.72%(+2.95)#488 |
| 81. | Adelanto | 3.62% | 1.91%(+1.71)#81 | 0.72%(+2.90)#501 |
| 82. | Baldwin Park | 3.61% | 1.91%(+1.70)#82 | 0.72%(+2.89)#504 |
| 83. | Hawthorne | 3.58% | 1.91%(+1.67)#83 | 0.72%(+2.86)#511 |
| 84. | Pico Rivera | 3.51% | 1.91%(+1.60)#84 | 0.72%(+2.79)#524 |
| 85. | Cherryland | 3.49% | 1.91%(+1.58)#85 | 0.72%(+2.77)#528 |
| 86. | Valinda | 3.48% | 1.91%(+1.58)#86 | 0.72%(+2.76)#529 |
| 87. | Woodlake | 3.48% | 1.91%(+1.57)#87 | 0.72%(+2.76)#530 |
| 88. | North Auburn | 3.48% | 1.91%(+1.57)#88 | 0.72%(+2.76)#532 |
| 89. | Downey | 3.44% | 1.91%(+1.53)#89 | 0.72%(+2.71)#537 |
| 90. | Santa Fe Springs | 3.40% | 1.91%(+1.49)#90 | 0.72%(+2.68)#540 |
| 91. | East Los Angeles | 3.40% | 1.91%(+1.49)#91 | 0.72%(+2.68)#541 |
| 92. | Vallejo | 3.39% | 1.91%(+1.48)#92 | 0.72%(+2.67)#543 |
| 93. | Hawaiian Gardens | 3.38% | 1.91%(+1.47)#93 | 0.72%(+2.65)#548 |
| 94. | Mount Shasta | 3.37% | 1.91%(+1.46)#94 | 0.72%(+2.65)#551 |
| 95. | Covina | 3.23% | 1.91%(+1.32)#95 | 0.72%(+2.51)#566 |
| 96. | Altadena | 3.12% | 1.91%(+1.21)#96 | 0.72%(+2.40)#581 |
| 97. | San Lorenzo | 3.12% | 1.91%(+1.21)#97 | 0.72%(+2.39)#584 |
| 98. | Norwalk | 3.11% | 1.91%(+1.20)#98 | 0.72%(+2.39)#586 |
| 99. | Hayward | 3.10% | 1.91%(+1.19)#99 | 0.72%(+2.38)#589 |
| 100. | Bodfish | 3.06% | 1.91%(+1.15)#100 | 0.72%(+2.34)#604 |
Common Questions
What are the Top 10 Cities with the Highest Percentage of Salvadoran Population in California?
Top 10 Cities with the Highest Percentage of Salvadoran Population in California are:
#1
37.43%
#2
19.86%
#3
18.24%
#4
16.64%
#5
14.89%
#6
14.69%
#7
13.12%
#8
12.77%
#9
11.33%
#10
10.32%
What city has the Highest Percentage of Salvadoran Population in California?
Mendota has the Highest Percentage of Salvadoran Population in California with 37.43%.
What is the Percentage of Salvadoran Population in the State of California?
Percentage of Salvadoran Population in California is 1.91%.
What is the Percentage of Salvadoran Population in the United States?
Percentage of Salvadoran Population in the United States is 0.72%.