Cities with the Highest Percentage of Immigrants from Kenya in California
RELATED REPORTS & OPTIONS
Kenya
California
Compare Cities
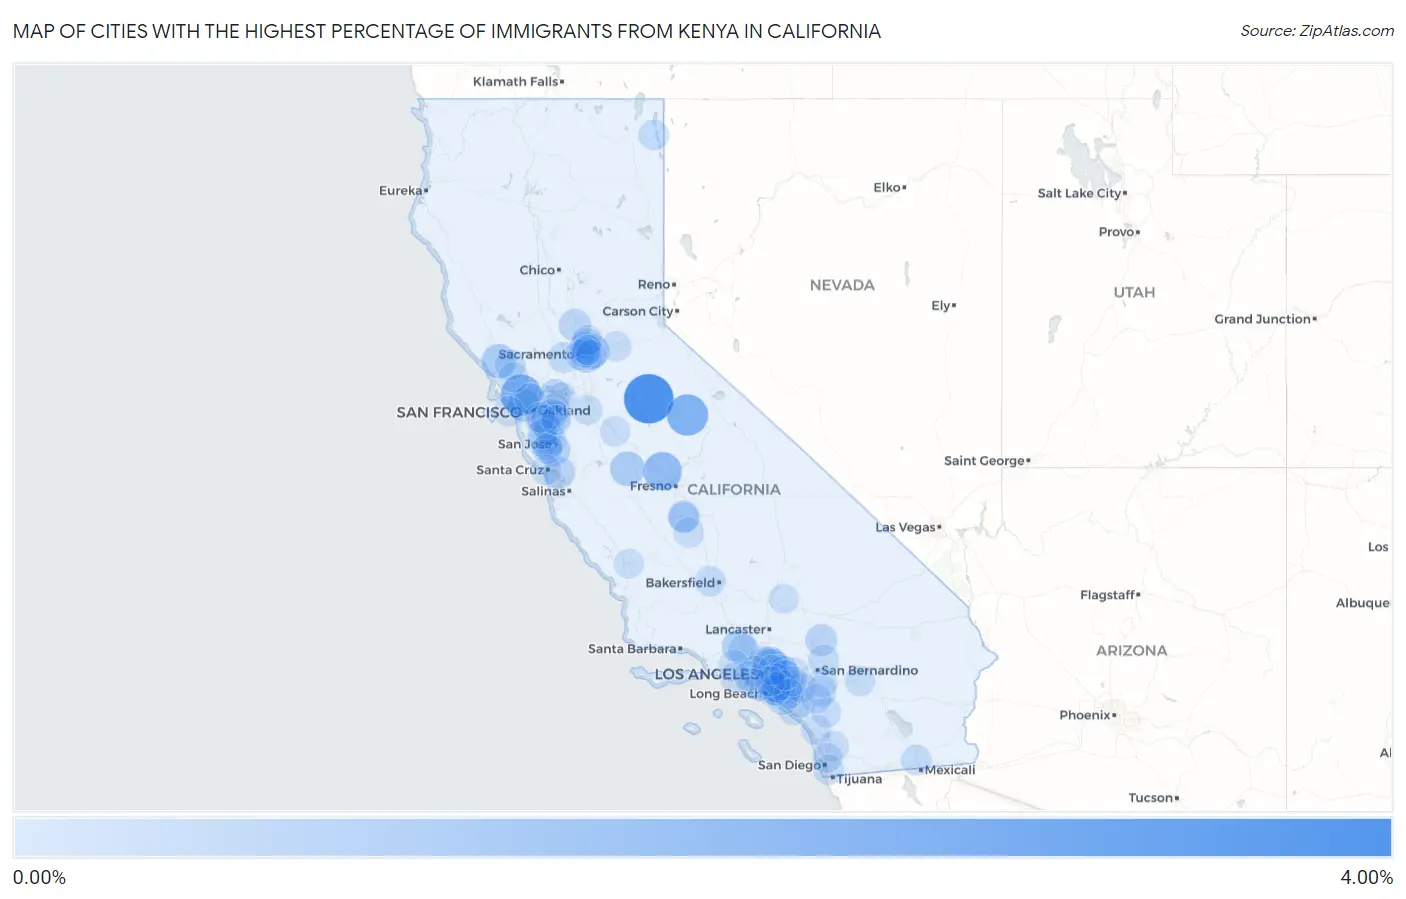
Map of Cities with the Highest Percentage of Immigrants from Kenya in California
0.00%
4.00%
Cities with the Highest Percentage of Immigrants from Kenya in California
| City | Kenya | vs State | vs National | |
| 1. | Tuolumne City | 3.01% | 0.032%(+2.98)#11 | 0.048%(+2.96)#353 |
| 2. | Yosemite Valley | 1.73% | 0.032%(+1.70)#36 | 0.048%(+1.68)#1,101 |
| 3. | Santa Venetia | 1.69% | 0.032%(+1.66)#40 | 0.048%(+1.64)#1,132 |
| 4. | Parksdale | 1.28% | 0.032%(+1.25)#63 | 0.048%(+1.23)#1,539 |
| 5. | San Pasqual | 1.03% | 0.032%(+1.00)#64 | 0.048%(+0.986)#1,540 |
| 6. | Baywood Park | 0.95% | 0.032%(+0.917)#106 | 0.048%(+0.901)#2,075 |
| 7. | Dos Palos | 0.71% | 0.032%(+0.681)#172 | 0.048%(+0.665)#2,667 |
| 8. | Forestville | 0.69% | 0.032%(+0.657)#173 | 0.048%(+0.640)#2,668 |
| 9. | Altadena | 0.64% | 0.032%(+0.607)#174 | 0.048%(+0.591)#2,669 |
| 10. | Gold River | 0.61% | 0.032%(+0.575)#175 | 0.048%(+0.559)#2,670 |
| 11. | Tiburon | 0.54% | 0.032%(+0.506)#176 | 0.048%(+0.490)#2,671 |
| 12. | Val Verde | 0.52% | 0.032%(+0.485)#236 | 0.048%(+0.469)#3,359 |
| 13. | Rosemont | 0.45% | 0.032%(+0.421)#237 | 0.048%(+0.405)#3,360 |
| 14. | El Sobrante Cdp Riverside County | 0.45% | 0.032%(+0.414)#238 | 0.048%(+0.397)#3,361 |
| 15. | Cambrian Park | 0.42% | 0.032%(+0.391)#239 | 0.048%(+0.375)#3,362 |
| 16. | La Palma | 0.39% | 0.032%(+0.361)#240 | 0.048%(+0.345)#3,363 |
| 17. | La Selva Beach | 0.34% | 0.032%(+0.313)#336 | 0.048%(+0.297)#4,215 |
| 18. | Plumas Lake | 0.34% | 0.032%(+0.306)#343 | 0.048%(+0.289)#4,269 |
| 19. | Apple Valley | 0.32% | 0.032%(+0.284)#354 | 0.048%(+0.268)#4,346 |
| 20. | Hanford | 0.31% | 0.032%(+0.277)#355 | 0.048%(+0.261)#4,347 |
| 21. | Pittsburg | 0.28% | 0.032%(+0.246)#356 | 0.048%(+0.230)#4,348 |
| 22. | North Highlands | 0.27% | 0.032%(+0.234)#357 | 0.048%(+0.218)#4,349 |
| 23. | Pepperdine University | 0.26% | 0.032%(+0.224)#358 | 0.048%(+0.207)#4,350 |
| 24. | Anaheim | 0.20% | 0.032%(+0.171)#359 | 0.048%(+0.155)#4,351 |
| 25. | Stevenson Ranch | 0.20% | 0.032%(+0.168)#360 | 0.048%(+0.152)#4,352 |
| 26. | University Of California Davis | 0.18% | 0.032%(+0.151)#361 | 0.048%(+0.134)#4,353 |
| 27. | Santa Rosa | 0.18% | 0.032%(+0.150)#362 | 0.048%(+0.134)#4,354 |
| 28. | Richmond | 0.18% | 0.032%(+0.148)#363 | 0.048%(+0.132)#4,355 |
| 29. | Los Altos Hills | 0.18% | 0.032%(+0.146)#364 | 0.048%(+0.130)#4,356 |
| 30. | La Crescenta Montrose | 0.17% | 0.032%(+0.142)#365 | 0.048%(+0.126)#4,357 |
| 31. | Santa Clara | 0.17% | 0.032%(+0.142)#366 | 0.048%(+0.125)#4,358 |
| 32. | Lake Arrowhead | 0.16% | 0.032%(+0.125)#461 | 0.048%(+0.109)#5,646 |
| 33. | Castro Valley | 0.15% | 0.032%(+0.123)#462 | 0.048%(+0.106)#5,647 |
| 34. | Perris | 0.15% | 0.032%(+0.117)#463 | 0.048%(+0.100)#5,648 |
| 35. | Vincent | 0.14% | 0.032%(+0.112)#473 | 0.048%(+0.096)#5,744 |
| 36. | El Centro | 0.14% | 0.032%(+0.111)#474 | 0.048%(+0.095)#5,745 |
| 37. | Yorba Linda | 0.14% | 0.032%(+0.105)#475 | 0.048%(+0.089)#5,746 |
| 38. | Rosedale | 0.14% | 0.032%(+0.104)#476 | 0.048%(+0.088)#5,747 |
| 39. | Home Garden | 0.13% | 0.032%(+0.101)#481 | 0.048%(+0.084)#5,846 |
| 40. | Cedarville | 0.13% | 0.032%(+0.096)#482 | 0.048%(+0.080)#5,890 |
| 41. | Dublin | 0.12% | 0.032%(+0.091)#483 | 0.048%(+0.075)#5,891 |
| 42. | Laguna Niguel | 0.12% | 0.032%(+0.088)#484 | 0.048%(+0.072)#5,892 |
| 43. | Rossmoor | 0.12% | 0.032%(+0.087)#485 | 0.048%(+0.071)#5,893 |
| 44. | Cerritos | 0.12% | 0.032%(+0.087)#486 | 0.048%(+0.070)#5,894 |
| 45. | Desert Hot Springs | 0.12% | 0.032%(+0.086)#494 | 0.048%(+0.069)#5,976 |
| 46. | Beverly Hills | 0.12% | 0.032%(+0.085)#495 | 0.048%(+0.069)#5,977 |
| 47. | Oak Park | 0.11% | 0.032%(+0.078)#496 | 0.048%(+0.062)#5,978 |
| 48. | Cupertino | 0.11% | 0.032%(+0.074)#497 | 0.048%(+0.058)#5,979 |
| 49. | Antelope | 0.10% | 0.032%(+0.073)#498 | 0.048%(+0.057)#5,980 |
| 50. | San Miguel Cdp Contra Costa County | 0.100% | 0.032%(+0.068)#506 | 0.048%(+0.052)#6,130 |
| 51. | El Segundo | 0.100% | 0.032%(+0.068)#507 | 0.048%(+0.052)#6,131 |
| 52. | Stanton | 0.099% | 0.032%(+0.068)#508 | 0.048%(+0.051)#6,132 |
| 53. | Sacramento | 0.099% | 0.032%(+0.067)#509 | 0.048%(+0.051)#6,133 |
| 54. | Diamond Springs | 0.098% | 0.032%(+0.067)#510 | 0.048%(+0.050)#6,134 |
| 55. | Roseville | 0.097% | 0.032%(+0.065)#511 | 0.048%(+0.049)#6,135 |
| 56. | Petaluma | 0.096% | 0.032%(+0.064)#512 | 0.048%(+0.048)#6,136 |
| 57. | Montclair | 0.092% | 0.032%(+0.061)#513 | 0.048%(+0.045)#6,137 |
| 58. | Corcoran | 0.092% | 0.032%(+0.060)#514 | 0.048%(+0.044)#6,138 |
| 59. | Gardena | 0.091% | 0.032%(+0.059)#515 | 0.048%(+0.043)#6,139 |
| 60. | Rancho Santa Margarita | 0.090% | 0.032%(+0.058)#516 | 0.048%(+0.042)#6,140 |
| 61. | Blackhawk | 0.085% | 0.032%(+0.053)#517 | 0.048%(+0.037)#6,141 |
| 62. | Malibu | 0.084% | 0.032%(+0.052)#518 | 0.048%(+0.036)#6,142 |
| 63. | Poway | 0.082% | 0.032%(+0.050)#519 | 0.048%(+0.034)#6,143 |
| 64. | Rancho Cordova | 0.081% | 0.032%(+0.049)#520 | 0.048%(+0.033)#6,144 |
| 65. | Covina | 0.081% | 0.032%(+0.049)#521 | 0.048%(+0.033)#6,145 |
| 66. | National City | 0.078% | 0.032%(+0.046)#522 | 0.048%(+0.030)#6,146 |
| 67. | Costa Mesa | 0.075% | 0.032%(+0.044)#523 | 0.048%(+0.027)#6,147 |
| 68. | Corona | 0.075% | 0.032%(+0.043)#524 | 0.048%(+0.027)#6,148 |
| 69. | Cypress | 0.072% | 0.032%(+0.040)#525 | 0.048%(+0.024)#6,149 |
| 70. | Arden Arcade | 0.071% | 0.032%(+0.039)#526 | 0.048%(+0.023)#6,150 |
| 71. | San Lorenzo | 0.071% | 0.032%(+0.039)#527 | 0.048%(+0.023)#6,151 |
| 72. | Fremont | 0.069% | 0.032%(+0.037)#528 | 0.048%(+0.021)#6,152 |
| 73. | Whittier | 0.068% | 0.032%(+0.036)#529 | 0.048%(+0.020)#6,153 |
| 74. | Lathrop | 0.067% | 0.032%(+0.036)#530 | 0.048%(+0.020)#6,154 |
| 75. | Oceanside | 0.067% | 0.032%(+0.036)#531 | 0.048%(+0.019)#6,155 |
| 76. | Antioch | 0.067% | 0.032%(+0.035)#532 | 0.048%(+0.019)#6,156 |
| 77. | Santa Cruz | 0.065% | 0.032%(+0.033)#533 | 0.048%(+0.017)#6,157 |
| 78. | Moreno Valley | 0.065% | 0.032%(+0.033)#534 | 0.048%(+0.017)#6,158 |
| 79. | Fullerton | 0.065% | 0.032%(+0.033)#535 | 0.048%(+0.017)#6,159 |
| 80. | Chino Hills | 0.064% | 0.032%(+0.032)#536 | 0.048%(+0.016)#6,160 |
| 81. | North Tustin | 0.064% | 0.032%(+0.032)#537 | 0.048%(+0.016)#6,161 |
| 82. | Hayward | 0.059% | 0.032%(+0.027)#538 | 0.048%(+0.011)#6,162 |
| 83. | San Ramon | 0.058% | 0.032%(+0.026)#539 | 0.048%(+0.010)#6,163 |
| 84. | Turlock | 0.058% | 0.032%(+0.026)#540 | 0.048%(+0.010)#6,164 |
| 85. | San Francisco | 0.058% | 0.032%(+0.026)#541 | 0.048%(+0.010)#6,165 |
| 86. | East Palo Alto | 0.058% | 0.032%(+0.026)#542 | 0.048%(+0.010)#6,166 |
| 87. | East San Gabriel | 0.057% | 0.032%(+0.026)#543 | 0.048%(+0.009)#6,167 |
| 88. | Temecula | 0.057% | 0.032%(+0.025)#544 | 0.048%(+0.009)#6,168 |
| 89. | Lake Elsinore | 0.056% | 0.032%(+0.024)#545 | 0.048%(+0.008)#6,169 |
| 90. | Buena Park | 0.055% | 0.032%(+0.023)#546 | 0.048%(+0.007)#6,170 |
| 91. | Downey | 0.054% | 0.032%(+0.022)#547 | 0.048%(+0.006)#6,171 |
| 92. | California City | 0.053% | 0.032%(+0.022)#548 | 0.048%(+0.005)#6,491 |
| 93. | Walnut | 0.053% | 0.032%(+0.021)#549 | 0.048%(+0.005)#6,492 |
| 94. | San Leandro | 0.052% | 0.032%(+0.021)#550 | 0.048%(+0.004)#6,493 |
| 95. | Santa Monica | 0.052% | 0.032%(+0.020)#551 | 0.048%(+0.004)#6,494 |
| 96. | Saratoga | 0.052% | 0.032%(+0.020)#552 | 0.048%(+0.004)#6,495 |
| 97. | San Diego | 0.051% | 0.032%(+0.020)#553 | 0.048%(+0.003)#6,496 |
| 98. | Carmichael | 0.049% | 0.032%(+0.017)#554 | 0.048%(+0.001)#6,497 |
| 99. | Pleasanton | 0.048% | 0.032%(+0.017)#555 | 0.048%(+0.000)#6,498 |
| 100. | El Paso De Robles Paso Robles | 0.047% | 0.032%(+0.016)#556 | 0.048%(-0.000)#6,499 |
Common Questions
What are the Top 10 Cities with the Highest Percentage of Immigrants from Kenya in California?
Top 10 Cities with the Highest Percentage of Immigrants from Kenya in California are:
#1
3.01%
#2
1.73%
#3
1.69%
#4
1.28%
#5
1.03%
#6
0.71%
#7
0.69%
#8
0.64%
#9
0.61%
#10
0.54%
What city has the Highest Percentage of Immigrants from Kenya in California?
Tuolumne City has the Highest Percentage of Immigrants from Kenya in California with 3.01%.
What is the Percentage of Immigrants from Kenya in the State of California?
Percentage of Immigrants from Kenya in California is 0.032%.
What is the Percentage of Immigrants from Kenya in the United States?
Percentage of Immigrants from Kenya in the United States is 0.048%.