Cities with the Highest Percentage of Mexican Population in California
RELATED REPORTS & OPTIONS
Mexican
California
Compare Cities
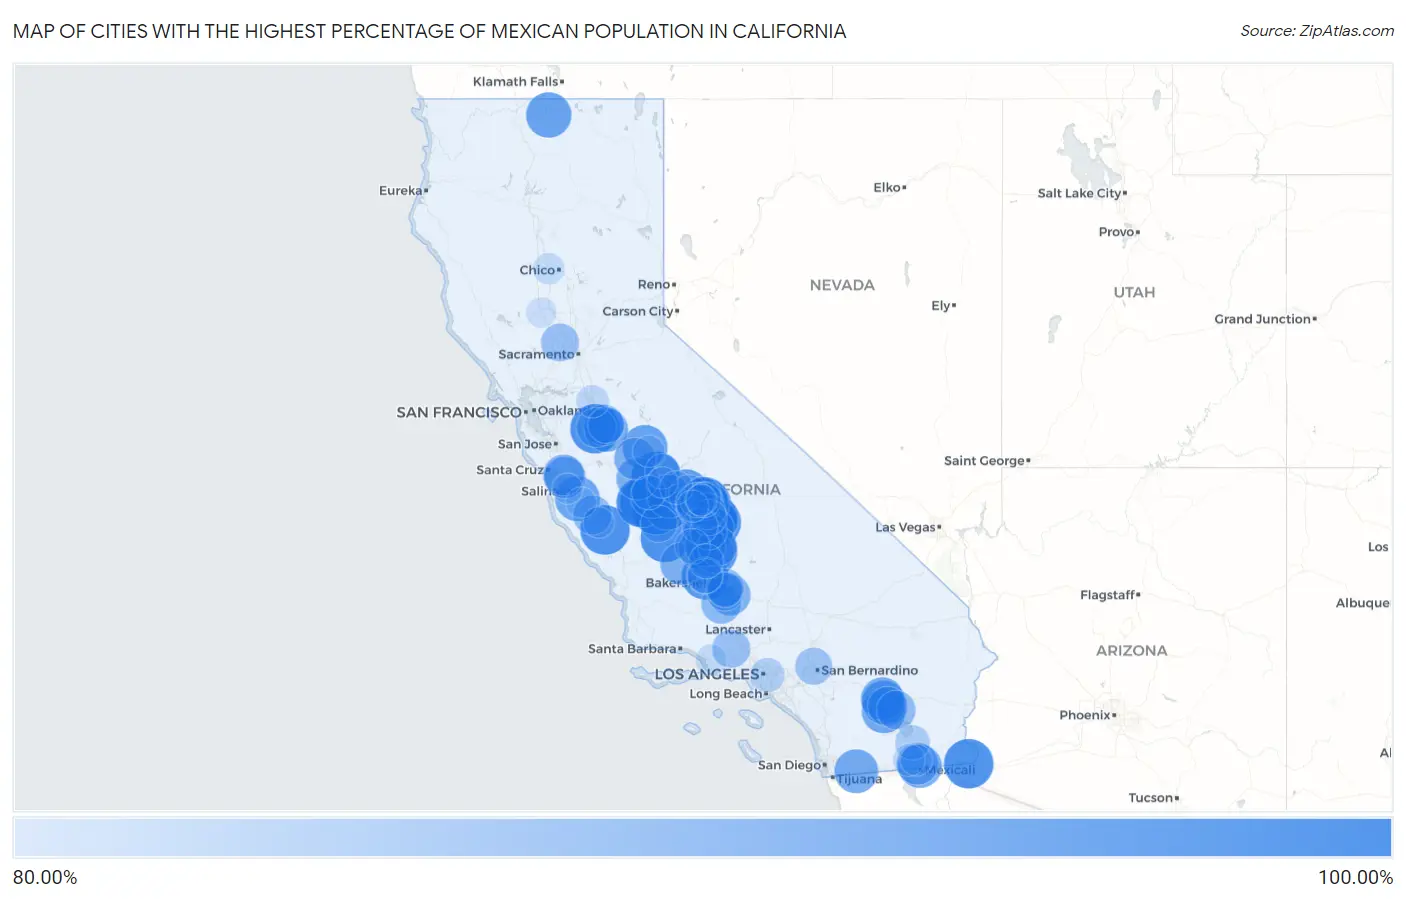
Map of Cities with the Highest Percentage of Mexican Population in California
0.00%
100.00%
Cities with the Highest Percentage of Mexican Population in California
| City | Mexican | vs State | vs National | |
| 1. | Kettleman City | 100.00% | 32.29%(+67.7)#1 | 11.22%(+88.8)#8 |
| 2. | La Vina | 100.00% | 32.29%(+67.7)#2 | 11.22%(+88.8)#11 |
| 3. | Linnell Camp | 100.00% | 32.29%(+67.7)#3 | 11.22%(+88.8)#17 |
| 4. | Westley | 100.00% | 32.29%(+67.7)#4 | 11.22%(+88.8)#21 |
| 5. | Cantua Creek | 100.00% | 32.29%(+67.7)#5 | 11.22%(+88.8)#29 |
| 6. | Woodville Farm Labor Camp | 100.00% | 32.29%(+67.7)#6 | 11.22%(+88.8)#36 |
| 7. | San Lucas | 100.00% | 32.29%(+67.7)#7 | 11.22%(+88.8)#39 |
| 8. | Westside | 100.00% | 32.29%(+67.7)#8 | 11.22%(+88.8)#70 |
| 9. | Three Rocks | 100.00% | 32.29%(+67.7)#9 | 11.22%(+88.8)#73 |
| 10. | Monson | 100.00% | 32.29%(+67.7)#10 | 11.22%(+88.8)#80 |
| 11. | El Monte Mobile | 100.00% | 32.29%(+67.7)#11 | 11.22%(+88.8)#87 |
| 12. | Yettem | 100.00% | 32.29%(+67.7)#12 | 11.22%(+88.8)#92 |
| 13. | Old River | 100.00% | 32.29%(+67.7)#13 | 11.22%(+88.8)#93 |
| 14. | El Rancho | 100.00% | 32.29%(+67.7)#14 | 11.22%(+88.8)#116 |
| 15. | Winterhaven | 100.00% | 32.29%(+67.7)#15 | 11.22%(+88.8)#123 |
| 16. | Rodriguez Camp | 100.00% | 32.29%(+67.7)#16 | 11.22%(+88.8)#124 |
| 17. | Tooleville | 100.00% | 32.29%(+67.7)#17 | 11.22%(+88.8)#125 |
| 18. | Jovista | 100.00% | 32.29%(+67.7)#18 | 11.22%(+88.8)#131 |
| 19. | Hypericum | 99.03% | 32.29%(+66.7)#19 | 11.22%(+87.8)#166 |
| 20. | Di Giorgio | 98.41% | 32.29%(+66.1)#20 | 11.22%(+87.2)#177 |
| 21. | Mexican Colony | 97.68% | 32.29%(+65.4)#21 | 11.22%(+86.5)#187 |
| 22. | Del Rey | 97.18% | 32.29%(+64.9)#22 | 11.22%(+86.0)#192 |
| 23. | East Orosi | 96.92% | 32.29%(+64.6)#23 | 11.22%(+85.7)#194 |
| 24. | Tonyville | 96.50% | 32.29%(+64.2)#24 | 11.22%(+85.3)#199 |
| 25. | Mount Hebron | 96.46% | 32.29%(+64.2)#25 | 11.22%(+85.2)#202 |
| 26. | Planada | 96.11% | 32.29%(+63.8)#26 | 11.22%(+84.9)#210 |
| 27. | Lanare | 96.02% | 32.29%(+63.7)#27 | 11.22%(+84.8)#211 |
| 28. | Chualar | 95.93% | 32.29%(+63.6)#28 | 11.22%(+84.7)#215 |
| 29. | Oasis | 95.31% | 32.29%(+63.0)#29 | 11.22%(+84.1)#223 |
| 30. | Potrero | 95.09% | 32.29%(+62.8)#30 | 11.22%(+83.9)#229 |
| 31. | Thermal | 95.04% | 32.29%(+62.8)#31 | 11.22%(+83.8)#230 |
| 32. | San Joaquin | 95.01% | 32.29%(+62.7)#32 | 11.22%(+83.8)#231 |
| 33. | Monterey Park Tract | 94.93% | 32.29%(+62.6)#33 | 11.22%(+83.7)#234 |
| 34. | Seville | 94.89% | 32.29%(+62.6)#34 | 11.22%(+83.7)#235 |
| 35. | Calexico | 94.77% | 32.29%(+62.5)#35 | 11.22%(+83.6)#237 |
| 36. | Raisin City | 94.76% | 32.29%(+62.5)#36 | 11.22%(+83.5)#238 |
| 37. | Plainview | 94.44% | 32.29%(+62.2)#37 | 11.22%(+83.2)#247 |
| 38. | Coachella | 94.26% | 32.29%(+62.0)#38 | 11.22%(+83.0)#252 |
| 39. | Firebaugh | 93.73% | 32.29%(+61.4)#39 | 11.22%(+82.5)#259 |
| 40. | Lost Hills | 93.67% | 32.29%(+61.4)#40 | 11.22%(+82.5)#260 |
| 41. | Heber | 93.27% | 32.29%(+61.0)#41 | 11.22%(+82.1)#270 |
| 42. | El Nido | 93.25% | 32.29%(+61.0)#42 | 11.22%(+82.0)#271 |
| 43. | Las Lomas | 93.10% | 32.29%(+60.8)#43 | 11.22%(+81.9)#273 |
| 44. | Pumpkin Center | 93.02% | 32.29%(+60.7)#44 | 11.22%(+81.8)#275 |
| 45. | Arvin | 92.79% | 32.29%(+60.5)#45 | 11.22%(+81.6)#280 |
| 46. | Pajaro | 92.66% | 32.29%(+60.4)#46 | 11.22%(+81.4)#284 |
| 47. | Riverdale Park | 92.45% | 32.29%(+60.2)#47 | 11.22%(+81.2)#290 |
| 48. | Tipton | 92.43% | 32.29%(+60.1)#48 | 11.22%(+81.2)#291 |
| 49. | Allensworth | 92.37% | 32.29%(+60.1)#49 | 11.22%(+81.2)#292 |
| 50. | Richgrove | 92.32% | 32.29%(+60.0)#50 | 11.22%(+81.1)#293 |
| 51. | Earlimart | 92.31% | 32.29%(+60.0)#51 | 11.22%(+81.1)#294 |
| 52. | Mettler | 91.80% | 32.29%(+59.5)#52 | 11.22%(+80.6)#303 |
| 53. | Parlier | 91.62% | 32.29%(+59.3)#53 | 11.22%(+80.4)#307 |
| 54. | Grayson | 91.27% | 32.29%(+59.0)#54 | 11.22%(+80.1)#311 |
| 55. | Mecca | 91.24% | 32.29%(+58.9)#55 | 11.22%(+80.0)#312 |
| 56. | Ducor | 91.16% | 32.29%(+58.9)#56 | 11.22%(+79.9)#314 |
| 57. | Greenfield | 91.09% | 32.29%(+58.8)#57 | 11.22%(+79.9)#315 |
| 58. | London | 91.09% | 32.29%(+58.8)#58 | 11.22%(+79.9)#316 |
| 59. | North Shore | 90.80% | 32.29%(+58.5)#59 | 11.22%(+79.6)#320 |
| 60. | Cutler | 90.77% | 32.29%(+58.5)#60 | 11.22%(+79.5)#321 |
| 61. | Weedpatch | 90.67% | 32.29%(+58.4)#61 | 11.22%(+79.5)#322 |
| 62. | Piru | 90.10% | 32.29%(+57.8)#62 | 11.22%(+78.9)#332 |
| 63. | Fuller Acres | 90.10% | 32.29%(+57.8)#63 | 11.22%(+78.9)#333 |
| 64. | Yolo | 90.04% | 32.29%(+57.7)#64 | 11.22%(+78.8)#334 |
| 65. | Delft Colony | 89.79% | 32.29%(+57.5)#65 | 11.22%(+78.6)#338 |
| 66. | Muscoy | 89.37% | 32.29%(+57.1)#66 | 11.22%(+78.2)#342 |
| 67. | Woodville | 89.02% | 32.29%(+56.7)#67 | 11.22%(+77.8)#353 |
| 68. | Orange Cove | 88.87% | 32.29%(+56.6)#68 | 11.22%(+77.7)#358 |
| 69. | Huron | 88.85% | 32.29%(+56.6)#69 | 11.22%(+77.6)#359 |
| 70. | Bret Harte | 88.53% | 32.29%(+56.2)#70 | 11.22%(+77.3)#367 |
| 71. | Ivanhoe | 88.47% | 32.29%(+56.2)#71 | 11.22%(+77.3)#368 |
| 72. | Smith Corner | 88.29% | 32.29%(+56.0)#72 | 11.22%(+77.1)#371 |
| 73. | Farmersville | 88.26% | 32.29%(+56.0)#73 | 11.22%(+77.0)#372 |
| 74. | Matheny | 87.99% | 32.29%(+55.7)#74 | 11.22%(+76.8)#376 |
| 75. | Lamont | 87.63% | 32.29%(+55.3)#75 | 11.22%(+76.4)#379 |
| 76. | Alpaugh | 87.61% | 32.29%(+55.3)#76 | 11.22%(+76.4)#380 |
| 77. | Westmorland | 87.41% | 32.29%(+55.1)#77 | 11.22%(+76.2)#385 |
| 78. | Dinuba | 87.37% | 32.29%(+55.1)#78 | 11.22%(+76.2)#386 |
| 79. | Cherokee Strip | 87.28% | 32.29%(+55.0)#79 | 11.22%(+76.1)#388 |
| 80. | Orosi | 87.16% | 32.29%(+54.9)#80 | 11.22%(+75.9)#390 |
| 81. | Parksdale | 87.12% | 32.29%(+54.8)#81 | 11.22%(+75.9)#391 |
| 82. | Mcfarland | 87.02% | 32.29%(+54.7)#82 | 11.22%(+75.8)#393 |
| 83. | East Los Angeles | 86.87% | 32.29%(+54.6)#83 | 11.22%(+75.6)#395 |
| 84. | Tranquillity | 86.64% | 32.29%(+54.4)#84 | 11.22%(+75.4)#400 |
| 85. | Calwa | 85.76% | 32.29%(+53.5)#85 | 11.22%(+74.5)#410 |
| 86. | Kennedy | 85.57% | 32.29%(+53.3)#86 | 11.22%(+74.4)#412 |
| 87. | Potomac Park | 85.26% | 32.29%(+53.0)#87 | 11.22%(+74.0)#416 |
| 88. | Seeley | 84.97% | 32.29%(+52.7)#88 | 11.22%(+73.7)#419 |
| 89. | Hamilton City | 84.71% | 32.29%(+52.4)#89 | 11.22%(+73.5)#422 |
| 90. | Le Grand | 84.69% | 32.29%(+52.4)#90 | 11.22%(+73.5)#423 |
| 91. | Traver | 84.54% | 32.29%(+52.3)#91 | 11.22%(+73.3)#425 |
| 92. | El Rio | 84.53% | 32.29%(+52.2)#92 | 11.22%(+73.3)#426 |
| 93. | El Centro | 84.49% | 32.29%(+52.2)#93 | 11.22%(+73.3)#429 |
| 94. | Sultana | 84.18% | 32.29%(+51.9)#94 | 11.22%(+73.0)#434 |
| 95. | Biola | 83.90% | 32.29%(+51.6)#95 | 11.22%(+72.7)#438 |
| 96. | King City | 83.82% | 32.29%(+51.5)#96 | 11.22%(+72.6)#439 |
| 97. | Williams | 83.77% | 32.29%(+51.5)#97 | 11.22%(+72.6)#441 |
| 98. | El Adobe | 83.75% | 32.29%(+51.5)#98 | 11.22%(+72.5)#442 |
| 99. | Gonzales | 83.61% | 32.29%(+51.3)#99 | 11.22%(+72.4)#444 |
| 100. | Boronda | 83.61% | 32.29%(+51.3)#100 | 11.22%(+72.4)#445 |
Common Questions
What are the Top 10 Cities with the Highest Percentage of Mexican Population in California?
Top 10 Cities with the Highest Percentage of Mexican Population in California are:
#1
100.00%
#2
100.00%
#3
100.00%
#4
100.00%
#5
100.00%
#6
100.00%
#7
100.00%
#8
100.00%
#9
100.00%
#10
100.00%
What city has the Highest Percentage of Mexican Population in California?
Kettleman City has the Highest Percentage of Mexican Population in California with 100.00%.
What is the Percentage of Mexican Population in the State of California?
Percentage of Mexican Population in California is 32.29%.
What is the Percentage of Mexican Population in the United States?
Percentage of Mexican Population in the United States is 11.22%.