Cities with the Highest Percentage of Immigrants from Hong Kong in California
RELATED REPORTS & OPTIONS
Hong Kong
California
Compare Cities
Map of Cities with the Highest Percentage of Immigrants from Hong Kong in California
0.00%
6.00%
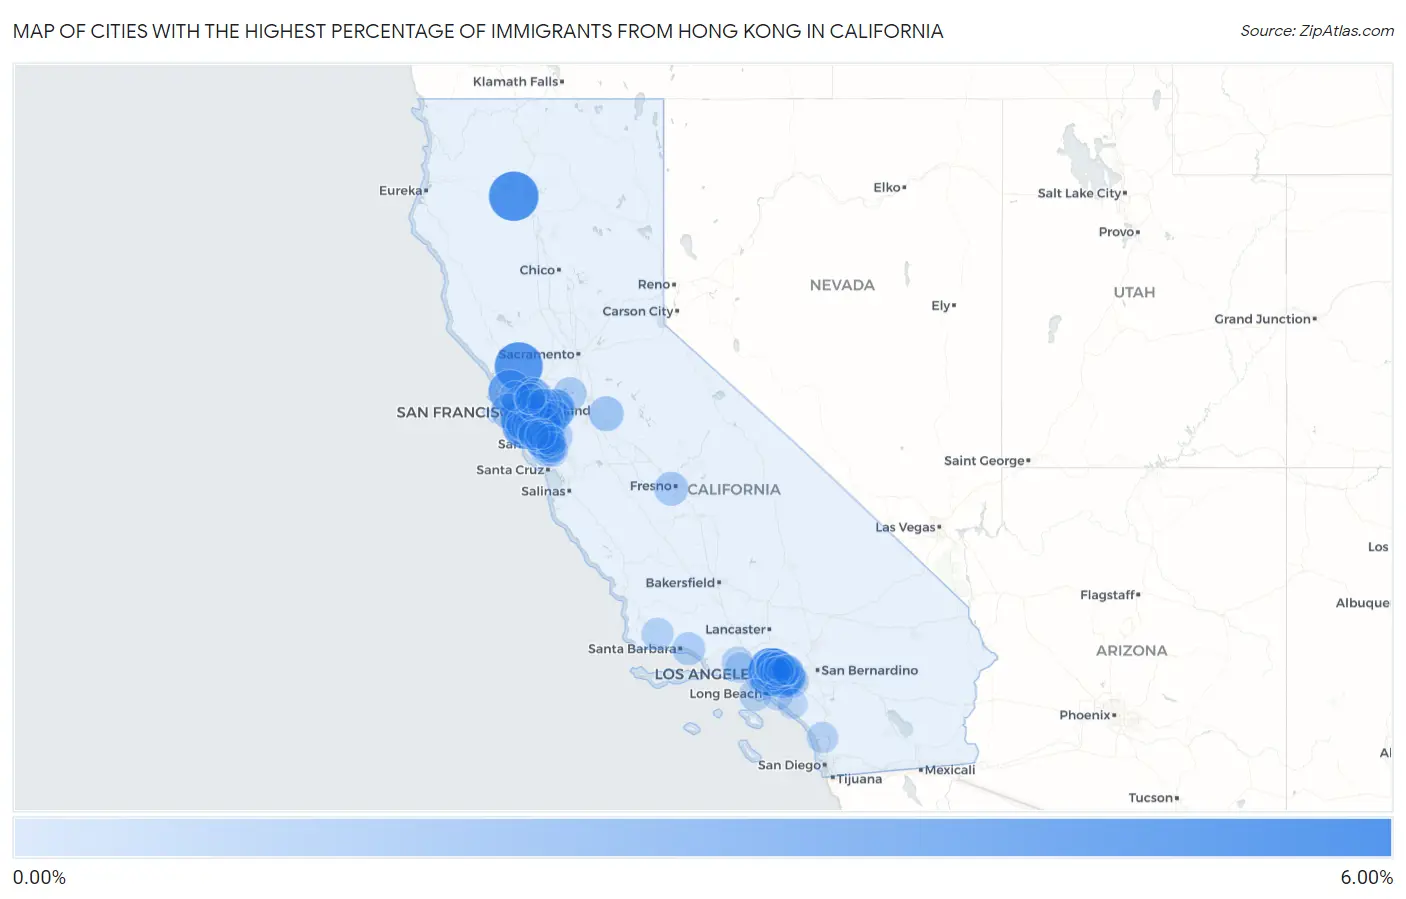
Cities with the Highest Percentage of Immigrants from Hong Kong in California
| City | Hong Kong | vs State | vs National | |
| 1. | French Gulch | 5.30% | 0.27%(+5.03)#1 | 0.072%(+5.23)#4 |
| 2. | Millbrae | 4.98% | 0.27%(+4.71)#2 | 0.072%(+4.90)#5 |
| 3. | Kenwood | 4.93% | 0.27%(+4.66)#3 | 0.072%(+4.85)#6 |
| 4. | East San Gabriel | 4.05% | 0.27%(+3.78)#4 | 0.072%(+3.98)#9 |
| 5. | Monterey Park | 4.00% | 0.27%(+3.73)#5 | 0.072%(+3.92)#10 |
| 6. | Broadmoor | 3.76% | 0.27%(+3.49)#6 | 0.072%(+3.68)#12 |
| 7. | Nicasio | 3.61% | 0.27%(+3.35)#7 | 0.072%(+3.54)#13 |
| 8. | San Marino | 3.30% | 0.27%(+3.03)#8 | 0.072%(+3.22)#14 |
| 9. | Arcadia | 3.03% | 0.27%(+2.76)#9 | 0.072%(+2.96)#16 |
| 10. | Alhambra | 2.93% | 0.27%(+2.67)#10 | 0.072%(+2.86)#17 |
| 11. | Daly City | 2.93% | 0.27%(+2.66)#11 | 0.072%(+2.86)#18 |
| 12. | Walnut | 2.78% | 0.27%(+2.51)#12 | 0.072%(+2.70)#22 |
| 13. | Blackhawk | 2.74% | 0.27%(+2.47)#13 | 0.072%(+2.67)#23 |
| 14. | Rowland Heights | 2.52% | 0.27%(+2.26)#14 | 0.072%(+2.45)#27 |
| 15. | San Gabriel | 2.43% | 0.27%(+2.17)#15 | 0.072%(+2.36)#28 |
| 16. | Temple City | 2.38% | 0.27%(+2.11)#16 | 0.072%(+2.31)#29 |
| 17. | Marin City | 2.25% | 0.27%(+1.98)#17 | 0.072%(+2.18)#31 |
| 18. | San Bruno | 2.24% | 0.27%(+1.98)#18 | 0.072%(+2.17)#32 |
| 19. | South San Francisco | 2.14% | 0.27%(+1.87)#19 | 0.072%(+2.07)#33 |
| 20. | North El Monte | 2.11% | 0.27%(+1.84)#20 | 0.072%(+2.04)#34 |
| 21. | Camino Tassajara | 1.97% | 0.27%(+1.70)#21 | 0.072%(+1.90)#38 |
| 22. | Diamond Bar | 1.93% | 0.27%(+1.66)#22 | 0.072%(+1.85)#39 |
| 23. | South San Gabriel | 1.86% | 0.27%(+1.59)#23 | 0.072%(+1.79)#43 |
| 24. | Saratoga | 1.86% | 0.27%(+1.59)#24 | 0.072%(+1.79)#44 |
| 25. | Pinole | 1.84% | 0.27%(+1.57)#25 | 0.072%(+1.76)#45 |
| 26. | Sierra Madre | 1.82% | 0.27%(+1.55)#26 | 0.072%(+1.75)#46 |
| 27. | Los Altos Hills | 1.81% | 0.27%(+1.55)#27 | 0.072%(+1.74)#47 |
| 28. | Cupertino | 1.81% | 0.27%(+1.54)#28 | 0.072%(+1.74)#48 |
| 29. | Los Altos | 1.81% | 0.27%(+1.54)#29 | 0.072%(+1.74)#49 |
| 30. | San Francisco | 1.79% | 0.27%(+1.52)#30 | 0.072%(+1.71)#51 |
| 31. | Rosemead | 1.75% | 0.27%(+1.48)#31 | 0.072%(+1.67)#52 |
| 32. | Hillsborough | 1.68% | 0.27%(+1.41)#32 | 0.072%(+1.61)#58 |
| 33. | Del Rio | 1.66% | 0.27%(+1.39)#33 | 0.072%(+1.59)#61 |
| 34. | Foster City | 1.64% | 0.27%(+1.37)#34 | 0.072%(+1.57)#62 |
| 35. | Burlingame | 1.56% | 0.27%(+1.30)#35 | 0.072%(+1.49)#65 |
| 36. | Hacienda Heights | 1.55% | 0.27%(+1.29)#36 | 0.072%(+1.48)#66 |
| 37. | Alameda | 1.53% | 0.27%(+1.26)#37 | 0.072%(+1.46)#70 |
| 38. | San Leandro | 1.53% | 0.27%(+1.26)#38 | 0.072%(+1.45)#71 |
| 39. | Atherton | 1.43% | 0.27%(+1.16)#39 | 0.072%(+1.36)#73 |
| 40. | Highlands | 1.43% | 0.27%(+1.16)#40 | 0.072%(+1.36)#74 |
| 41. | Union City | 1.41% | 0.27%(+1.14)#41 | 0.072%(+1.34)#77 |
| 42. | San Lorenzo | 1.40% | 0.27%(+1.13)#42 | 0.072%(+1.33)#78 |
| 43. | West Park | 1.39% | 0.27%(+1.13)#43 | 0.072%(+1.32)#79 |
| 44. | South Pasadena | 1.38% | 0.27%(+1.12)#44 | 0.072%(+1.31)#80 |
| 45. | East Pasadena | 1.30% | 0.27%(+1.03)#45 | 0.072%(+1.22)#91 |
| 46. | Fremont | 1.29% | 0.27%(+1.02)#46 | 0.072%(+1.22)#93 |
| 47. | Brisbane | 1.28% | 0.27%(+1.02)#47 | 0.072%(+1.21)#94 |
| 48. | San Ramon | 1.26% | 0.27%(+0.994)#48 | 0.072%(+1.19)#95 |
| 49. | Palo Alto | 1.21% | 0.27%(+0.939)#49 | 0.072%(+1.13)#101 |
| 50. | Bethel Island | 1.20% | 0.27%(+0.937)#50 | 0.072%(+1.13)#102 |
| 51. | Belmont | 1.20% | 0.27%(+0.937)#51 | 0.072%(+1.13)#103 |
| 52. | South El Monte | 1.20% | 0.27%(+0.936)#52 | 0.072%(+1.13)#104 |
| 53. | Castle Hill | 1.19% | 0.27%(+0.921)#53 | 0.072%(+1.12)#105 |
| 54. | Cherryland | 1.19% | 0.27%(+0.920)#54 | 0.072%(+1.11)#106 |
| 55. | Toro Canyon | 1.18% | 0.27%(+0.915)#55 | 0.072%(+1.11)#107 |
| 56. | Castro Valley | 1.17% | 0.27%(+0.900)#56 | 0.072%(+1.10)#110 |
| 57. | Pacifica | 1.17% | 0.27%(+0.900)#57 | 0.072%(+1.09)#111 |
| 58. | Chino Hills | 1.11% | 0.27%(+0.844)#58 | 0.072%(+1.04)#117 |
| 59. | Milpitas | 1.11% | 0.27%(+0.839)#59 | 0.072%(+1.03)#119 |
| 60. | San Mateo | 1.04% | 0.27%(+0.773)#60 | 0.072%(+0.968)#130 |
| 61. | Newark | 1.03% | 0.27%(+0.761)#61 | 0.072%(+0.956)#131 |
| 62. | Orinda | 1.00% | 0.27%(+0.729)#62 | 0.072%(+0.924)#136 |
| 63. | Rancho Palos Verdes | 0.99% | 0.27%(+0.725)#63 | 0.072%(+0.920)#139 |
| 64. | Ballard | 0.97% | 0.27%(+0.704)#64 | 0.072%(+0.899)#142 |
| 65. | Mayflower Village | 0.92% | 0.27%(+0.654)#65 | 0.072%(+0.849)#152 |
| 66. | Fairview | 0.91% | 0.27%(+0.640)#66 | 0.072%(+0.835)#154 |
| 67. | Bell Canyon | 0.90% | 0.27%(+0.638)#67 | 0.072%(+0.833)#155 |
| 68. | Piedmont | 0.90% | 0.27%(+0.638)#68 | 0.072%(+0.833)#156 |
| 69. | Baywood Park | 0.89% | 0.27%(+0.622)#69 | 0.072%(+0.817)#158 |
| 70. | Hayward | 0.88% | 0.27%(+0.612)#70 | 0.072%(+0.808)#159 |
| 71. | Montara | 0.87% | 0.27%(+0.601)#71 | 0.072%(+0.796)#163 |
| 72. | Lake San Marcos | 0.83% | 0.27%(+0.566)#72 | 0.072%(+0.761)#168 |
| 73. | San Pasqual | 0.83% | 0.27%(+0.560)#73 | 0.072%(+0.755)#172 |
| 74. | Dublin | 0.81% | 0.27%(+0.546)#74 | 0.072%(+0.741)#178 |
| 75. | West Covina | 0.81% | 0.27%(+0.543)#75 | 0.072%(+0.738)#180 |
| 76. | San Carlos | 0.79% | 0.27%(+0.526)#76 | 0.072%(+0.721)#183 |
| 77. | Los Gatos | 0.76% | 0.27%(+0.488)#77 | 0.072%(+0.683)#193 |
| 78. | Mountain View | 0.74% | 0.27%(+0.469)#78 | 0.072%(+0.664)#194 |
| 79. | Stanford | 0.72% | 0.27%(+0.451)#79 | 0.072%(+0.646)#199 |
| 80. | Richmond | 0.70% | 0.27%(+0.437)#80 | 0.072%(+0.632)#207 |
| 81. | Rodeo | 0.67% | 0.27%(+0.408)#81 | 0.072%(+0.603)#212 |
| 82. | Sunnyvale | 0.66% | 0.27%(+0.394)#82 | 0.072%(+0.590)#216 |
| 83. | Covina | 0.66% | 0.27%(+0.393)#83 | 0.072%(+0.588)#217 |
| 84. | El Monte | 0.66% | 0.27%(+0.388)#84 | 0.072%(+0.583)#219 |
| 85. | Campbell | 0.65% | 0.27%(+0.386)#85 | 0.072%(+0.581)#220 |
| 86. | Albany | 0.64% | 0.27%(+0.372)#86 | 0.072%(+0.567)#227 |
| 87. | Midway City | 0.63% | 0.27%(+0.368)#87 | 0.072%(+0.563)#229 |
| 88. | Charter Oak | 0.61% | 0.27%(+0.343)#88 | 0.072%(+0.538)#234 |
| 89. | Calabasas | 0.61% | 0.27%(+0.343)#89 | 0.072%(+0.538)#235 |
| 90. | Duarte | 0.61% | 0.27%(+0.341)#90 | 0.072%(+0.536)#237 |
| 91. | Santa Clara | 0.61% | 0.27%(+0.338)#91 | 0.072%(+0.533)#239 |
| 92. | San Dimas | 0.60% | 0.27%(+0.330)#92 | 0.072%(+0.525)#242 |
| 93. | Baldwin Park | 0.59% | 0.27%(+0.323)#93 | 0.072%(+0.518)#245 |
| 94. | Emerald Lake Hills | 0.59% | 0.27%(+0.320)#94 | 0.072%(+0.515)#247 |
| 95. | Tara Hills | 0.58% | 0.27%(+0.309)#95 | 0.072%(+0.504)#252 |
| 96. | Fairfax | 0.57% | 0.27%(+0.301)#96 | 0.072%(+0.496)#254 |
| 97. | Menlo Park | 0.57% | 0.27%(+0.300)#97 | 0.072%(+0.495)#255 |
| 98. | San Pablo | 0.55% | 0.27%(+0.287)#98 | 0.072%(+0.482)#262 |
| 99. | Lafayette | 0.53% | 0.27%(+0.266)#99 | 0.072%(+0.461)#268 |
| 100. | Laguna Woods | 0.52% | 0.27%(+0.248)#100 | 0.072%(+0.443)#274 |
Common Questions
What are the Top 10 Cities with the Highest Percentage of Immigrants from Hong Kong in California?
Top 10 Cities with the Highest Percentage of Immigrants from Hong Kong in California are:
#1
5.30%
#2
4.98%
#3
4.93%
#4
4.05%
#5
4.00%
#6
3.76%
#7
3.61%
#8
3.30%
#9
3.03%
#10
2.93%
What city has the Highest Percentage of Immigrants from Hong Kong in California?
French Gulch has the Highest Percentage of Immigrants from Hong Kong in California with 5.30%.
What is the Percentage of Immigrants from Hong Kong in the State of California?
Percentage of Immigrants from Hong Kong in California is 0.27%.
What is the Percentage of Immigrants from Hong Kong in the United States?
Percentage of Immigrants from Hong Kong in the United States is 0.072%.