Cities with the Most Births per 1,000 Teenage Women Under the Age of 20 in California
RELATED REPORTS & OPTIONS
Highest Birth Rate | Women 15-19
California
Compare Cities
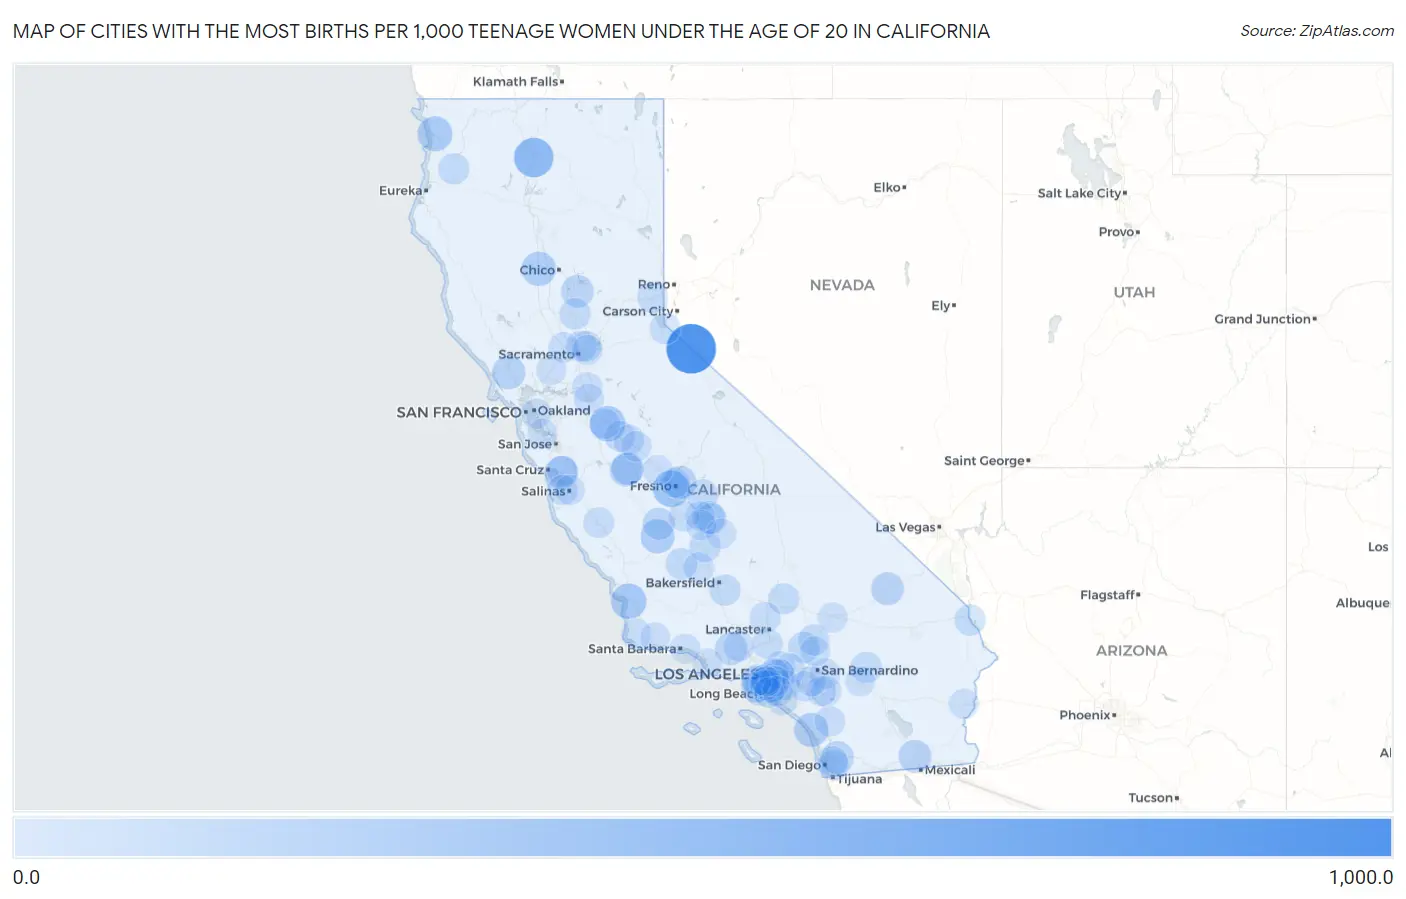
Map of Cities with the Most Births per 1,000 Teenage Women Under the Age of 20 in California
0.0
1,000.0
Cities with the Most Births per 1,000 Teenage Women Under the Age of 20 in California
| City | Births / 1,000 Women | vs State | vs National | |
| 1. | Topaz | 1,000.0 | 7.0(+993)#1 | 10.0(+990)#41 |
| 2. | Dunsmuir | 471.0 | 7.0(+464)#2 | 10.0(+461)#144 |
| 3. | West Park | 333.0 | 7.0(+326)#3 | 10.0(+323)#236 |
| 4. | Bystrom | 280.0 | 7.0(+273)#4 | 10.0(+270)#290 |
| 5. | Oceano | 275.0 | 7.0(+268)#5 | 10.0(+265)#300 |
| 6. | Klamath | 250.0 | 7.0(+243)#6 | 10.0(+240)#333 |
| 7. | Avenal | 214.0 | 7.0(+207)#7 | 10.0(+204)#397 |
| 8. | Orland | 210.0 | 7.0(+203)#8 | 10.0(+200)#405 |
| 9. | Camp Pendleton South | 209.0 | 7.0(+202)#9 | 10.0(+199)#408 |
| 10. | Cotati | 168.0 | 7.0(+161)#10 | 10.0(+158)#515 |
| 11. | South Dos Palos | 159.0 | 7.0(+152)#11 | 10.0(+149)#551 |
| 12. | Freedom | 157.0 | 7.0(+150)#12 | 10.0(+147)#564 |
| 13. | Tarpey Village | 150.0 | 7.0(+143)#13 | 10.0(+140)#581 |
| 14. | Imperial | 146.0 | 7.0(+139)#14 | 10.0(+136)#602 |
| 15. | Baker | 143.0 | 7.0(+136)#15 | 10.0(+133)#621 |
| 16. | Bostonia | 134.0 | 7.0(+127)#16 | 10.0(+124)#652 |
| 17. | Piru | 131.0 | 7.0(+124)#17 | 10.0(+121)#667 |
| 18. | Palermo | 127.0 | 7.0(+120)#18 | 10.0(+117)#683 |
| 19. | Dos Palos | 113.0 | 7.0(+106)#19 | 10.0(+103)#746 |
| 20. | Farmersville | 112.0 | 7.0(+105)#20 | 10.0(+102)#749 |
| 21. | Huron | 105.0 | 7.0(+98.0)#21 | 10.0(+95.0)#801 |
| 22. | Phelan | 85.0 | 7.0(+78.0)#22 | 10.0(+75.0)#920 |
| 23. | Orange Cove | 77.0 | 7.0(+70.0)#23 | 10.0(+67.0)#981 |
| 24. | Lost Hills | 77.0 | 7.0(+70.0)#24 | 10.0(+67.0)#988 |
| 25. | Earlimart | 72.0 | 7.0(+65.0)#25 | 10.0(+62.0)#1,014 |
| 26. | Hoopa | 68.0 | 7.0(+61.0)#26 | 10.0(+58.0)#1,044 |
| 27. | Linda | 65.0 | 7.0(+58.0)#27 | 10.0(+55.0)#1,068 |
| 28. | Artesia | 65.0 | 7.0(+58.0)#28 | 10.0(+55.0)#1,069 |
| 29. | Lamont | 65.0 | 7.0(+58.0)#29 | 10.0(+55.0)#1,070 |
| 30. | West Carson | 63.0 | 7.0(+56.0)#30 | 10.0(+53.0)#1,088 |
| 31. | California City | 62.0 | 7.0(+55.0)#31 | 10.0(+52.0)#1,101 |
| 32. | Needles | 62.0 | 7.0(+55.0)#32 | 10.0(+52.0)#1,105 |
| 33. | Victorville | 59.0 | 7.0(+52.0)#33 | 10.0(+49.0)#1,129 |
| 34. | Yucca Valley | 58.0 | 7.0(+51.0)#34 | 10.0(+48.0)#1,142 |
| 35. | Inglewood | 56.0 | 7.0(+49.0)#35 | 10.0(+46.0)#1,152 |
| 36. | South Lake Tahoe | 55.0 | 7.0(+48.0)#36 | 10.0(+45.0)#1,163 |
| 37. | Rosamond | 52.0 | 7.0(+45.0)#37 | 10.0(+42.0)#1,193 |
| 38. | East Bakersfield | 52.0 | 7.0(+45.0)#38 | 10.0(+42.0)#1,198 |
| 39. | Redondo Beach | 50.0 | 7.0(+43.0)#39 | 10.0(+40.0)#1,208 |
| 40. | Rio Linda | 50.0 | 7.0(+43.0)#40 | 10.0(+40.0)#1,211 |
| 41. | King City | 47.0 | 7.0(+40.0)#41 | 10.0(+37.0)#1,250 |
| 42. | La Presa | 43.0 | 7.0(+36.0)#42 | 10.0(+33.0)#1,299 |
| 43. | Foothill Farms | 43.0 | 7.0(+36.0)#43 | 10.0(+33.0)#1,300 |
| 44. | Delhi | 43.0 | 7.0(+36.0)#44 | 10.0(+33.0)#1,309 |
| 45. | Exeter | 43.0 | 7.0(+36.0)#45 | 10.0(+33.0)#1,310 |
| 46. | Truckee | 40.0 | 7.0(+33.0)#46 | 10.0(+30.0)#1,339 |
| 47. | Acton | 40.0 | 7.0(+33.0)#47 | 10.0(+30.0)#1,345 |
| 48. | Winton | 38.0 | 7.0(+31.0)#48 | 10.0(+28.0)#1,364 |
| 49. | Redlands | 37.0 | 7.0(+30.0)#49 | 10.0(+27.0)#1,376 |
| 50. | La Verne | 37.0 | 7.0(+30.0)#50 | 10.0(+27.0)#1,380 |
| 51. | Watsonville | 36.0 | 7.0(+29.0)#51 | 10.0(+26.0)#1,397 |
| 52. | La Puente | 35.0 | 7.0(+28.0)#52 | 10.0(+25.0)#1,415 |
| 53. | Duarte | 35.0 | 7.0(+28.0)#53 | 10.0(+25.0)#1,423 |
| 54. | Merced | 34.0 | 7.0(+27.0)#54 | 10.0(+24.0)#1,434 |
| 55. | Placentia | 34.0 | 7.0(+27.0)#55 | 10.0(+24.0)#1,438 |
| 56. | Woodland | 33.0 | 7.0(+26.0)#56 | 10.0(+23.0)#1,450 |
| 57. | West Puente Valley | 33.0 | 7.0(+26.0)#57 | 10.0(+23.0)#1,454 |
| 58. | Val Verde | 33.0 | 7.0(+26.0)#58 | 10.0(+23.0)#1,460 |
| 59. | Pala | 33.0 | 7.0(+26.0)#59 | 10.0(+23.0)#1,461 |
| 60. | Costa Mesa | 28.0 | 7.0(+21.0)#60 | 10.0(+18.0)#1,543 |
| 61. | Home Gardens | 28.0 | 7.0(+21.0)#61 | 10.0(+18.0)#1,549 |
| 62. | La Mesa | 27.0 | 7.0(+20.0)#62 | 10.0(+17.0)#1,555 |
| 63. | Hanford | 27.0 | 7.0(+20.0)#63 | 10.0(+17.0)#1,557 |
| 64. | Maywood | 27.0 | 7.0(+20.0)#64 | 10.0(+17.0)#1,565 |
| 65. | Marina | 26.0 | 7.0(+19.0)#65 | 10.0(+16.0)#1,591 |
| 66. | West Modesto | 26.0 | 7.0(+19.0)#66 | 10.0(+16.0)#1,603 |
| 67. | Wasco | 25.0 | 7.0(+18.0)#67 | 10.0(+15.0)#1,611 |
| 68. | Lodi | 24.0 | 7.0(+17.0)#68 | 10.0(+14.0)#1,629 |
| 69. | Nuevo | 24.0 | 7.0(+17.0)#69 | 10.0(+14.0)#1,643 |
| 70. | Oxnard | 22.0 | 7.0(+15.0)#70 | 10.0(+12.0)#1,680 |
| 71. | Lakewood | 22.0 | 7.0(+15.0)#71 | 10.0(+12.0)#1,684 |
| 72. | Lynwood | 22.0 | 7.0(+15.0)#72 | 10.0(+12.0)#1,686 |
| 73. | Barstow | 22.0 | 7.0(+15.0)#73 | 10.0(+12.0)#1,699 |
| 74. | Blythe | 22.0 | 7.0(+15.0)#74 | 10.0(+12.0)#1,703 |
| 75. | South El Monte | 21.0 | 7.0(+14.0)#75 | 10.0(+11.0)#1,721 |
| 76. | Oakland | 20.0 | 7.0(+13.0)#76 | 10.0(+10.00)#1,730 |
| 77. | Carmichael | 19.0 | 7.0(+12.0)#77 | 10.0(+9.00)#1,754 |
| 78. | Vacaville | 18.0 | 7.0(+11.0)#78 | 10.0(+8.00)#1,778 |
| 79. | Compton | 18.0 | 7.0(+11.0)#79 | 10.0(+8.00)#1,780 |
| 80. | Perris | 18.0 | 7.0(+11.0)#80 | 10.0(+8.00)#1,782 |
| 81. | Tulare | 18.0 | 7.0(+11.0)#81 | 10.0(+8.00)#1,783 |
| 82. | Florence Graham | 18.0 | 7.0(+11.0)#82 | 10.0(+8.00)#1,784 |
| 83. | Lompoc | 18.0 | 7.0(+11.0)#83 | 10.0(+8.00)#1,790 |
| 84. | Desert Hot Springs | 18.0 | 7.0(+11.0)#84 | 10.0(+8.00)#1,793 |
| 85. | Stockton | 17.0 | 7.0(+10.00)#85 | 10.0(+7.00)#1,809 |
| 86. | South Whittier | 17.0 | 7.0(+10.00)#86 | 10.0(+7.00)#1,821 |
| 87. | Long Beach | 16.0 | 7.0(+9.00)#87 | 10.0(+6.00)#1,840 |
| 88. | Riverside | 16.0 | 7.0(+9.00)#88 | 10.0(+6.00)#1,841 |
| 89. | Hesperia | 16.0 | 7.0(+9.00)#89 | 10.0(+6.00)#1,846 |
| 90. | Fresno | 15.0 | 7.0(+8.00)#90 | 10.0(+5.00)#1,866 |
| 91. | Stanton | 15.0 | 7.0(+8.00)#91 | 10.0(+5.00)#1,884 |
| 92. | Lennox | 15.0 | 7.0(+8.00)#92 | 10.0(+5.00)#1,886 |
| 93. | Montecito | 15.0 | 7.0(+8.00)#93 | 10.0(+5.00)#1,892 |
| 94. | Solvang | 15.0 | 7.0(+8.00)#94 | 10.0(+5.00)#1,893 |
| 95. | East Porterville | 15.0 | 7.0(+8.00)#95 | 10.0(+5.00)#1,895 |
| 96. | Salinas | 14.0 | 7.0(+7.00)#96 | 10.0(+4.00)#1,903 |
| 97. | Visalia | 14.0 | 7.0(+7.00)#97 | 10.0(+4.00)#1,904 |
| 98. | South Gate | 14.0 | 7.0(+7.00)#98 | 10.0(+4.00)#1,907 |
| 99. | Madera | 14.0 | 7.0(+7.00)#99 | 10.0(+4.00)#1,913 |
| 100. | East Palo Alto | 14.0 | 7.0(+7.00)#100 | 10.0(+4.00)#1,923 |
Common Questions
What are the Top 10 Cities with the Most Births per 1,000 Teenage Women Under the Age of 20 in California?
Top 10 Cities with the Most Births per 1,000 Teenage Women Under the Age of 20 in California are:
What city has the Most Births per 1,000 Teenage Women Under the Age of 20 in California?
Topaz has the Most Births per 1,000 Teenage Women Under the Age of 20 in California with 1,000.0.
What is the Number of Births per 1,000 Teenage Women Under the Age of 20 in the State of California?
Number of Births per 1,000 Teenage Women Under the Age of 20 in California is 7.0.
What is the Number of Births per 1,000 Teenage Women Under the Age of 20 in the United States?
Number of Births per 1,000 Teenage Women Under the Age of 20 in the United States is 10.0.