Zip Codes with the Highest Percentage of Population Employed in Installation, Maintenance & Repair in San Rafael, CA
RELATED REPORTS & OPTIONS
Installation, Maintenance & Repair
San Rafael
Compare Zip Codes
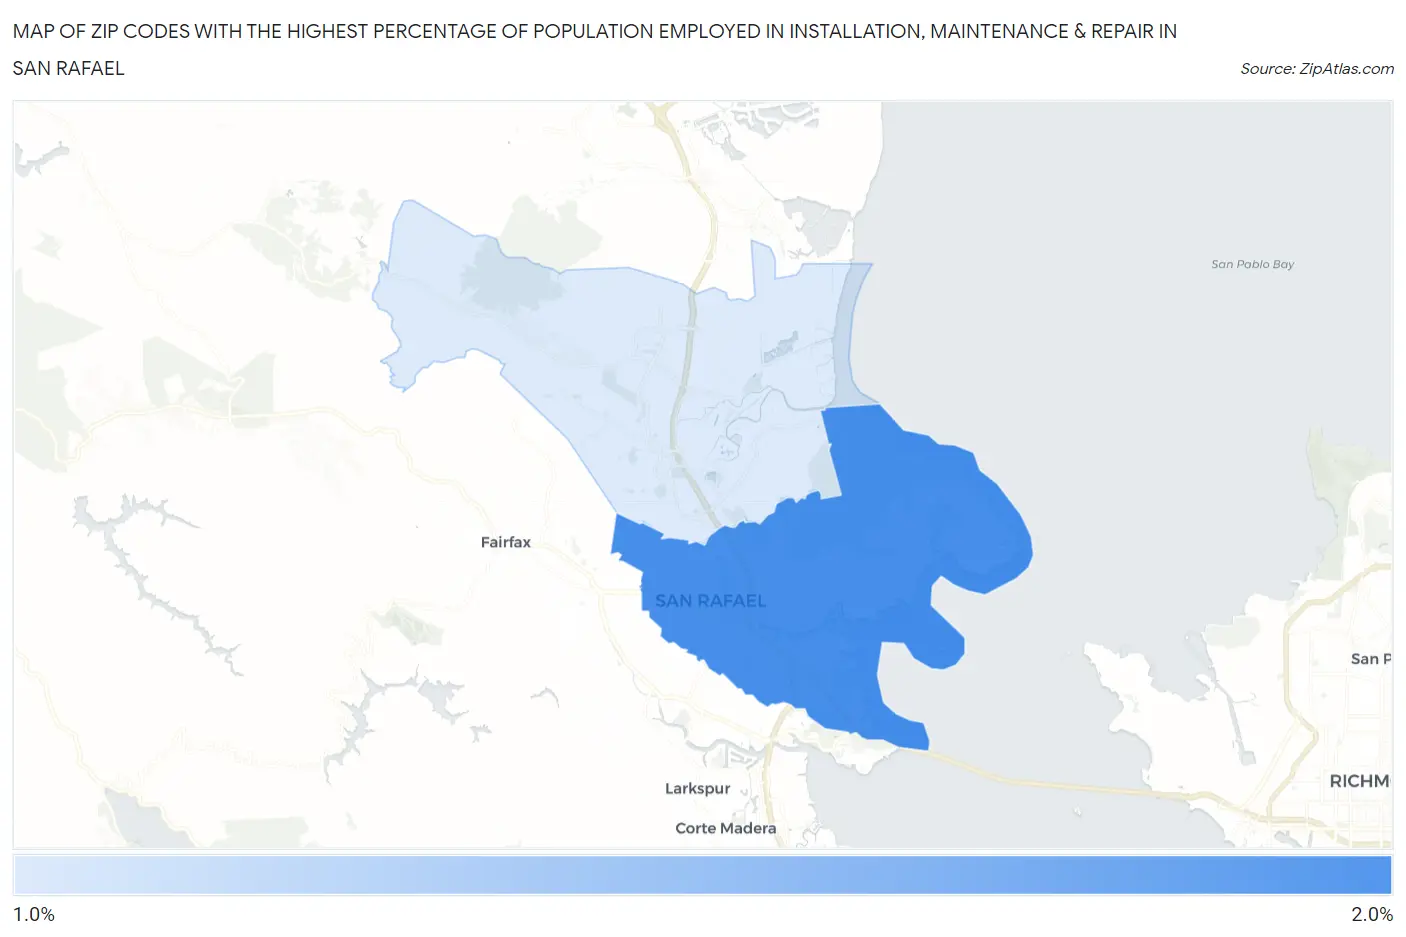
Map of Zip Codes with the Highest Percentage of Population Employed in Installation, Maintenance & Repair in San Rafael
1.0%
1.5%
Zip Codes with the Highest Percentage of Population Employed in Installation, Maintenance & Repair in San Rafael, CA
| Zip Code | % Employed | vs State | vs National | |
| 1. | 94901 | 1.5% | 2.6%(-1.05)#1,119 | 3.1%(-1.56)#24,125 |
| 2. | 94903 | 1.0% | 2.6%(-1.52)#1,243 | 3.1%(-2.04)#25,837 |
1
Common Questions
What are the Top Zip Codes with the Highest Percentage of Population Employed in Installation, Maintenance & Repair in San Rafael, CA?
Top Zip Codes with the Highest Percentage of Population Employed in Installation, Maintenance & Repair in San Rafael, CA are:
What zip code has the Highest Percentage of Population Employed in Installation, Maintenance & Repair in San Rafael, CA?
94901 has the Highest Percentage of Population Employed in Installation, Maintenance & Repair in San Rafael, CA with 1.5%.
What is the Percentage of Population Employed in Installation, Maintenance & Repair in San Rafael, CA?
Percentage of Population Employed in Installation, Maintenance & Repair in San Rafael is 1.5%.
What is the Percentage of Population Employed in Installation, Maintenance & Repair in California?
Percentage of Population Employed in Installation, Maintenance & Repair in California is 2.6%.
What is the Percentage of Population Employed in Installation, Maintenance & Repair in the United States?
Percentage of Population Employed in Installation, Maintenance & Repair in the United States is 3.1%.