Cities with the Highest Percentage of Population with a Degree in Social Sciences in California
RELATED REPORTS & OPTIONS
Social Sciences
California
Compare Cities
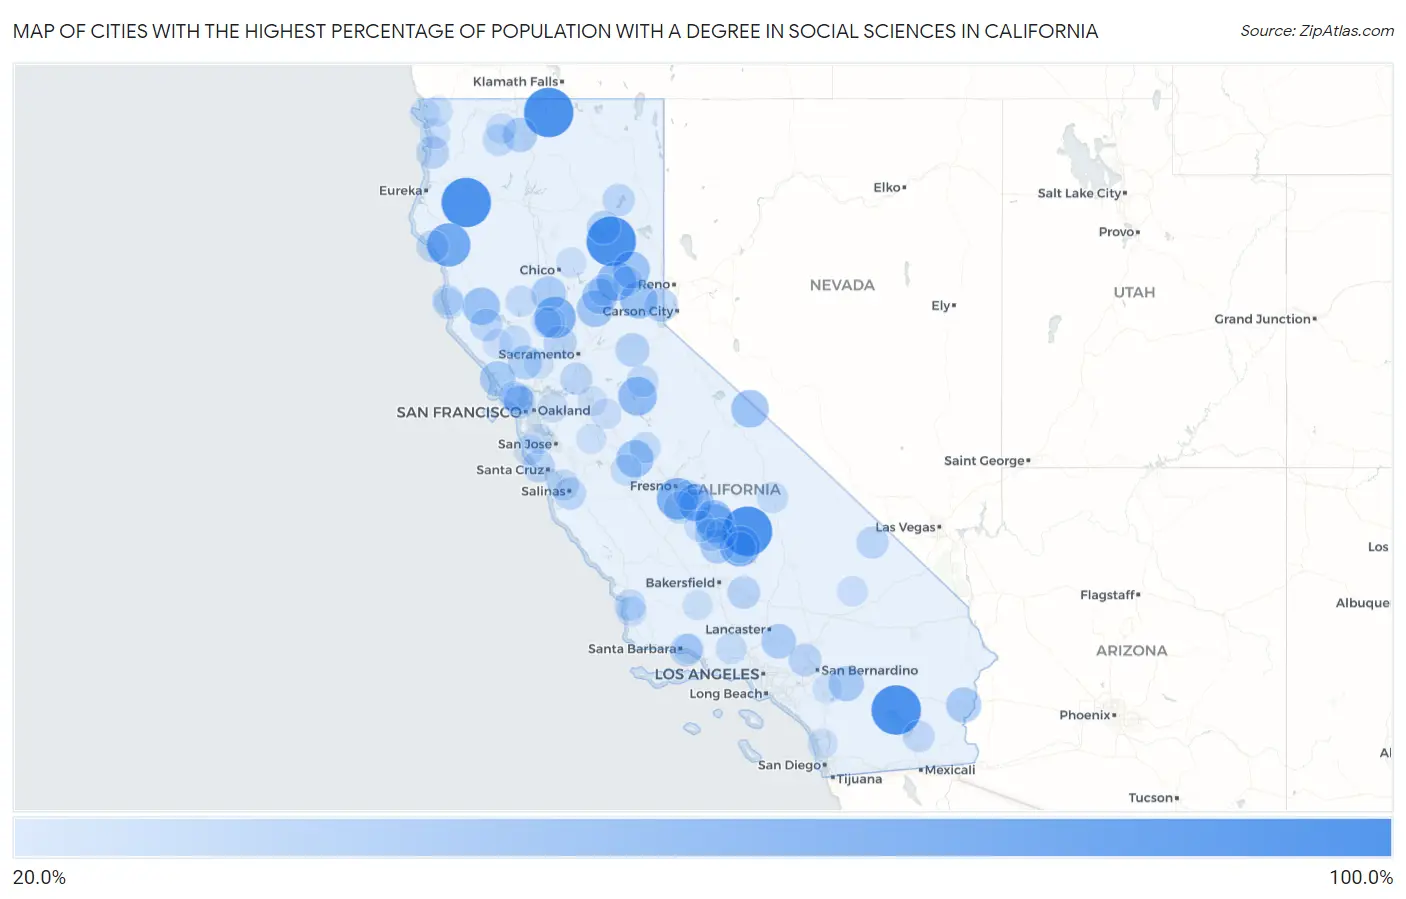
Map of Cities with the Highest Percentage of Population with a Degree in Social Sciences in California
0.0%
100.0%
Cities with the Highest Percentage of Population with a Degree in Social Sciences in California
| City | % Graduates | vs State | vs National | |
| 1. | North Shore | 100.0% | 10.4%(+89.6)#1 | 8.1%(+91.9)#2 |
| 2. | Hyampom | 100.0% | 10.4%(+89.6)#2 | 8.1%(+91.9)#15 |
| 3. | Macdoel | 100.0% | 10.4%(+89.6)#3 | 8.1%(+91.9)#25 |
| 4. | Mt. Bullion | 100.0% | 10.4%(+89.6)#4 | 8.1%(+91.9)#41 |
| 5. | Ponderosa | 100.0% | 10.4%(+89.6)#5 | 8.1%(+91.9)#47 |
| 6. | Crescent Mills | 100.0% | 10.4%(+89.6)#6 | 8.1%(+91.9)#56 |
| 7. | Benbow | 75.0% | 10.4%(+64.6)#7 | 8.1%(+66.9)#75 |
| 8. | Grimes | 66.7% | 10.4%(+56.3)#8 | 8.1%(+58.6)#91 |
| 9. | Monmouth | 66.7% | 10.4%(+56.3)#9 | 8.1%(+58.6)#94 |
| 10. | California Hot Springs | 63.2% | 10.4%(+52.8)#10 | 8.1%(+55.1)#107 |
| 11. | Downieville | 57.1% | 10.4%(+46.8)#11 | 8.1%(+49.1)#130 |
| 12. | Tuttletown | 55.7% | 10.4%(+45.3)#12 | 8.1%(+47.6)#142 |
| 13. | Lindsay | 54.6% | 10.4%(+44.2)#13 | 8.1%(+46.5)#149 |
| 14. | Igo | 52.2% | 10.4%(+41.8)#14 | 8.1%(+44.1)#163 |
| 15. | Benton | 51.0% | 10.4%(+40.7)#15 | 8.1%(+42.9)#169 |
| 16. | Calpella | 50.5% | 10.4%(+40.1)#16 | 8.1%(+42.4)#170 |
| 17. | Delft Colony | 50.0% | 10.4%(+39.6)#17 | 8.1%(+41.9)#171 |
| 18. | El Nido | 50.0% | 10.4%(+39.6)#18 | 8.1%(+41.9)#173 |
| 19. | Kingvale | 50.0% | 10.4%(+39.6)#19 | 8.1%(+41.9)#197 |
| 20. | Weitchpec | 50.0% | 10.4%(+39.6)#20 | 8.1%(+41.9)#200 |
| 21. | Whitehawk | 50.0% | 10.4%(+39.6)#21 | 8.1%(+41.9)#205 |
| 22. | Tooleville | 50.0% | 10.4%(+39.6)#22 | 8.1%(+41.9)#210 |
| 23. | Rumsey | 48.8% | 10.4%(+38.5)#23 | 8.1%(+40.8)#222 |
| 24. | Penn Valley | 46.2% | 10.4%(+35.9)#24 | 8.1%(+38.2)#237 |
| 25. | North San Juan | 43.3% | 10.4%(+33.0)#25 | 8.1%(+35.3)#263 |
| 26. | Tomales | 41.8% | 10.4%(+31.5)#26 | 8.1%(+33.7)#279 |
| 27. | Mesa Verde | 41.7% | 10.4%(+31.3)#27 | 8.1%(+33.6)#280 |
| 28. | Cabazon | 41.4% | 10.4%(+31.0)#28 | 8.1%(+33.3)#285 |
| 29. | Casa Loma | 40.7% | 10.4%(+30.4)#29 | 8.1%(+32.7)#295 |
| 30. | Princeton | 40.0% | 10.4%(+29.6)#30 | 8.1%(+31.9)#308 |
| 31. | Littlerock | 39.6% | 10.4%(+29.3)#31 | 8.1%(+31.6)#323 |
| 32. | Ducor | 38.9% | 10.4%(+28.5)#32 | 8.1%(+30.8)#331 |
| 33. | Gazelle | 38.5% | 10.4%(+28.1)#33 | 8.1%(+30.4)#339 |
| 34. | Rutherford | 36.8% | 10.4%(+26.5)#34 | 8.1%(+28.8)#365 |
| 35. | Grizzly Flats | 36.7% | 10.4%(+26.3)#35 | 8.1%(+28.6)#366 |
| 36. | Kings Beach | 35.3% | 10.4%(+24.9)#36 | 8.1%(+27.2)#398 |
| 37. | Clear Creek | 35.2% | 10.4%(+24.8)#37 | 8.1%(+27.1)#399 |
| 38. | Yolo | 33.3% | 10.4%(+23.0)#38 | 8.1%(+25.3)#433 |
| 39. | Keene | 33.2% | 10.4%(+22.8)#39 | 8.1%(+25.1)#459 |
| 40. | Lytle Creek | 32.1% | 10.4%(+21.8)#40 | 8.1%(+24.1)#472 |
| 41. | Orick | 32.1% | 10.4%(+21.8)#41 | 8.1%(+24.1)#473 |
| 42. | Summerland | 31.7% | 10.4%(+21.4)#42 | 8.1%(+23.7)#480 |
| 43. | Laton | 31.2% | 10.4%(+20.9)#43 | 8.1%(+23.2)#490 |
| 44. | Walnut Grove | 31.0% | 10.4%(+20.6)#44 | 8.1%(+22.9)#499 |
| 45. | Poplar Cotton Center | 30.8% | 10.4%(+20.4)#45 | 8.1%(+22.7)#502 |
| 46. | Hopland | 30.7% | 10.4%(+20.3)#46 | 8.1%(+22.6)#512 |
| 47. | Davenport | 30.6% | 10.4%(+20.2)#47 | 8.1%(+22.5)#515 |
| 48. | Spaulding | 30.4% | 10.4%(+20.1)#48 | 8.1%(+22.4)#519 |
| 49. | Shoshone | 30.4% | 10.4%(+20.1)#49 | 8.1%(+22.4)#520 |
| 50. | Shelter Cove | 29.6% | 10.4%(+19.3)#50 | 8.1%(+21.6)#556 |
| 51. | Spreckels | 29.6% | 10.4%(+19.2)#51 | 8.1%(+21.5)#558 |
| 52. | Alto | 29.6% | 10.4%(+19.2)#52 | 8.1%(+21.5)#559 |
| 53. | London | 29.2% | 10.4%(+18.8)#53 | 8.1%(+21.1)#573 |
| 54. | Avery | 28.8% | 10.4%(+18.4)#54 | 8.1%(+20.7)#590 |
| 55. | Calipatria | 28.8% | 10.4%(+18.4)#55 | 8.1%(+20.7)#591 |
| 56. | Etna | 28.6% | 10.4%(+18.2)#56 | 8.1%(+20.5)#598 |
| 57. | Camptonville | 28.0% | 10.4%(+17.6)#57 | 8.1%(+19.9)#634 |
| 58. | Middletown | 27.5% | 10.4%(+17.1)#58 | 8.1%(+19.4)#658 |
| 59. | Callender | 27.0% | 10.4%(+16.6)#59 | 8.1%(+18.9)#686 |
| 60. | Pine Flat | 26.9% | 10.4%(+16.6)#60 | 8.1%(+18.9)#689 |
| 61. | Lone Pine | 26.7% | 10.4%(+16.3)#61 | 8.1%(+18.6)#696 |
| 62. | Lodoga | 26.7% | 10.4%(+16.3)#62 | 8.1%(+18.6)#706 |
| 63. | Planada | 26.6% | 10.4%(+16.2)#63 | 8.1%(+18.5)#711 |
| 64. | Castroville | 26.6% | 10.4%(+16.2)#64 | 8.1%(+18.5)#712 |
| 65. | Ross | 26.5% | 10.4%(+16.1)#65 | 8.1%(+18.4)#715 |
| 66. | Matheny | 26.3% | 10.4%(+15.9)#66 | 8.1%(+18.2)#722 |
| 67. | South Dos Palos | 25.9% | 10.4%(+15.5)#67 | 8.1%(+17.8)#745 |
| 68. | Little River | 25.6% | 10.4%(+15.2)#68 | 8.1%(+17.5)#762 |
| 69. | Piru | 25.5% | 10.4%(+15.1)#69 | 8.1%(+17.4)#771 |
| 70. | Mendocino | 25.1% | 10.4%(+14.7)#70 | 8.1%(+17.0)#787 |
| 71. | East Porterville | 25.0% | 10.4%(+14.6)#71 | 8.1%(+16.9)#790 |
| 72. | College City | 25.0% | 10.4%(+14.6)#72 | 8.1%(+16.9)#801 |
| 73. | Strawberry Cdp Tuolumne County | 24.6% | 10.4%(+14.2)#73 | 8.1%(+16.5)#857 |
| 74. | Stebbins | 24.5% | 10.4%(+14.2)#74 | 8.1%(+16.5)#859 |
| 75. | Fort Jones | 24.5% | 10.4%(+14.1)#75 | 8.1%(+16.4)#861 |
| 76. | Pescadero | 23.9% | 10.4%(+13.6)#76 | 8.1%(+15.9)#897 |
| 77. | Fort Irwin | 23.7% | 10.4%(+13.4)#77 | 8.1%(+15.7)#910 |
| 78. | Klamath | 23.6% | 10.4%(+13.2)#78 | 8.1%(+15.5)#919 |
| 79. | Woodacre | 23.5% | 10.4%(+13.1)#79 | 8.1%(+15.4)#930 |
| 80. | Guadalupe | 23.3% | 10.4%(+13.0)#80 | 8.1%(+15.3)#938 |
| 81. | Del Rio | 23.2% | 10.4%(+12.8)#81 | 8.1%(+15.1)#949 |
| 82. | Gasquet | 22.9% | 10.4%(+12.6)#82 | 8.1%(+14.9)#966 |
| 83. | Ladera | 22.8% | 10.4%(+12.5)#83 | 8.1%(+14.8)#973 |
| 84. | Maricopa | 22.8% | 10.4%(+12.4)#84 | 8.1%(+14.7)#980 |
| 85. | Rexland Acres | 22.7% | 10.4%(+12.4)#85 | 8.1%(+14.7)#983 |
| 86. | Arbuckle | 22.7% | 10.4%(+12.3)#86 | 8.1%(+14.6)#988 |
| 87. | Magalia | 22.5% | 10.4%(+12.2)#87 | 8.1%(+14.5)#1,002 |
| 88. | Kennedy | 22.5% | 10.4%(+12.2)#88 | 8.1%(+14.5)#1,003 |
| 89. | Moskowite Corner | 22.5% | 10.4%(+12.1)#89 | 8.1%(+14.4)#1,007 |
| 90. | Diablo | 22.5% | 10.4%(+12.1)#90 | 8.1%(+14.4)#1,008 |
| 91. | Rancho Santa Fe | 22.4% | 10.4%(+12.1)#91 | 8.1%(+14.4)#1,013 |
| 92. | Sierra City | 22.4% | 10.4%(+12.0)#92 | 8.1%(+14.3)#1,019 |
| 93. | Diablo Grande | 22.4% | 10.4%(+12.0)#93 | 8.1%(+14.3)#1,020 |
| 94. | Kentfield | 22.3% | 10.4%(+12.0)#94 | 8.1%(+14.3)#1,021 |
| 95. | Geyserville | 22.3% | 10.4%(+12.0)#95 | 8.1%(+14.2)#1,023 |
| 96. | Crescent City | 22.2% | 10.4%(+11.9)#96 | 8.1%(+14.2)#1,028 |
| 97. | Lakeview | 22.1% | 10.4%(+11.8)#97 | 8.1%(+14.1)#1,054 |
| 98. | Parlier | 22.1% | 10.4%(+11.7)#98 | 8.1%(+14.0)#1,057 |
| 99. | Sonoma State University | 22.1% | 10.4%(+11.7)#99 | 8.1%(+14.0)#1,061 |
| 100. | Toro Canyon | 21.9% | 10.4%(+11.5)#100 | 8.1%(+13.8)#1,072 |
Common Questions
What are the Top 10 Cities with the Highest Percentage of Population with a Degree in Social Sciences in California?
Top 10 Cities with the Highest Percentage of Population with a Degree in Social Sciences in California are:
#1
100.0%
#2
100.0%
#3
100.0%
#4
100.0%
#5
100.0%
#6
75.0%
#7
66.7%
#8
66.7%
#9
63.2%
#10
57.1%
What city has the Highest Percentage of Population with a Degree in Social Sciences in California?
North Shore has the Highest Percentage of Population with a Degree in Social Sciences in California with 100.0%.
What is the Percentage of Population with a Degree in Social Sciences in the State of California?
Percentage of Population with a Degree in Social Sciences in California is 10.4%.
What is the Percentage of Population with a Degree in Social Sciences in the United States?
Percentage of Population with a Degree in Social Sciences in the United States is 8.1%.