Cities with the Highest Percentage of Families with Income Above $200,000 in California
RELATED REPORTS & OPTIONS
Family Income | $200k+
California
Compare Cities
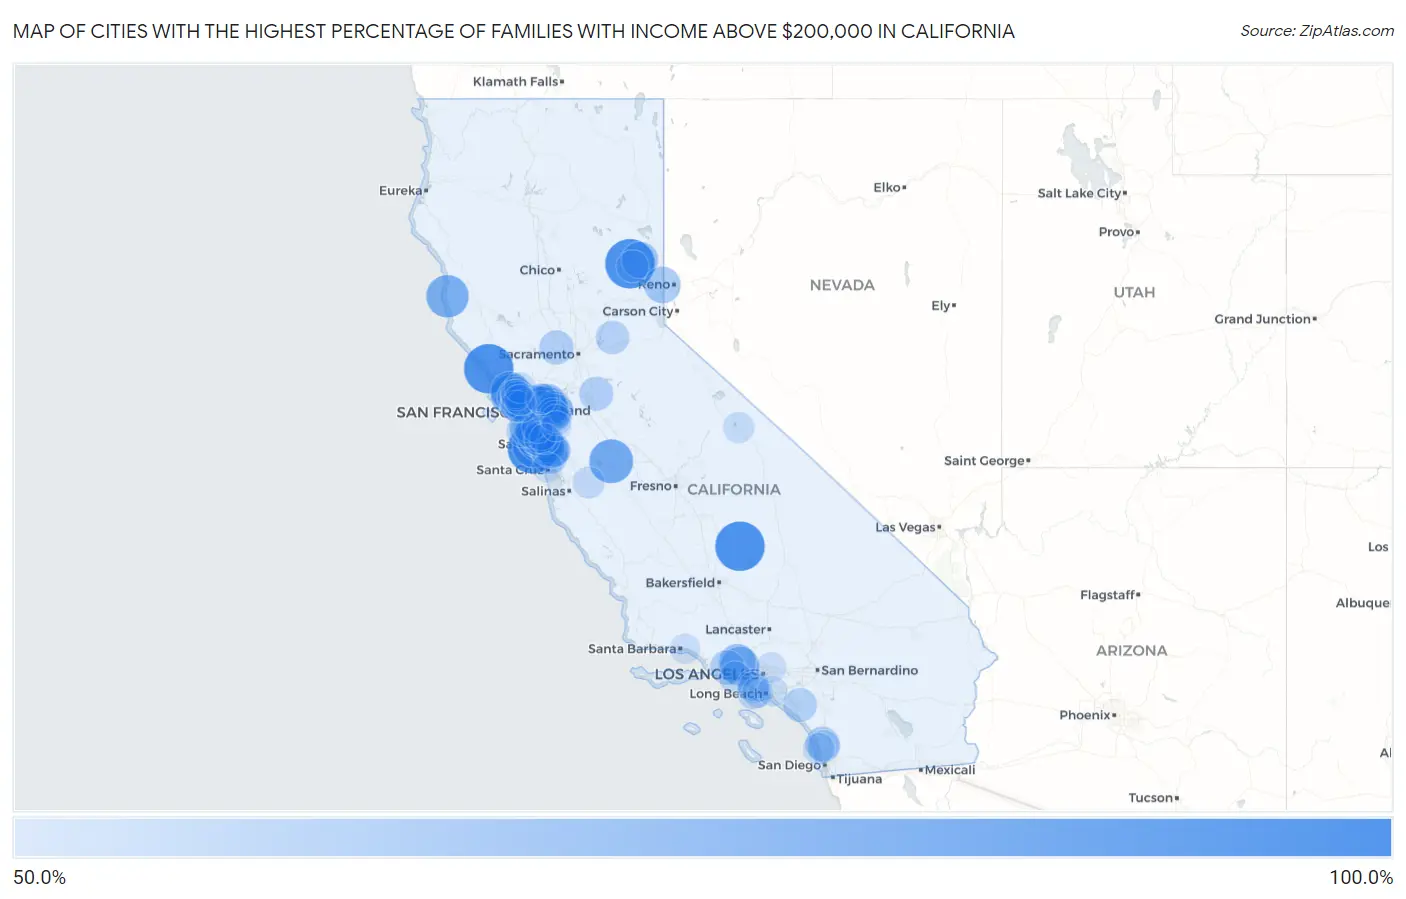
Map of Cities with the Highest Percentage of Families with Income Above $200,000 in California
0.0%
100.0%
Cities with the Highest Percentage of Families with Income Above $200,000 in California
| City | Families with Income > $200k | vs State | vs National | |
| 1. | Loma Mar | 100.0% | 21.1%(+78.9)#1 | 14.8%(+85.2)#11 |
| 2. | Sereno Del Mar | 100.0% | 21.1%(+78.9)#2 | 14.8%(+85.2)#16 |
| 3. | Mohawk Vista | 100.0% | 21.1%(+78.9)#3 | 14.8%(+85.2)#39 |
| 4. | California Hot Springs | 100.0% | 21.1%(+78.9)#4 | 14.8%(+85.2)#45 |
| 5. | La Honda | 89.7% | 21.1%(+68.6)#5 | 14.8%(+74.9)#58 |
| 6. | Volta | 85.7% | 21.1%(+64.6)#6 | 14.8%(+70.9)#62 |
| 7. | Caspar | 82.4% | 21.1%(+61.3)#7 | 14.8%(+67.6)#75 |
| 8. | Mountain Meadows | 80.3% | 21.1%(+59.2)#8 | 14.8%(+65.5)#84 |
| 9. | San Geronimo | 80.0% | 21.1%(+58.9)#9 | 14.8%(+65.2)#88 |
| 10. | Goodmanville | 76.2% | 21.1%(+55.1)#10 | 14.8%(+61.4)#107 |
| 11. | Piedmont | 75.9% | 21.1%(+54.8)#11 | 14.8%(+61.1)#108 |
| 12. | Alto | 75.4% | 21.1%(+54.3)#12 | 14.8%(+60.6)#114 |
| 13. | Ross | 74.9% | 21.1%(+53.8)#13 | 14.8%(+60.1)#118 |
| 14. | Atherton | 74.3% | 21.1%(+53.2)#14 | 14.8%(+59.5)#122 |
| 15. | Emerald Lake Hills | 74.1% | 21.1%(+53.0)#15 | 14.8%(+59.3)#124 |
| 16. | Loyola | 74.1% | 21.1%(+53.0)#16 | 14.8%(+59.3)#125 |
| 17. | Nicasio | 73.9% | 21.1%(+52.8)#17 | 14.8%(+59.1)#126 |
| 18. | Portola Valley | 73.7% | 21.1%(+52.6)#18 | 14.8%(+58.9)#129 |
| 19. | Hidden Hills | 73.5% | 21.1%(+52.4)#19 | 14.8%(+58.7)#132 |
| 20. | Castle Hill | 73.4% | 21.1%(+52.3)#20 | 14.8%(+58.6)#133 |
| 21. | Los Altos Hills | 73.3% | 21.1%(+52.2)#21 | 14.8%(+58.5)#135 |
| 22. | Woodside | 72.5% | 21.1%(+51.4)#22 | 14.8%(+57.7)#145 |
| 23. | Los Altos | 72.1% | 21.1%(+51.0)#23 | 14.8%(+57.3)#150 |
| 24. | Hillsborough | 71.8% | 21.1%(+50.7)#24 | 14.8%(+57.0)#155 |
| 25. | West Menlo Park | 71.8% | 21.1%(+50.7)#25 | 14.8%(+57.0)#156 |
| 26. | Norris Canyon | 71.8% | 21.1%(+50.7)#26 | 14.8%(+57.0)#158 |
| 27. | Alamo | 71.3% | 21.1%(+50.2)#27 | 14.8%(+56.5)#162 |
| 28. | Shell Ridge | 70.2% | 21.1%(+49.1)#28 | 14.8%(+55.4)#178 |
| 29. | Orinda | 70.1% | 21.1%(+49.0)#29 | 14.8%(+55.3)#180 |
| 30. | Bell Canyon | 69.5% | 21.1%(+48.4)#30 | 14.8%(+54.7)#186 |
| 31. | Highlands | 68.1% | 21.1%(+47.0)#31 | 14.8%(+53.3)#206 |
| 32. | Beckwourth | 68.1% | 21.1%(+47.0)#32 | 14.8%(+53.3)#208 |
| 33. | Verdi | 68.0% | 21.1%(+46.9)#33 | 14.8%(+53.2)#212 |
| 34. | Belvedere | 67.8% | 21.1%(+46.7)#34 | 14.8%(+53.0)#217 |
| 35. | Kentfield | 67.6% | 21.1%(+46.5)#35 | 14.8%(+52.8)#220 |
| 36. | Tamalpais Homestead Valley | 67.2% | 21.1%(+46.1)#36 | 14.8%(+52.4)#223 |
| 37. | Monte Sereno | 67.1% | 21.1%(+46.0)#37 | 14.8%(+52.3)#225 |
| 38. | Corte Madera | 66.0% | 21.1%(+44.9)#38 | 14.8%(+51.2)#245 |
| 39. | Kensington | 65.2% | 21.1%(+44.1)#39 | 14.8%(+50.4)#258 |
| 40. | Lexington Hills | 65.1% | 21.1%(+44.0)#40 | 14.8%(+50.3)#262 |
| 41. | Blackhawk | 64.7% | 21.1%(+43.6)#41 | 14.8%(+49.9)#270 |
| 42. | Cupertino | 64.0% | 21.1%(+42.9)#42 | 14.8%(+49.2)#289 |
| 43. | San Carlos | 63.8% | 21.1%(+42.7)#43 | 14.8%(+49.0)#293 |
| 44. | Lafayette | 63.7% | 21.1%(+42.6)#44 | 14.8%(+48.9)#295 |
| 45. | Camino Tassajara | 63.4% | 21.1%(+42.3)#45 | 14.8%(+48.6)#302 |
| 46. | Saratoga | 63.2% | 21.1%(+42.1)#46 | 14.8%(+48.4)#306 |
| 47. | Lake Sherwood | 63.2% | 21.1%(+42.1)#47 | 14.8%(+48.4)#307 |
| 48. | Ladera | 63.2% | 21.1%(+42.1)#48 | 14.8%(+48.4)#308 |
| 49. | Rancho Santa Fe | 62.7% | 21.1%(+41.6)#49 | 14.8%(+47.9)#319 |
| 50. | Monument Hills | 62.7% | 21.1%(+41.6)#50 | 14.8%(+47.9)#321 |
| 51. | Mill Valley | 62.6% | 21.1%(+41.5)#51 | 14.8%(+47.8)#322 |
| 52. | Williams Canyon | 62.5% | 21.1%(+41.4)#52 | 14.8%(+47.7)#328 |
| 53. | San Miguel Cdp Contra Costa County | 62.4% | 21.1%(+41.3)#53 | 14.8%(+47.6)#329 |
| 54. | Waterloo | 62.2% | 21.1%(+41.1)#54 | 14.8%(+47.4)#337 |
| 55. | Palo Alto | 61.9% | 21.1%(+40.8)#55 | 14.8%(+47.1)#344 |
| 56. | Coto De Caza | 61.7% | 21.1%(+40.6)#56 | 14.8%(+46.9)#349 |
| 57. | Belmont | 61.6% | 21.1%(+40.5)#57 | 14.8%(+46.8)#351 |
| 58. | Los Gatos | 61.4% | 21.1%(+40.3)#58 | 14.8%(+46.6)#360 |
| 59. | Cambrian Park | 61.2% | 21.1%(+40.1)#59 | 14.8%(+46.4)#376 |
| 60. | Coloma | 61.1% | 21.1%(+40.0)#60 | 14.8%(+46.3)#378 |
| 61. | Palos Verdes Estates | 60.7% | 21.1%(+39.6)#61 | 14.8%(+45.9)#387 |
| 62. | Moraga | 59.5% | 21.1%(+38.4)#62 | 14.8%(+44.7)#420 |
| 63. | Danville | 59.3% | 21.1%(+38.2)#63 | 14.8%(+44.5)#422 |
| 64. | Diablo | 59.1% | 21.1%(+38.0)#64 | 14.8%(+44.3)#431 |
| 65. | Woodacre | 59.0% | 21.1%(+37.9)#65 | 14.8%(+44.2)#434 |
| 66. | Menlo Park | 58.9% | 21.1%(+37.8)#66 | 14.8%(+44.1)#436 |
| 67. | Tiburon | 58.7% | 21.1%(+37.6)#67 | 14.8%(+43.9)#441 |
| 68. | Reliez Valley | 58.4% | 21.1%(+37.3)#68 | 14.8%(+43.6)#454 |
| 69. | Fairbanks Ranch | 58.4% | 21.1%(+37.3)#69 | 14.8%(+43.6)#455 |
| 70. | Malibu | 57.7% | 21.1%(+36.6)#70 | 14.8%(+42.9)#480 |
| 71. | Burlingame | 57.5% | 21.1%(+36.4)#71 | 14.8%(+42.7)#486 |
| 72. | El Granada | 57.5% | 21.1%(+36.4)#72 | 14.8%(+42.7)#487 |
| 73. | San Anselmo | 57.4% | 21.1%(+36.3)#73 | 14.8%(+42.6)#492 |
| 74. | Mabie | 57.3% | 21.1%(+36.2)#74 | 14.8%(+42.5)#498 |
| 75. | Stanford | 57.1% | 21.1%(+36.0)#75 | 14.8%(+42.3)#501 |
| 76. | Tres Pinos | 57.1% | 21.1%(+36.0)#76 | 14.8%(+42.3)#504 |
| 77. | Sausalito | 56.7% | 21.1%(+35.6)#77 | 14.8%(+41.9)#517 |
| 78. | Del Mar | 56.7% | 21.1%(+35.6)#78 | 14.8%(+41.9)#518 |
| 79. | Manhattan Beach | 56.4% | 21.1%(+35.3)#79 | 14.8%(+41.6)#533 |
| 80. | Lucas Valley Marinwood | 56.4% | 21.1%(+35.3)#80 | 14.8%(+41.6)#536 |
| 81. | La Canada Flintridge | 56.3% | 21.1%(+35.2)#81 | 14.8%(+41.5)#539 |
| 82. | Hermosa Beach | 56.2% | 21.1%(+35.1)#82 | 14.8%(+41.4)#541 |
| 83. | San Ramon | 56.1% | 21.1%(+35.0)#83 | 14.8%(+41.3)#545 |
| 84. | Strawberry Cdp Marin County | 55.9% | 21.1%(+34.8)#84 | 14.8%(+41.1)#550 |
| 85. | Sunny Slopes | 55.6% | 21.1%(+34.5)#85 | 14.8%(+40.8)#558 |
| 86. | Muir Beach | 55.4% | 21.1%(+34.3)#86 | 14.8%(+40.6)#566 |
| 87. | Foster City | 54.5% | 21.1%(+33.4)#87 | 14.8%(+39.7)#597 |
| 88. | Rolling Hills Estates | 54.4% | 21.1%(+33.3)#88 | 14.8%(+39.6)#601 |
| 89. | Black Point Green Point | 54.4% | 21.1%(+33.3)#89 | 14.8%(+39.6)#603 |
| 90. | Dublin | 54.3% | 21.1%(+33.2)#90 | 14.8%(+39.5)#607 |
| 91. | Sleepy Hollow | 54.3% | 21.1%(+33.2)#91 | 14.8%(+39.5)#610 |
| 92. | Pleasanton | 54.1% | 21.1%(+33.0)#92 | 14.8%(+39.3)#613 |
| 93. | Alhambra Valley | 54.1% | 21.1%(+33.0)#93 | 14.8%(+39.3)#616 |
| 94. | Mountain View | 53.9% | 21.1%(+32.8)#94 | 14.8%(+39.1)#621 |
| 95. | Larkspur | 53.9% | 21.1%(+32.8)#95 | 14.8%(+39.1)#624 |
| 96. | San Pasqual | 53.9% | 21.1%(+32.8)#96 | 14.8%(+39.1)#626 |
| 97. | Montecito | 53.7% | 21.1%(+32.6)#97 | 14.8%(+38.9)#633 |
| 98. | Rossmoor | 53.2% | 21.1%(+32.1)#98 | 14.8%(+38.4)#653 |
| 99. | Pasatiempo | 53.1% | 21.1%(+32.0)#99 | 14.8%(+38.3)#659 |
| 100. | Sunol | 52.9% | 21.1%(+31.8)#100 | 14.8%(+38.1)#668 |
Common Questions
What are the Top 10 Cities with the Highest Percentage of Families with Income Above $200,000 in California?
Top 10 Cities with the Highest Percentage of Families with Income Above $200,000 in California are:
#1
100.0%
#2
100.0%
#3
100.0%
#4
100.0%
#5
89.7%
#6
85.7%
#7
82.4%
#8
80.0%
#9
75.9%
#10
75.4%
What city has the Highest Percentage of Families with Income Above $200,000 in California?
Loma Mar has the Highest Percentage of Families with Income Above $200,000 in California with 100.0%.
What is the Percentage of Families with Income Above $200,000 in the State of California?
Percentage of Families with Income Above $200,000 in California is 21.1%.
What is the Percentage of Families with Income Above $200,000 in the United States?
Percentage of Families with Income Above $200,000 in the United States is 14.8%.