Cromberg, CA Map & Demographics
Cromberg Map
Cromberg Overview
$39,615
PER CAPITA INCOME
$77,891
AVG FAMILY INCOME
$78,750
AVG HOUSEHOLD INCOME
0.33
INEQUALITY / GINI INDEX
401
TOTAL POPULATION
190
MALE POPULATION
211
FEMALE POPULATION
90.05
MALES / 100 FEMALES
111.05
FEMALES / 100 MALES
64.1
MEDIAN AGE
4.2
AVG FAMILY SIZE
3.3
AVG HOUSEHOLD SIZE
129
LABOR FORCE [ PEOPLE ]
40.7%
PERCENT IN LABOR FORCE
13.2%
UNEMPLOYMENT RATE
Cromberg Area Codes
Income in Cromberg
Income Overview in Cromberg
Per Capita Income in Cromberg is $39,615, while median incomes of families and households are $77,891 and $78,750 respectively.
| Characteristic | Number | Measure |
| Per Capita Income | 401 | $39,615 |
| Median Family Income | 71 | $77,891 |
| Mean Family Income | 71 | $81,221 |
| Median Household Income | 120 | $78,750 |
| Mean Household Income | 120 | $86,735 |
| Income Deficit | 71 | $0 |
| Wage / Income Gap (%) | 401 | 0.00% |
| Wage / Income Gap ($) | 401 | 100.00¢ per $1 |
| Gini / Inequality Index | 401 | 0.33 |
Earnings by Sex in Cromberg
| Sex | Number | Average Earnings |
| Male | 99 (88.4%) | $0 |
| Female | 13 (11.6%) | $0 |
| Total | 112 (100.0%) | $0 |
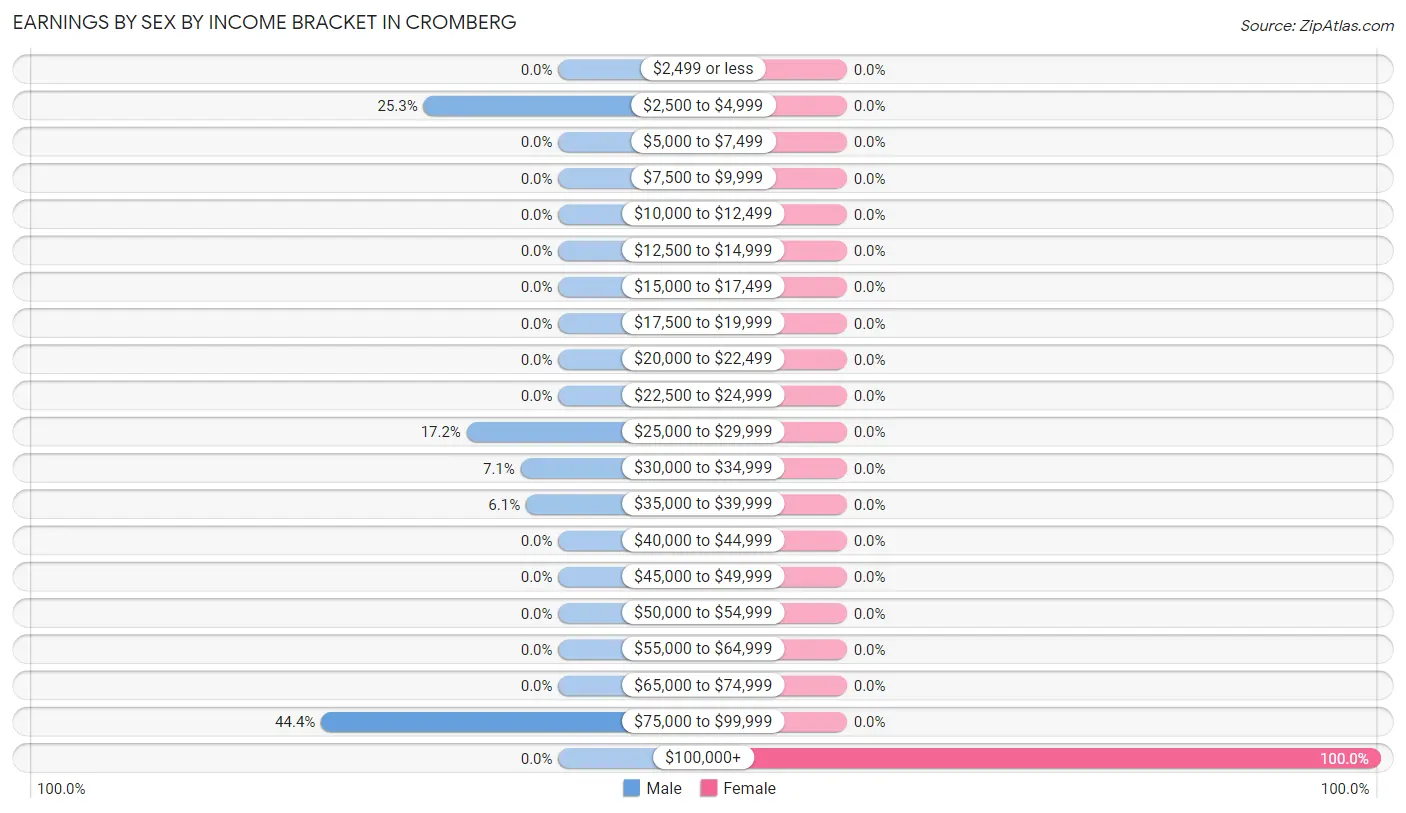
Earnings by Sex by Income Bracket in Cromberg
The most common earnings brackets in Cromberg are $75,000 to $99,999 for men (44 | 44.4%) and $100,000+ for women (13 | 100.0%).
| Income | Male | Female |
| $2,499 or less | 0 (0.0%) | 0 (0.0%) |
| $2,500 to $4,999 | 25 (25.3%) | 0 (0.0%) |
| $5,000 to $7,499 | 0 (0.0%) | 0 (0.0%) |
| $7,500 to $9,999 | 0 (0.0%) | 0 (0.0%) |
| $10,000 to $12,499 | 0 (0.0%) | 0 (0.0%) |
| $12,500 to $14,999 | 0 (0.0%) | 0 (0.0%) |
| $15,000 to $17,499 | 0 (0.0%) | 0 (0.0%) |
| $17,500 to $19,999 | 0 (0.0%) | 0 (0.0%) |
| $20,000 to $22,499 | 0 (0.0%) | 0 (0.0%) |
| $22,500 to $24,999 | 0 (0.0%) | 0 (0.0%) |
| $25,000 to $29,999 | 17 (17.2%) | 0 (0.0%) |
| $30,000 to $34,999 | 7 (7.1%) | 0 (0.0%) |
| $35,000 to $39,999 | 6 (6.1%) | 0 (0.0%) |
| $40,000 to $44,999 | 0 (0.0%) | 0 (0.0%) |
| $45,000 to $49,999 | 0 (0.0%) | 0 (0.0%) |
| $50,000 to $54,999 | 0 (0.0%) | 0 (0.0%) |
| $55,000 to $64,999 | 0 (0.0%) | 0 (0.0%) |
| $65,000 to $74,999 | 0 (0.0%) | 0 (0.0%) |
| $75,000 to $99,999 | 44 (44.4%) | 0 (0.0%) |
| $100,000+ | 0 (0.0%) | 13 (100.0%) |
| Total | 99 (100.0%) | 13 (100.0%) |
Earnings by Sex by Educational Attainment in Cromberg
| Educational Attainment | Male Income | Female Income |
| Less than High School | - | - |
| High School Diploma | - | - |
| College or Associate's Degree | - | - |
| Bachelor's Degree | - | - |
| Graduate Degree | - | - |
| Total | - | - |
Family Income in Cromberg
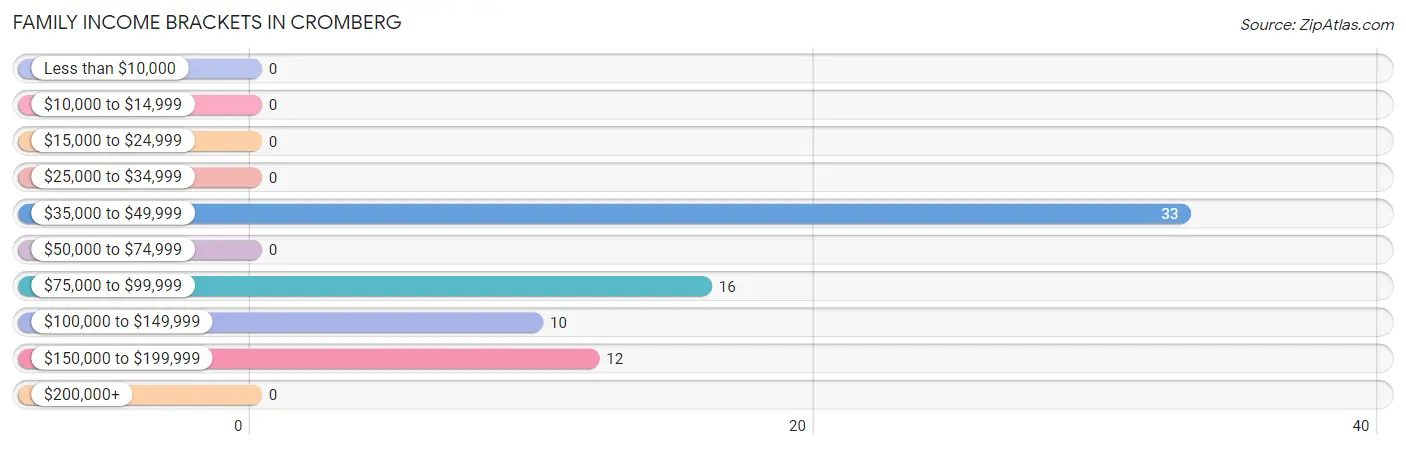
Family Income Brackets in Cromberg
According to the Cromberg family income data, there are 33 families falling into the $35,000 to $49,999 income range, which is the most common income bracket and makes up 46.5% of all families.
| Income Bracket | # Families | % Families |
| Less than $10,000 | 0 | 0.0% |
| $10,000 to $14,999 | 0 | 0.0% |
| $15,000 to $24,999 | 0 | 0.0% |
| $25,000 to $34,999 | 0 | 0.0% |
| $35,000 to $49,999 | 33 | 46.5% |
| $50,000 to $74,999 | 0 | 0.0% |
| $75,000 to $99,999 | 16 | 22.5% |
| $100,000 to $149,999 | 10 | 14.1% |
| $150,000 to $199,999 | 12 | 16.9% |
| $200,000+ | 0 | 0.0% |
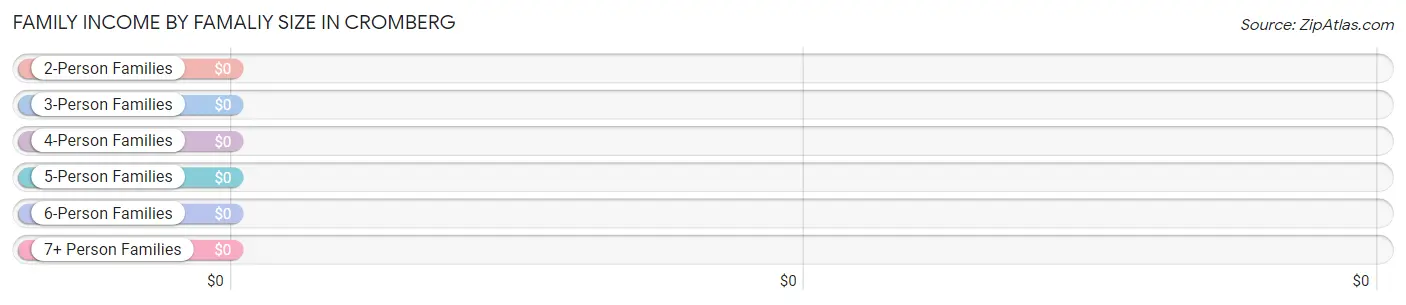
Family Income by Famaliy Size in Cromberg
| Income Bracket | # Families | Median Income |
| 2-Person Families | 49 (69.0%) | $0 |
| 3-Person Families | 0 (0.0%) | $0 |
| 4-Person Families | 6 (8.5%) | $0 |
| 5-Person Families | 0 (0.0%) | $0 |
| 6-Person Families | 16 (22.5%) | $0 |
| 7+ Person Families | 0 (0.0%) | $0 |
| Total | 71 (100.0%) | $77,891 |
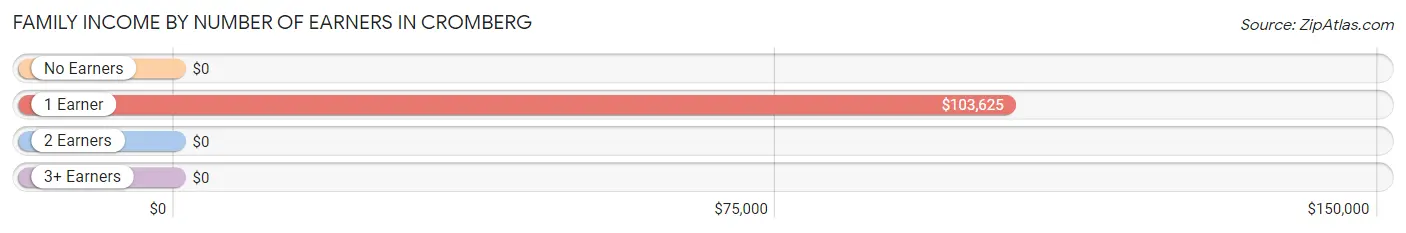
Family Income by Number of Earners in Cromberg
| Number of Earners | # Families | Median Income |
| No Earners | 26 (36.6%) | $0 |
| 1 Earner | 23 (32.4%) | $103,625 |
| 2 Earners | 22 (31.0%) | $0 |
| 3+ Earners | 0 (0.0%) | $0 |
| Total | 71 (100.0%) | $77,891 |
Household Income in Cromberg
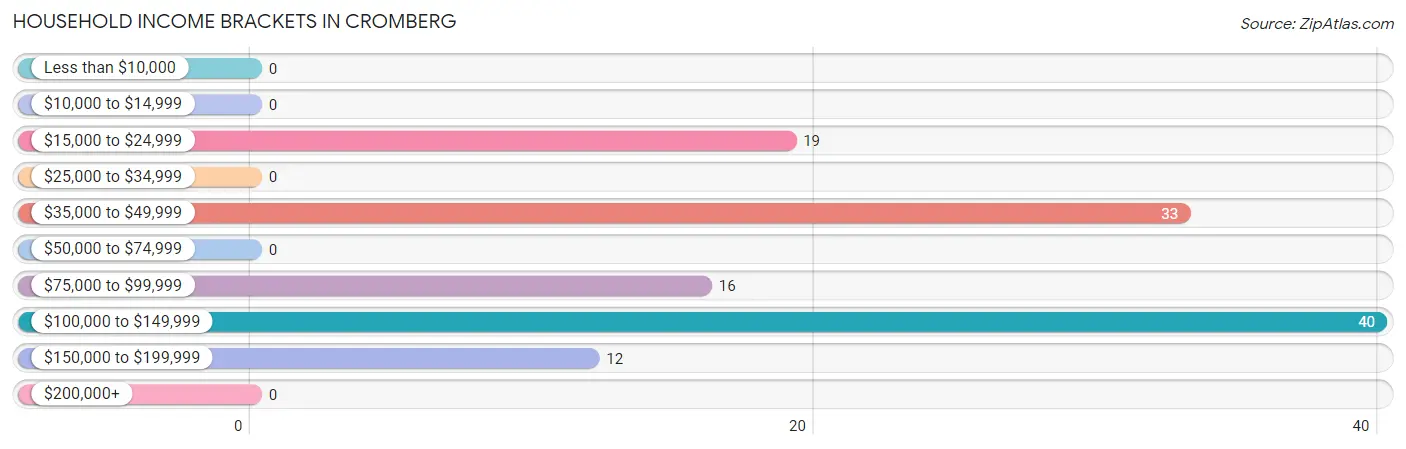
Household Income Brackets in Cromberg
With 40 households falling in the category, the $100,000 to $149,999 income range is the most frequent in Cromberg, accounting for 33.3% of all households.
| Income Bracket | # Households | % Households |
| Less than $10,000 | 0 | 0.0% |
| $10,000 to $14,999 | 0 | 0.0% |
| $15,000 to $24,999 | 19 | 15.8% |
| $25,000 to $34,999 | 0 | 0.0% |
| $35,000 to $49,999 | 33 | 27.5% |
| $50,000 to $74,999 | 0 | 0.0% |
| $75,000 to $99,999 | 16 | 13.3% |
| $100,000 to $149,999 | 40 | 33.3% |
| $150,000 to $199,999 | 12 | 10.0% |
| $200,000+ | 0 | 0.0% |
Household Income by Householder Age in Cromberg
| Income Bracket | # Households | Median Income |
| 15 to 24 Years | 0 (0.0%) | $0 |
| 25 to 44 Years | 0 (0.0%) | $0 |
| 45 to 64 Years | 38 (31.7%) | $0 |
| 65+ Years | 82 (68.3%) | $0 |
| Total | 120 (100.0%) | $78,750 |
Poverty in Cromberg
Income Below Poverty by Sex and Age in Cromberg
| Age Bracket | Male | Female |
| Under 5 Years | 0 (0.0%) | 0 (0.0%) |
| 5 Years | 0 (0.0%) | 0 (0.0%) |
| 6 to 11 Years | 0 (0.0%) | 0 (0.0%) |
| 12 to 14 Years | 0 (0.0%) | 0 (0.0%) |
| 15 Years | 0 (0.0%) | 0 (0.0%) |
| 16 and 17 Years | 0 (0.0%) | 0 (0.0%) |
| 18 to 24 Years | 0 (0.0%) | 0 (0.0%) |
| 25 to 34 Years | 0 (0.0%) | 0 (0.0%) |
| 35 to 44 Years | 0 (0.0%) | 0 (0.0%) |
| 45 to 54 Years | 0 (0.0%) | 0 (0.0%) |
| 55 to 64 Years | 0 (0.0%) | 0 (0.0%) |
| 65 to 74 Years | 0 (0.0%) | 0 (0.0%) |
| 75 Years and over | 0 (0.0%) | 0 (0.0%) |
| Total | 0 (0.0%) | 0 (0.0%) |
Income Above Poverty by Sex and Age in Cromberg
According to the poverty statistics in Cromberg, males aged 16 and 17 years and females aged 6 to 11 years are the age groups that are most secure financially, with 100.0% of males and 100.0% of females in these age groups living above the poverty line.
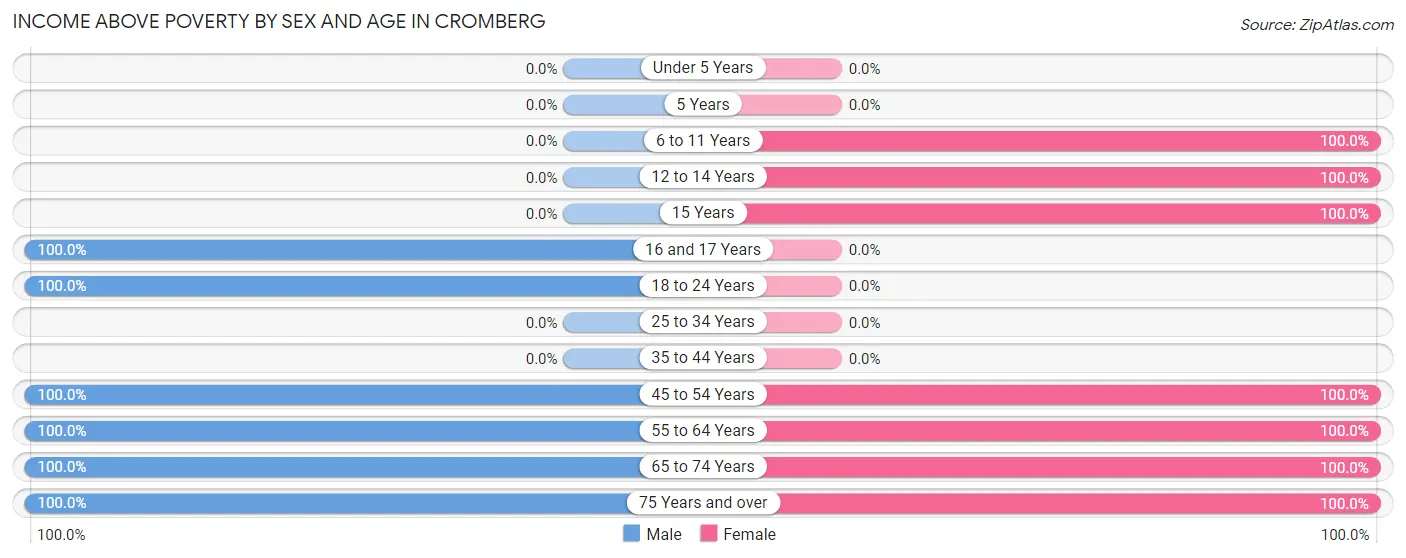
| Age Bracket | Male | Female |
| Under 5 Years | 0 (0.0%) | 0 (0.0%) |
| 5 Years | 0 (0.0%) | 0 (0.0%) |
| 6 to 11 Years | 0 (0.0%) | 24 (100.0%) |
| 12 to 14 Years | 0 (0.0%) | 50 (100.0%) |
| 15 Years | 0 (0.0%) | 10 (100.0%) |
| 16 and 17 Years | 7 (100.0%) | 0 (0.0%) |
| 18 to 24 Years | 25 (100.0%) | 0 (0.0%) |
| 25 to 34 Years | 0 (0.0%) | 0 (0.0%) |
| 35 to 44 Years | 0 (0.0%) | 0 (0.0%) |
| 45 to 54 Years | 6 (100.0%) | 7 (100.0%) |
| 55 to 64 Years | 70 (100.0%) | 23 (100.0%) |
| 65 to 74 Years | 17 (100.0%) | 81 (100.0%) |
| 75 Years and over | 65 (100.0%) | 16 (100.0%) |
| Total | 190 (100.0%) | 211 (100.0%) |
Income Below Poverty Among Married-Couple Families in Cromberg
| Children | Above Poverty | Below Poverty |
| No Children | 26 (100.0%) | 0 (0.0%) |
| 1 or 2 Children | 6 (100.0%) | 0 (0.0%) |
| 3 or 4 Children | 16 (100.0%) | 0 (0.0%) |
| 5 or more Children | 0 (0.0%) | 0 (0.0%) |
| Total | 48 (100.0%) | 0 (0.0%) |
Income Below Poverty Among Single-Parent Households in Cromberg
| Children | Single Father | Single Mother |
| No Children | 0 (0.0%) | 0 (0.0%) |
| 1 or 2 Children | 0 (0.0%) | 0 (0.0%) |
| 3 or 4 Children | 0 (0.0%) | 0 (0.0%) |
| 5 or more Children | 0 (0.0%) | 0 (0.0%) |
| Total | 0 (0.0%) | 0 (0.0%) |
Income Below Poverty Among Married-Couple vs Single-Parent Households in Cromberg
| Children | Married-Couple Families | Single-Parent Households |
| No Children | 0 (0.0%) | 0 (0.0%) |
| 1 or 2 Children | 0 (0.0%) | 0 (0.0%) |
| 3 or 4 Children | 0 (0.0%) | 0 (0.0%) |
| 5 or more Children | 0 (0.0%) | 0 (0.0%) |
| Total | 0 (0.0%) | 0 (0.0%) |
Race in Cromberg
The most populous races in Cromberg are White / Caucasian (391 | 97.5%), and Two or more Races (10 | 2.5%).
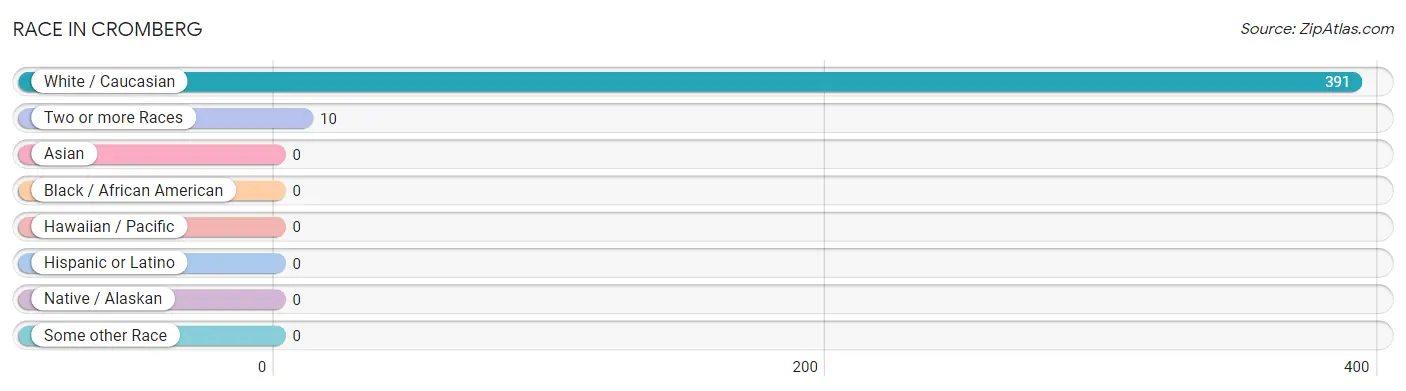
| Race | # Population | % Population |
| Asian | 0 | 0.0% |
| Black / African American | 0 | 0.0% |
| Hawaiian / Pacific | 0 | 0.0% |
| Hispanic or Latino | 0 | 0.0% |
| Native / Alaskan | 0 | 0.0% |
| White / Caucasian | 391 | 97.5% |
| Two or more Races | 10 | 2.5% |
| Some other Race | 0 | 0.0% |
| Total | 401 | 100.0% |
Ancestry in Cromberg
The most populous ancestries reported in Cromberg are English (106 | 26.4%), Irish (103 | 25.7%), Welsh (90 | 22.4%), Swedish (54 | 13.5%), and New Zealander (50 | 12.5%), together accounting for 100.5% of all Cromberg residents.
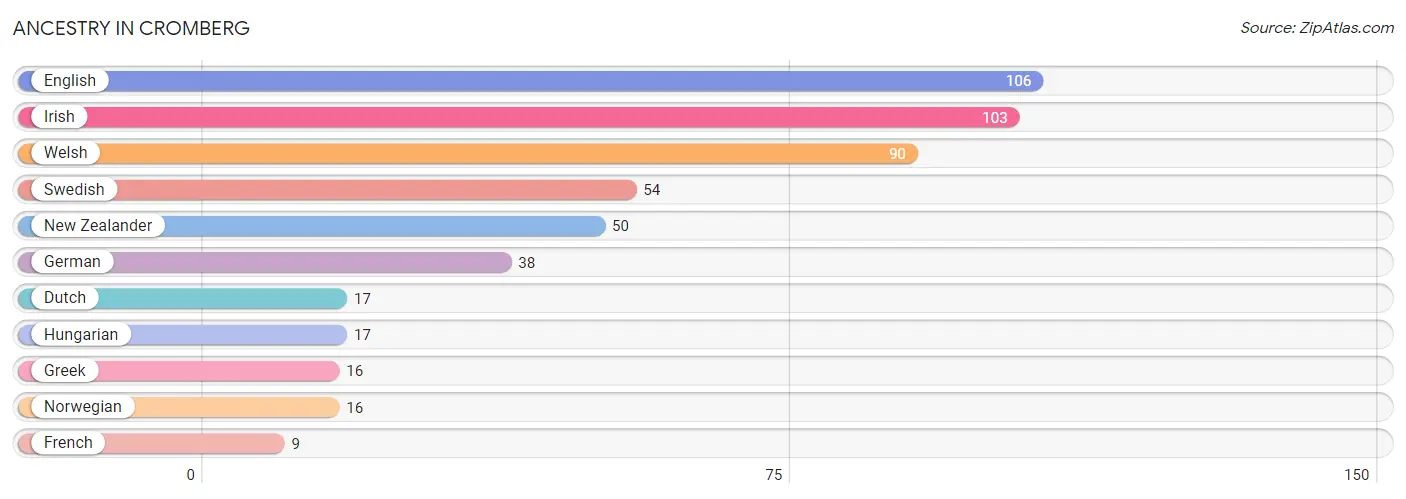
| Ancestry | # Population | % Population |
| Dutch | 17 | 4.2% |
| English | 106 | 26.4% |
| French | 9 | 2.2% |
| German | 38 | 9.5% |
| Greek | 16 | 4.0% |
| Hungarian | 17 | 4.2% |
| Irish | 103 | 25.7% |
| New Zealander | 50 | 12.5% |
| Norwegian | 16 | 4.0% |
| Swedish | 54 | 13.5% |
| Welsh | 90 | 22.4% | View All 11 Rows |
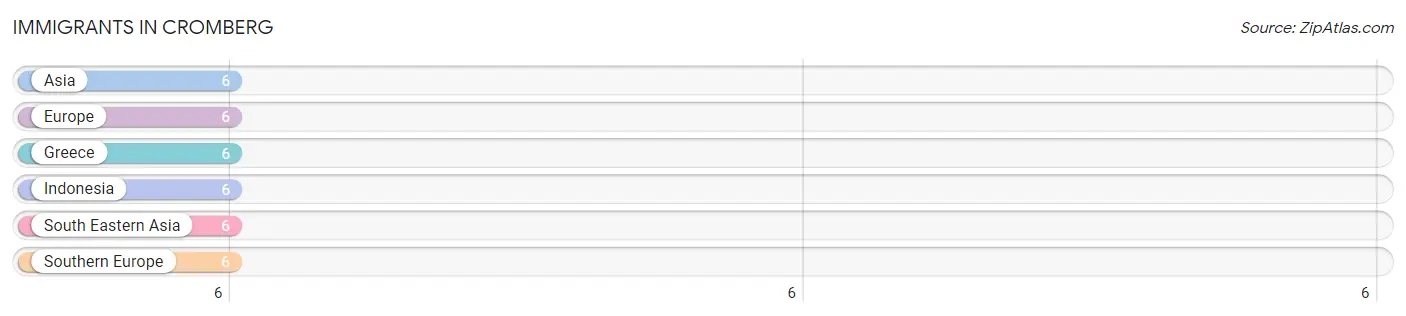
Immigrants in Cromberg
The most numerous immigrant groups reported in Cromberg came from Asia (6 | 1.5%), Europe (6 | 1.5%), Greece (6 | 1.5%), Indonesia (6 | 1.5%), and South Eastern Asia (6 | 1.5%), together accounting for 7.5% of all Cromberg residents.
| Immigration Origin | # Population | % Population |
| Asia | 6 | 1.5% |
| Europe | 6 | 1.5% |
| Greece | 6 | 1.5% |
| Indonesia | 6 | 1.5% |
| South Eastern Asia | 6 | 1.5% |
| Southern Europe | 6 | 1.5% | View All 6 Rows |
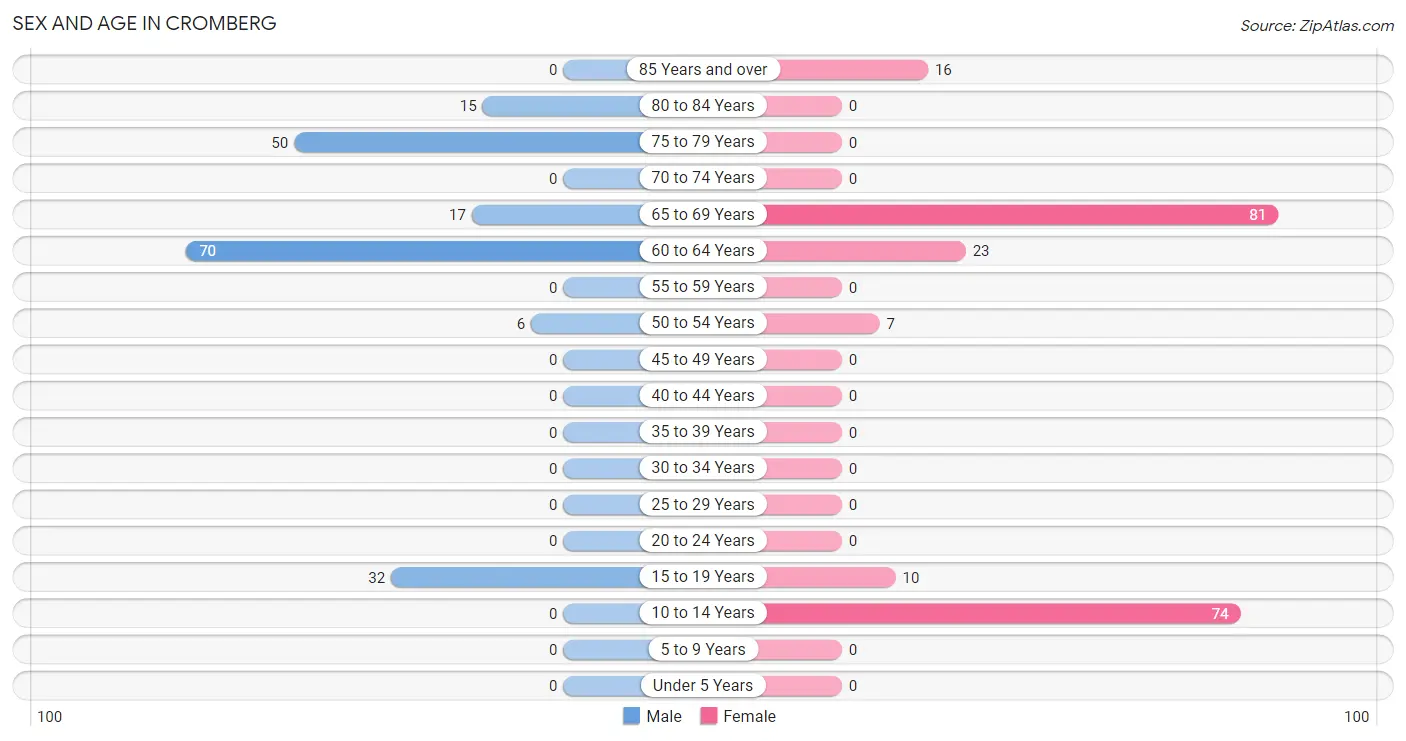
Sex and Age in Cromberg
Sex and Age in Cromberg
The most populous age groups in Cromberg are 60 to 64 Years (70 | 36.8%) for men and 65 to 69 Years (81 | 38.4%) for women.
| Age Bracket | Male | Female |
| Under 5 Years | 0 (0.0%) | 0 (0.0%) |
| 5 to 9 Years | 0 (0.0%) | 0 (0.0%) |
| 10 to 14 Years | 0 (0.0%) | 74 (35.1%) |
| 15 to 19 Years | 32 (16.8%) | 10 (4.7%) |
| 20 to 24 Years | 0 (0.0%) | 0 (0.0%) |
| 25 to 29 Years | 0 (0.0%) | 0 (0.0%) |
| 30 to 34 Years | 0 (0.0%) | 0 (0.0%) |
| 35 to 39 Years | 0 (0.0%) | 0 (0.0%) |
| 40 to 44 Years | 0 (0.0%) | 0 (0.0%) |
| 45 to 49 Years | 0 (0.0%) | 0 (0.0%) |
| 50 to 54 Years | 6 (3.2%) | 7 (3.3%) |
| 55 to 59 Years | 0 (0.0%) | 0 (0.0%) |
| 60 to 64 Years | 70 (36.8%) | 23 (10.9%) |
| 65 to 69 Years | 17 (8.9%) | 81 (38.4%) |
| 70 to 74 Years | 0 (0.0%) | 0 (0.0%) |
| 75 to 79 Years | 50 (26.3%) | 0 (0.0%) |
| 80 to 84 Years | 15 (7.9%) | 0 (0.0%) |
| 85 Years and over | 0 (0.0%) | 16 (7.6%) |
| Total | 190 (100.0%) | 211 (100.0%) |
Families and Households in Cromberg
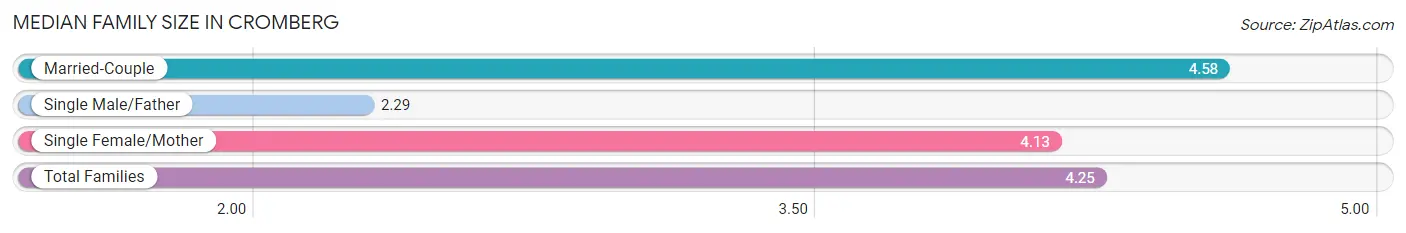
Median Family Size in Cromberg
The median family size in Cromberg is 4.25 persons per family, with married-couple families (48 | 67.6%) accounting for the largest median family size of 4.58 persons per family. On the other hand, single male/father families (7 | 9.9%) represent the smallest median family size with 2.29 persons per family.
| Family Type | # Families | Family Size |
| Married-Couple | 48 (67.6%) | 4.58 |
| Single Male/Father | 7 (9.9%) | 2.29 |
| Single Female/Mother | 16 (22.5%) | 4.13 |
| Total Families | 71 (100.0%) | 4.25 |
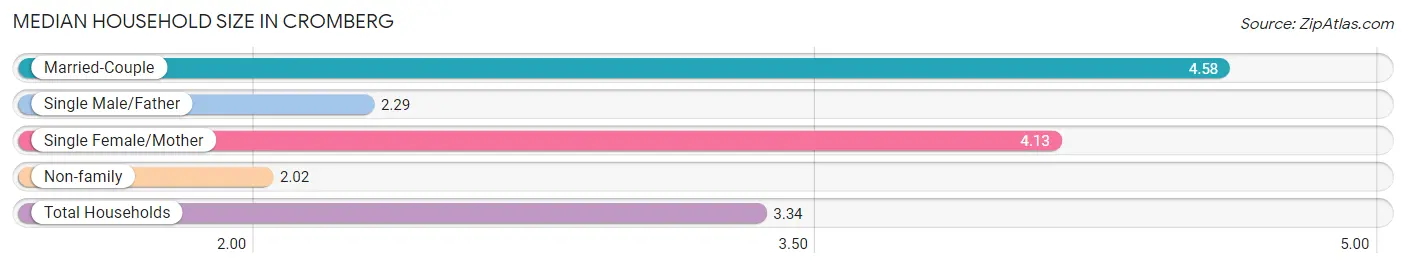
Median Household Size in Cromberg
The median household size in Cromberg is 3.34 persons per household, with married-couple households (48 | 40.0%) accounting for the largest median household size of 4.58 persons per household. non-family households (49 | 40.8%) represent the smallest median household size with 2.02 persons per household.
| Household Type | # Households | Household Size |
| Married-Couple | 48 (40.0%) | 4.58 |
| Single Male/Father | 7 (5.8%) | 2.29 |
| Single Female/Mother | 16 (13.3%) | 4.13 |
| Non-family | 49 (40.8%) | 2.02 |
| Total Households | 120 (100.0%) | 3.34 |
Household Size by Marriage Status in Cromberg
Out of a total of 120 households in Cromberg, 71 (59.2%) are family households, while 49 (40.8%) are nonfamily households. The most numerous type of family households are 2-person households, comprising 49, and the most common type of nonfamily households are 2-person households, comprising 30.
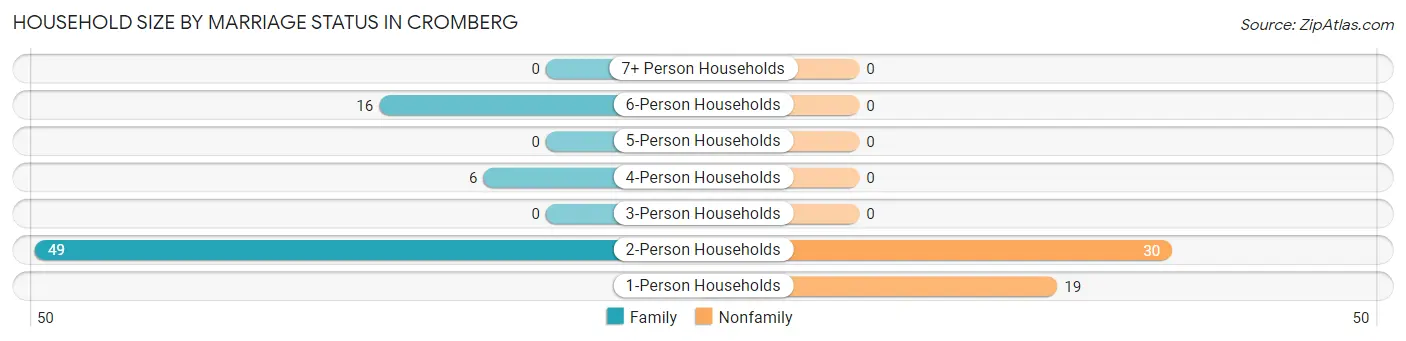
| Household Size | Family Households | Nonfamily Households |
| 1-Person Households | - | 19 (15.8%) |
| 2-Person Households | 49 (40.8%) | 30 (25.0%) |
| 3-Person Households | 0 (0.0%) | 0 (0.0%) |
| 4-Person Households | 6 (5.0%) | 0 (0.0%) |
| 5-Person Households | 0 (0.0%) | 0 (0.0%) |
| 6-Person Households | 16 (13.3%) | 0 (0.0%) |
| 7+ Person Households | 0 (0.0%) | 0 (0.0%) |
| Total | 71 (59.2%) | 49 (40.8%) |
Female Fertility in Cromberg
Fertility by Age in Cromberg
| Age Bracket | Women with Births | Births / 1,000 Women |
| 15 to 19 years | 0 (0.0%) | 0.0 |
| 20 to 34 years | 0 (0.0%) | 0.0 |
| 35 to 50 years | 0 (0.0%) | 0.0 |
| Total | 0 (0.0%) | 0.0 |
Fertility by Age by Marriage Status in Cromberg
| Age Bracket | Married | Unmarried |
| 15 to 19 years | 0 (0.0%) | 0 (0.0%) |
| 20 to 34 years | 0 (0.0%) | 0 (0.0%) |
| 35 to 50 years | 0 (0.0%) | 0 (0.0%) |
| Total | 0 (0.0%) | 0 (0.0%) |
Fertility by Education in Cromberg
| Educational Attainment | Women with Births | Births / 1,000 Women |
| Less than High School | 0 (0.0%) | 0.0 |
| High School Diploma | 0 (0.0%) | 0.0 |
| College or Associate's Degree | 0 (0.0%) | 0.0 |
| Bachelor's Degree | 0 (0.0%) | 0.0 |
| Graduate Degree | 0 (0.0%) | 0.0 |
| Total | 0 (0.0%) | 0.0 |
Fertility by Education by Marriage Status in Cromberg
| Educational Attainment | Married | Unmarried |
| Less than High School | 0 (0.0%) | 0 (0.0%) |
| High School Diploma | 0 (0.0%) | 0 (0.0%) |
| College or Associate's Degree | 0 (0.0%) | 0 (0.0%) |
| Bachelor's Degree | 0 (0.0%) | 0 (0.0%) |
| Graduate Degree | 0 (0.0%) | 0 (0.0%) |
| Total | 0 (0.0%) | 0 (0.0%) |
Employment Characteristics in Cromberg
Employment by Class of Employer in Cromberg
Among the 112 employed individuals in Cromberg, private company employees (61 | 54.5%), not-for-profit organizations (25 | 22.3%), and self-employed (not incorporated) (14 | 12.5%) make up the most common classes of employment.
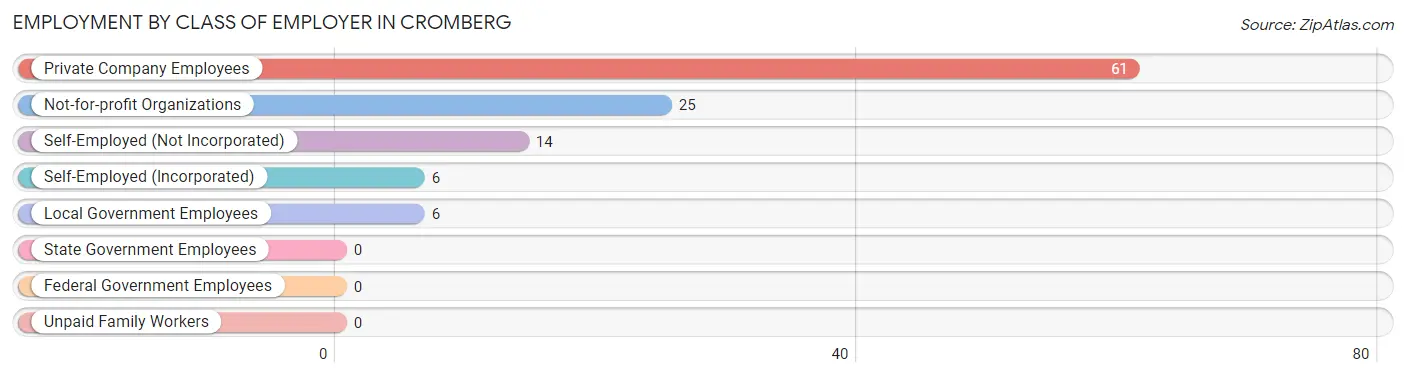
| Employer Class | # Employees | % Employees |
| Private Company Employees | 61 | 54.5% |
| Self-Employed (Incorporated) | 6 | 5.4% |
| Self-Employed (Not Incorporated) | 14 | 12.5% |
| Not-for-profit Organizations | 25 | 22.3% |
| Local Government Employees | 6 | 5.4% |
| State Government Employees | 0 | 0.0% |
| Federal Government Employees | 0 | 0.0% |
| Unpaid Family Workers | 0 | 0.0% |
| Total | 112 | 100.0% |
Employment Status by Age in Cromberg
According to the labor force statistics for Cromberg, out of the total population over 16 years of age (317), 40.7% or 129 individuals are in the labor force, with 13.2% or 17 of them unemployed. The age group with the highest labor force participation rate is 45 to 54 years, with 100.0% or 13 individuals in the labor force. Within the labor force, the 60 to 64 years age range has the highest percentage of unemployed individuals, with 23.0% or 17 of them being unemployed.
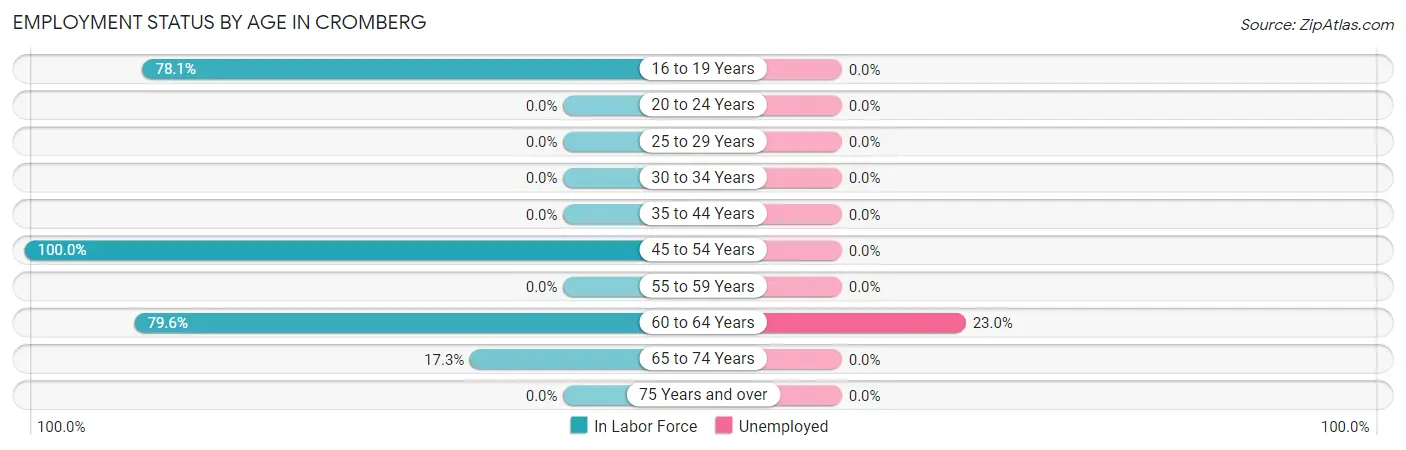
| Age Bracket | In Labor Force | Unemployed |
| 16 to 19 Years | 25 (78.1%) | 0 (0.0%) |
| 20 to 24 Years | 0 (0.0%) | 0 (0.0%) |
| 25 to 29 Years | 0 (0.0%) | 0 (0.0%) |
| 30 to 34 Years | 0 (0.0%) | 0 (0.0%) |
| 35 to 44 Years | 0 (0.0%) | 0 (0.0%) |
| 45 to 54 Years | 13 (100.0%) | 0 (0.0%) |
| 55 to 59 Years | 0 (0.0%) | 0 (0.0%) |
| 60 to 64 Years | 74 (79.6%) | 17 (23.0%) |
| 65 to 74 Years | 17 (17.3%) | 0 (0.0%) |
| 75 Years and over | 0 (0.0%) | 0 (0.0%) |
| Total | 129 (40.7%) | 17 (13.2%) |
Employment Status by Educational Attainment in Cromberg
According to labor force statistics for Cromberg, 82.1% of individuals (87) out of the total population between 25 and 64 years of age (106) are in the labor force, with 19.5% or 17 of them being unemployed. The group with the highest labor force participation rate are those with the educational attainment of high school diploma, with 100.0% or 44 individuals in the labor force. Within the labor force, individuals with bachelor's degree or higher education have the highest percentage of unemployment, with 47.2% or 17 of them being unemployed.
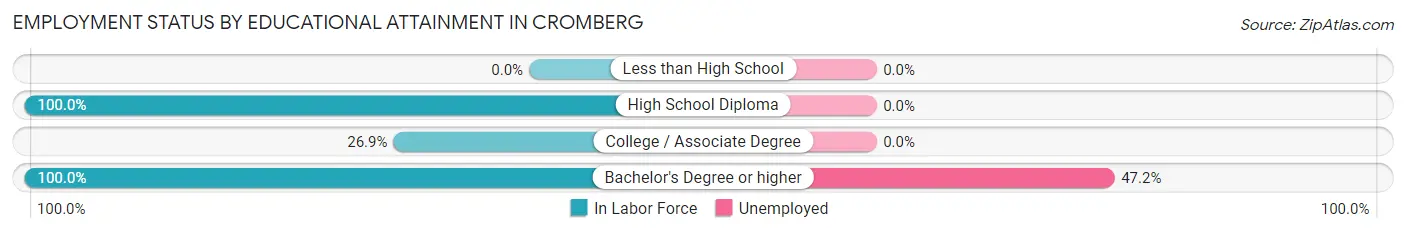
| Educational Attainment | In Labor Force | Unemployed |
| Less than High School | 0 (0.0%) | 0 (0.0%) |
| High School Diploma | 44 (100.0%) | 0 (0.0%) |
| College / Associate Degree | 7 (26.9%) | 0 (0.0%) |
| Bachelor's Degree or higher | 36 (100.0%) | 17 (47.2%) |
| Total | 87 (82.1%) | 21 (19.5%) |
Employment Occupations by Sex in Cromberg
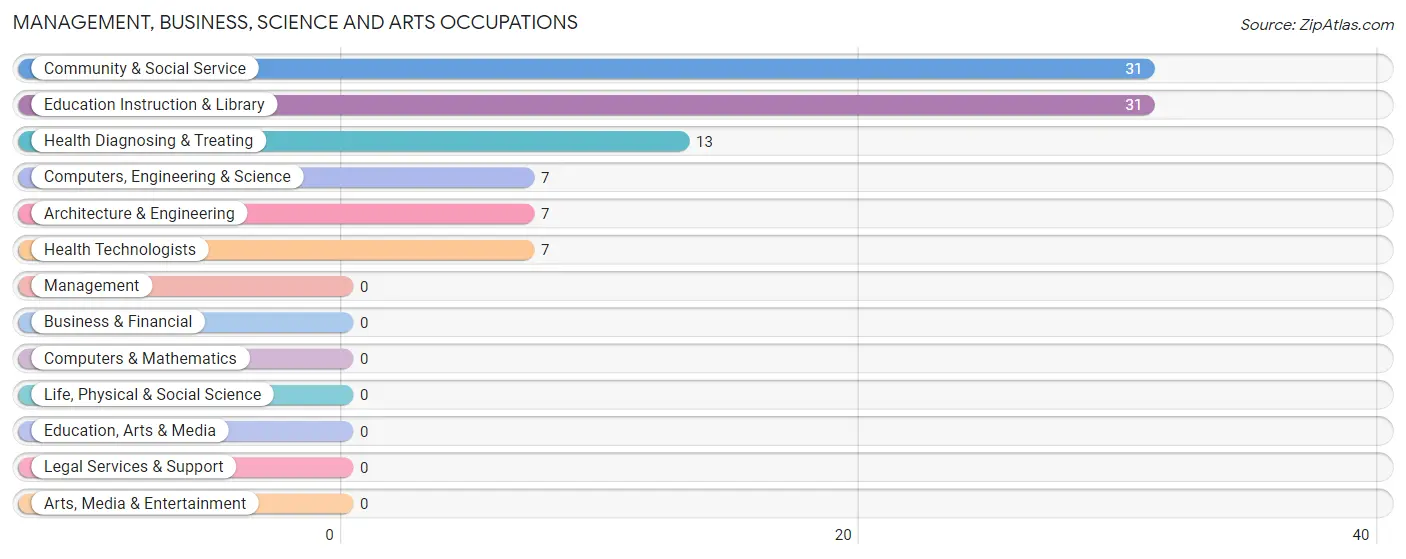
Management, Business, Science and Arts Occupations
The most common Management, Business, Science and Arts occupations in Cromberg are Community & Social Service (31 | 27.7%), Education Instruction & Library (31 | 27.7%), Health Diagnosing & Treating (13 | 11.6%), Computers, Engineering & Science (7 | 6.2%), and Architecture & Engineering (7 | 6.2%).
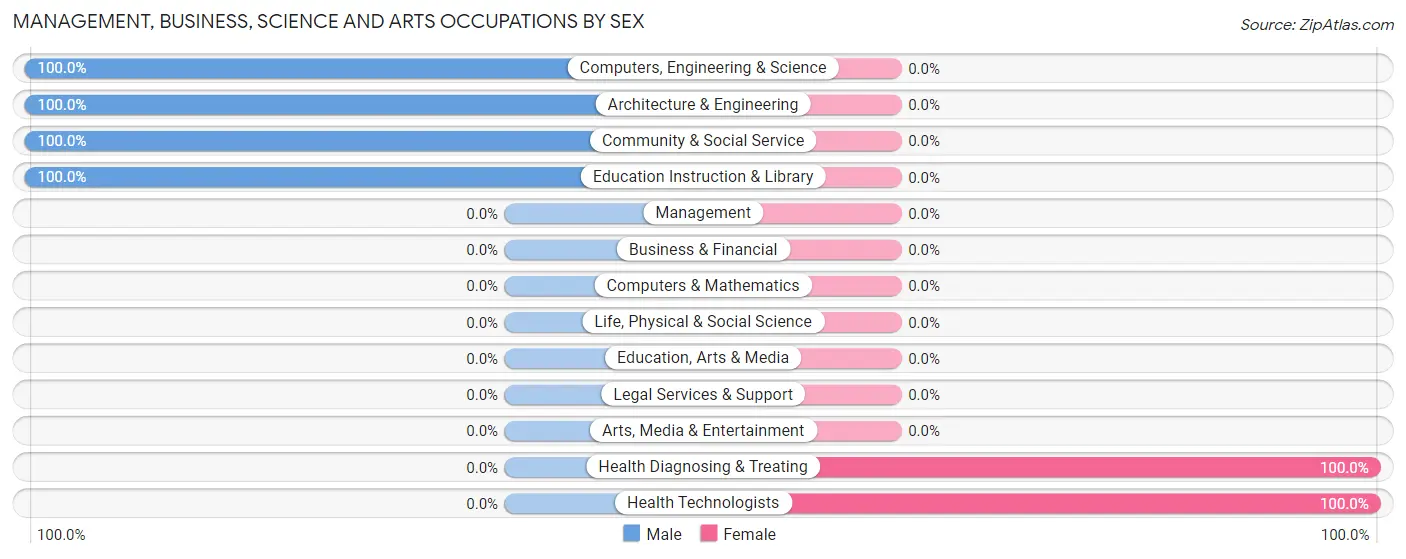
Management, Business, Science and Arts Occupations by Sex
Within the Management, Business, Science and Arts occupations in Cromberg, the most male-oriented occupations are Computers, Engineering & Science (100.0%), Architecture & Engineering (100.0%), and Community & Social Service (100.0%), while the most female-oriented occupations are Health Diagnosing & Treating (100.0%), and Health Technologists (100.0%).
| Occupation | Male | Female |
| Management | 0 (0.0%) | 0 (0.0%) |
| Business & Financial | 0 (0.0%) | 0 (0.0%) |
| Computers, Engineering & Science | 7 (100.0%) | 0 (0.0%) |
| Computers & Mathematics | 0 (0.0%) | 0 (0.0%) |
| Architecture & Engineering | 7 (100.0%) | 0 (0.0%) |
| Life, Physical & Social Science | 0 (0.0%) | 0 (0.0%) |
| Community & Social Service | 31 (100.0%) | 0 (0.0%) |
| Education, Arts & Media | 0 (0.0%) | 0 (0.0%) |
| Legal Services & Support | 0 (0.0%) | 0 (0.0%) |
| Education Instruction & Library | 31 (100.0%) | 0 (0.0%) |
| Arts, Media & Entertainment | 0 (0.0%) | 0 (0.0%) |
| Health Diagnosing & Treating | 0 (0.0%) | 13 (100.0%) |
| Health Technologists | 0 (0.0%) | 7 (100.0%) |
| Total (Category) | 38 (74.5%) | 13 (25.5%) |
| Total (Overall) | 99 (88.4%) | 13 (11.6%) |
Services Occupations
Services Occupations by Sex
| Occupation | Male | Female |
| Healthcare Support | 0 (0.0%) | 0 (0.0%) |
| Security & Protection | 0 (0.0%) | 0 (0.0%) |
| Firefighting & Prevention | 0 (0.0%) | 0 (0.0%) |
| Law Enforcement | 0 (0.0%) | 0 (0.0%) |
| Food Preparation & Serving | 0 (0.0%) | 0 (0.0%) |
| Cleaning & Maintenance | 0 (0.0%) | 0 (0.0%) |
| Personal Care & Service | 0 (0.0%) | 0 (0.0%) |
| Total (Category) | 0 (0.0%) | 0 (0.0%) |
| Total (Overall) | 99 (88.4%) | 13 (11.6%) |
Sales and Office Occupations
Sales and Office Occupations by Sex
| Occupation | Male | Female |
| Sales & Related | 0 (0.0%) | 0 (0.0%) |
| Office & Administration | 0 (0.0%) | 0 (0.0%) |
| Total (Category) | 0 (0.0%) | 0 (0.0%) |
| Total (Overall) | 99 (88.4%) | 13 (11.6%) |
Natural Resources, Construction and Maintenance Occupations
The most common Natural Resources, Construction and Maintenance occupations in Cromberg are , and Installation, Maintenance & Repair (44 | 39.3%).
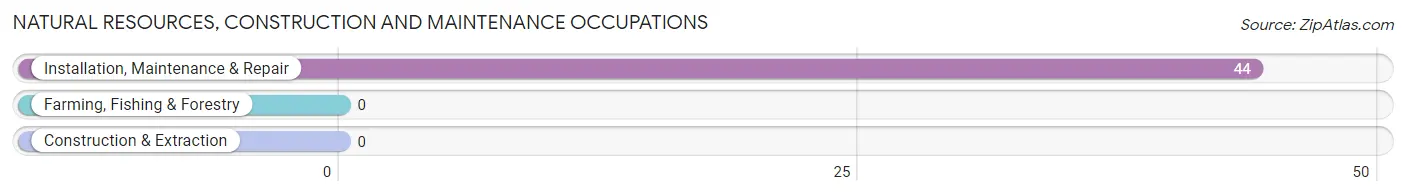
Natural Resources, Construction and Maintenance Occupations by Sex
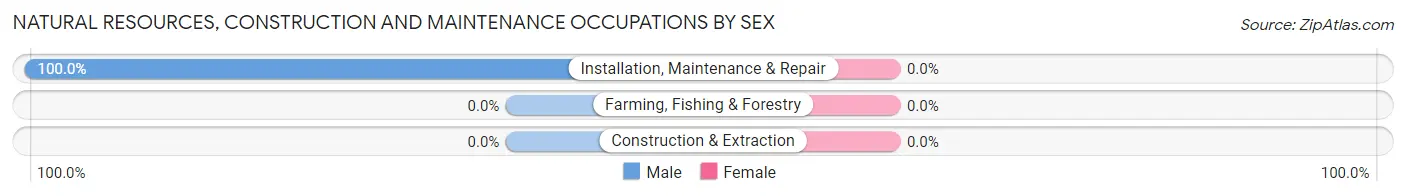
| Occupation | Male | Female |
| Farming, Fishing & Forestry | 0 (0.0%) | 0 (0.0%) |
| Construction & Extraction | 0 (0.0%) | 0 (0.0%) |
| Installation, Maintenance & Repair | 44 (100.0%) | 0 (0.0%) |
| Total (Category) | 44 (100.0%) | 0 (0.0%) |
| Total (Overall) | 99 (88.4%) | 13 (11.6%) |
Production, Transportation and Moving Occupations
The most common Production, Transportation and Moving occupations in Cromberg are , and Material Moving (17 | 15.2%).
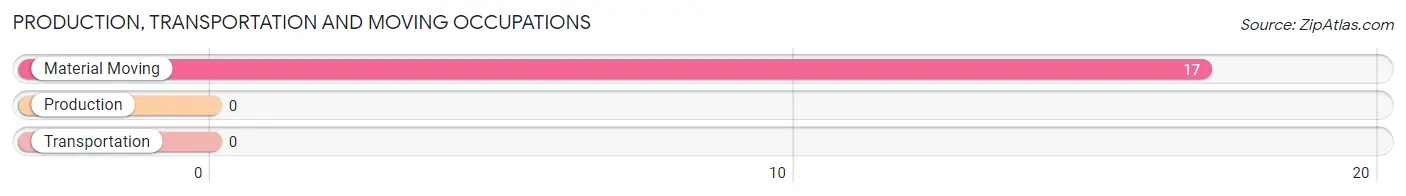
Production, Transportation and Moving Occupations by Sex
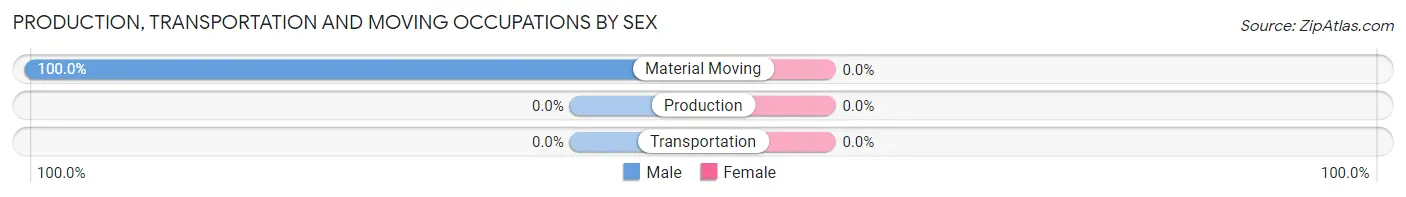
| Occupation | Male | Female |
| Production | 0 (0.0%) | 0 (0.0%) |
| Transportation | 0 (0.0%) | 0 (0.0%) |
| Material Moving | 17 (100.0%) | 0 (0.0%) |
| Total (Category) | 17 (100.0%) | 0 (0.0%) |
| Total (Overall) | 99 (88.4%) | 13 (11.6%) |
Employment Industries by Sex in Cromberg
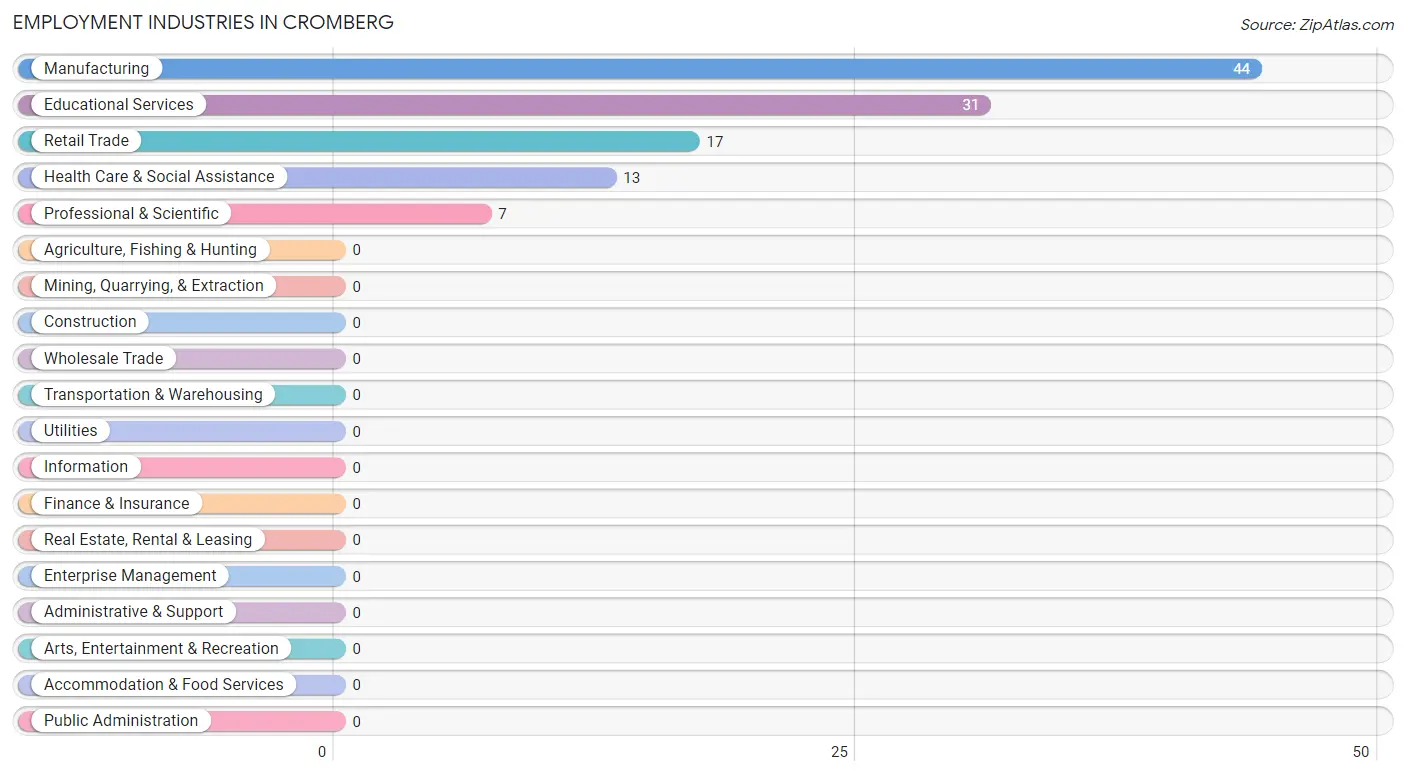
Employment Industries in Cromberg
The major employment industries in Cromberg include Manufacturing (44 | 39.3%), Educational Services (31 | 27.7%), Retail Trade (17 | 15.2%), Health Care & Social Assistance (13 | 11.6%), and Professional & Scientific (7 | 6.2%).
Employment Industries by Sex in Cromberg
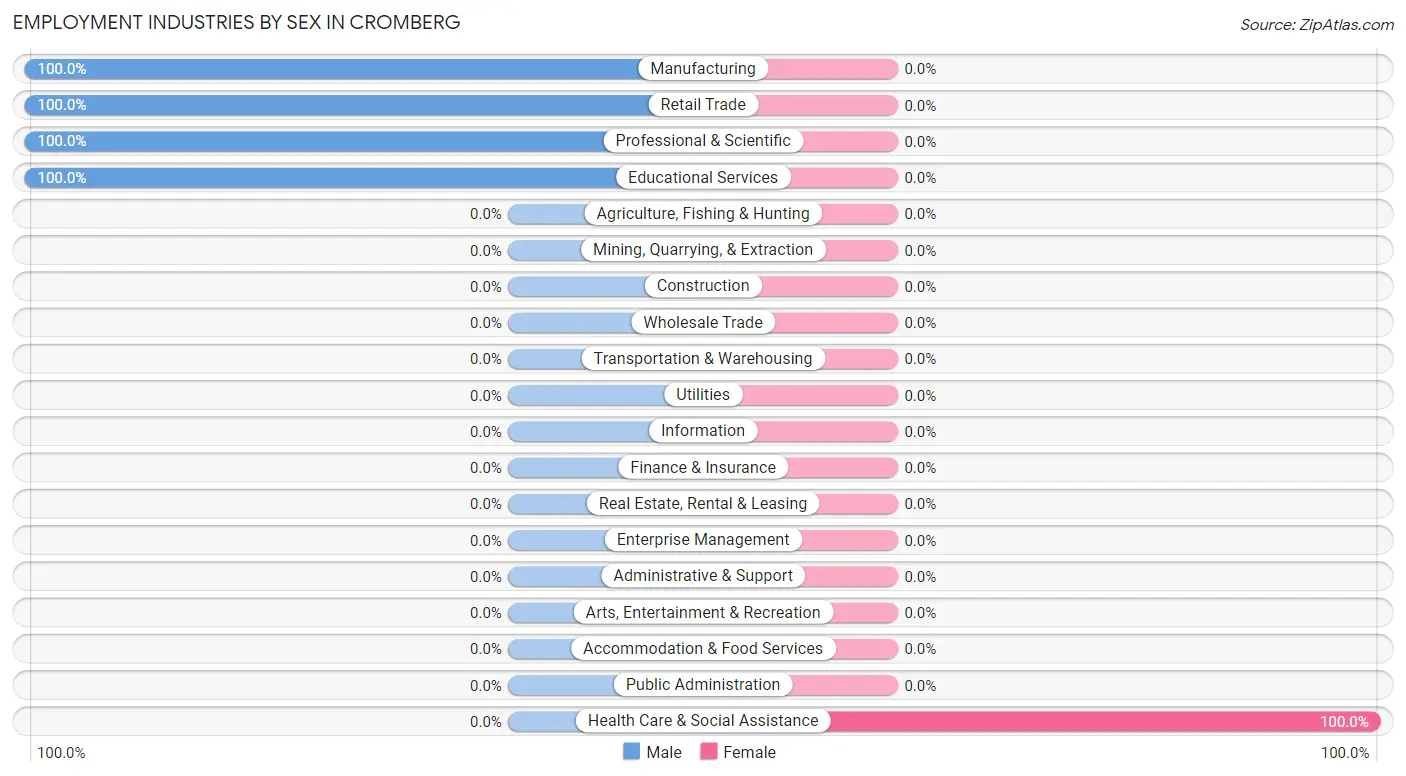
| Industry | Male | Female |
| Agriculture, Fishing & Hunting | 0 (0.0%) | 0 (0.0%) |
| Mining, Quarrying, & Extraction | 0 (0.0%) | 0 (0.0%) |
| Construction | 0 (0.0%) | 0 (0.0%) |
| Manufacturing | 44 (100.0%) | 0 (0.0%) |
| Wholesale Trade | 0 (0.0%) | 0 (0.0%) |
| Retail Trade | 17 (100.0%) | 0 (0.0%) |
| Transportation & Warehousing | 0 (0.0%) | 0 (0.0%) |
| Utilities | 0 (0.0%) | 0 (0.0%) |
| Information | 0 (0.0%) | 0 (0.0%) |
| Finance & Insurance | 0 (0.0%) | 0 (0.0%) |
| Real Estate, Rental & Leasing | 0 (0.0%) | 0 (0.0%) |
| Professional & Scientific | 7 (100.0%) | 0 (0.0%) |
| Enterprise Management | 0 (0.0%) | 0 (0.0%) |
| Administrative & Support | 0 (0.0%) | 0 (0.0%) |
| Educational Services | 31 (100.0%) | 0 (0.0%) |
| Health Care & Social Assistance | 0 (0.0%) | 13 (100.0%) |
| Arts, Entertainment & Recreation | 0 (0.0%) | 0 (0.0%) |
| Accommodation & Food Services | 0 (0.0%) | 0 (0.0%) |
| Public Administration | 0 (0.0%) | 0 (0.0%) |
| Total | 99 (88.4%) | 13 (11.6%) |
Education in Cromberg
School Enrollment in Cromberg
The most common levels of schooling among the 116 students in Cromberg are middle school (74 | 63.8%), college / undergraduate (25 | 21.5%), and high school (17 | 14.7%).

| School Level | # Students | % Students |
| Nursery / Preschool | 0 | 0.0% |
| Kindergarten | 0 | 0.0% |
| Elementary School | 0 | 0.0% |
| Middle School | 74 | 63.8% |
| High School | 17 | 14.7% |
| College / Undergraduate | 25 | 21.5% |
| Graduate / Professional | 0 | 0.0% |
| Total | 116 | 100.0% |
School Enrollment by Age by Funding Source in Cromberg
Out of a total of 116 students who are enrolled in schools in Cromberg, 74 (63.8%) attend a private institution, while the remaining 42 (36.2%) are enrolled in public schools. The age group of 18 to 19 year olds has the highest likelihood of being enrolled in private schools, with 25 (100.0% in the age bracket) enrolled. Conversely, the age group of 15 to 17 year olds has the lowest likelihood of being enrolled in a private school, with 17 (100.0% in the age bracket) attending a public institution.
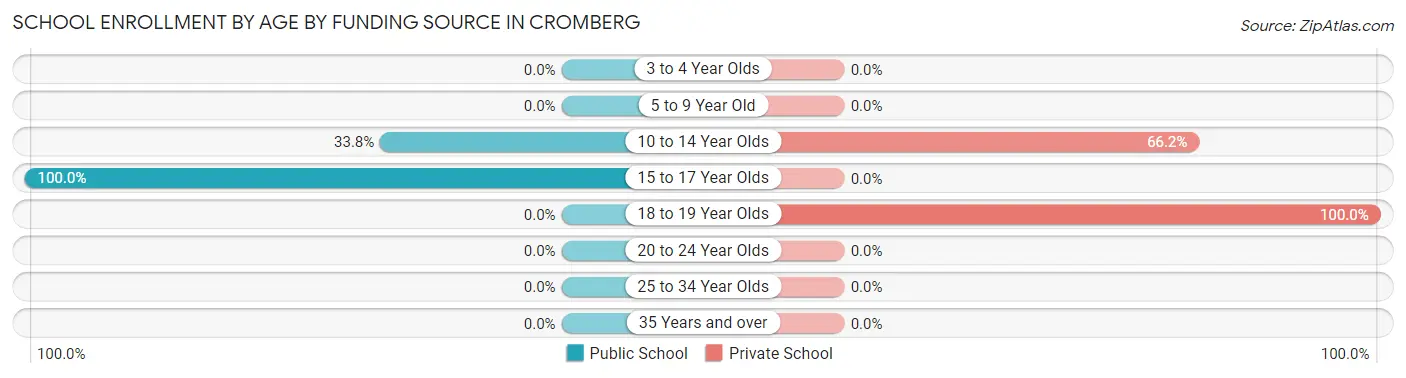
| Age Bracket | Public School | Private School |
| 3 to 4 Year Olds | 0 (0.0%) | 0 (0.0%) |
| 5 to 9 Year Old | 0 (0.0%) | 0 (0.0%) |
| 10 to 14 Year Olds | 25 (33.8%) | 49 (66.2%) |
| 15 to 17 Year Olds | 17 (100.0%) | 0 (0.0%) |
| 18 to 19 Year Olds | 0 (0.0%) | 25 (100.0%) |
| 20 to 24 Year Olds | 0 (0.0%) | 0 (0.0%) |
| 25 to 34 Year Olds | 0 (0.0%) | 0 (0.0%) |
| 35 Years and over | 0 (0.0%) | 0 (0.0%) |
| Total | 42 (36.2%) | 74 (63.8%) |
Educational Attainment by Field of Study in Cromberg
Psychology (17 | 32.7%), arts & humanities (16 | 30.8%), science & technology (7 | 13.5%), social sciences (6 | 11.5%), and education (6 | 11.5%) are the most common fields of study among 52 individuals in Cromberg who have obtained a bachelor's degree or higher.
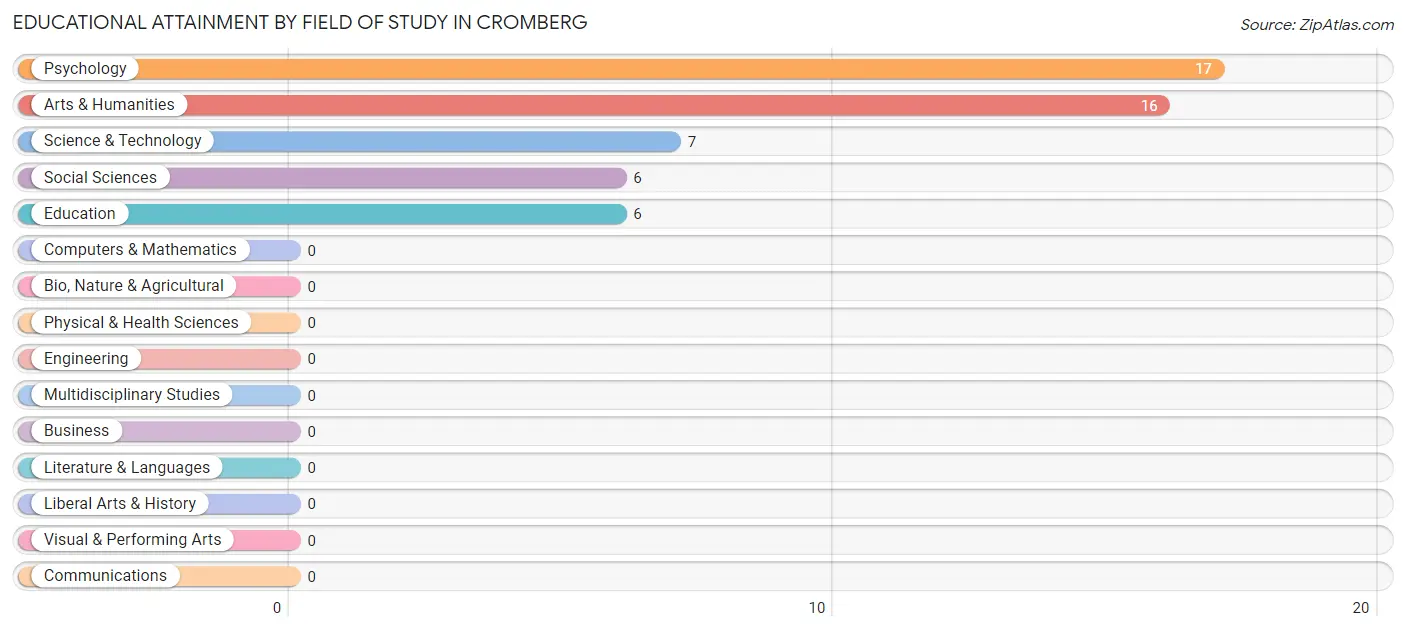
| Field of Study | # Graduates | % Graduates |
| Computers & Mathematics | 0 | 0.0% |
| Bio, Nature & Agricultural | 0 | 0.0% |
| Physical & Health Sciences | 0 | 0.0% |
| Psychology | 17 | 32.7% |
| Social Sciences | 6 | 11.5% |
| Engineering | 0 | 0.0% |
| Multidisciplinary Studies | 0 | 0.0% |
| Science & Technology | 7 | 13.5% |
| Business | 0 | 0.0% |
| Education | 6 | 11.5% |
| Literature & Languages | 0 | 0.0% |
| Liberal Arts & History | 0 | 0.0% |
| Visual & Performing Arts | 0 | 0.0% |
| Communications | 0 | 0.0% |
| Arts & Humanities | 16 | 30.8% |
| Total | 52 | 100.0% |
Transportation & Commute in Cromberg
Vehicle Availability by Sex in Cromberg
The most prevalent vehicle ownership categories in Cromberg are males with 3 vehicles (50, accounting for 50.5%) and females with 3 vehicles (7, making up 384.6%).
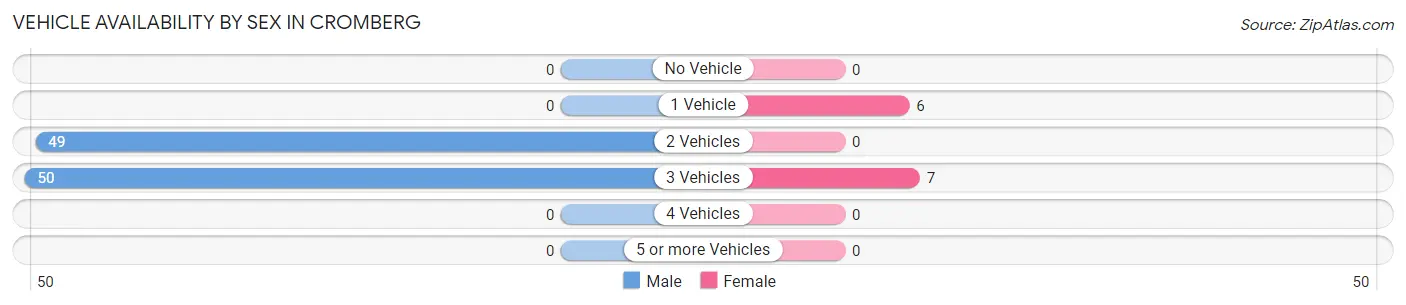
| Vehicles Available | Male | Female |
| No Vehicle | 0 (0.0%) | 0 (0.0%) |
| 1 Vehicle | 0 (0.0%) | 6 (46.2%) |
| 2 Vehicles | 49 (49.5%) | 0 (0.0%) |
| 3 Vehicles | 50 (50.5%) | 7 (53.8%) |
| 4 Vehicles | 0 (0.0%) | 0 (0.0%) |
| 5 or more Vehicles | 0 (0.0%) | 0 (0.0%) |
| Total | 99 (100.0%) | 13 (100.0%) |
Commute Time in Cromberg
The most frequently occuring commute durations in Cromberg are 10 to 14 minutes (44 commuters, 44.4%), 5 to 9 minutes (25 commuters, 25.3%), and 20 to 24 minutes (23 commuters, 23.2%).
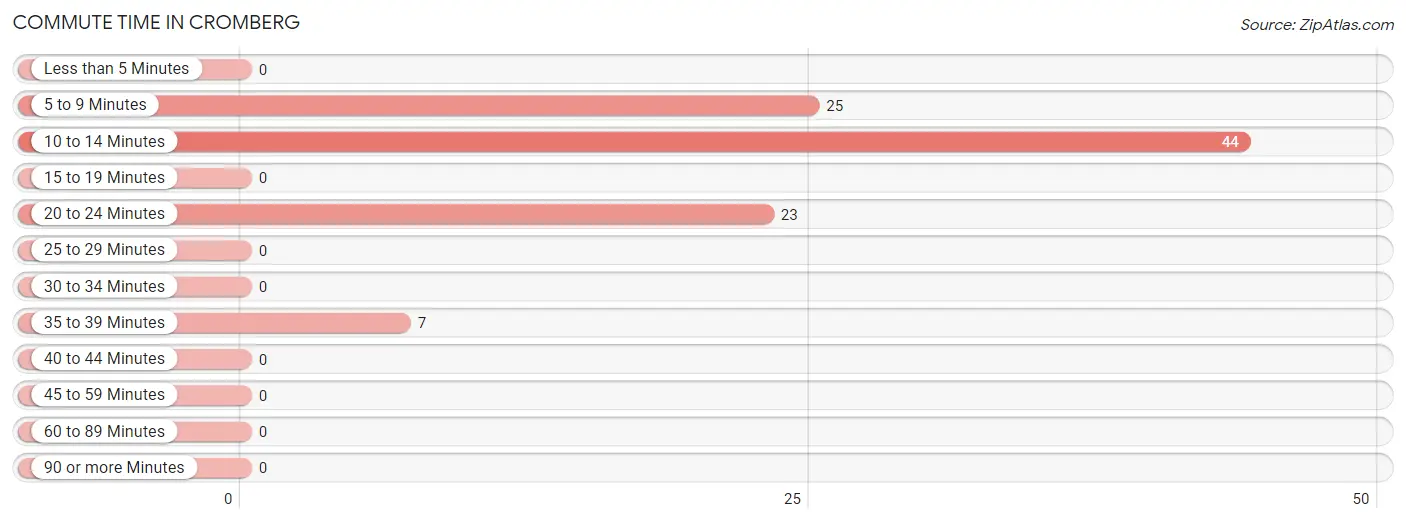
| Commute Time | # Commuters | % Commuters |
| Less than 5 Minutes | 0 | 0.0% |
| 5 to 9 Minutes | 25 | 25.3% |
| 10 to 14 Minutes | 44 | 44.4% |
| 15 to 19 Minutes | 0 | 0.0% |
| 20 to 24 Minutes | 23 | 23.2% |
| 25 to 29 Minutes | 0 | 0.0% |
| 30 to 34 Minutes | 0 | 0.0% |
| 35 to 39 Minutes | 7 | 7.1% |
| 40 to 44 Minutes | 0 | 0.0% |
| 45 to 59 Minutes | 0 | 0.0% |
| 60 to 89 Minutes | 0 | 0.0% |
| 90 or more Minutes | 0 | 0.0% |
Commute Time by Sex in Cromberg
The most common commute times in Cromberg are 10 to 14 minutes (44 commuters, 47.8%) for males and 35 to 39 minutes (7 commuters, 100.0%) for females.
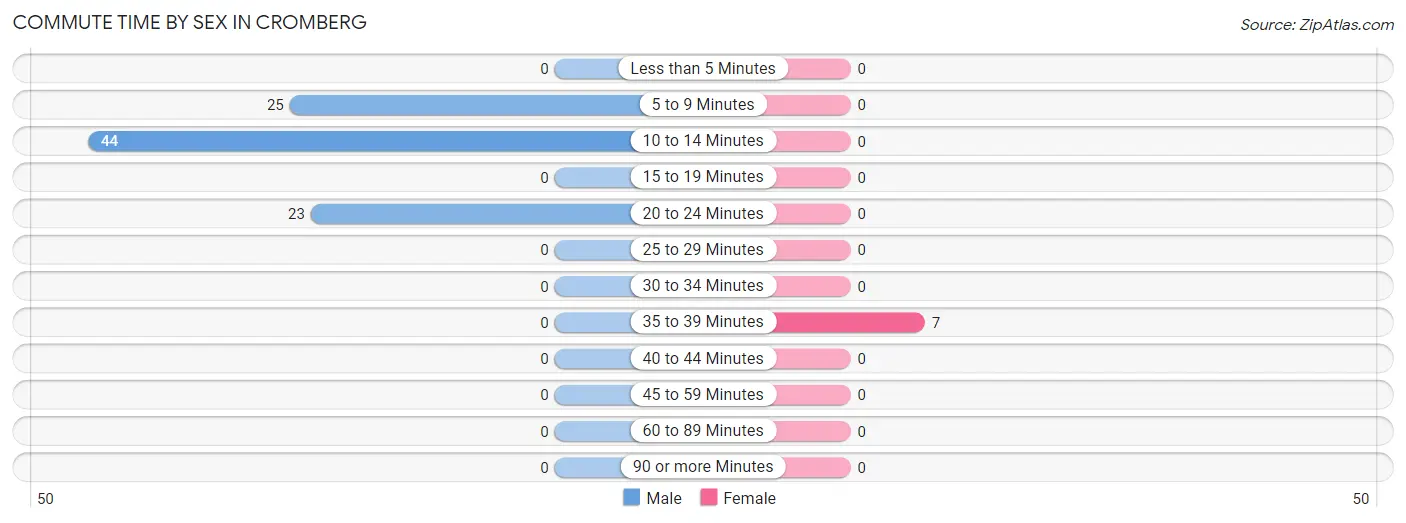
| Commute Time | Male | Female |
| Less than 5 Minutes | 0 (0.0%) | 0 (0.0%) |
| 5 to 9 Minutes | 25 (27.2%) | 0 (0.0%) |
| 10 to 14 Minutes | 44 (47.8%) | 0 (0.0%) |
| 15 to 19 Minutes | 0 (0.0%) | 0 (0.0%) |
| 20 to 24 Minutes | 23 (25.0%) | 0 (0.0%) |
| 25 to 29 Minutes | 0 (0.0%) | 0 (0.0%) |
| 30 to 34 Minutes | 0 (0.0%) | 0 (0.0%) |
| 35 to 39 Minutes | 0 (0.0%) | 7 (100.0%) |
| 40 to 44 Minutes | 0 (0.0%) | 0 (0.0%) |
| 45 to 59 Minutes | 0 (0.0%) | 0 (0.0%) |
| 60 to 89 Minutes | 0 (0.0%) | 0 (0.0%) |
| 90 or more Minutes | 0 (0.0%) | 0 (0.0%) |
Time of Departure to Work by Sex in Cromberg
The most frequent times of departure to work in Cromberg are 4:00 PM to 11:59 PM (44, 47.8%) for males and 7:30 AM to 7:59 AM (7, 100.0%) for females.
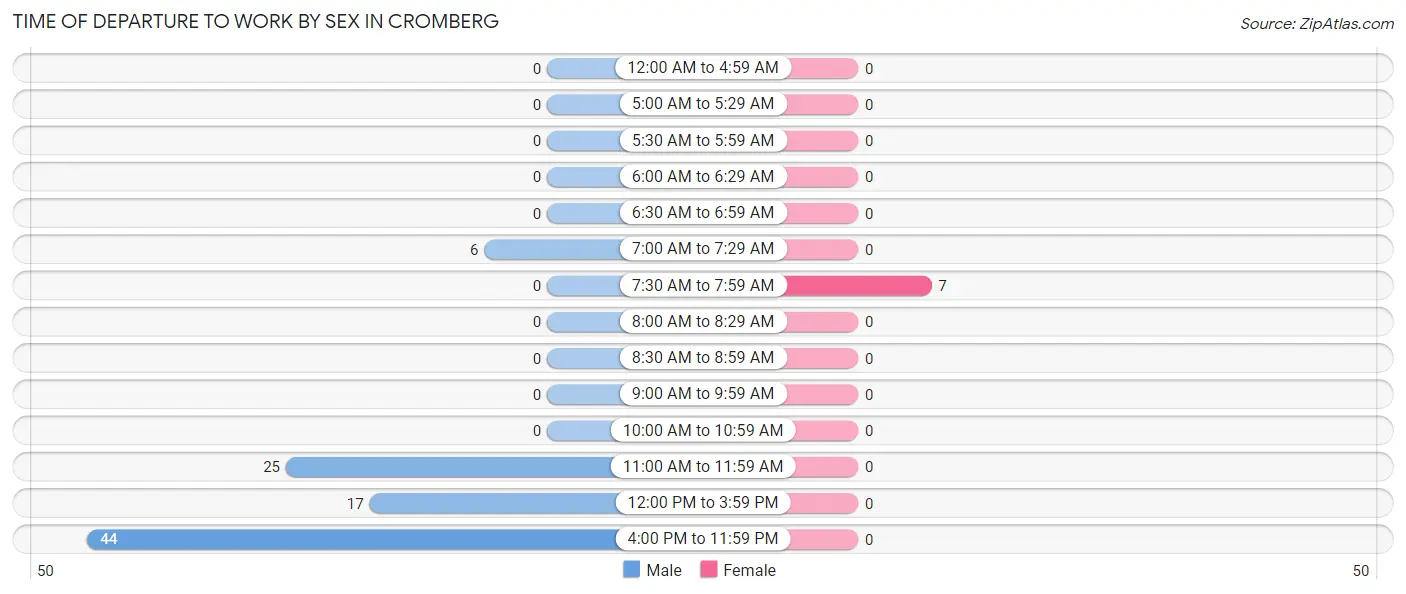
| Time of Departure | Male | Female |
| 12:00 AM to 4:59 AM | 0 (0.0%) | 0 (0.0%) |
| 5:00 AM to 5:29 AM | 0 (0.0%) | 0 (0.0%) |
| 5:30 AM to 5:59 AM | 0 (0.0%) | 0 (0.0%) |
| 6:00 AM to 6:29 AM | 0 (0.0%) | 0 (0.0%) |
| 6:30 AM to 6:59 AM | 0 (0.0%) | 0 (0.0%) |
| 7:00 AM to 7:29 AM | 6 (6.5%) | 0 (0.0%) |
| 7:30 AM to 7:59 AM | 0 (0.0%) | 7 (100.0%) |
| 8:00 AM to 8:29 AM | 0 (0.0%) | 0 (0.0%) |
| 8:30 AM to 8:59 AM | 0 (0.0%) | 0 (0.0%) |
| 9:00 AM to 9:59 AM | 0 (0.0%) | 0 (0.0%) |
| 10:00 AM to 10:59 AM | 0 (0.0%) | 0 (0.0%) |
| 11:00 AM to 11:59 AM | 25 (27.2%) | 0 (0.0%) |
| 12:00 PM to 3:59 PM | 17 (18.5%) | 0 (0.0%) |
| 4:00 PM to 11:59 PM | 44 (47.8%) | 0 (0.0%) |
| Total | 92 (100.0%) | 7 (100.0%) |
Housing Occupancy in Cromberg
Occupancy by Ownership in Cromberg
Of the total 120 dwellings in Cromberg, owner-occupied units account for 120 (100.0%), while renter-occupied units make up 0 (0.0%).
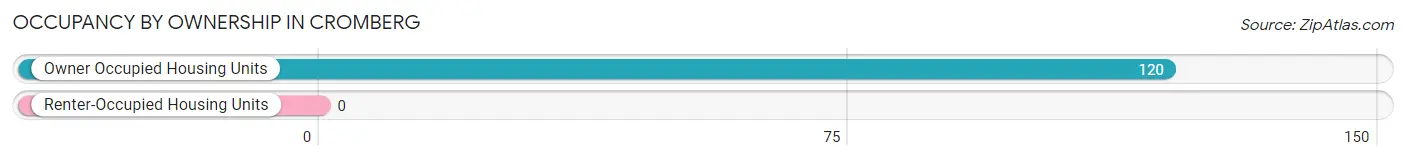
| Occupancy | # Housing Units | % Housing Units |
| Owner Occupied Housing Units | 120 | 100.0% |
| Renter-Occupied Housing Units | 0 | 0.0% |
| Total Occupied Housing Units | 120 | 100.0% |
Occupancy by Household Size in Cromberg
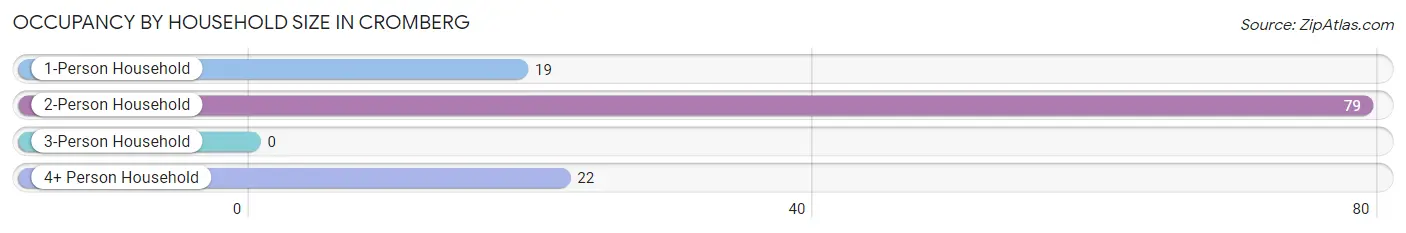
| Household Size | # Housing Units | % Housing Units |
| 1-Person Household | 19 | 15.8% |
| 2-Person Household | 79 | 65.8% |
| 3-Person Household | 0 | 0.0% |
| 4+ Person Household | 22 | 18.3% |
| Total Housing Units | 120 | 100.0% |
Occupancy by Ownership by Household Size in Cromberg
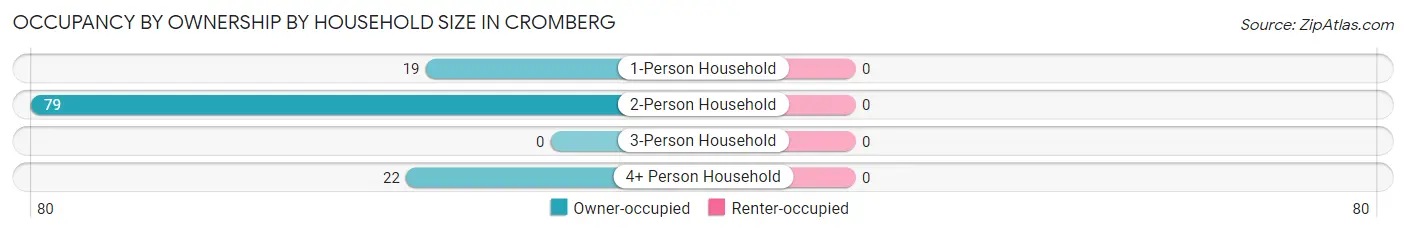
| Household Size | Owner-occupied | Renter-occupied |
| 1-Person Household | 19 (100.0%) | 0 (0.0%) |
| 2-Person Household | 79 (100.0%) | 0 (0.0%) |
| 3-Person Household | 0 (0.0%) | 0 (0.0%) |
| 4+ Person Household | 22 (100.0%) | 0 (0.0%) |
| Total Housing Units | 120 (100.0%) | 0 (0.0%) |
Occupancy by Educational Attainment in Cromberg
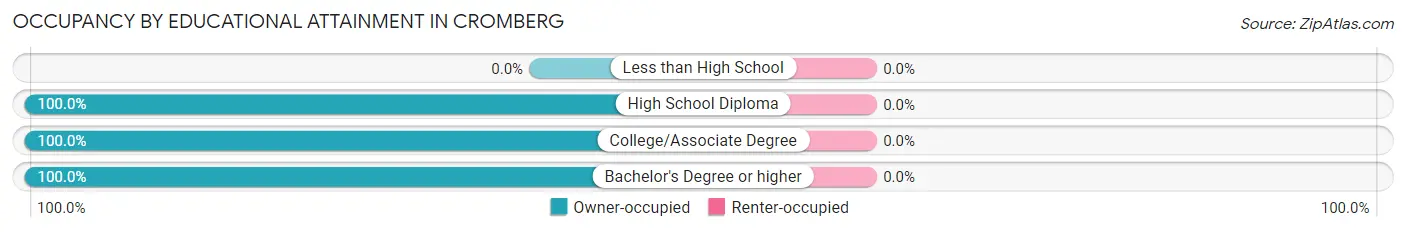
| Household Size | Owner-occupied | Renter-occupied |
| Less than High School | 0 (0.0%) | 0 (0.0%) |
| High School Diploma | 16 (100.0%) | 0 (0.0%) |
| College/Associate Degree | 76 (100.0%) | 0 (0.0%) |
| Bachelor's Degree or higher | 28 (100.0%) | 0 (0.0%) |
Occupancy by Age of Householder in Cromberg
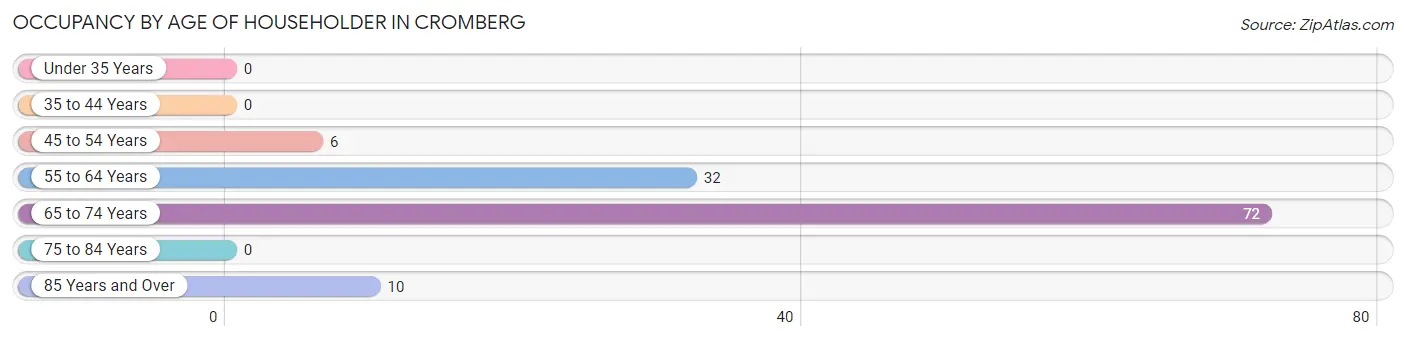
| Age Bracket | # Households | % Households |
| Under 35 Years | 0 | 0.0% |
| 35 to 44 Years | 0 | 0.0% |
| 45 to 54 Years | 6 | 5.0% |
| 55 to 64 Years | 32 | 26.7% |
| 65 to 74 Years | 72 | 60.0% |
| 75 to 84 Years | 0 | 0.0% |
| 85 Years and Over | 10 | 8.3% |
| Total | 120 | 100.0% |
Housing Finances in Cromberg
Median Income by Occupancy in Cromberg
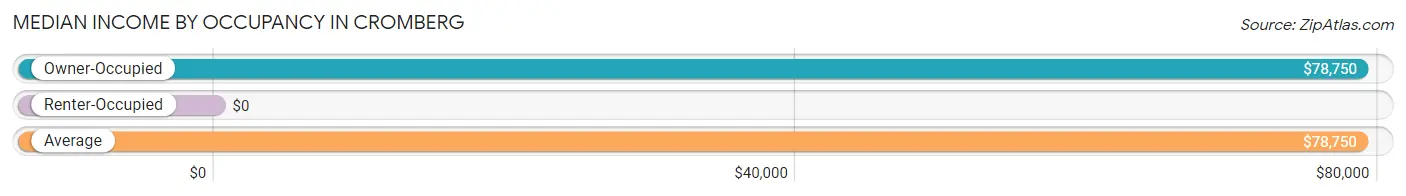
| Occupancy Type | # Households | Median Income |
| Owner-Occupied | 120 (100.0%) | $78,750 |
| Renter-Occupied | 0 (0.0%) | $0 |
| Average | 120 (100.0%) | $78,750 |
Occupancy by Householder Income Bracket in Cromberg
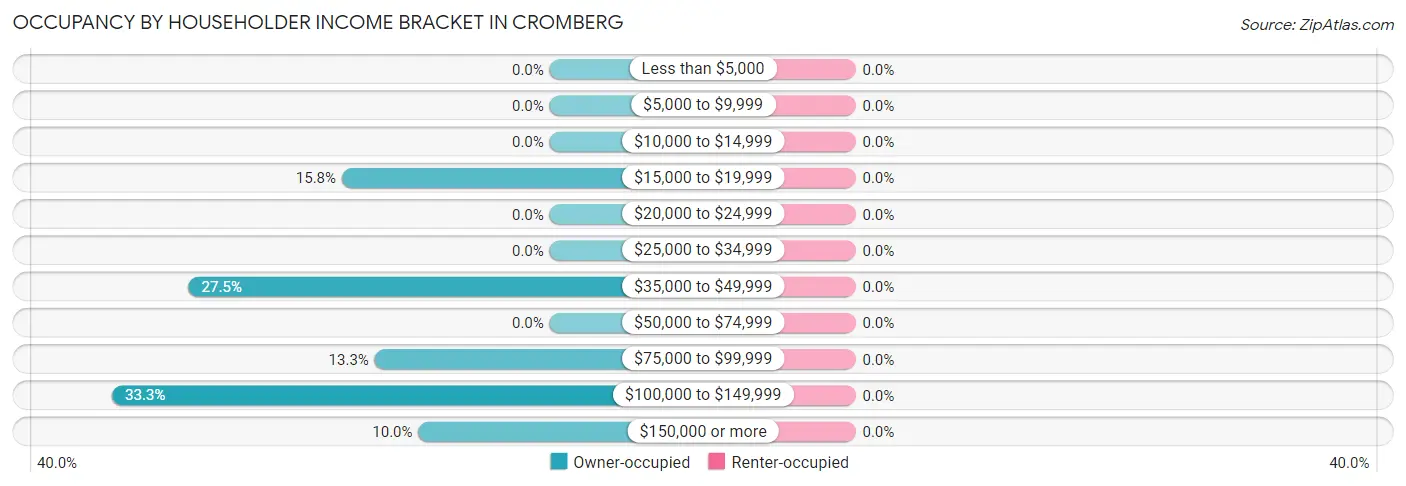
| Income Bracket | Owner-occupied | Renter-occupied |
| Less than $5,000 | 0 (0.0%) | 0 (0.0%) |
| $5,000 to $9,999 | 0 (0.0%) | 0 (0.0%) |
| $10,000 to $14,999 | 0 (0.0%) | 0 (0.0%) |
| $15,000 to $19,999 | 19 (15.8%) | 0 (0.0%) |
| $20,000 to $24,999 | 0 (0.0%) | 0 (0.0%) |
| $25,000 to $34,999 | 0 (0.0%) | 0 (0.0%) |
| $35,000 to $49,999 | 33 (27.5%) | 0 (0.0%) |
| $50,000 to $74,999 | 0 (0.0%) | 0 (0.0%) |
| $75,000 to $99,999 | 16 (13.3%) | 0 (0.0%) |
| $100,000 to $149,999 | 40 (33.3%) | 0 (0.0%) |
| $150,000 or more | 12 (10.0%) | 0 (0.0%) |
| Total | 120 (100.0%) | 0 (0.0%) |
Monthly Housing Cost Tiers in Cromberg
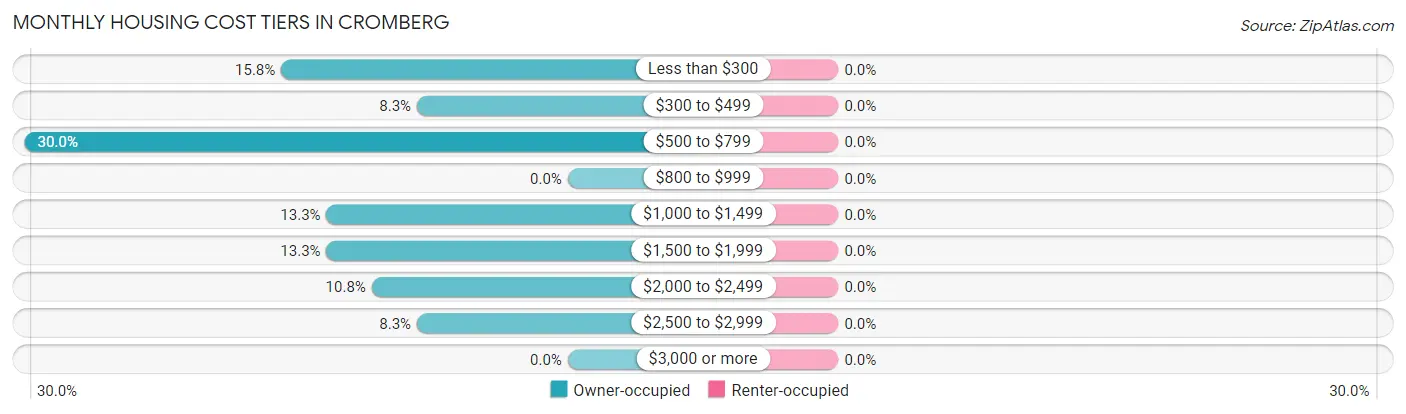
| Monthly Cost | Owner-occupied | Renter-occupied |
| Less than $300 | 19 (15.8%) | 0 (0.0%) |
| $300 to $499 | 10 (8.3%) | 0 (0.0%) |
| $500 to $799 | 36 (30.0%) | 0 (0.0%) |
| $800 to $999 | 0 (0.0%) | 0 (0.0%) |
| $1,000 to $1,499 | 16 (13.3%) | 0 (0.0%) |
| $1,500 to $1,999 | 16 (13.3%) | 0 (0.0%) |
| $2,000 to $2,499 | 13 (10.8%) | 0 (0.0%) |
| $2,500 to $2,999 | 10 (8.3%) | 0 (0.0%) |
| $3,000 or more | 0 (0.0%) | 0 (0.0%) |
| Total | 120 (100.0%) | 0 (0.0%) |
Physical Housing Characteristics in Cromberg
Housing Structures in Cromberg
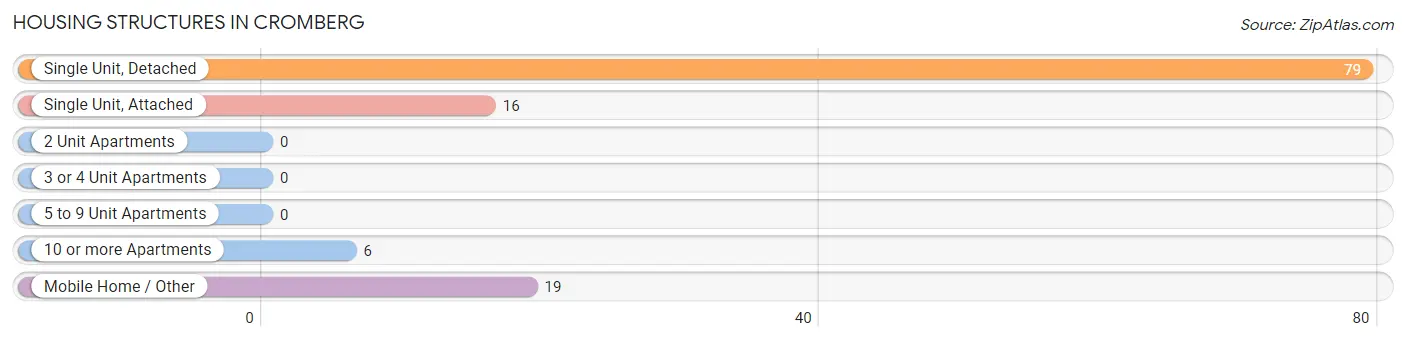
| Structure Type | # Housing Units | % Housing Units |
| Single Unit, Detached | 79 | 65.8% |
| Single Unit, Attached | 16 | 13.3% |
| 2 Unit Apartments | 0 | 0.0% |
| 3 or 4 Unit Apartments | 0 | 0.0% |
| 5 to 9 Unit Apartments | 0 | 0.0% |
| 10 or more Apartments | 6 | 5.0% |
| Mobile Home / Other | 19 | 15.8% |
| Total | 120 | 100.0% |
Housing Structures by Occupancy in Cromberg
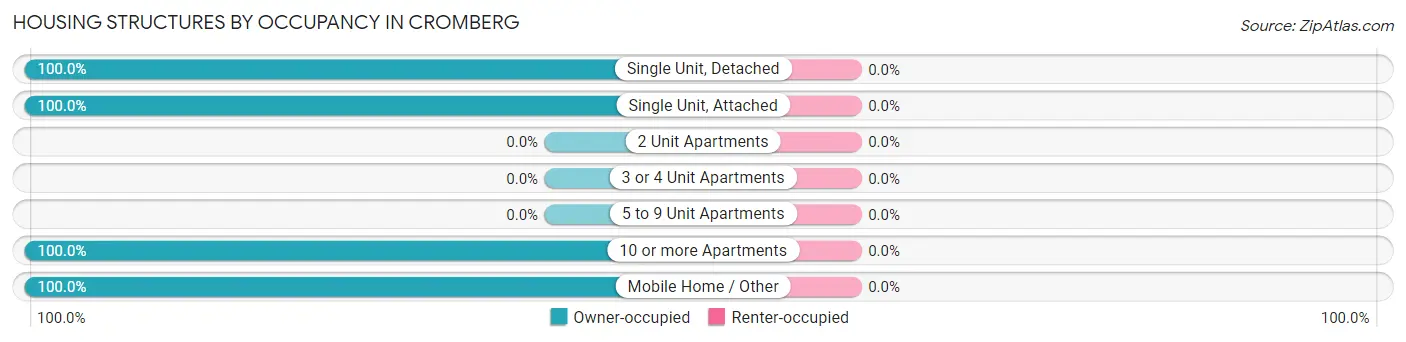
| Structure Type | Owner-occupied | Renter-occupied |
| Single Unit, Detached | 79 (100.0%) | 0 (0.0%) |
| Single Unit, Attached | 16 (100.0%) | 0 (0.0%) |
| 2 Unit Apartments | 0 (0.0%) | 0 (0.0%) |
| 3 or 4 Unit Apartments | 0 (0.0%) | 0 (0.0%) |
| 5 to 9 Unit Apartments | 0 (0.0%) | 0 (0.0%) |
| 10 or more Apartments | 6 (100.0%) | 0 (0.0%) |
| Mobile Home / Other | 19 (100.0%) | 0 (0.0%) |
| Total | 120 (100.0%) | 0 (0.0%) |
Housing Structures by Number of Rooms in Cromberg
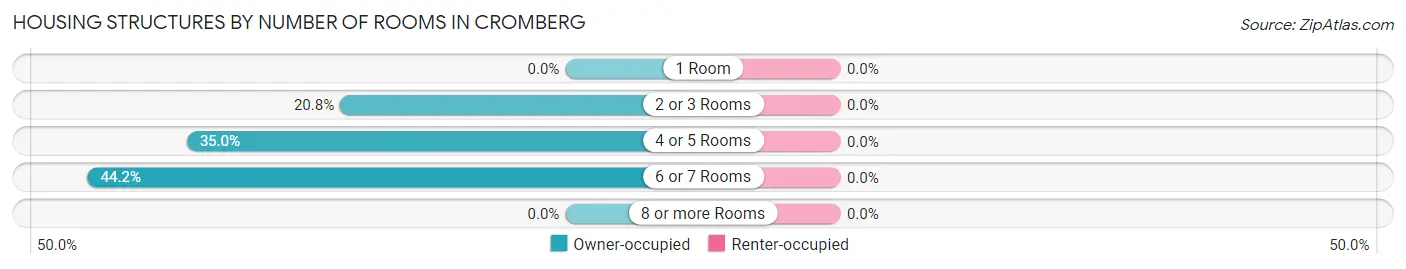
| Number of Rooms | Owner-occupied | Renter-occupied |
| 1 Room | 0 (0.0%) | 0 (0.0%) |
| 2 or 3 Rooms | 25 (20.8%) | 0 (0.0%) |
| 4 or 5 Rooms | 42 (35.0%) | 0 (0.0%) |
| 6 or 7 Rooms | 53 (44.2%) | 0 (0.0%) |
| 8 or more Rooms | 0 (0.0%) | 0 (0.0%) |
| Total | 120 (100.0%) | 0 (0.0%) |
Housing Structure by Heating Type in Cromberg
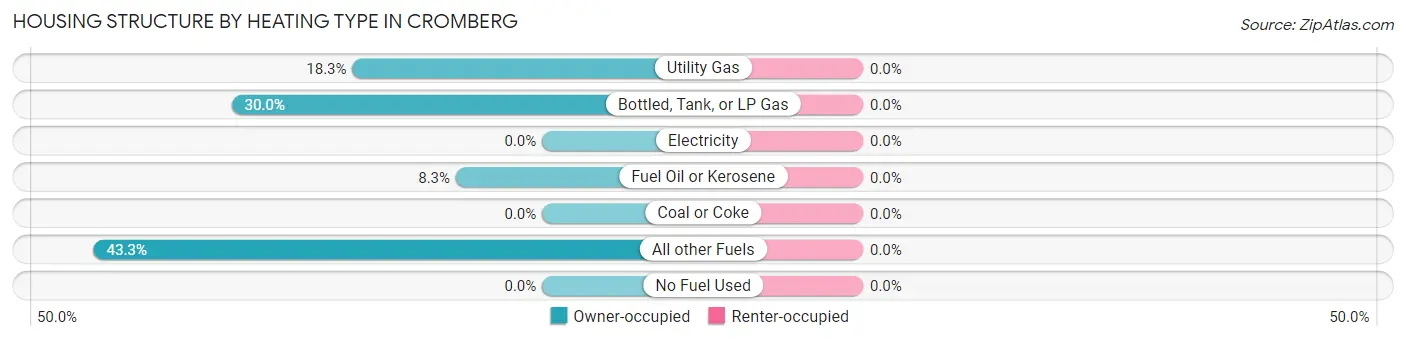
| Heating Type | Owner-occupied | Renter-occupied |
| Utility Gas | 22 (18.3%) | 0 (0.0%) |
| Bottled, Tank, or LP Gas | 36 (30.0%) | 0 (0.0%) |
| Electricity | 0 (0.0%) | 0 (0.0%) |
| Fuel Oil or Kerosene | 10 (8.3%) | 0 (0.0%) |
| Coal or Coke | 0 (0.0%) | 0 (0.0%) |
| All other Fuels | 52 (43.3%) | 0 (0.0%) |
| No Fuel Used | 0 (0.0%) | 0 (0.0%) |
| Total | 120 (100.0%) | 0 (0.0%) |
Household Vehicle Usage in Cromberg
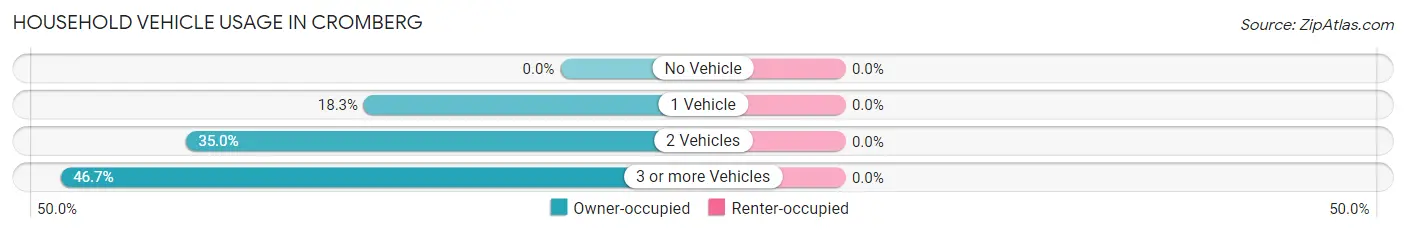
| Vehicles per Household | Owner-occupied | Renter-occupied |
| No Vehicle | 0 (0.0%) | 0 (0.0%) |
| 1 Vehicle | 22 (18.3%) | 0 (0.0%) |
| 2 Vehicles | 42 (35.0%) | 0 (0.0%) |
| 3 or more Vehicles | 56 (46.7%) | 0 (0.0%) |
| Total | 120 (100.0%) | 0 (0.0%) |
Real Estate & Mortgages in Cromberg
Real Estate and Mortgage Overview in Cromberg
| Characteristic | Without Mortgage | With Mortgage |
| Housing Units | 75 | 45 |
| Median Property Value | - | - |
| Median Household Income | - | - |
| Monthly Housing Costs | $528 | $0 |
| Real Estate Taxes | $2,283 | $6 |
Property Value by Mortgage Status in Cromberg
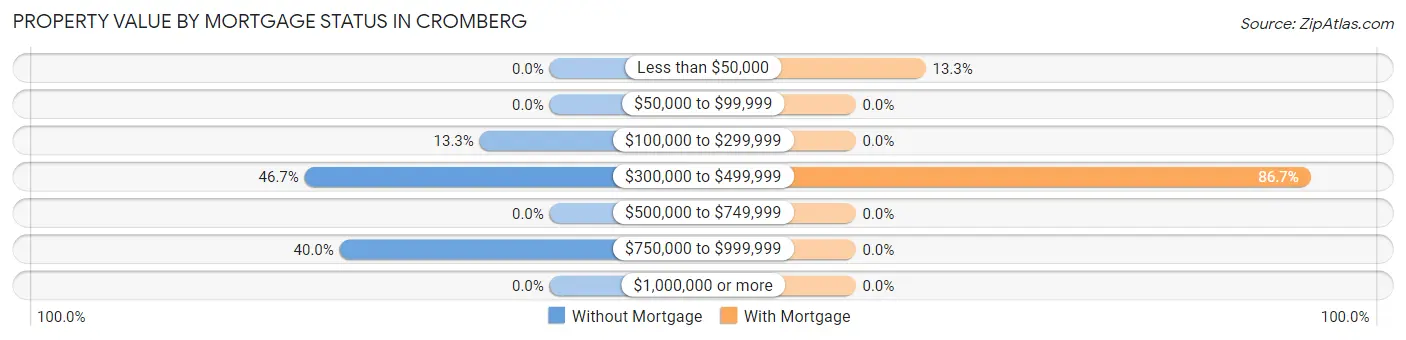
| Property Value | Without Mortgage | With Mortgage |
| Less than $50,000 | 0 (0.0%) | 6 (13.3%) |
| $50,000 to $99,999 | 0 (0.0%) | 0 (0.0%) |
| $100,000 to $299,999 | 10 (13.3%) | 0 (0.0%) |
| $300,000 to $499,999 | 35 (46.7%) | 39 (86.7%) |
| $500,000 to $749,999 | 0 (0.0%) | 0 (0.0%) |
| $750,000 to $999,999 | 30 (40.0%) | 0 (0.0%) |
| $1,000,000 or more | 0 (0.0%) | 0 (0.0%) |
| Total | 75 (100.0%) | 45 (100.0%) |
Household Income by Mortgage Status in Cromberg
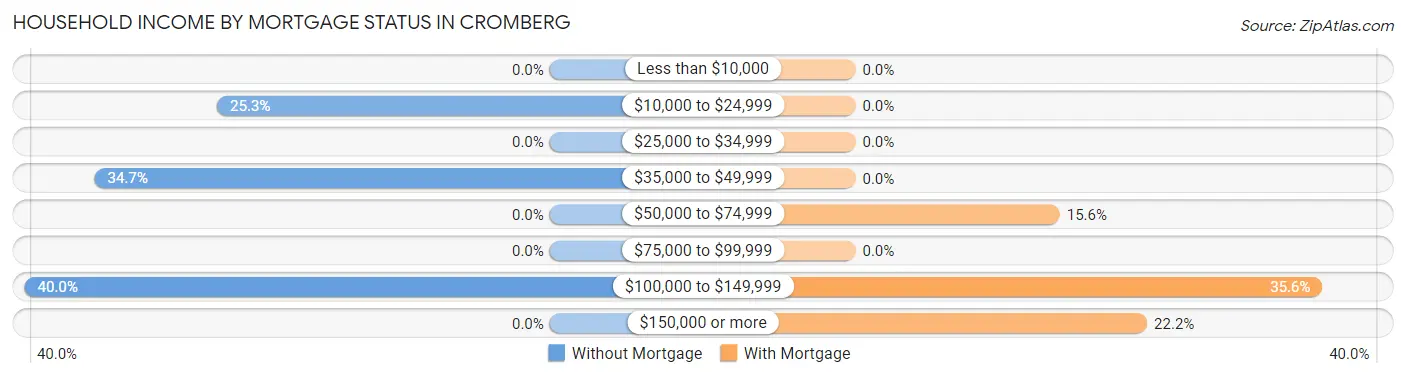
| Household Income | Without Mortgage | With Mortgage |
| Less than $10,000 | 0 (0.0%) | 0 (0.0%) |
| $10,000 to $24,999 | 19 (25.3%) | 0 (0.0%) |
| $25,000 to $34,999 | 0 (0.0%) | 0 (0.0%) |
| $35,000 to $49,999 | 26 (34.7%) | 0 (0.0%) |
| $50,000 to $74,999 | 0 (0.0%) | 7 (15.6%) |
| $75,000 to $99,999 | 0 (0.0%) | 0 (0.0%) |
| $100,000 to $149,999 | 30 (40.0%) | 16 (35.6%) |
| $150,000 or more | 0 (0.0%) | 10 (22.2%) |
| Total | 75 (100.0%) | 45 (100.0%) |
Property Value to Household Income Ratio in Cromberg
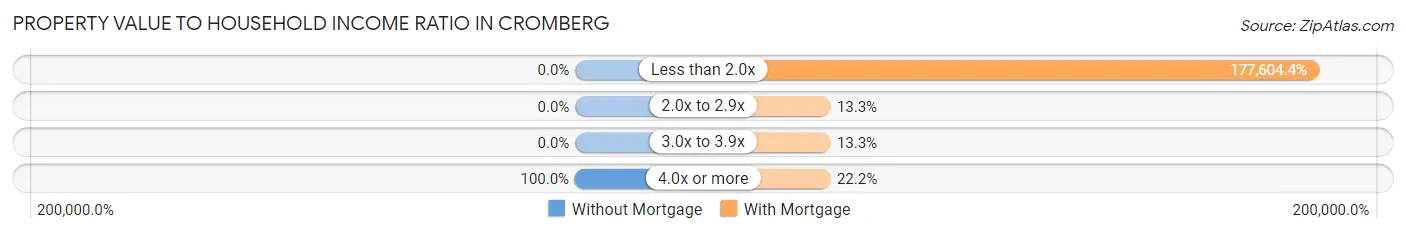
| Value-to-Income Ratio | Without Mortgage | With Mortgage |
| Less than 2.0x | 0 (0.0%) | 79,922 (177,604.4%) |
| 2.0x to 2.9x | 0 (0.0%) | 6 (13.3%) |
| 3.0x to 3.9x | 0 (0.0%) | 6 (13.3%) |
| 4.0x or more | 75 (100.0%) | 10 (22.2%) |
| Total | 75 (100.0%) | 45 (100.0%) |
Real Estate Taxes by Mortgage Status in Cromberg
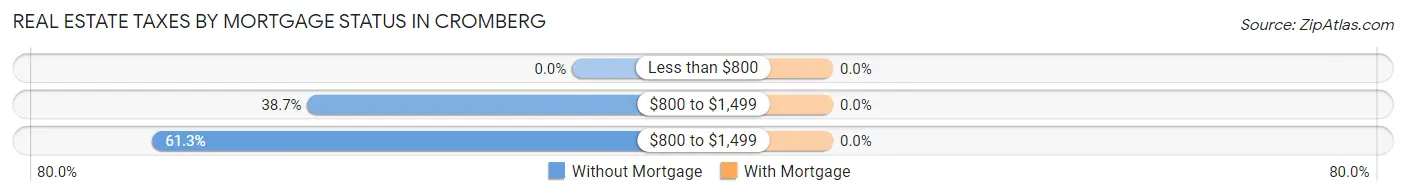
| Property Taxes | Without Mortgage | With Mortgage |
| Less than $800 | 0 (0.0%) | 0 (0.0%) |
| $800 to $1,499 | 29 (38.7%) | 0 (0.0%) |
| $800 to $1,499 | 46 (61.3%) | 0 (0.0%) |
| Total | 75 (100.0%) | 45 (100.0%) |
Health & Disability in Cromberg
Health Insurance Coverage by Age in Cromberg
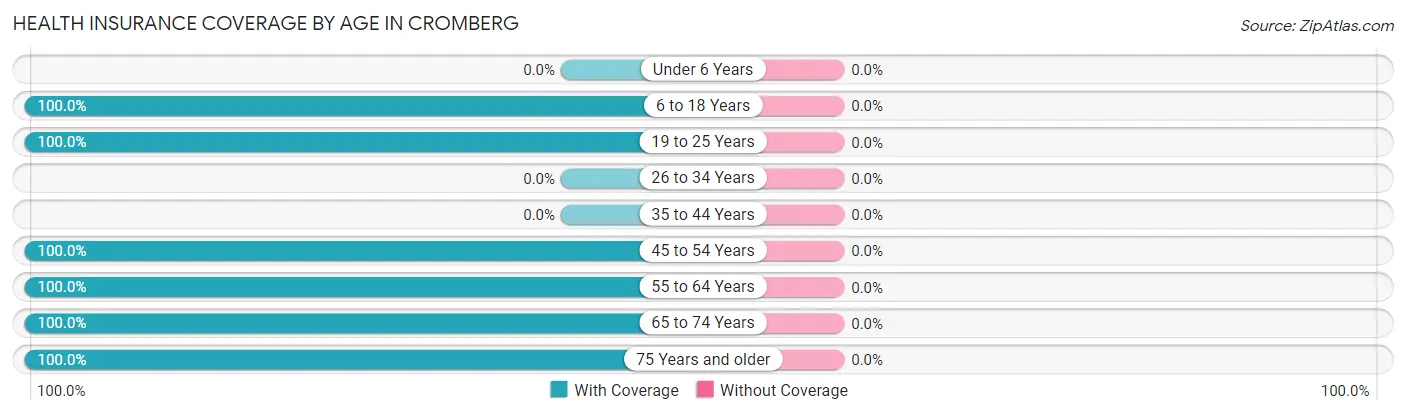
| Age Bracket | With Coverage | Without Coverage |
| Under 6 Years | 0 (0.0%) | 0 (0.0%) |
| 6 to 18 Years | 91 (100.0%) | 0 (0.0%) |
| 19 to 25 Years | 25 (100.0%) | 0 (0.0%) |
| 26 to 34 Years | 0 (0.0%) | 0 (0.0%) |
| 35 to 44 Years | 0 (0.0%) | 0 (0.0%) |
| 45 to 54 Years | 13 (100.0%) | 0 (0.0%) |
| 55 to 64 Years | 93 (100.0%) | 0 (0.0%) |
| 65 to 74 Years | 98 (100.0%) | 0 (0.0%) |
| 75 Years and older | 81 (100.0%) | 0 (0.0%) |
| Total | 401 (100.0%) | 0 (0.0%) |
Health Insurance Coverage by Citizenship Status in Cromberg
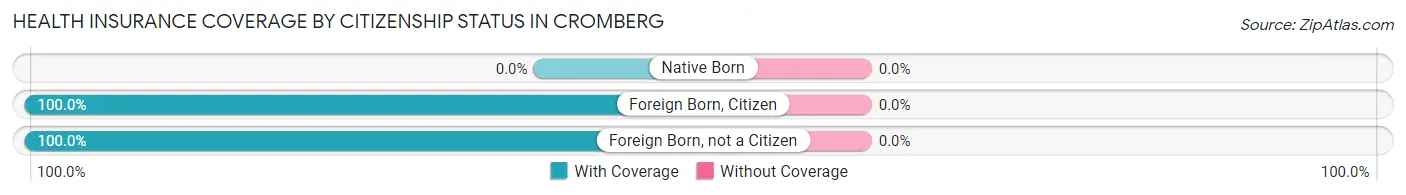
| Citizenship Status | With Coverage | Without Coverage |
| Native Born | 0 (0.0%) | 0 (0.0%) |
| Foreign Born, Citizen | 91 (100.0%) | 0 (0.0%) |
| Foreign Born, not a Citizen | 25 (100.0%) | 0 (0.0%) |
Health Insurance Coverage by Household Income in Cromberg
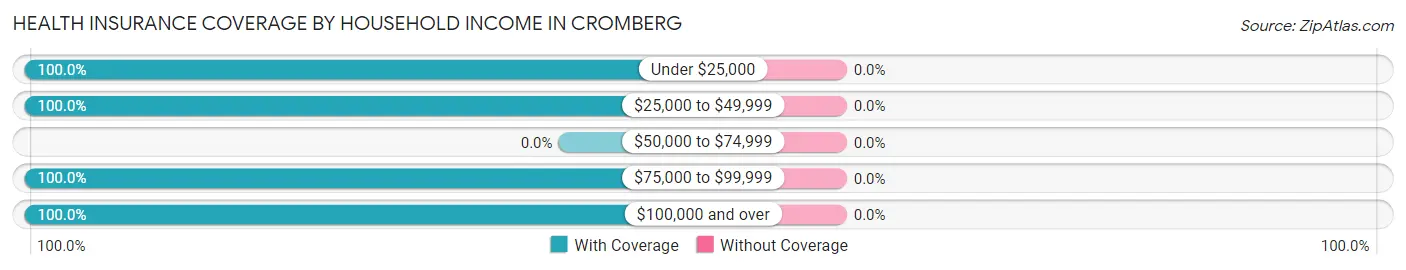
| Household Income | With Coverage | Without Coverage |
| Under $25,000 | 19 (100.0%) | 0 (0.0%) |
| $25,000 to $49,999 | 74 (100.0%) | 0 (0.0%) |
| $50,000 to $74,999 | 0 (0.0%) | 0 (0.0%) |
| $75,000 to $99,999 | 132 (100.0%) | 0 (0.0%) |
| $100,000 and over | 176 (100.0%) | 0 (0.0%) |
Public vs Private Health Insurance Coverage by Age in Cromberg
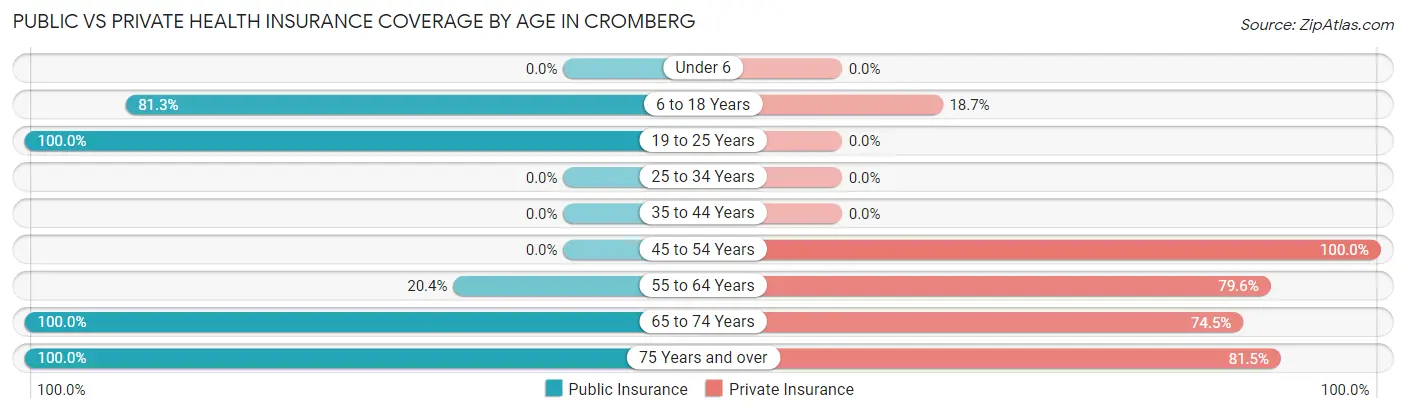
| Age Bracket | Public Insurance | Private Insurance |
| Under 6 | 0 (0.0%) | 0 (0.0%) |
| 6 to 18 Years | 74 (81.3%) | 17 (18.7%) |
| 19 to 25 Years | 25 (100.0%) | 0 (0.0%) |
| 25 to 34 Years | 0 (0.0%) | 0 (0.0%) |
| 35 to 44 Years | 0 (0.0%) | 0 (0.0%) |
| 45 to 54 Years | 0 (0.0%) | 13 (100.0%) |
| 55 to 64 Years | 19 (20.4%) | 74 (79.6%) |
| 65 to 74 Years | 98 (100.0%) | 73 (74.5%) |
| 75 Years and over | 81 (100.0%) | 66 (81.5%) |
| Total | 297 (74.1%) | 243 (60.6%) |
Disability Status by Sex by Age in Cromberg
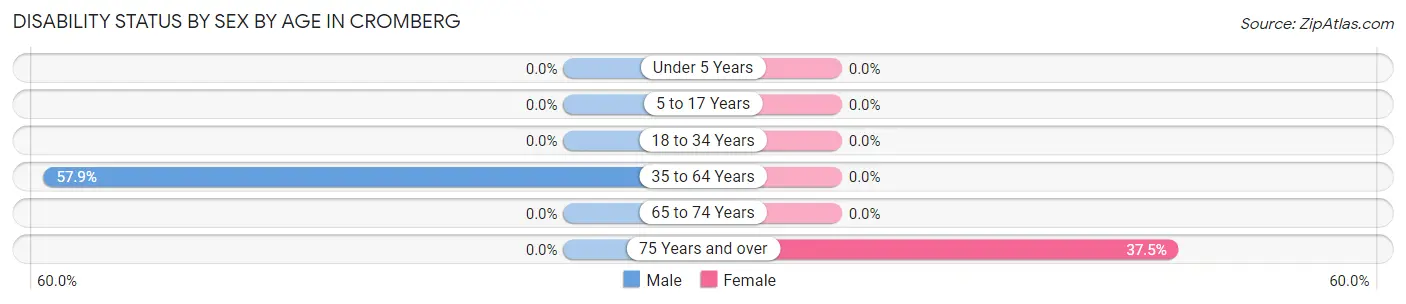
| Age Bracket | Male | Female |
| Under 5 Years | 0 (0.0%) | 0 (0.0%) |
| 5 to 17 Years | 0 (0.0%) | 0 (0.0%) |
| 18 to 34 Years | 0 (0.0%) | 0 (0.0%) |
| 35 to 64 Years | 44 (57.9%) | 0 (0.0%) |
| 65 to 74 Years | 0 (0.0%) | 0 (0.0%) |
| 75 Years and over | 0 (0.0%) | 6 (37.5%) |
Disability Class by Sex by Age in Cromberg
Disability Class: Hearing Difficulty
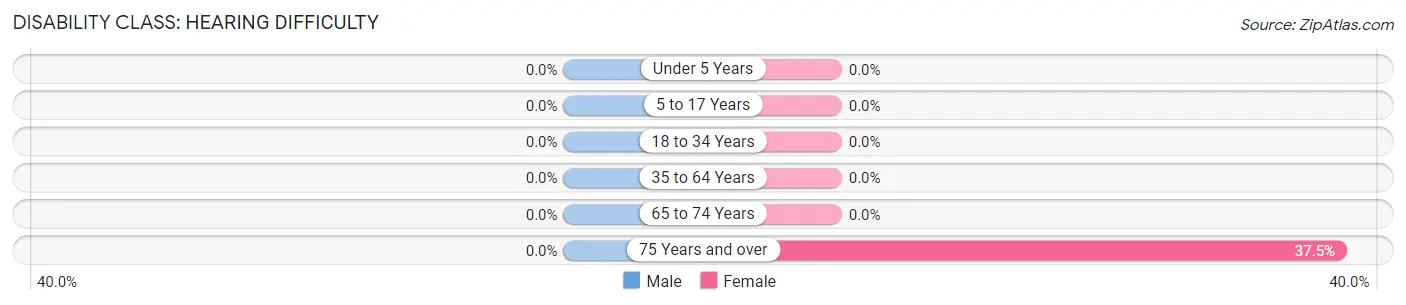
| Age Bracket | Male | Female |
| Under 5 Years | 0 (0.0%) | 0 (0.0%) |
| 5 to 17 Years | 0 (0.0%) | 0 (0.0%) |
| 18 to 34 Years | 0 (0.0%) | 0 (0.0%) |
| 35 to 64 Years | 0 (0.0%) | 0 (0.0%) |
| 65 to 74 Years | 0 (0.0%) | 0 (0.0%) |
| 75 Years and over | 0 (0.0%) | 6 (37.5%) |
Disability Class: Vision Difficulty
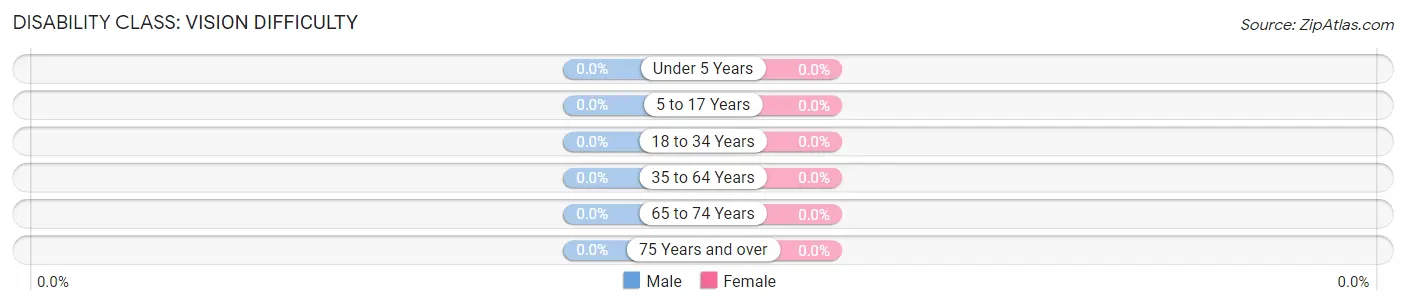
| Age Bracket | Male | Female |
| Under 5 Years | 0 (0.0%) | 0 (0.0%) |
| 5 to 17 Years | 0 (0.0%) | 0 (0.0%) |
| 18 to 34 Years | 0 (0.0%) | 0 (0.0%) |
| 35 to 64 Years | 0 (0.0%) | 0 (0.0%) |
| 65 to 74 Years | 0 (0.0%) | 0 (0.0%) |
| 75 Years and over | 0 (0.0%) | 0 (0.0%) |
Disability Class: Cognitive Difficulty
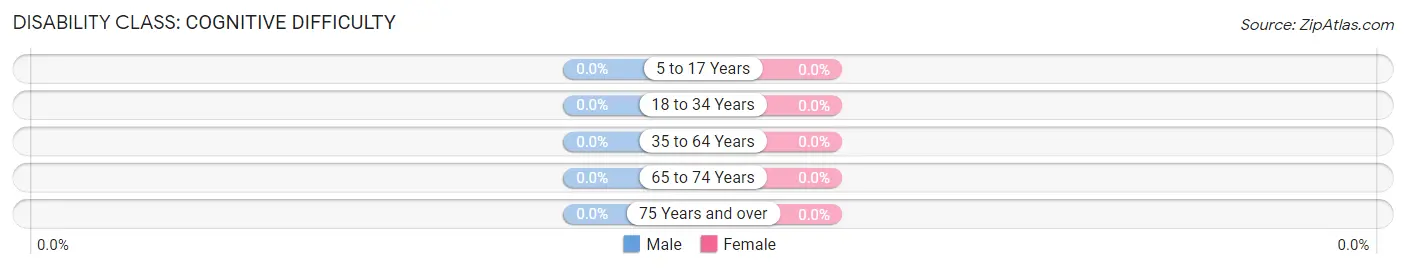
| Age Bracket | Male | Female |
| 5 to 17 Years | 0 (0.0%) | 0 (0.0%) |
| 18 to 34 Years | 0 (0.0%) | 0 (0.0%) |
| 35 to 64 Years | 0 (0.0%) | 0 (0.0%) |
| 65 to 74 Years | 0 (0.0%) | 0 (0.0%) |
| 75 Years and over | 0 (0.0%) | 0 (0.0%) |
Disability Class: Ambulatory Difficulty
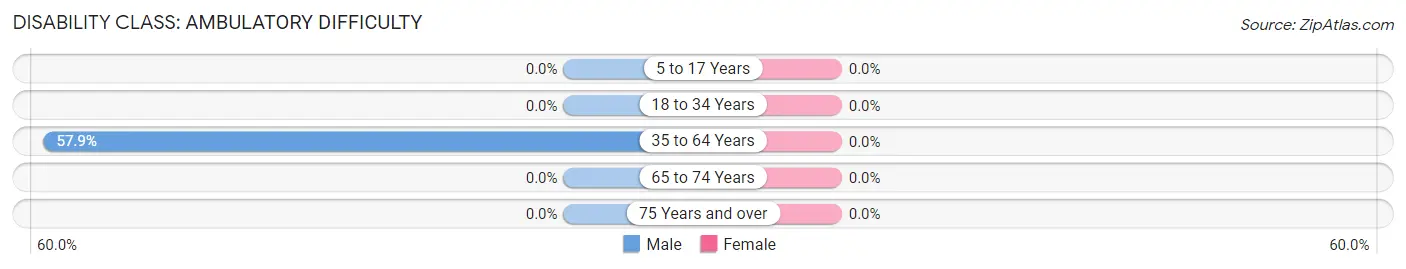
| Age Bracket | Male | Female |
| 5 to 17 Years | 0 (0.0%) | 0 (0.0%) |
| 18 to 34 Years | 0 (0.0%) | 0 (0.0%) |
| 35 to 64 Years | 44 (57.9%) | 0 (0.0%) |
| 65 to 74 Years | 0 (0.0%) | 0 (0.0%) |
| 75 Years and over | 0 (0.0%) | 0 (0.0%) |
Disability Class: Self-Care Difficulty
| Age Bracket | Male | Female |
| 5 to 17 Years | 0 (0.0%) | 0 (0.0%) |
| 18 to 34 Years | 0 (0.0%) | 0 (0.0%) |
| 35 to 64 Years | 0 (0.0%) | 0 (0.0%) |
| 65 to 74 Years | 0 (0.0%) | 0 (0.0%) |
| 75 Years and over | 0 (0.0%) | 0 (0.0%) |
Technology Access in Cromberg
Computing Device Access in Cromberg
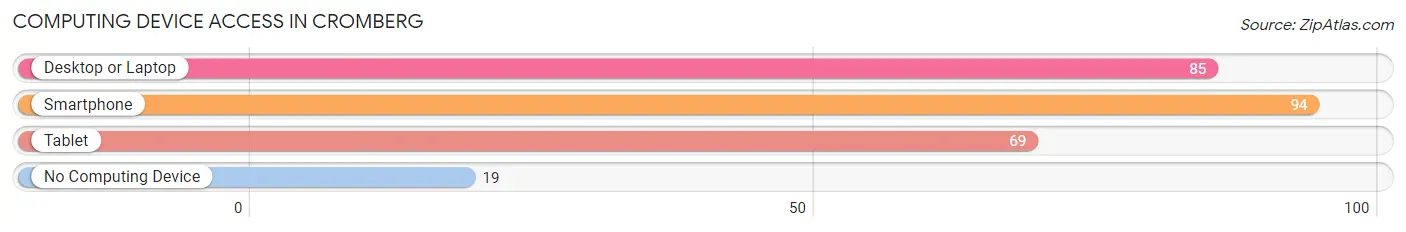
| Device Type | # Households | % Households |
| Desktop or Laptop | 85 | 70.8% |
| Smartphone | 94 | 78.3% |
| Tablet | 69 | 57.5% |
| No Computing Device | 19 | 15.8% |
| Total | 120 | 100.0% |
Internet Access in Cromberg
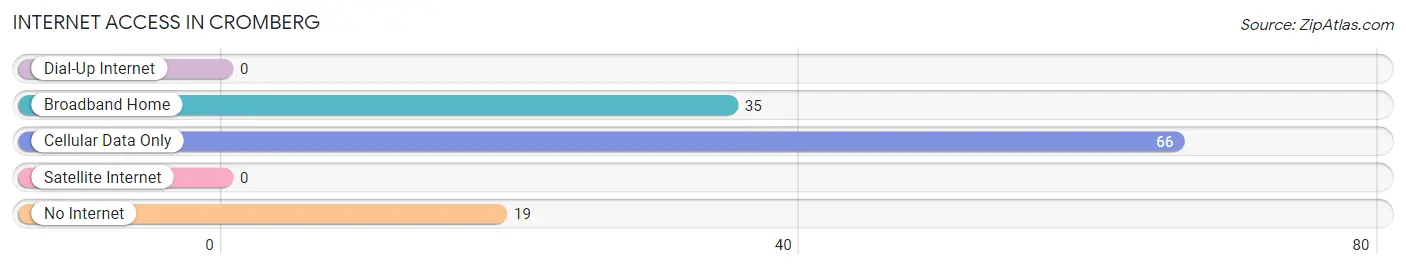
| Internet Type | # Households | % Households |
| Dial-Up Internet | 0 | 0.0% |
| Broadband Home | 35 | 29.2% |
| Cellular Data Only | 66 | 55.0% |
| Satellite Internet | 0 | 0.0% |
| No Internet | 19 | 15.8% |
| Total | 120 | 100.0% |
Cromberg Summary
Cromberg is a small unincorporated community located in Plumas County, California. It is situated in the Sierra Nevada mountain range, approximately 20 miles east of Quincy and 40 miles west of Reno, Nevada. The population of Cromberg was estimated to be around 200 people in 2020.
History
Cromberg was founded in 1852 by a group of miners who were searching for gold in the area. The town was named after a local miner, John Cromberg, who was one of the first to discover gold in the area. The town quickly grew and by 1854, it had a population of over 500 people. The town was home to several businesses, including a hotel, saloon, and general store.
In the late 1800s, the town began to decline as the gold rush ended and the population dwindled. By the early 1900s, the town was nearly abandoned. In the 1950s, the town was revived when a new highway was built through the area, connecting it to nearby towns. This allowed for increased tourism and the town began to grow again.
Geography
Cromberg is located in the Sierra Nevada mountain range, at an elevation of 4,890 feet. The town is surrounded by the Plumas National Forest, which provides a variety of outdoor activities such as camping, fishing, and hiking. The town is also close to several lakes, including Lake Davis and Lake Almanor.
The climate in Cromberg is generally mild, with hot summers and cold winters. The average temperature in the summer is around 80 degrees Fahrenheit, while the average temperature in the winter is around 30 degrees Fahrenheit.
Economy
The economy of Cromberg is largely based on tourism. The town is a popular destination for outdoor activities such as camping, fishing, and hiking. The town also has several restaurants, shops, and lodging options for visitors.
In addition to tourism, the town is also home to several small businesses, including a lumber mill, a sawmill, and a general store. The town is also home to a small airport, which is used for recreational flying.
Demographics
The population of Cromberg was estimated to be around 200 people in 2020. The town is predominantly white, with a small Hispanic population. The median household income in the town is around $50,000, and the median home value is around $200,000. The town has a low crime rate and is considered to be a safe place to live.
Common Questions
What is Per Capita Income in Cromberg?
Per Capita income in Cromberg is $39,615.
What is the Median Family Income in Cromberg?
Median Family Income in Cromberg is $77,891.
What is the Median Household income in Cromberg?
Median Household Income in Cromberg is $78,750.
What is Inequality or Gini Index in Cromberg?
Inequality or Gini Index in Cromberg is 0.33.
What is the Total Population of Cromberg?
Total Population of Cromberg is 401.
What is the Total Male Population of Cromberg?
Total Male Population of Cromberg is 190.
What is the Total Female Population of Cromberg?
Total Female Population of Cromberg is 211.
What is the Ratio of Males per 100 Females in Cromberg?
There are 90.05 Males per 100 Females in Cromberg.
What is the Ratio of Females per 100 Males in Cromberg?
There are 111.05 Females per 100 Males in Cromberg.
What is the Median Population Age in Cromberg?
Median Population Age in Cromberg is 64.1 Years.
What is the Average Family Size in Cromberg
Average Family Size in Cromberg is 4.2 People.
What is the Average Household Size in Cromberg
Average Household Size in Cromberg is 3.3 People.
How Large is the Labor Force in Cromberg?
There are 129 People in the Labor Forcein in Cromberg.
What is the Percentage of People in the Labor Force in Cromberg?
40.7% of People are in the Labor Force in Cromberg.
What is the Unemployment Rate in Cromberg?
Unemployment Rate in Cromberg is 13.2%.