Cities with the Largest Guamanian / Chamorro Community in California
RELATED REPORTS & OPTIONS
Guamanian / Chamorro
California
Compare Cities
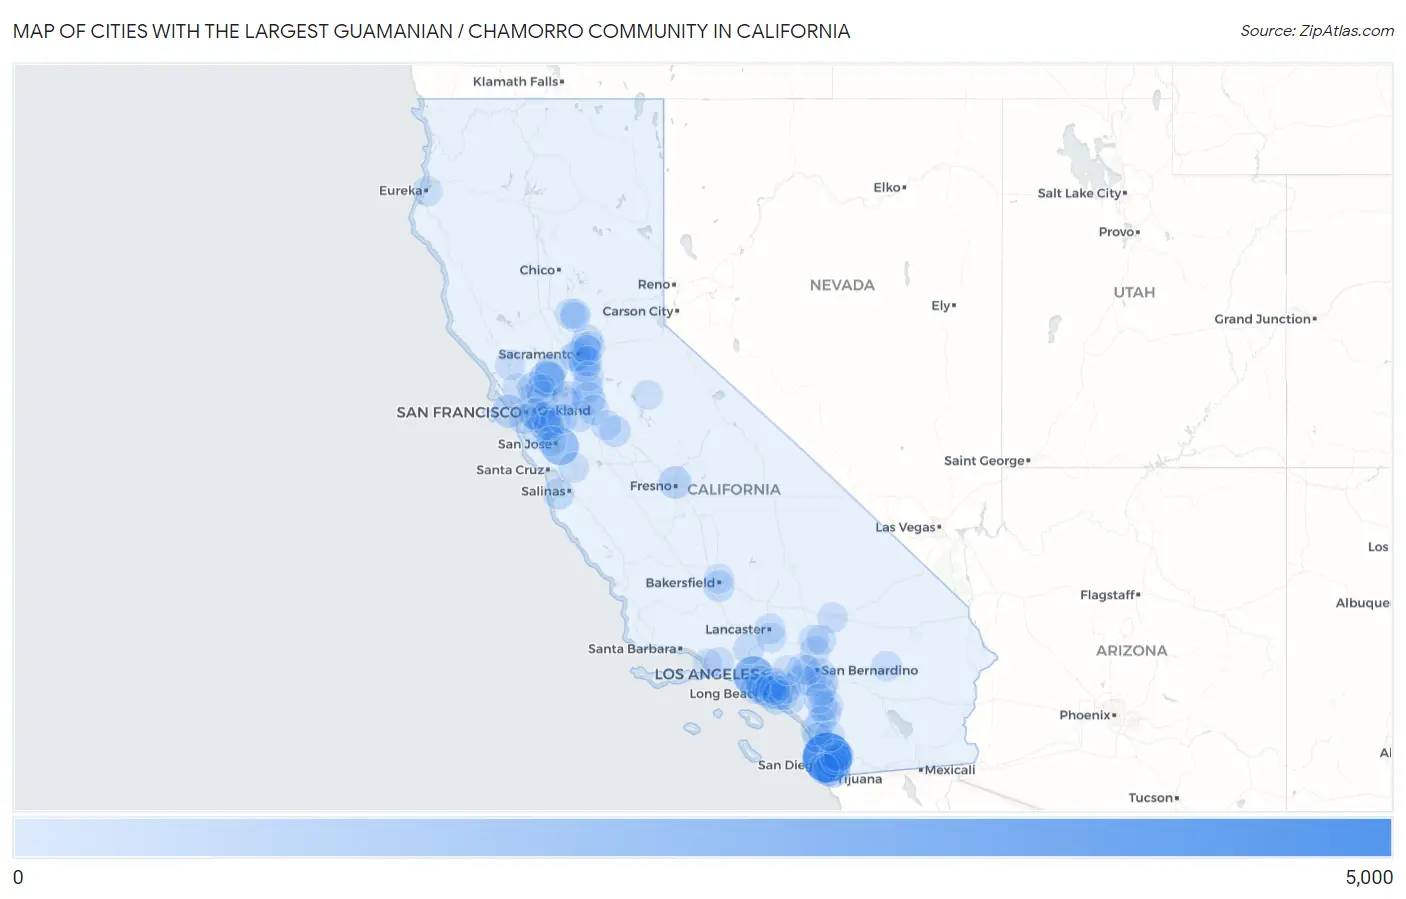
Map of Cities with the Largest Guamanian / Chamorro Community in California
0
5,000
Cities with the Largest Guamanian / Chamorro Community in California
| City | Guamanian / Chamorro | vs State | vs National | |
| 1. | San Diego | 4,081 | 45,863(8.90%)#1 | 154,057(2.65%)#1 |
| 2. | Los Angeles | 2,111 | 45,863(4.60%)#2 | 154,057(1.37%)#2 |
| 3. | San Jose | 1,627 | 45,863(3.55%)#3 | 154,057(1.06%)#4 |
| 4. | Fairfield | 1,322 | 45,863(2.88%)#4 | 154,057(0.86%)#6 |
| 5. | Chula Vista | 1,059 | 45,863(2.31%)#5 | 154,057(0.69%)#9 |
| 6. | Stockton | 733 | 45,863(1.60%)#6 | 154,057(0.48%)#23 |
| 7. | San Francisco | 682 | 45,863(1.49%)#7 | 154,057(0.44%)#24 |
| 8. | Fresno | 619 | 45,863(1.35%)#8 | 154,057(0.40%)#26 |
| 9. | Hayward | 608 | 45,863(1.33%)#9 | 154,057(0.39%)#27 |
| 10. | Long Beach | 582 | 45,863(1.27%)#10 | 154,057(0.38%)#30 |
| 11. | Carson | 528 | 45,863(1.15%)#11 | 154,057(0.34%)#36 |
| 12. | La Mesa | 520 | 45,863(1.13%)#12 | 154,057(0.34%)#37 |
| 13. | Vacaville | 487 | 45,863(1.06%)#13 | 154,057(0.32%)#42 |
| 14. | National City | 477 | 45,863(1.04%)#14 | 154,057(0.31%)#46 |
| 15. | Norwalk | 471 | 45,863(1.03%)#15 | 154,057(0.31%)#47 |
| 16. | Vallejo | 467 | 45,863(1.02%)#16 | 154,057(0.30%)#48 |
| 17. | Sacramento | 454 | 45,863(0.99%)#17 | 154,057(0.29%)#50 |
| 18. | Oakland | 438 | 45,863(0.96%)#18 | 154,057(0.28%)#52 |
| 19. | Moreno Valley | 434 | 45,863(0.95%)#19 | 154,057(0.28%)#53 |
| 20. | Benicia | 418 | 45,863(0.91%)#20 | 154,057(0.27%)#58 |
| 21. | Huntington Beach | 406 | 45,863(0.89%)#21 | 154,057(0.26%)#59 |
| 22. | Bakersfield | 389 | 45,863(0.85%)#22 | 154,057(0.25%)#60 |
| 23. | Santee | 374 | 45,863(0.82%)#23 | 154,057(0.24%)#63 |
| 24. | Florin | 360 | 45,863(0.78%)#24 | 154,057(0.23%)#65 |
| 25. | Elk Grove | 359 | 45,863(0.78%)#25 | 154,057(0.23%)#67 |
| 26. | Turlock | 359 | 45,863(0.78%)#26 | 154,057(0.23%)#68 |
| 27. | Westmont | 325 | 45,863(0.71%)#27 | 154,057(0.21%)#72 |
| 28. | Seaside | 325 | 45,863(0.71%)#28 | 154,057(0.21%)#73 |
| 29. | Fremont | 311 | 45,863(0.68%)#29 | 154,057(0.20%)#77 |
| 30. | Lodi | 311 | 45,863(0.68%)#30 | 154,057(0.20%)#78 |
| 31. | Rancho Cucamonga | 293 | 45,863(0.64%)#31 | 154,057(0.19%)#85 |
| 32. | Santa Clarita | 292 | 45,863(0.64%)#32 | 154,057(0.19%)#86 |
| 33. | Tracy | 292 | 45,863(0.64%)#33 | 154,057(0.19%)#87 |
| 34. | Spring Valley Cdp San Diego County | 292 | 45,863(0.64%)#34 | 154,057(0.19%)#88 |
| 35. | Oceanside | 291 | 45,863(0.63%)#35 | 154,057(0.19%)#89 |
| 36. | Loma Linda | 270 | 45,863(0.59%)#36 | 154,057(0.18%)#100 |
| 37. | French Valley | 266 | 45,863(0.58%)#37 | 154,057(0.17%)#101 |
| 38. | Irvine | 252 | 45,863(0.55%)#38 | 154,057(0.16%)#105 |
| 39. | Roseville | 252 | 45,863(0.55%)#39 | 154,057(0.16%)#107 |
| 40. | El Cajon | 252 | 45,863(0.55%)#40 | 154,057(0.16%)#108 |
| 41. | San Leandro | 245 | 45,863(0.53%)#41 | 154,057(0.16%)#110 |
| 42. | Alameda | 243 | 45,863(0.53%)#42 | 154,057(0.16%)#113 |
| 43. | Eastvale | 231 | 45,863(0.50%)#43 | 154,057(0.15%)#120 |
| 44. | Temecula | 228 | 45,863(0.50%)#44 | 154,057(0.15%)#122 |
| 45. | Signal Hill | 226 | 45,863(0.49%)#45 | 154,057(0.15%)#123 |
| 46. | Martinez | 223 | 45,863(0.49%)#46 | 154,057(0.14%)#127 |
| 47. | Suisun City | 220 | 45,863(0.48%)#47 | 154,057(0.14%)#128 |
| 48. | Manteca | 219 | 45,863(0.48%)#48 | 154,057(0.14%)#129 |
| 49. | Murrieta | 218 | 45,863(0.48%)#49 | 154,057(0.14%)#132 |
| 50. | West Sacramento | 209 | 45,863(0.46%)#50 | 154,057(0.14%)#140 |
| 51. | Lakewood | 208 | 45,863(0.45%)#51 | 154,057(0.14%)#141 |
| 52. | Twentynine Palms | 208 | 45,863(0.45%)#52 | 154,057(0.14%)#142 |
| 53. | Lancaster | 203 | 45,863(0.44%)#53 | 154,057(0.13%)#147 |
| 54. | Novato | 203 | 45,863(0.44%)#54 | 154,057(0.13%)#148 |
| 55. | Yuba City | 202 | 45,863(0.44%)#55 | 154,057(0.13%)#150 |
| 56. | Gilroy | 202 | 45,863(0.44%)#56 | 154,057(0.13%)#151 |
| 57. | Riverside | 201 | 45,863(0.44%)#57 | 154,057(0.13%)#152 |
| 58. | Barstow | 199 | 45,863(0.43%)#58 | 154,057(0.13%)#156 |
| 59. | Santa Rosa | 196 | 45,863(0.43%)#59 | 154,057(0.13%)#157 |
| 60. | Pleasanton | 191 | 45,863(0.42%)#60 | 154,057(0.12%)#164 |
| 61. | Winter Gardens | 191 | 45,863(0.42%)#61 | 154,057(0.12%)#165 |
| 62. | Redwood City | 190 | 45,863(0.41%)#62 | 154,057(0.12%)#167 |
| 63. | Brentwood | 183 | 45,863(0.40%)#63 | 154,057(0.12%)#172 |
| 64. | Perris | 181 | 45,863(0.39%)#64 | 154,057(0.12%)#175 |
| 65. | Castro Valley | 181 | 45,863(0.39%)#65 | 154,057(0.12%)#176 |
| 66. | Modesto | 179 | 45,863(0.39%)#66 | 154,057(0.12%)#177 |
| 67. | Fallbrook | 175 | 45,863(0.38%)#67 | 154,057(0.11%)#181 |
| 68. | Hesperia | 170 | 45,863(0.37%)#68 | 154,057(0.11%)#184 |
| 69. | Citrus Heights | 168 | 45,863(0.37%)#69 | 154,057(0.11%)#186 |
| 70. | Victorville | 166 | 45,863(0.36%)#70 | 154,057(0.11%)#189 |
| 71. | Camarillo | 165 | 45,863(0.36%)#71 | 154,057(0.11%)#191 |
| 72. | Oakley | 164 | 45,863(0.36%)#72 | 154,057(0.11%)#192 |
| 73. | Apple Valley | 162 | 45,863(0.35%)#73 | 154,057(0.11%)#195 |
| 74. | Union City | 159 | 45,863(0.35%)#74 | 154,057(0.10%)#200 |
| 75. | North Highlands | 158 | 45,863(0.34%)#75 | 154,057(0.10%)#201 |
| 76. | Vineyard | 158 | 45,863(0.34%)#76 | 154,057(0.10%)#202 |
| 77. | Fullerton | 156 | 45,863(0.34%)#77 | 154,057(0.10%)#204 |
| 78. | Daly City | 153 | 45,863(0.33%)#78 | 154,057(0.10%)#206 |
| 79. | Coronado | 151 | 45,863(0.33%)#79 | 154,057(0.10%)#211 |
| 80. | Fontana | 149 | 45,863(0.32%)#80 | 154,057(0.10%)#213 |
| 81. | Santa Ana | 148 | 45,863(0.32%)#81 | 154,057(0.10%)#214 |
| 82. | Torrance | 145 | 45,863(0.32%)#82 | 154,057(0.09%)#221 |
| 83. | Westminster | 145 | 45,863(0.32%)#83 | 154,057(0.09%)#222 |
| 84. | Livermore | 144 | 45,863(0.31%)#84 | 154,057(0.09%)#224 |
| 85. | Palmdale | 139 | 45,863(0.30%)#85 | 154,057(0.09%)#230 |
| 86. | Eureka | 139 | 45,863(0.30%)#86 | 154,057(0.09%)#231 |
| 87. | Carlsbad | 138 | 45,863(0.30%)#87 | 154,057(0.09%)#232 |
| 88. | Oxnard | 132 | 45,863(0.29%)#88 | 154,057(0.09%)#239 |
| 89. | Escondido | 131 | 45,863(0.29%)#89 | 154,057(0.09%)#241 |
| 90. | Anaheim | 129 | 45,863(0.28%)#90 | 154,057(0.08%)#246 |
| 91. | Mono Vista | 129 | 45,863(0.28%)#91 | 154,057(0.08%)#248 |
| 92. | Santa Clara | 126 | 45,863(0.27%)#92 | 154,057(0.08%)#250 |
| 93. | Carmichael | 125 | 45,863(0.27%)#93 | 154,057(0.08%)#253 |
| 94. | Cypress | 124 | 45,863(0.27%)#94 | 154,057(0.08%)#256 |
| 95. | Oildale | 118 | 45,863(0.26%)#95 | 154,057(0.08%)#271 |
| 96. | Olivehurst | 116 | 45,863(0.25%)#96 | 154,057(0.08%)#275 |
| 97. | San Dimas | 114 | 45,863(0.25%)#97 | 154,057(0.07%)#277 |
| 98. | Canyon Lake | 114 | 45,863(0.25%)#98 | 154,057(0.07%)#279 |
| 99. | Linda | 112 | 45,863(0.24%)#99 | 154,057(0.07%)#282 |
| 100. | Galt | 111 | 45,863(0.24%)#100 | 154,057(0.07%)#286 |
Common Questions
What are the Top 10 Cities with the Largest Guamanian / Chamorro Community in California?
Top 10 Cities with the Largest Guamanian / Chamorro Community in California are:
#1
4,081
#2
2,111
#3
1,627
#4
1,322
#5
1,059
#6
733
#7
682
#8
619
#9
608
#10
582
What city has the Largest Guamanian / Chamorro Community in California?
San Diego has the Largest Guamanian / Chamorro Community in California with 4,081.
What is the Total Guamanian / Chamorro Population in the State of California?
Total Guamanian / Chamorro Population in California is 45,863.
What is the Total Guamanian / Chamorro Population in the United States?
Total Guamanian / Chamorro Population in the United States is 154,057.