Cities with the Most Immigrants from Yemen in California
RELATED REPORTS & OPTIONS
Yemen
California
Compare Cities
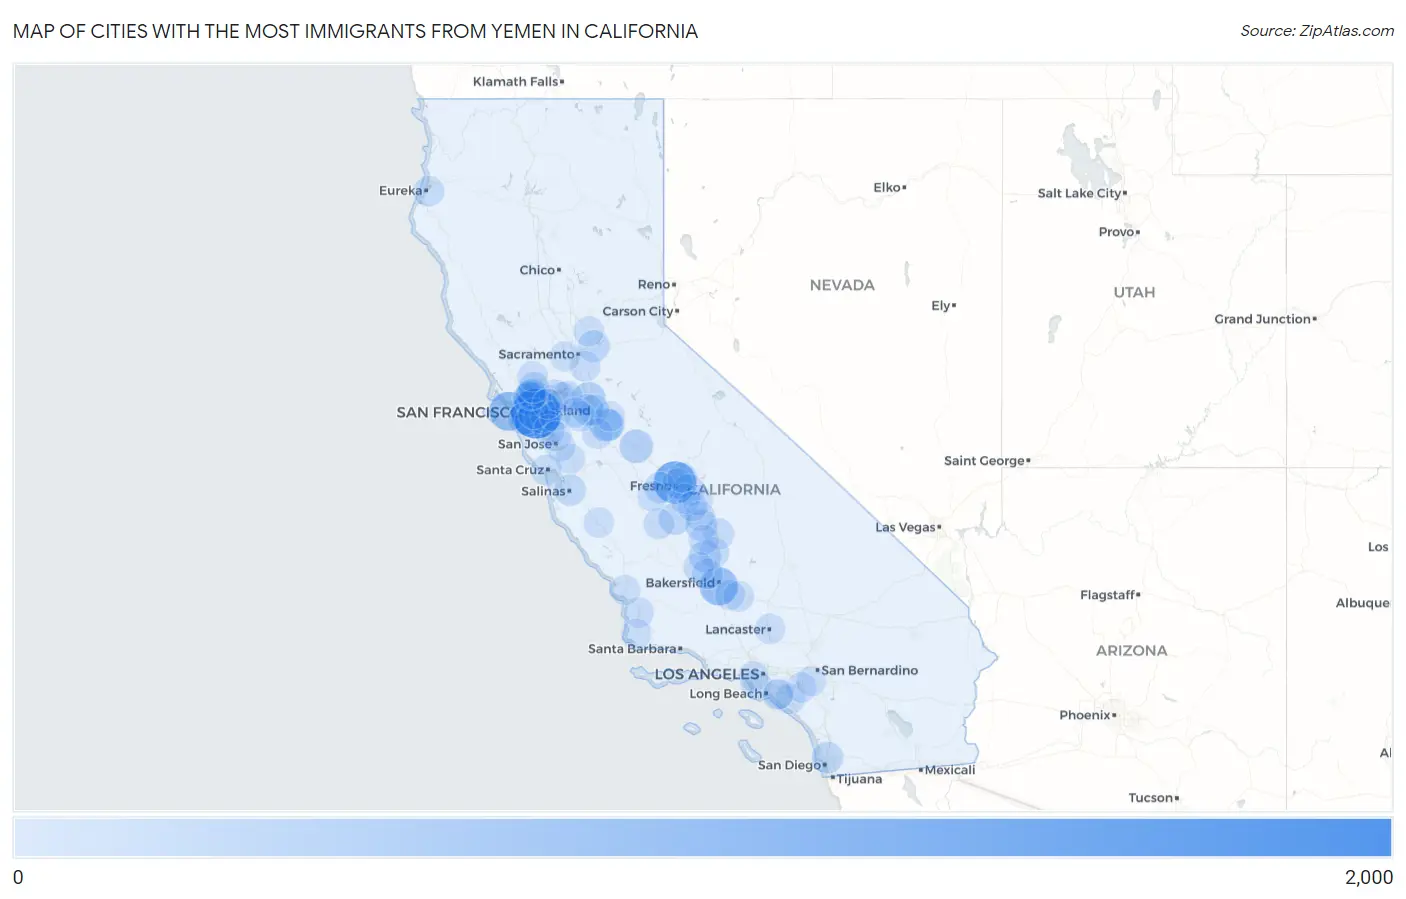
Map of Cities with the Most Immigrants from Yemen in California
0
2,000

Cities with the Most Immigrants from Yemen in California
| City | Yemen | vs State | vs National | |
| 1. | Oakland | 1,911 | 10,349(18.47%)#1 | 62,169(3.07%)#5 |
| 2. | Fresno | 1,198 | 10,349(11.58%)#2 | 62,169(1.93%)#6 |
| 3. | San Francisco | 847 | 10,349(8.18%)#3 | 62,169(1.36%)#9 |
| 4. | Bakersfield | 757 | 10,349(7.31%)#4 | 62,169(1.22%)#12 |
| 5. | Richmond | 409 | 10,349(3.95%)#5 | 62,169(0.66%)#18 |
| 6. | Stockton | 320 | 10,349(3.09%)#6 | 62,169(0.51%)#22 |
| 7. | Merced | 315 | 10,349(3.04%)#7 | 62,169(0.51%)#23 |
| 8. | Modesto | 306 | 10,349(2.96%)#8 | 62,169(0.49%)#24 |
| 9. | San Pablo | 206 | 10,349(1.99%)#9 | 62,169(0.33%)#39 |
| 10. | Delano | 194 | 10,349(1.87%)#10 | 62,169(0.31%)#40 |
| 11. | Lemoore | 186 | 10,349(1.80%)#11 | 62,169(0.30%)#43 |
| 12. | Tulare | 182 | 10,349(1.76%)#12 | 62,169(0.29%)#44 |
| 13. | Orangevale | 163 | 10,349(1.58%)#13 | 62,169(0.26%)#49 |
| 14. | Daly City | 159 | 10,349(1.54%)#14 | 62,169(0.26%)#51 |
| 15. | Lathrop | 153 | 10,349(1.48%)#15 | 62,169(0.25%)#52 |
| 16. | San Diego | 147 | 10,349(1.42%)#16 | 62,169(0.24%)#54 |
| 17. | Sanger | 142 | 10,349(1.37%)#17 | 62,169(0.23%)#55 |
| 18. | Salinas | 136 | 10,349(1.31%)#18 | 62,169(0.22%)#59 |
| 19. | San Leandro | 134 | 10,349(1.29%)#19 | 62,169(0.22%)#60 |
| 20. | Ceres | 121 | 10,349(1.17%)#20 | 62,169(0.19%)#63 |
| 21. | Kerman | 102 | 10,349(0.99%)#21 | 62,169(0.16%)#72 |
| 22. | Porterville | 77 | 10,349(0.74%)#22 | 62,169(0.12%)#91 |
| 23. | Castro Valley | 74 | 10,349(0.72%)#23 | 62,169(0.12%)#95 |
| 24. | Santa Cruz | 70 | 10,349(0.68%)#24 | 62,169(0.11%)#102 |
| 25. | Pittsburg | 68 | 10,349(0.66%)#25 | 62,169(0.11%)#103 |
| 26. | South San Francisco | 62 | 10,349(0.60%)#26 | 62,169(0.10%)#110 |
| 27. | Richgrove | 60 | 10,349(0.58%)#27 | 62,169(0.10%)#115 |
| 28. | Alameda | 59 | 10,349(0.57%)#28 | 62,169(0.09%)#116 |
| 29. | Hercules | 58 | 10,349(0.56%)#29 | 62,169(0.09%)#118 |
| 30. | Pinole | 58 | 10,349(0.56%)#30 | 62,169(0.09%)#119 |
| 31. | Fremont | 57 | 10,349(0.55%)#31 | 62,169(0.09%)#120 |
| 32. | Mayfair | 56 | 10,349(0.54%)#32 | 62,169(0.09%)#122 |
| 33. | Shafter | 55 | 10,349(0.53%)#33 | 62,169(0.09%)#124 |
| 34. | Wasco | 54 | 10,349(0.52%)#34 | 62,169(0.09%)#127 |
| 35. | Vallejo | 52 | 10,349(0.50%)#35 | 62,169(0.08%)#130 |
| 36. | Manteca | 51 | 10,349(0.49%)#36 | 62,169(0.08%)#132 |
| 37. | Huron | 49 | 10,349(0.47%)#37 | 62,169(0.08%)#139 |
| 38. | Myrtletown | 49 | 10,349(0.47%)#38 | 62,169(0.08%)#140 |
| 39. | Bear Valley Springs | 46 | 10,349(0.44%)#39 | 62,169(0.07%)#148 |
| 40. | Elk Grove | 45 | 10,349(0.43%)#40 | 62,169(0.07%)#150 |
| 41. | Irvine | 44 | 10,349(0.43%)#41 | 62,169(0.07%)#152 |
| 42. | Dublin | 42 | 10,349(0.41%)#42 | 62,169(0.07%)#155 |
| 43. | Patterson | 42 | 10,349(0.41%)#43 | 62,169(0.07%)#156 |
| 44. | Tracy | 32 | 10,349(0.31%)#44 | 62,169(0.05%)#185 |
| 45. | Arvin | 31 | 10,349(0.30%)#45 | 62,169(0.05%)#190 |
| 46. | Antioch | 30 | 10,349(0.29%)#46 | 62,169(0.05%)#193 |
| 47. | Lancaster | 28 | 10,349(0.27%)#47 | 62,169(0.05%)#201 |
| 48. | Napa | 25 | 10,349(0.24%)#48 | 62,169(0.04%)#209 |
| 49. | San Jose | 23 | 10,349(0.22%)#49 | 62,169(0.04%)#216 |
| 50. | Corona | 21 | 10,349(0.20%)#50 | 62,169(0.03%)#222 |
| 51. | Oakley | 21 | 10,349(0.20%)#51 | 62,169(0.03%)#223 |
| 52. | Dinuba | 20 | 10,349(0.19%)#52 | 62,169(0.03%)#228 |
| 53. | Santa Maria | 19 | 10,349(0.18%)#53 | 62,169(0.03%)#232 |
| 54. | San Joaquin | 19 | 10,349(0.18%)#54 | 62,169(0.03%)#237 |
| 55. | Los Angeles | 14 | 10,349(0.14%)#55 | 62,169(0.02%)#253 |
| 56. | Mountain House | 14 | 10,349(0.14%)#56 | 62,169(0.02%)#257 |
| 57. | King City | 14 | 10,349(0.14%)#57 | 62,169(0.02%)#258 |
| 58. | Selma | 13 | 10,349(0.13%)#58 | 62,169(0.02%)#264 |
| 59. | Westminster | 12 | 10,349(0.12%)#59 | 62,169(0.02%)#267 |
| 60. | Davis | 12 | 10,349(0.12%)#60 | 62,169(0.02%)#268 |
| 61. | Visalia | 11 | 10,349(0.11%)#61 | 62,169(0.02%)#275 |
| 62. | Clovis | 11 | 10,349(0.11%)#62 | 62,169(0.02%)#276 |
| 63. | Lawndale | 10 | 10,349(0.10%)#63 | 62,169(0.02%)#283 |
| 64. | Lompoc | 9 | 10,349(0.09%)#64 | 62,169(0.01%)#290 |
| 65. | Pixley | 9 | 10,349(0.09%)#65 | 62,169(0.01%)#292 |
| 66. | Lincoln | 8 | 10,349(0.08%)#66 | 62,169(0.01%)#296 |
| 67. | Garden Grove | 7 | 10,349(0.07%)#67 | 62,169(0.01%)#303 |
| 68. | Morgan Hill | 6 | 10,349(0.06%)#68 | 62,169(0.01%)#307 |
| 69. | Riverbank | 6 | 10,349(0.06%)#69 | 62,169(0.01%)#308 |
| 70. | Traver | 6 | 10,349(0.06%)#70 | 62,169(0.01%)#313 |
| 71. | Walnut Creek | 5 | 10,349(0.05%)#71 | 62,169(0.01%)#316 |
| 72. | San Luis Obispo | 5 | 10,349(0.05%)#72 | 62,169(0.01%)#317 |
| 73. | Riverside | 4 | 10,349(0.04%)#73 | 62,169(0.01%)#323 |
| 74. | Milpitas | 3 | 10,349(0.03%)#74 | 62,169(0.00%)#333 |
Common Questions
What are the Top 10 Cities with the Most Immigrants from Yemen in California?
Top 10 Cities with the Most Immigrants from Yemen in California are:
#1
1,911
#2
1,198
#3
847
#4
757
#5
409
#6
320
#7
315
#8
306
#9
206
#10
194
What city has the Most Immigrants from Yemen in California?
Oakland has the Most Immigrants from Yemen in California with 1,911.
What is the Total Immigrants from Yemen in the State of California?
Total Immigrants from Yemen in California is 10,349.
What is the Total Immigrants from Yemen in the United States?
Total Immigrants from Yemen in the United States is 62,169.