Cities with the Highest Percentage of Local Government Employees in California
RELATED REPORTS & OPTIONS
Local Government Employees
California
Compare Cities
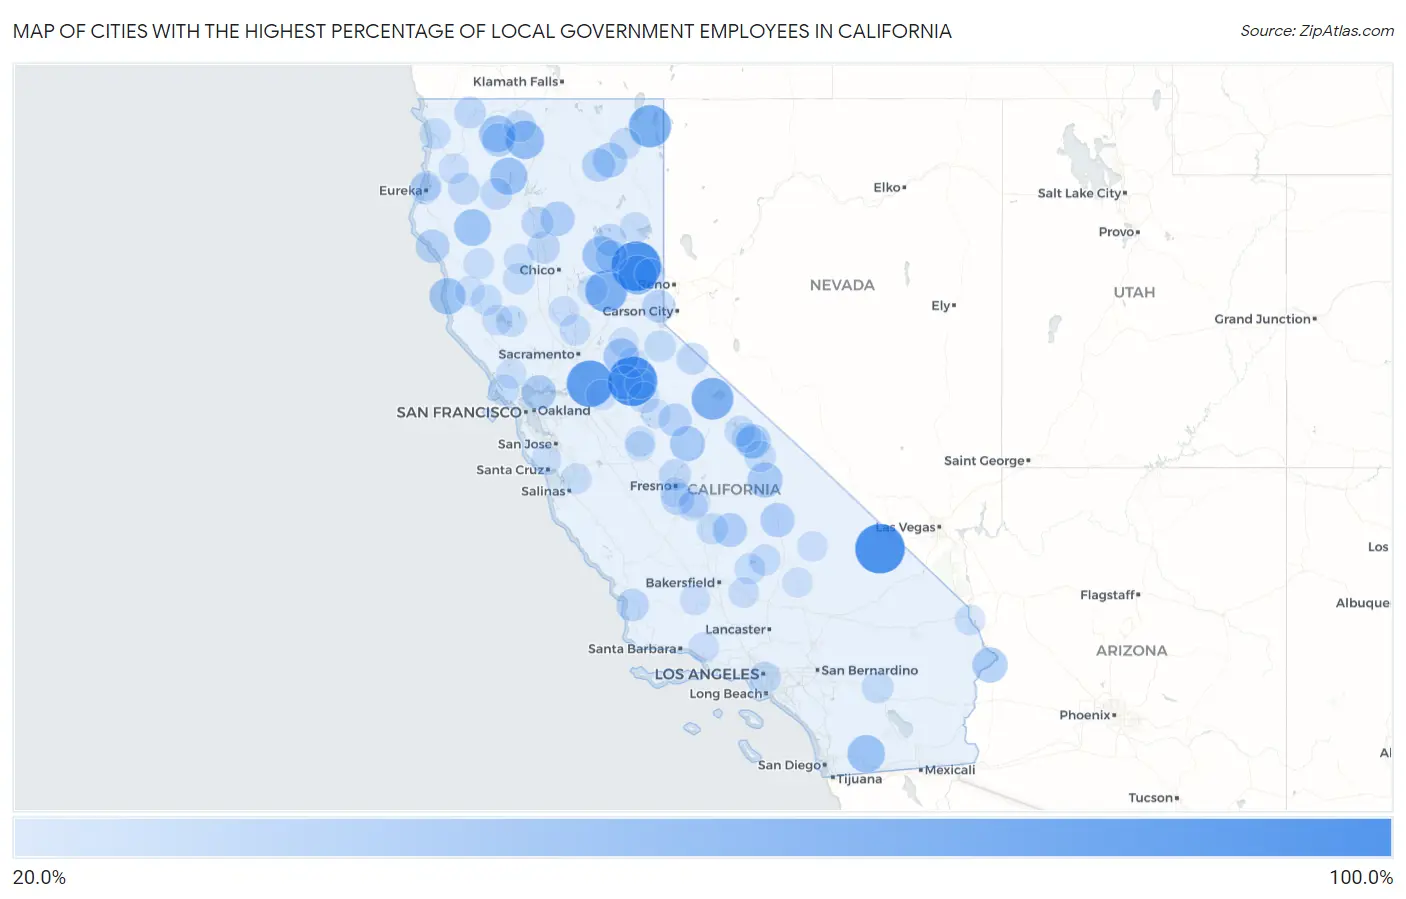
Map of Cities with the Highest Percentage of Local Government Employees in California
0.0%
100.0%
Cities with the Highest Percentage of Local Government Employees in California
| City | % Local Government Employees | vs State | vs National | |
| 1. | Iron Horse | 100.0% | 8.1%(+91.9)#1 | 7.2%(+92.8)#2 |
| 2. | Mountain Ranch | 100.0% | 8.1%(+91.9)#2 | 7.2%(+92.8)#4 |
| 3. | Tecopa | 100.0% | 8.1%(+91.9)#3 | 7.2%(+92.8)#11 |
| 4. | Acampo | 86.9% | 8.1%(+78.8)#4 | 7.2%(+79.7)#72 |
| 5. | Igo | 73.8% | 8.1%(+65.7)#5 | 7.2%(+66.6)#97 |
| 6. | Lake City | 70.0% | 8.1%(+61.9)#6 | 7.2%(+62.8)#116 |
| 7. | Pike | 67.9% | 8.1%(+59.8)#7 | 7.2%(+60.6)#125 |
| 8. | Lee Vining | 67.1% | 8.1%(+59.0)#8 | 7.2%(+59.9)#130 |
| 9. | Calpine | 56.2% | 8.1%(+48.2)#9 | 7.2%(+49.0)#196 |
| 10. | Edgewood | 53.3% | 8.1%(+45.3)#10 | 7.2%(+46.1)#235 |
| 11. | Meadow Valley | 50.0% | 8.1%(+41.9)#11 | 7.2%(+42.8)#271 |
| 12. | Mount Laguna | 50.0% | 8.1%(+41.9)#12 | 7.2%(+42.8)#279 |
| 13. | Mt. Bullion | 50.0% | 8.1%(+41.9)#13 | 7.2%(+42.8)#283 |
| 14. | Ono | 50.0% | 8.1%(+41.9)#14 | 7.2%(+42.8)#296 |
| 15. | Wautec | 50.0% | 8.1%(+41.9)#15 | 7.2%(+42.8)#300 |
| 16. | Trinity Center | 48.8% | 8.1%(+40.7)#16 | 7.2%(+41.6)#315 |
| 17. | Greenview | 46.7% | 8.1%(+38.6)#17 | 7.2%(+39.4)#348 |
| 18. | Ruth | 46.4% | 8.1%(+38.4)#18 | 7.2%(+39.2)#350 |
| 19. | Caspar | 45.1% | 8.1%(+37.0)#19 | 7.2%(+37.8)#375 |
| 20. | River Pines | 41.8% | 8.1%(+33.7)#20 | 7.2%(+34.6)#439 |
| 21. | Bluewater | 40.5% | 8.1%(+32.4)#21 | 7.2%(+33.2)#463 |
| 22. | Rumsey | 40.4% | 8.1%(+32.3)#22 | 7.2%(+33.2)#466 |
| 23. | Independence | 40.1% | 8.1%(+32.0)#23 | 7.2%(+32.9)#470 |
| 24. | Bass Lake | 39.6% | 8.1%(+31.6)#24 | 7.2%(+32.4)#482 |
| 25. | Adin | 38.0% | 8.1%(+29.9)#25 | 7.2%(+30.8)#530 |
| 26. | Port Costa | 37.8% | 8.1%(+29.7)#26 | 7.2%(+30.6)#540 |
| 27. | San Andreas | 37.5% | 8.1%(+29.4)#27 | 7.2%(+30.2)#555 |
| 28. | Olancha | 36.7% | 8.1%(+28.7)#28 | 7.2%(+29.5)#578 |
| 29. | Manton | 36.4% | 8.1%(+28.3)#29 | 7.2%(+29.1)#590 |
| 30. | Springville | 35.7% | 8.1%(+27.6)#30 | 7.2%(+28.4)#621 |
| 31. | Bishop | 35.4% | 8.1%(+27.4)#31 | 7.2%(+28.2)#629 |
| 32. | Shelter Cove | 34.2% | 8.1%(+26.2)#32 | 7.2%(+27.0)#683 |
| 33. | Etna | 33.9% | 8.1%(+25.8)#33 | 7.2%(+26.6)#693 |
| 34. | Bieber | 33.3% | 8.1%(+25.3)#34 | 7.2%(+26.1)#716 |
| 35. | El Portal | 31.4% | 8.1%(+23.4)#35 | 7.2%(+24.2)#814 |
| 36. | Carnelian Bay | 31.0% | 8.1%(+22.9)#36 | 7.2%(+23.7)#841 |
| 37. | Monmouth | 30.6% | 8.1%(+22.6)#37 | 7.2%(+23.4)#868 |
| 38. | Blacklake | 29.9% | 8.1%(+21.8)#38 | 7.2%(+22.6)#915 |
| 39. | Greenville | 29.4% | 8.1%(+21.4)#39 | 7.2%(+22.2)#933 |
| 40. | Los Molinos | 28.4% | 8.1%(+20.4)#40 | 7.2%(+21.2)#997 |
| 41. | East Quincy | 28.2% | 8.1%(+20.1)#41 | 7.2%(+20.9)#1,010 |
| 42. | Lake California | 27.9% | 8.1%(+19.9)#42 | 7.2%(+20.7)#1,029 |
| 43. | West Bishop | 27.8% | 8.1%(+19.7)#43 | 7.2%(+20.5)#1,042 |
| 44. | Weaverville | 27.6% | 8.1%(+19.5)#44 | 7.2%(+20.4)#1,050 |
| 45. | Walker | 27.4% | 8.1%(+19.3)#45 | 7.2%(+20.1)#1,069 |
| 46. | Pumpkin Center | 27.3% | 8.1%(+19.2)#46 | 7.2%(+20.0)#1,077 |
| 47. | Burnt Ranch | 27.3% | 8.1%(+19.2)#47 | 7.2%(+20.0)#1,079 |
| 48. | Grenada | 27.2% | 8.1%(+19.1)#48 | 7.2%(+19.9)#1,090 |
| 49. | Happy Camp | 27.0% | 8.1%(+19.0)#49 | 7.2%(+19.8)#1,104 |
| 50. | Vernon | 26.9% | 8.1%(+18.8)#50 | 7.2%(+19.7)#1,117 |
| 51. | Rolling Hills | 26.7% | 8.1%(+18.7)#51 | 7.2%(+19.5)#1,127 |
| 52. | Indio Hills | 26.3% | 8.1%(+18.2)#52 | 7.2%(+19.1)#1,172 |
| 53. | Big Pine | 26.3% | 8.1%(+18.2)#53 | 7.2%(+19.1)#1,174 |
| 54. | Plainview | 26.1% | 8.1%(+18.0)#54 | 7.2%(+18.9)#1,190 |
| 55. | Kirkwood | 25.5% | 8.1%(+17.4)#55 | 7.2%(+18.3)#1,239 |
| 56. | California Pines | 25.4% | 8.1%(+17.3)#56 | 7.2%(+18.2)#1,247 |
| 57. | Onyx | 25.0% | 8.1%(+16.9)#57 | 7.2%(+17.8)#1,273 |
| 58. | Swall Meadows | 25.0% | 8.1%(+16.9)#58 | 7.2%(+17.8)#1,277 |
| 59. | Weitchpec | 25.0% | 8.1%(+16.9)#59 | 7.2%(+17.8)#1,292 |
| 60. | Elk Creek | 25.0% | 8.1%(+16.9)#60 | 7.2%(+17.8)#1,298 |
| 61. | East Sonora | 25.0% | 8.1%(+16.9)#61 | 7.2%(+17.7)#1,312 |
| 62. | Klamath | 24.9% | 8.1%(+16.8)#62 | 7.2%(+17.7)#1,318 |
| 63. | Clearlake Oaks | 24.8% | 8.1%(+16.7)#63 | 7.2%(+17.6)#1,329 |
| 64. | East Nicolaus | 24.6% | 8.1%(+16.5)#64 | 7.2%(+17.4)#1,354 |
| 65. | Bodfish | 24.3% | 8.1%(+16.2)#65 | 7.2%(+17.1)#1,377 |
| 66. | Potter Valley | 23.9% | 8.1%(+15.9)#66 | 7.2%(+16.7)#1,410 |
| 67. | Stones Landing | 23.7% | 8.1%(+15.7)#67 | 7.2%(+16.5)#1,434 |
| 68. | Point Reyes Station | 23.7% | 8.1%(+15.6)#68 | 7.2%(+16.5)#1,436 |
| 69. | San Juan Bautista | 23.5% | 8.1%(+15.4)#69 | 7.2%(+16.2)#1,459 |
| 70. | Delft Colony | 23.3% | 8.1%(+15.2)#70 | 7.2%(+16.1)#1,486 |
| 71. | Janesville | 23.2% | 8.1%(+15.1)#71 | 7.2%(+16.0)#1,496 |
| 72. | Keene | 23.1% | 8.1%(+15.0)#72 | 7.2%(+15.9)#1,505 |
| 73. | Lakeport | 23.1% | 8.1%(+15.0)#73 | 7.2%(+15.8)#1,522 |
| 74. | Samoa | 22.8% | 8.1%(+14.7)#74 | 7.2%(+15.6)#1,555 |
| 75. | Covelo | 22.7% | 8.1%(+14.6)#75 | 7.2%(+15.4)#1,568 |
| 76. | Needles | 22.5% | 8.1%(+14.4)#76 | 7.2%(+15.3)#1,599 |
| 77. | Hoopa | 22.3% | 8.1%(+14.2)#77 | 7.2%(+15.1)#1,632 |
| 78. | Taft | 22.3% | 8.1%(+14.2)#78 | 7.2%(+15.0)#1,639 |
| 79. | Manila | 22.2% | 8.1%(+14.2)#79 | 7.2%(+15.0)#1,645 |
| 80. | Challenge Brownsville | 22.0% | 8.1%(+13.9)#80 | 7.2%(+14.7)#1,692 |
| 81. | Homewood Canyon | 21.9% | 8.1%(+13.9)#81 | 7.2%(+14.7)#1,701 |
| 82. | Sutter | 21.9% | 8.1%(+13.9)#82 | 7.2%(+14.7)#1,703 |
| 83. | Mesa | 21.8% | 8.1%(+13.8)#83 | 7.2%(+14.6)#1,712 |
| 84. | Linden | 21.8% | 8.1%(+13.7)#84 | 7.2%(+14.6)#1,714 |
| 85. | Loyalton | 21.6% | 8.1%(+13.5)#85 | 7.2%(+14.4)#1,747 |
| 86. | Forest Meadows | 21.5% | 8.1%(+13.4)#86 | 7.2%(+14.2)#1,771 |
| 87. | Paskenta | 21.4% | 8.1%(+13.4)#87 | 7.2%(+14.2)#1,778 |
| 88. | Mira Monte | 21.3% | 8.1%(+13.2)#88 | 7.2%(+14.1)#1,795 |
| 89. | Lompico | 21.2% | 8.1%(+13.2)#89 | 7.2%(+14.0)#1,806 |
| 90. | University Of California Merced | 21.2% | 8.1%(+13.1)#90 | 7.2%(+13.9)#1,819 |
| 91. | Buckhorn | 21.1% | 8.1%(+13.0)#91 | 7.2%(+13.8)#1,839 |
| 92. | Easton | 20.9% | 8.1%(+12.8)#92 | 7.2%(+13.7)#1,870 |
| 93. | Brooktrails | 20.9% | 8.1%(+12.8)#93 | 7.2%(+13.7)#1,872 |
| 94. | Bear Creek | 20.8% | 8.1%(+12.8)#94 | 7.2%(+13.6)#1,881 |
| 95. | Traver | 20.8% | 8.1%(+12.7)#95 | 7.2%(+13.6)#1,895 |
| 96. | Penngrove | 20.8% | 8.1%(+12.7)#96 | 7.2%(+13.5)#1,901 |
| 97. | Oak Run | 20.6% | 8.1%(+12.5)#97 | 7.2%(+13.4)#1,937 |
| 98. | Johannesburg | 20.6% | 8.1%(+12.5)#98 | 7.2%(+13.4)#1,938 |
| 99. | Camino | 20.4% | 8.1%(+12.3)#99 | 7.2%(+13.2)#1,978 |
| 100. | Greeley Hill | 20.4% | 8.1%(+12.3)#100 | 7.2%(+13.2)#1,982 |
Common Questions
What are the Top 10 Cities with the Highest Percentage of Local Government Employees in California?
Top 10 Cities with the Highest Percentage of Local Government Employees in California are:
#1
100.0%
#2
100.0%
#3
100.0%
#4
86.9%
#5
70.0%
#6
67.9%
#7
67.1%
#8
56.2%
#9
53.3%
#10
50.0%
What city has the Highest Percentage of Local Government Employees in California?
Iron Horse has the Highest Percentage of Local Government Employees in California with 100.0%.
What is the Percentage of Local Government Employees in the State of California?
Percentage of Local Government Employees in California is 8.1%.
What is the Percentage of Local Government Employees in the United States?
Percentage of Local Government Employees in the United States is 7.2%.