Cities with the Highest Percentage of Not-for-profit Organizations in California
RELATED REPORTS & OPTIONS
Not-for-profit Organizations
California
Compare Cities
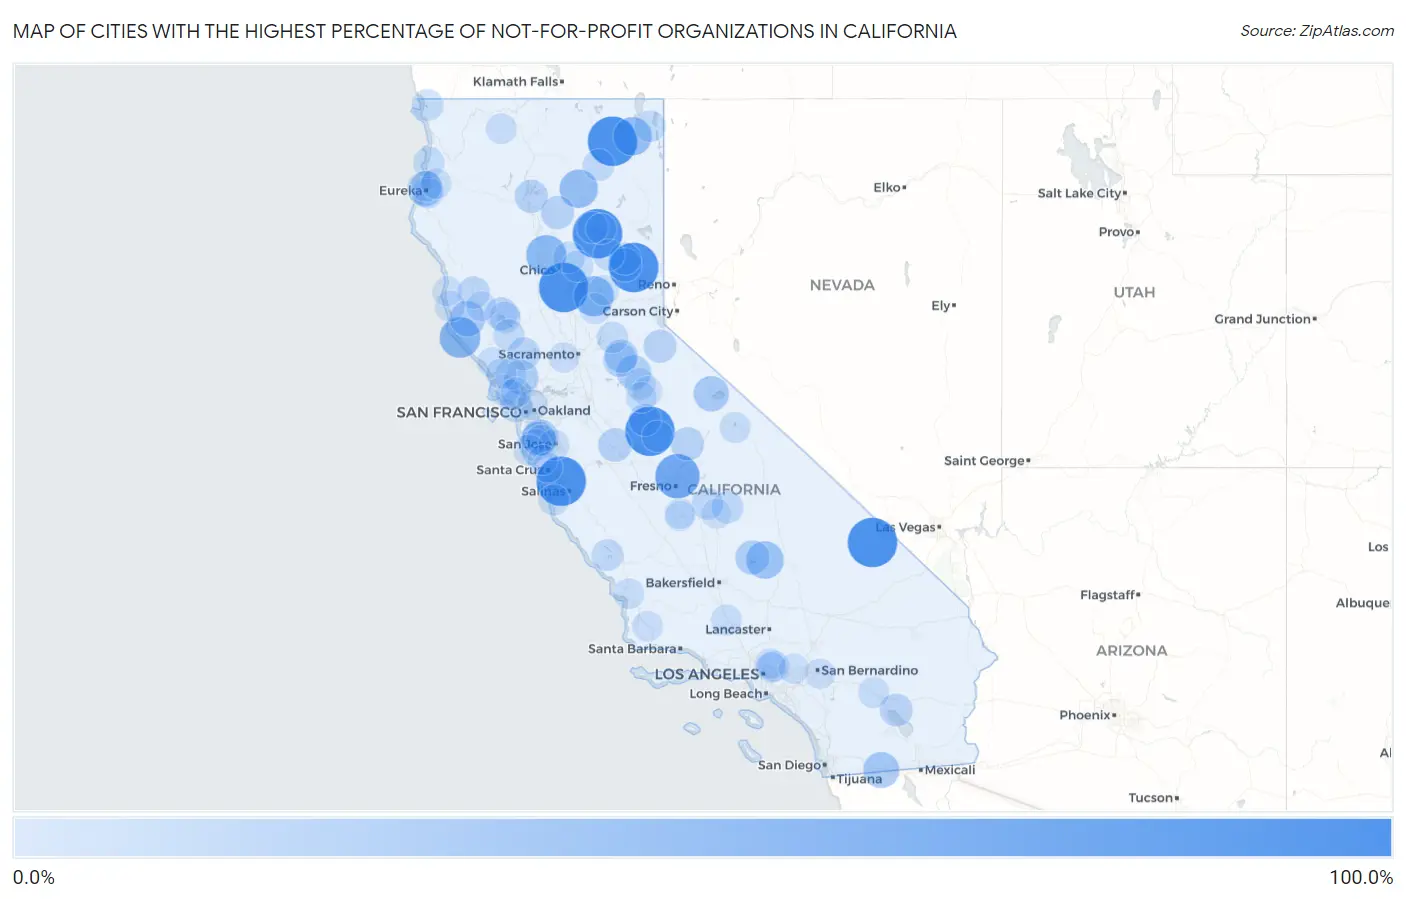
Map of Cities with the Highest Percentage of Not-for-profit Organizations in California
0.0%
100.0%
Cities with the Highest Percentage of Not-for-profit Organizations in California
| City | % Employed in Not-for-profit | vs State | vs National | |
| 1. | Canby | 100.0% | 7.2%(+92.8)#1 | 8.4%(+91.6)#2 |
| 2. | Richvale | 100.0% | 7.2%(+92.8)#2 | 8.4%(+91.6)#4 |
| 3. | Gold Mountain | 100.0% | 7.2%(+92.8)#3 | 8.4%(+91.6)#11 |
| 4. | Hornitos | 100.0% | 7.2%(+92.8)#4 | 8.4%(+91.6)#20 |
| 5. | Prattville | 100.0% | 7.2%(+92.8)#5 | 8.4%(+91.6)#27 |
| 6. | Shoshone | 100.0% | 7.2%(+92.8)#6 | 8.4%(+91.6)#34 |
| 7. | Moss Landing | 100.0% | 7.2%(+92.8)#7 | 8.4%(+91.6)#42 |
| 8. | Fort Washington | 76.2% | 7.2%(+69.1)#8 | 8.4%(+67.8)#60 |
| 9. | Anchor Bay | 60.3% | 7.2%(+53.1)#9 | 8.4%(+51.8)#104 |
| 10. | Dobbins | 58.2% | 7.2%(+51.1)#10 | 8.4%(+49.8)#116 |
| 11. | Vina | 57.7% | 7.2%(+50.5)#11 | 8.4%(+49.2)#118 |
| 12. | Daphnedale Park | 50.7% | 7.2%(+43.6)#12 | 8.4%(+42.3)#167 |
| 13. | Hat Creek | 50.0% | 7.2%(+42.8)#13 | 8.4%(+41.6)#175 |
| 14. | Pepperdine University | 49.7% | 7.2%(+42.5)#14 | 8.4%(+41.3)#187 |
| 15. | Onyx | 46.3% | 7.2%(+39.1)#15 | 8.4%(+37.9)#207 |
| 16. | Stanford | 40.8% | 7.2%(+33.7)#16 | 8.4%(+32.4)#271 |
| 17. | Jacumba | 39.7% | 7.2%(+32.5)#17 | 8.4%(+31.2)#294 |
| 18. | Philo | 37.9% | 7.2%(+30.8)#18 | 8.4%(+29.5)#334 |
| 19. | Mono City | 36.9% | 7.2%(+29.8)#19 | 8.4%(+28.5)#353 |
| 20. | Samoa | 35.4% | 7.2%(+28.3)#20 | 8.4%(+27.0)#381 |
| 21. | Rail Road Flat | 33.3% | 7.2%(+26.2)#21 | 8.4%(+24.9)#452 |
| 22. | Temelec | 33.2% | 7.2%(+26.0)#22 | 8.4%(+24.7)#466 |
| 23. | Ladera | 32.4% | 7.2%(+25.2)#23 | 8.4%(+23.9)#483 |
| 24. | Kernville | 32.0% | 7.2%(+24.8)#24 | 8.4%(+23.5)#499 |
| 25. | Fiddletown | 30.0% | 7.2%(+22.8)#25 | 8.4%(+21.6)#587 |
| 26. | Stevinson | 28.8% | 7.2%(+21.7)#26 | 8.4%(+20.4)#640 |
| 27. | Plumas Eureka | 28.7% | 7.2%(+21.5)#27 | 8.4%(+20.2)#645 |
| 28. | Shingletown | 28.1% | 7.2%(+21.0)#28 | 8.4%(+19.7)#677 |
| 29. | River Pines | 28.1% | 7.2%(+20.9)#29 | 8.4%(+19.6)#681 |
| 30. | Bass Lake | 27.9% | 7.2%(+20.8)#30 | 8.4%(+19.5)#687 |
| 31. | Mountain Gate | 27.4% | 7.2%(+20.3)#31 | 8.4%(+19.0)#718 |
| 32. | Kirkwood | 26.5% | 7.2%(+19.3)#32 | 8.4%(+18.0)#785 |
| 33. | Nice | 26.2% | 7.2%(+19.0)#33 | 8.4%(+17.7)#806 |
| 34. | North Shore | 25.8% | 7.2%(+18.7)#34 | 8.4%(+17.4)#825 |
| 35. | Angwin | 25.5% | 7.2%(+18.3)#35 | 8.4%(+17.0)#849 |
| 36. | Elfin Forest | 24.2% | 7.2%(+17.1)#36 | 8.4%(+15.8)#976 |
| 37. | Willits | 23.8% | 7.2%(+16.6)#37 | 8.4%(+15.3)#1,021 |
| 38. | Muir Beach | 23.5% | 7.2%(+16.3)#38 | 8.4%(+15.0)#1,055 |
| 39. | Lake Don Pedro | 23.4% | 7.2%(+16.2)#39 | 8.4%(+14.9)#1,064 |
| 40. | Cromberg | 22.3% | 7.2%(+15.2)#40 | 8.4%(+13.9)#1,179 |
| 41. | Three Rivers | 22.2% | 7.2%(+15.1)#41 | 8.4%(+13.8)#1,186 |
| 42. | Oak Shores | 22.2% | 7.2%(+15.1)#42 | 8.4%(+13.8)#1,190 |
| 43. | Seville | 21.8% | 7.2%(+14.6)#43 | 8.4%(+13.3)#1,253 |
| 44. | La Honda | 21.4% | 7.2%(+14.2)#44 | 8.4%(+12.9)#1,318 |
| 45. | Cutten | 21.3% | 7.2%(+14.1)#45 | 8.4%(+12.8)#1,336 |
| 46. | Bieber | 21.2% | 7.2%(+14.1)#46 | 8.4%(+12.8)#1,344 |
| 47. | Lucerne | 20.7% | 7.2%(+13.5)#47 | 8.4%(+12.3)#1,431 |
| 48. | Smith River | 20.7% | 7.2%(+13.5)#48 | 8.4%(+12.2)#1,441 |
| 49. | Forest Ranch | 20.6% | 7.2%(+13.5)#49 | 8.4%(+12.2)#1,451 |
| 50. | El Macero | 20.5% | 7.2%(+13.4)#50 | 8.4%(+12.1)#1,460 |
| 51. | Quincy | 20.5% | 7.2%(+13.3)#51 | 8.4%(+12.0)#1,465 |
| 52. | Coloma | 20.5% | 7.2%(+13.3)#52 | 8.4%(+12.0)#1,469 |
| 53. | Lake City | 20.0% | 7.2%(+12.8)#53 | 8.4%(+11.6)#1,570 |
| 54. | Cobb | 19.6% | 7.2%(+12.4)#54 | 8.4%(+11.1)#1,633 |
| 55. | Concow | 19.4% | 7.2%(+12.3)#55 | 8.4%(+11.0)#1,658 |
| 56. | Catheys Valley | 19.4% | 7.2%(+12.2)#56 | 8.4%(+10.9)#1,670 |
| 57. | Chester | 19.4% | 7.2%(+12.2)#57 | 8.4%(+10.9)#1,672 |
| 58. | Big Lagoon | 18.9% | 7.2%(+11.8)#58 | 8.4%(+10.5)#1,779 |
| 59. | Forest Meadows | 18.9% | 7.2%(+11.8)#59 | 8.4%(+10.5)#1,783 |
| 60. | Carmel By The Sea | 18.7% | 7.2%(+11.6)#60 | 8.4%(+10.3)#1,834 |
| 61. | Penngrove | 18.7% | 7.2%(+11.5)#61 | 8.4%(+10.2)#1,848 |
| 62. | Sierra Madre | 18.2% | 7.2%(+11.1)#62 | 8.4%(+9.80)#1,962 |
| 63. | Crowley Lake | 18.2% | 7.2%(+11.0)#63 | 8.4%(+9.74)#1,971 |
| 64. | Knights Ferry | 18.2% | 7.2%(+11.0)#64 | 8.4%(+9.74)#1,982 |
| 65. | Desert Palms | 18.0% | 7.2%(+10.9)#65 | 8.4%(+9.60)#2,034 |
| 66. | Penn Valley | 17.9% | 7.2%(+10.8)#66 | 8.4%(+9.48)#2,069 |
| 67. | Lebec | 17.9% | 7.2%(+10.7)#67 | 8.4%(+9.41)#2,086 |
| 68. | Fruitdale | 17.8% | 7.2%(+10.7)#68 | 8.4%(+9.38)#2,099 |
| 69. | Pescadero | 17.5% | 7.2%(+10.4)#69 | 8.4%(+9.08)#2,194 |
| 70. | Manila | 17.1% | 7.2%(+9.94)#70 | 8.4%(+8.65)#2,330 |
| 71. | Sonora | 17.1% | 7.2%(+9.91)#71 | 8.4%(+8.63)#2,334 |
| 72. | Monte Rio | 17.0% | 7.2%(+9.81)#72 | 8.4%(+8.53)#2,377 |
| 73. | Fort Jones | 16.9% | 7.2%(+9.70)#73 | 8.4%(+8.41)#2,416 |
| 74. | Edna | 16.9% | 7.2%(+9.70)#74 | 8.4%(+8.41)#2,418 |
| 75. | Point Reyes Station | 16.8% | 7.2%(+9.65)#75 | 8.4%(+8.37)#2,430 |
| 76. | Los Alamos | 16.7% | 7.2%(+9.51)#76 | 8.4%(+8.22)#2,466 |
| 77. | Albion | 16.7% | 7.2%(+9.51)#77 | 8.4%(+8.22)#2,475 |
| 78. | Las Flores Cdp Tehama County | 16.7% | 7.2%(+9.51)#78 | 8.4%(+8.22)#2,490 |
| 79. | Sonoma State University | 16.5% | 7.2%(+9.32)#79 | 8.4%(+8.03)#2,567 |
| 80. | Altadena | 16.4% | 7.2%(+9.28)#80 | 8.4%(+7.99)#2,581 |
| 81. | San Geronimo | 16.4% | 7.2%(+9.21)#81 | 8.4%(+7.93)#2,607 |
| 82. | San Pasqual | 16.4% | 7.2%(+9.20)#82 | 8.4%(+7.92)#2,612 |
| 83. | Palo Alto | 16.3% | 7.2%(+9.12)#83 | 8.4%(+7.84)#2,644 |
| 84. | Berkeley | 16.2% | 7.2%(+9.07)#84 | 8.4%(+7.78)#2,673 |
| 85. | Hamilton Branch | 16.1% | 7.2%(+8.99)#85 | 8.4%(+7.70)#2,714 |
| 86. | Blue Lake | 16.0% | 7.2%(+8.85)#86 | 8.4%(+7.57)#2,778 |
| 87. | Loma Linda | 15.6% | 7.2%(+8.48)#87 | 8.4%(+7.19)#2,966 |
| 88. | Bloomfield | 15.6% | 7.2%(+8.44)#88 | 8.4%(+7.15)#2,981 |
| 89. | Lucas Valley Marinwood | 15.6% | 7.2%(+8.43)#89 | 8.4%(+7.14)#2,988 |
| 90. | University Of California Davis | 15.5% | 7.2%(+8.31)#90 | 8.4%(+7.02)#3,057 |
| 91. | Claremont | 15.4% | 7.2%(+8.26)#91 | 8.4%(+6.97)#3,080 |
| 92. | Lindcove | 15.2% | 7.2%(+7.99)#92 | 8.4%(+6.71)#3,231 |
| 93. | Camptonville | 15.0% | 7.2%(+7.84)#93 | 8.4%(+6.56)#3,331 |
| 94. | Armona | 14.9% | 7.2%(+7.71)#94 | 8.4%(+6.43)#3,403 |
| 95. | Grangeville | 14.9% | 7.2%(+7.71)#95 | 8.4%(+6.42)#3,412 |
| 96. | Brookdale | 14.8% | 7.2%(+7.63)#96 | 8.4%(+6.35)#3,462 |
| 97. | Cedar Ridge | 14.8% | 7.2%(+7.60)#97 | 8.4%(+6.32)#3,479 |
| 98. | Calpella | 14.7% | 7.2%(+7.55)#98 | 8.4%(+6.26)#3,507 |
| 99. | Fort Bragg | 14.7% | 7.2%(+7.54)#99 | 8.4%(+6.25)#3,519 |
| 100. | Pasatiempo | 14.6% | 7.2%(+7.49)#100 | 8.4%(+6.20)#3,559 |
Common Questions
What are the Top 10 Cities with the Highest Percentage of Not-for-profit Organizations in California?
Top 10 Cities with the Highest Percentage of Not-for-profit Organizations in California are:
#1
100.0%
#2
100.0%
#3
100.0%
#4
100.0%
#5
100.0%
#6
100.0%
#7
100.0%
#8
76.2%
#9
60.3%
#10
58.2%
What city has the Highest Percentage of Not-for-profit Organizations in California?
Canby has the Highest Percentage of Not-for-profit Organizations in California with 100.0%.
What is the Percentage of Not-for-profit Organizations in the State of California?
Percentage of Not-for-profit Organizations in California is 7.2%.
What is the Percentage of Not-for-profit Organizations in the United States?
Percentage of Not-for-profit Organizations in the United States is 8.4%.