Cities with the Lowest Poverty Level Among Single Males in California
RELATED REPORTS & OPTIONS
Lowest Poverty | Single Male
California
Compare Cities
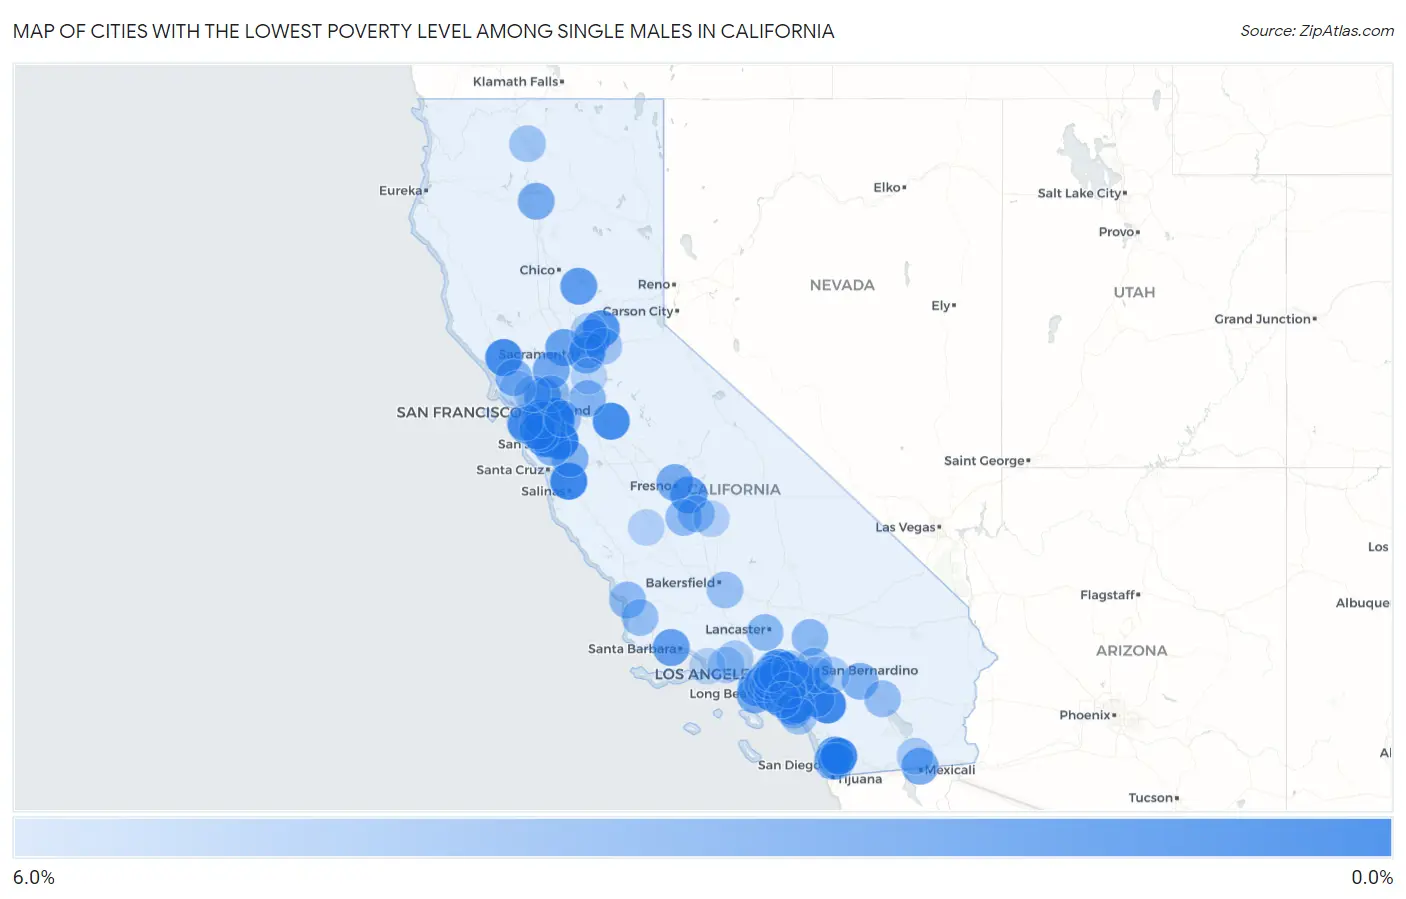
Map of Cities with the Lowest Poverty Level Among Single Males in California
6.0%
0.0%
Cities with the Lowest Poverty Level Among Single Males in California
| City | Single Male Poverty | vs State | vs National | |
| 1. | Dublin | 0.44% | 11.1%(-10.6)#1 | 12.4%(-12.0)#4 |
| 2. | Prunedale | 0.60% | 11.1%(-10.5)#2 | 12.4%(-11.8)#14 |
| 3. | French Valley | 0.73% | 11.1%(-10.3)#3 | 12.4%(-11.7)#20 |
| 4. | Mountain View | 0.85% | 11.1%(-10.2)#4 | 12.4%(-11.6)#24 |
| 5. | Empire | 0.94% | 11.1%(-10.1)#5 | 12.4%(-11.5)#28 |
| 6. | Windsor | 0.98% | 11.1%(-10.1)#6 | 12.4%(-11.5)#32 |
| 7. | Vincent | 1.2% | 11.1%(-9.84)#7 | 12.4%(-11.2)#62 |
| 8. | Aliso Viejo | 1.3% | 11.1%(-9.82)#8 | 12.4%(-11.2)#64 |
| 9. | North Auburn | 1.4% | 11.1%(-9.68)#9 | 12.4%(-11.0)#83 |
| 10. | Winter Gardens | 1.4% | 11.1%(-9.65)#10 | 12.4%(-11.0)#85 |
| 11. | Pleasanton | 1.4% | 11.1%(-9.64)#11 | 12.4%(-11.0)#88 |
| 12. | Parlier | 1.7% | 11.1%(-9.35)#12 | 12.4%(-10.7)#132 |
| 13. | Signal Hill | 1.7% | 11.1%(-9.34)#13 | 12.4%(-10.7)#134 |
| 14. | Monrovia | 1.7% | 11.1%(-9.33)#14 | 12.4%(-10.7)#135 |
| 15. | Fountain Valley | 1.8% | 11.1%(-9.26)#15 | 12.4%(-10.6)#148 |
| 16. | East Foothills | 1.9% | 11.1%(-9.23)#16 | 12.4%(-10.6)#152 |
| 17. | Oroville East | 1.9% | 11.1%(-9.19)#17 | 12.4%(-10.5)#159 |
| 18. | Lake Elsinore | 1.9% | 11.1%(-9.15)#18 | 12.4%(-10.5)#167 |
| 19. | Millbrae | 1.9% | 11.1%(-9.13)#19 | 12.4%(-10.5)#172 |
| 20. | Alum Rock | 2.0% | 11.1%(-9.09)#20 | 12.4%(-10.4)#178 |
| 21. | Cypress | 2.0% | 11.1%(-9.03)#21 | 12.4%(-10.4)#181 |
| 22. | Santee | 2.1% | 11.1%(-9.01)#22 | 12.4%(-10.4)#184 |
| 23. | Newark | 2.1% | 11.1%(-9.00)#23 | 12.4%(-10.4)#186 |
| 24. | Goleta | 2.1% | 11.1%(-8.99)#24 | 12.4%(-10.3)#187 |
| 25. | Foster City | 2.1% | 11.1%(-8.94)#25 | 12.4%(-10.3)#197 |
| 26. | Redondo Beach | 2.2% | 11.1%(-8.90)#26 | 12.4%(-10.3)#212 |
| 27. | Martinez | 2.2% | 11.1%(-8.86)#27 | 12.4%(-10.2)#216 |
| 28. | Woodland | 2.2% | 11.1%(-8.85)#28 | 12.4%(-10.2)#221 |
| 29. | Rocklin | 2.3% | 11.1%(-8.83)#29 | 12.4%(-10.2)#224 |
| 30. | Eastvale | 2.3% | 11.1%(-8.80)#30 | 12.4%(-10.2)#233 |
| 31. | Citrus | 2.3% | 11.1%(-8.76)#31 | 12.4%(-10.1)#238 |
| 32. | Vacaville | 2.5% | 11.1%(-8.58)#32 | 12.4%(-9.93)#271 |
| 33. | Norco | 2.6% | 11.1%(-8.49)#33 | 12.4%(-9.85)#280 |
| 34. | Calexico | 2.6% | 11.1%(-8.44)#34 | 12.4%(-9.79)#286 |
| 35. | Rancho Palos Verdes | 2.7% | 11.1%(-8.39)#35 | 12.4%(-9.75)#293 |
| 36. | Walnut Park | 2.7% | 11.1%(-8.38)#36 | 12.4%(-9.73)#296 |
| 37. | La Riviera | 2.7% | 11.1%(-8.34)#37 | 12.4%(-9.70)#303 |
| 38. | Old Fig Garden | 2.8% | 11.1%(-8.28)#38 | 12.4%(-9.63)#309 |
| 39. | Bella Vista | 2.8% | 11.1%(-8.25)#39 | 12.4%(-9.61)#314 |
| 40. | San Leandro | 2.9% | 11.1%(-8.22)#40 | 12.4%(-9.58)#322 |
| 41. | North Tustin | 2.9% | 11.1%(-8.21)#41 | 12.4%(-9.57)#326 |
| 42. | Buena Park | 2.9% | 11.1%(-8.19)#42 | 12.4%(-9.55)#330 |
| 43. | Tustin | 3.0% | 11.1%(-8.06)#43 | 12.4%(-9.41)#357 |
| 44. | Petaluma | 3.1% | 11.1%(-8.00)#44 | 12.4%(-9.35)#371 |
| 45. | Sunnyvale | 3.1% | 11.1%(-7.95)#45 | 12.4%(-9.31)#380 |
| 46. | Morgan Hill | 3.2% | 11.1%(-7.89)#46 | 12.4%(-9.24)#395 |
| 47. | Desert Hot Springs | 3.2% | 11.1%(-7.86)#47 | 12.4%(-9.21)#396 |
| 48. | West Rancho Dominguez | 3.3% | 11.1%(-7.81)#48 | 12.4%(-9.16)#410 |
| 49. | Country Club | 3.3% | 11.1%(-7.76)#49 | 12.4%(-9.12)#420 |
| 50. | Campbell | 3.4% | 11.1%(-7.72)#50 | 12.4%(-9.07)#430 |
| 51. | Rowland Heights | 3.4% | 11.1%(-7.69)#51 | 12.4%(-9.04)#438 |
| 52. | Menlo Park | 3.4% | 11.1%(-7.66)#52 | 12.4%(-9.02)#443 |
| 53. | El Sobrante Cdp Contra Costa County | 3.4% | 11.1%(-7.65)#53 | 12.4%(-9.01)#444 |
| 54. | Adelanto | 3.5% | 11.1%(-7.55)#54 | 12.4%(-8.91)#467 |
| 55. | La Mesa | 3.5% | 11.1%(-7.55)#55 | 12.4%(-8.90)#470 |
| 56. | Quartz Hill | 3.6% | 11.1%(-7.49)#56 | 12.4%(-8.85)#483 |
| 57. | San Lorenzo | 3.6% | 11.1%(-7.48)#57 | 12.4%(-8.83)#488 |
| 58. | Carmichael | 3.6% | 11.1%(-7.44)#58 | 12.4%(-8.79)#502 |
| 59. | Redwood City | 3.7% | 11.1%(-7.42)#59 | 12.4%(-8.77)#504 |
| 60. | Grover Beach | 3.7% | 11.1%(-7.39)#60 | 12.4%(-8.74)#508 |
| 61. | Goshen | 3.8% | 11.1%(-7.32)#61 | 12.4%(-8.67)#519 |
| 62. | Casa De Oro Mount Helix | 3.8% | 11.1%(-7.27)#62 | 12.4%(-8.62)#531 |
| 63. | Laguna Niguel | 3.8% | 11.1%(-7.25)#63 | 12.4%(-8.60)#537 |
| 64. | Paramount | 3.8% | 11.1%(-7.23)#64 | 12.4%(-8.59)#538 |
| 65. | Home Garden | 3.8% | 11.1%(-7.23)#65 | 12.4%(-8.59)#540 |
| 66. | Bay Point | 3.9% | 11.1%(-7.19)#66 | 12.4%(-8.54)#546 |
| 67. | Livermore | 3.9% | 11.1%(-7.16)#67 | 12.4%(-8.52)#555 |
| 68. | Muscoy | 3.9% | 11.1%(-7.14)#68 | 12.4%(-8.49)#563 |
| 69. | Coachella | 3.9% | 11.1%(-7.13)#69 | 12.4%(-8.49)#566 |
| 70. | Orcutt | 3.9% | 11.1%(-7.13)#70 | 12.4%(-8.49)#567 |
| 71. | Mission Viejo | 4.0% | 11.1%(-7.07)#71 | 12.4%(-8.42)#583 |
| 72. | Arcadia | 4.1% | 11.1%(-7.02)#72 | 12.4%(-8.37)#596 |
| 73. | Lakeside | 4.1% | 11.1%(-6.99)#73 | 12.4%(-8.35)#603 |
| 74. | Lamont | 4.1% | 11.1%(-6.95)#74 | 12.4%(-8.31)#612 |
| 75. | Seal Beach | 4.1% | 11.1%(-6.94)#75 | 12.4%(-8.29)#616 |
| 76. | Pico Rivera | 4.2% | 11.1%(-6.88)#76 | 12.4%(-8.24)#635 |
| 77. | Weed | 4.2% | 11.1%(-6.86)#77 | 12.4%(-8.21)#639 |
| 78. | El Dorado Hills | 4.2% | 11.1%(-6.85)#78 | 12.4%(-8.20)#640 |
| 79. | San Bruno | 4.3% | 11.1%(-6.83)#79 | 12.4%(-8.18)#642 |
| 80. | San Clemente | 4.3% | 11.1%(-6.79)#80 | 12.4%(-8.14)#655 |
| 81. | Rexland Acres | 4.3% | 11.1%(-6.73)#81 | 12.4%(-8.09)#663 |
| 82. | Grand Terrace | 4.4% | 11.1%(-6.68)#82 | 12.4%(-8.03)#677 |
| 83. | Imperial | 4.5% | 11.1%(-6.60)#83 | 12.4%(-7.95)#698 |
| 84. | Simi Valley | 4.5% | 11.1%(-6.59)#84 | 12.4%(-7.95)#703 |
| 85. | Downey | 4.5% | 11.1%(-6.58)#85 | 12.4%(-7.94)#706 |
| 86. | Thousand Oaks | 4.6% | 11.1%(-6.51)#86 | 12.4%(-7.87)#717 |
| 87. | Avocado Heights | 4.6% | 11.1%(-6.50)#87 | 12.4%(-7.85)#723 |
| 88. | Chino | 4.6% | 11.1%(-6.46)#88 | 12.4%(-7.82)#735 |
| 89. | La Verne | 4.6% | 11.1%(-6.44)#89 | 12.4%(-7.80)#741 |
| 90. | Orange | 4.7% | 11.1%(-6.40)#90 | 12.4%(-7.76)#751 |
| 91. | Yucaipa | 4.7% | 11.1%(-6.33)#91 | 12.4%(-7.69)#773 |
| 92. | Hercules | 4.8% | 11.1%(-6.32)#92 | 12.4%(-7.67)#774 |
| 93. | Lincoln | 4.9% | 11.1%(-6.20)#93 | 12.4%(-7.56)#797 |
| 94. | South San Gabriel | 4.9% | 11.1%(-6.20)#94 | 12.4%(-7.56)#798 |
| 95. | Coalinga | 5.0% | 11.1%(-6.12)#95 | 12.4%(-7.47)#821 |
| 96. | Exeter | 5.0% | 11.1%(-6.11)#96 | 12.4%(-7.46)#826 |
| 97. | Costa Mesa | 5.0% | 11.1%(-6.11)#97 | 12.4%(-7.46)#827 |
| 98. | Channel Islands Beach | 5.0% | 11.1%(-6.08)#98 | 12.4%(-7.44)#833 |
| 99. | Galt | 5.1% | 11.1%(-6.03)#99 | 12.4%(-7.38)#853 |
| 100. | Novato | 5.1% | 11.1%(-5.97)#100 | 12.4%(-7.33)#862 |
Common Questions
What are the Top 10 Cities with the Lowest Poverty Level Among Single Males in California?
Top 10 Cities with the Lowest Poverty Level Among Single Males in California are:
#1
0.44%
#2
0.60%
#3
0.73%
#4
0.85%
#5
0.94%
#6
0.98%
#7
1.2%
#8
1.3%
#9
1.4%
#10
1.4%
What city has the Lowest Poverty Level Among Single Males in California?
Dublin has the Lowest Poverty Level Among Single Males in California with 0.44%.
What is the Poverty Level Among Single Males in the State of California?
Poverty Level Among Single Males in California is 11.1%.
What is the Poverty Level Among Single Males in the United States?
Poverty Level Among Single Males in the United States is 12.4%.