Cities with the Highest Percentage of Inupiat Population in California
RELATED REPORTS & OPTIONS
Inupiat
California
Compare Cities
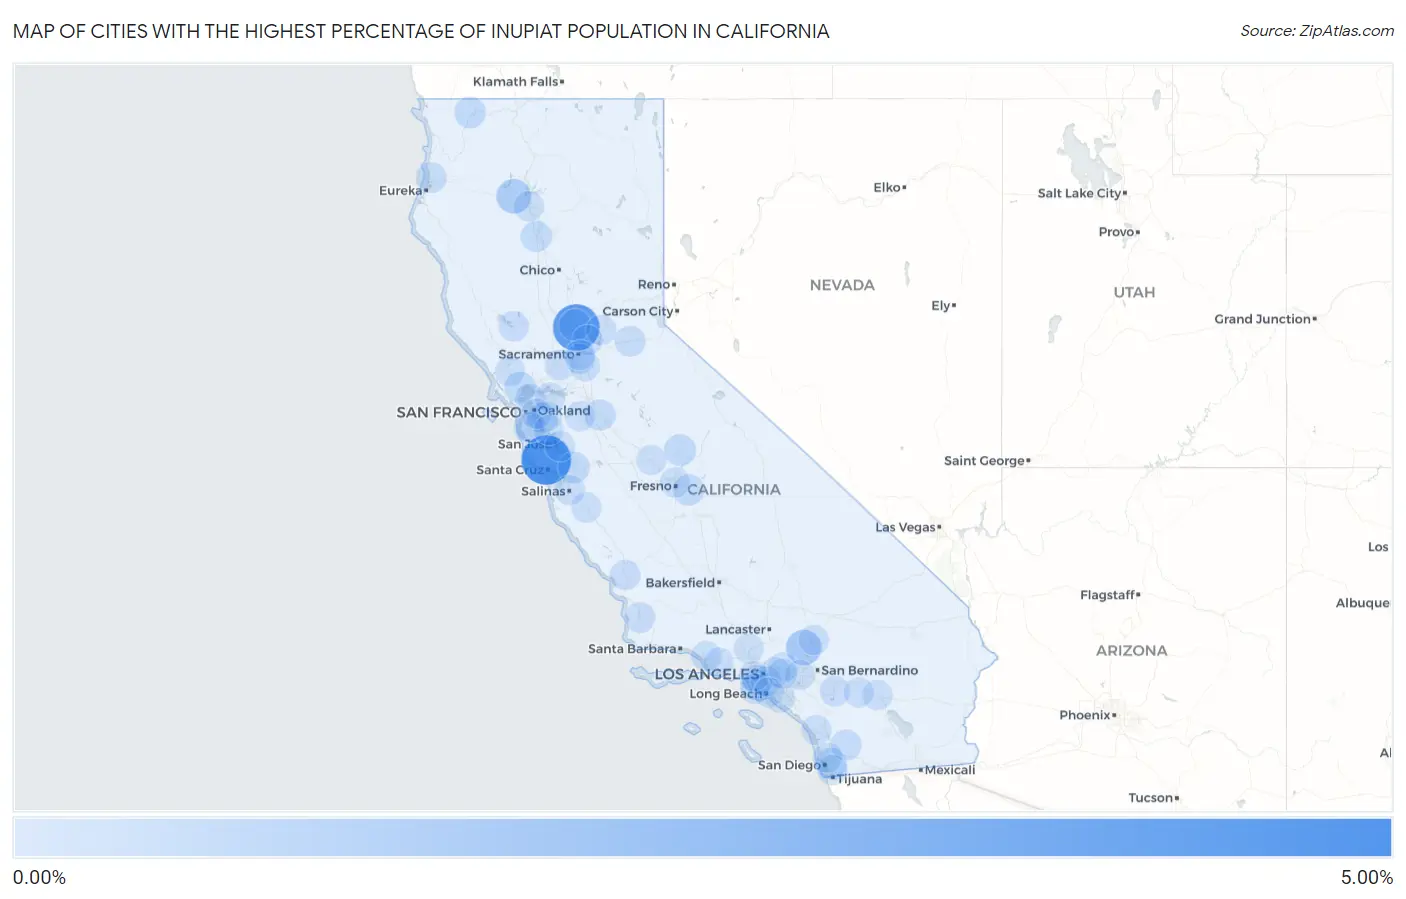
Map of Cities with the Highest Percentage of Inupiat Population in California
0.00%
5.00%
Cities with the Highest Percentage of Inupiat Population in California
| City | Inupiat | vs State | vs National | |
| 1. | Lompico | 4.83% | 0.0058%(+4.82)#1 | 0.014%(+4.82)#65 |
| 2. | Rio Oso | 4.08% | 0.0058%(+4.07)#2 | 0.014%(+4.06)#73 |
| 3. | Phelan | 1.27% | 0.0058%(+1.26)#3 | 0.014%(+1.26)#155 |
| 4. | French Gulch | 1.06% | 0.0058%(+1.05)#4 | 0.014%(+1.05)#165 |
| 5. | Plumas Lake | 0.37% | 0.0058%(+0.368)#5 | 0.014%(+0.359)#238 |
| 6. | Gilroy | 0.33% | 0.0058%(+0.325)#6 | 0.014%(+0.316)#246 |
| 7. | Coarsegold | 0.33% | 0.0058%(+0.322)#7 | 0.014%(+0.314)#248 |
| 8. | Black Point Green Point | 0.30% | 0.0058%(+0.291)#8 | 0.014%(+0.283)#255 |
| 9. | Happy Camp | 0.29% | 0.0058%(+0.289)#9 | 0.014%(+0.280)#257 |
| 10. | Sanger | 0.27% | 0.0058%(+0.262)#10 | 0.014%(+0.253)#261 |
| 11. | Red Bluff | 0.26% | 0.0058%(+0.255)#11 | 0.014%(+0.247)#264 |
| 12. | Ripon | 0.24% | 0.0058%(+0.230)#12 | 0.014%(+0.222)#272 |
| 13. | Lemon Grove | 0.23% | 0.0058%(+0.223)#13 | 0.014%(+0.215)#277 |
| 14. | San Diego Country Estates | 0.15% | 0.0058%(+0.141)#14 | 0.014%(+0.132)#334 |
| 15. | Mckinleyville | 0.14% | 0.0058%(+0.130)#15 | 0.014%(+0.122)#342 |
| 16. | Pollock Pines | 0.14% | 0.0058%(+0.129)#16 | 0.014%(+0.121)#343 |
| 17. | Dixon | 0.11% | 0.0058%(+0.104)#17 | 0.014%(+0.096)#376 |
| 18. | Lawndale | 0.095% | 0.0058%(+0.089)#18 | 0.014%(+0.081)#392 |
| 19. | Orcutt | 0.090% | 0.0058%(+0.084)#19 | 0.014%(+0.076)#402 |
| 20. | Hillsborough | 0.089% | 0.0058%(+0.083)#20 | 0.014%(+0.075)#404 |
| 21. | Atascadero | 0.081% | 0.0058%(+0.075)#21 | 0.014%(+0.067)#412 |
| 22. | Auburn | 0.065% | 0.0058%(+0.060)#22 | 0.014%(+0.051)#433 |
| 23. | San Buenaventura Ventura | 0.062% | 0.0058%(+0.056)#23 | 0.014%(+0.048)#439 |
| 24. | Lemon Hill | 0.061% | 0.0058%(+0.055)#24 | 0.014%(+0.047)#443 |
| 25. | San Jacinto | 0.059% | 0.0058%(+0.053)#25 | 0.014%(+0.045)#447 |
| 26. | Redding | 0.056% | 0.0058%(+0.050)#26 | 0.014%(+0.042)#456 |
| 27. | Clearlake | 0.054% | 0.0058%(+0.048)#27 | 0.014%(+0.040)#458 |
| 28. | Elk Grove | 0.040% | 0.0058%(+0.034)#28 | 0.014%(+0.026)#488 |
| 29. | Chula Vista | 0.038% | 0.0058%(+0.033)#29 | 0.014%(+0.024)#497 |
| 30. | Indio | 0.037% | 0.0058%(+0.031)#30 | 0.014%(+0.023)#501 |
| 31. | Richmond | 0.034% | 0.0058%(+0.028)#31 | 0.014%(+0.020)#508 |
| 32. | Soledad | 0.028% | 0.0058%(+0.022)#32 | 0.014%(+0.014)#520 |
| 33. | Fountain Valley | 0.028% | 0.0058%(+0.022)#33 | 0.014%(+0.014)#521 |
| 34. | El Monte | 0.027% | 0.0058%(+0.021)#34 | 0.014%(+0.013)#528 |
| 35. | Chowchilla | 0.027% | 0.0058%(+0.021)#35 | 0.014%(+0.013)#529 |
| 36. | Castro Valley | 0.026% | 0.0058%(+0.020)#36 | 0.014%(+0.012)#531 |
| 37. | Tracy | 0.026% | 0.0058%(+0.020)#37 | 0.014%(+0.011)#535 |
| 38. | Palm Springs | 0.024% | 0.0058%(+0.019)#38 | 0.014%(+0.010)#542 |
| 39. | San Jose | 0.024% | 0.0058%(+0.018)#39 | 0.014%(+0.010)#547 |
| 40. | Santa Clarita | 0.023% | 0.0058%(+0.018)#40 | 0.014%(+0.009)#549 |
| 41. | Rohnert Park | 0.022% | 0.0058%(+0.017)#41 | 0.014%(+0.008)#556 |
| 42. | Ashland | 0.022% | 0.0058%(+0.016)#42 | 0.014%(+0.007)#559 |
| 43. | Concord | 0.021% | 0.0058%(+0.015)#43 | 0.014%(+0.007)#563 |
| 44. | Roseville | 0.019% | 0.0058%(+0.014)#44 | 0.014%(+0.005)#568 |
| 45. | San Mateo | 0.019% | 0.0058%(+0.013)#45 | 0.014%(+0.005)#569 |
| 46. | Inglewood | 0.019% | 0.0058%(+0.013)#46 | 0.014%(+0.005)#573 |
| 47. | South Gate | 0.018% | 0.0058%(+0.013)#47 | 0.014%(+0.004)#576 |
| 48. | Victorville | 0.018% | 0.0058%(+0.012)#48 | 0.014%(+0.004)#577 |
| 49. | Camarillo | 0.017% | 0.0058%(+0.011)#49 | 0.014%(+0.003)#583 |
| 50. | Oceanside | 0.016% | 0.0058%(+0.010)#50 | 0.014%(+0.002)#588 |
| 51. | Salinas | 0.016% | 0.0058%(+0.010)#51 | 0.014%(+0.002)#589 |
| 52. | Oakland | 0.011% | 0.0058%(+0.005)#52 | 0.014%(-0.003)#624 |
| 53. | Azusa | 0.0080% | 0.0058%(+0.002)#53 | 0.014%(-0.006)#649 |
| 54. | Fresno | 0.0072% | 0.0058%(+0.001)#54 | 0.014%(-0.007)#653 |
| 55. | Ontario | 0.0051% | 0.0058%(-0.001)#55 | 0.014%(-0.009)#674 |
| 56. | Torrance | 0.0034% | 0.0058%(-0.002)#56 | 0.014%(-0.011)#694 |
| 57. | West Covina | 0.0028% | 0.0058%(-0.003)#57 | 0.014%(-0.011)#702 |
| 58. | Los Angeles | 0.0026% | 0.0058%(-0.003)#58 | 0.014%(-0.012)#704 |
| 59. | Long Beach | 0.0019% | 0.0058%(-0.004)#59 | 0.014%(-0.012)#714 |
| 60. | Sacramento | 0.0015% | 0.0058%(-0.004)#60 | 0.014%(-0.013)#718 |
| 61. | Fremont | 0.00087% | 0.0058%(-0.005)#61 | 0.014%(-0.013)#724 |
| 62. | San Diego | 0.00065% | 0.0058%(-0.005)#62 | 0.014%(-0.013)#726 |
Common Questions
What are the Top 10 Cities with the Highest Percentage of Inupiat Population in California?
Top 10 Cities with the Highest Percentage of Inupiat Population in California are:
#1
4.83%
#2
4.08%
#3
1.27%
#4
1.06%
#5
0.37%
#6
0.33%
#7
0.33%
#8
0.30%
#9
0.29%
#10
0.27%
What city has the Highest Percentage of Inupiat Population in California?
Lompico has the Highest Percentage of Inupiat Population in California with 4.83%.
What is the Percentage of Inupiat Population in the State of California?
Percentage of Inupiat Population in California is 0.0058%.
What is the Percentage of Inupiat Population in the United States?
Percentage of Inupiat Population in the United States is 0.014%.