New Mexico Map & Demographics
New Mexico Map
New Mexico Overview
Jan 6, 1912
INCORPORATED
121,590
TOTAL AREA [ SQ MI ]
121,297
LAND AREA [ SQ MI ]
293
WATER AREA [ SQ MI ]
5,700
ELEVATION AVG [ FT ]
13,161
ELEVATION HIGH [ FT ]
2,842
ELEVATION LOW [ FT ]
17.4
POP DENSITY [ PPL / SQ MI ]
$32,667
PER CAPITA INCOME
$72,422
AVG FAMILY INCOME
$58,722
AVG HOUSEHOLD INCOME
25.7%
WAGE / INCOME GAP [ % ]
74.3¢/ $1
WAGE / INCOME GAP [ $ ]
$11,080
FAMILY INCOME DEFICIT
0.48
INEQUALITY / GINI INDEX
87121
LARGEST ZIP CODE
Albuquerque
LARGEST CITY
Bernalillo County
LARGEST COUNTY
2,112,463
TOTAL POPULATION
1,052,858
MALE POPULATION
1,059,605
FEMALE POPULATION
99.36
MALES / 100 FEMALES
100.64
FEMALES / 100 MALES
38.6
MEDIAN AGE
3.2
AVG FAMILY SIZE
2.5
AVG HOUSEHOLD SIZE
977,087
LABOR FORCE [ PEOPLE ]
57.6%
PERCENT IN LABOR FORCE
6.2%
UNEMPLOYMENT RATE
Income in New Mexico
Income Overview in New Mexico
Per Capita Income in New Mexico is $32,667, while median incomes of families and households are $72,422 and $58,722 respectively.
| Characteristic | Number | Measure |
| Per Capita Income | 2,112,463 | $32,667 |
| Median Family Income | 503,154 | $72,422 |
| Mean Family Income | 503,154 | $95,066 |
| Median Household Income | 812,852 | $58,722 |
| Mean Household Income | 812,852 | $81,035 |
| Income Deficit | 503,154 | $11,080 |
| Wage / Income Gap (%) | 2,112,463 | 25.69% |
| Wage / Income Gap ($) | 2,112,463 | 74.31¢ per $1 |
| Gini / Inequality Index | 2,112,463 | 0.48 |
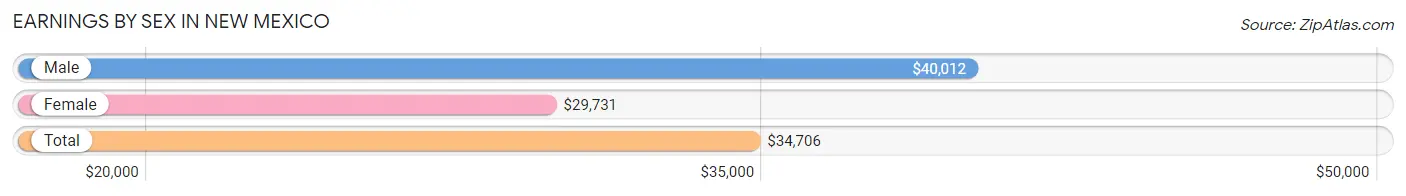
Earnings by Sex in New Mexico
Average Earnings in New Mexico are $34,706, $40,012 for men and $29,731 for women, a difference of 25.7%.
| Sex | Number | Average Earnings |
| Male | 539,551 (52.9%) | $40,012 |
| Female | 479,786 (47.1%) | $29,731 |
| Total | 1,019,337 (100.0%) | $34,706 |
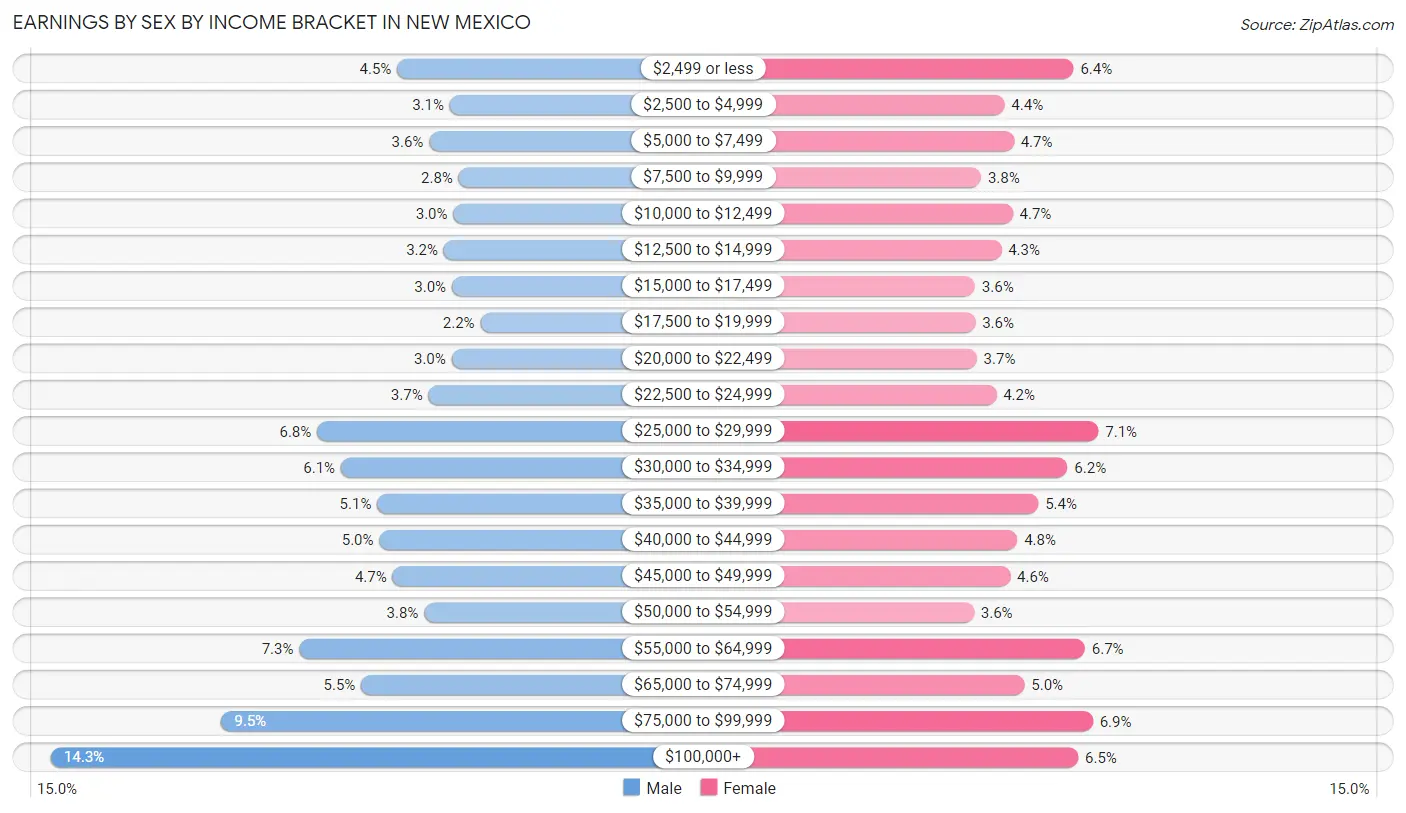
Earnings by Sex by Income Bracket in New Mexico
The most common earnings brackets in New Mexico are $100,000+ for men (76,922 | 14.3%) and $25,000 to $29,999 for women (33,923 | 7.1%).
| Income | Male | Female |
| $2,499 or less | 24,437 (4.5%) | 30,567 (6.4%) |
| $2,500 to $4,999 | 16,454 (3.0%) | 21,252 (4.4%) |
| $5,000 to $7,499 | 19,565 (3.6%) | 22,490 (4.7%) |
| $7,500 to $9,999 | 15,128 (2.8%) | 18,064 (3.8%) |
| $10,000 to $12,499 | 15,943 (2.9%) | 22,346 (4.7%) |
| $12,500 to $14,999 | 17,370 (3.2%) | 20,846 (4.3%) |
| $15,000 to $17,499 | 16,107 (3.0%) | 17,255 (3.6%) |
| $17,500 to $19,999 | 11,807 (2.2%) | 17,312 (3.6%) |
| $20,000 to $22,499 | 16,168 (3.0%) | 17,520 (3.6%) |
| $22,500 to $24,999 | 19,672 (3.6%) | 20,132 (4.2%) |
| $25,000 to $29,999 | 36,578 (6.8%) | 33,923 (7.1%) |
| $30,000 to $34,999 | 32,985 (6.1%) | 29,746 (6.2%) |
| $35,000 to $39,999 | 27,482 (5.1%) | 25,804 (5.4%) |
| $40,000 to $44,999 | 27,161 (5.0%) | 22,991 (4.8%) |
| $45,000 to $49,999 | 25,124 (4.7%) | 22,027 (4.6%) |
| $50,000 to $54,999 | 20,367 (3.8%) | 17,149 (3.6%) |
| $55,000 to $64,999 | 39,296 (7.3%) | 32,104 (6.7%) |
| $65,000 to $74,999 | 29,881 (5.5%) | 23,938 (5.0%) |
| $75,000 to $99,999 | 51,104 (9.5%) | 33,154 (6.9%) |
| $100,000+ | 76,922 (14.3%) | 31,166 (6.5%) |
| Total | 539,551 (100.0%) | 479,786 (100.0%) |
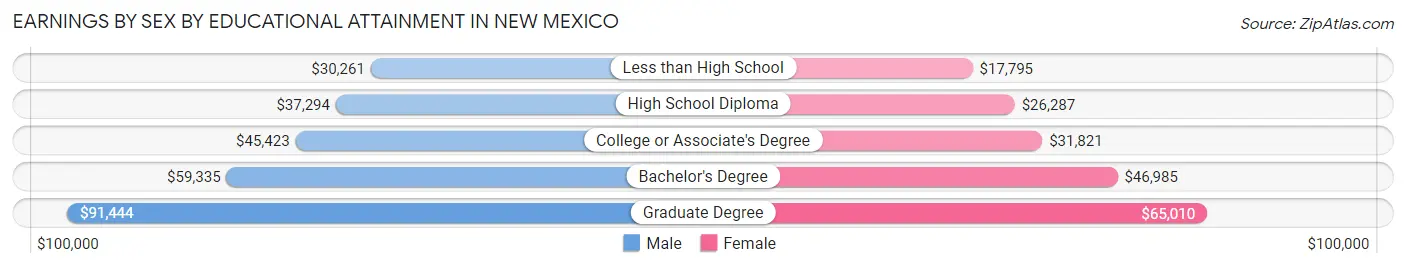
Earnings by Sex by Educational Attainment in New Mexico
Average earnings in New Mexico are $46,083 for men and $35,170 for women, a difference of 23.7%. Men with an educational attainment of graduate degree enjoy the highest average annual earnings of $91,444, while those with less than high school education earn the least with $30,261. Women with an educational attainment of graduate degree earn the most with the average annual earnings of $65,010, while those with less than high school education have the smallest earnings of $17,795.
| Educational Attainment | Male Income | Female Income |
| Less than High School | $30,261 | $17,795 |
| High School Diploma | $37,294 | $26,287 |
| College or Associate's Degree | $45,423 | $31,821 |
| Bachelor's Degree | $59,335 | $46,985 |
| Graduate Degree | $91,444 | $65,010 |
| Total | $46,083 | $35,170 |
Family Income in New Mexico
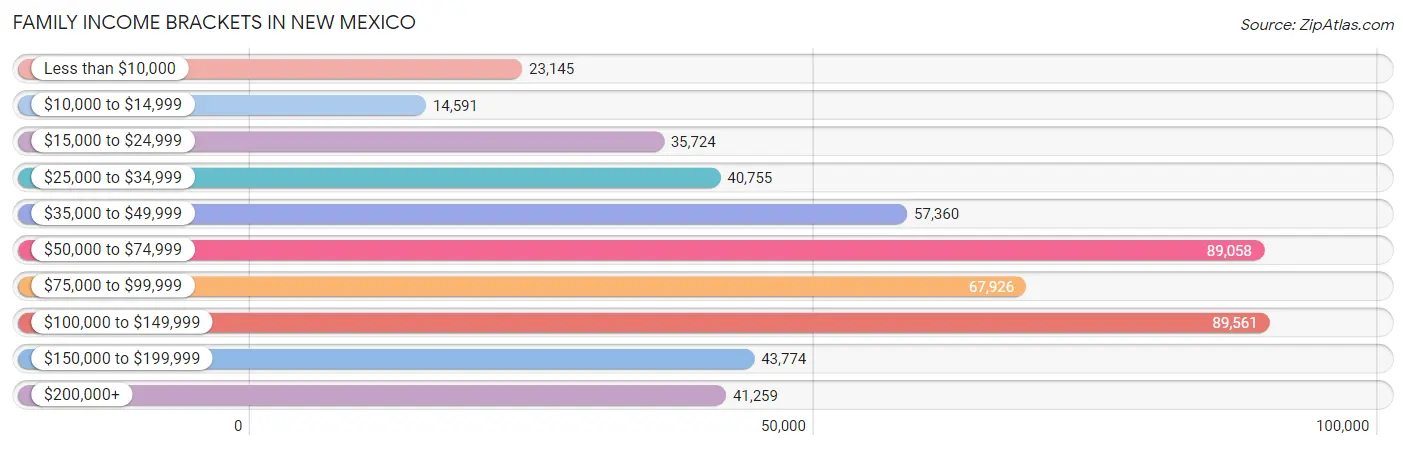
Family Income Brackets in New Mexico
According to the New Mexico family income data, there are 89,561 families falling into the $100,000 to $149,999 income range, which is the most common income bracket and makes up 17.8% of all families. Conversely, the $10,000 to $14,999 income bracket is the least frequent group with only 14,591 families (2.9%) belonging to this category.
| Income Bracket | # Families | % Families |
| Less than $10,000 | 23,145 | 4.6% |
| $10,000 to $14,999 | 14,591 | 2.9% |
| $15,000 to $24,999 | 35,724 | 7.1% |
| $25,000 to $34,999 | 40,755 | 8.1% |
| $35,000 to $49,999 | 57,360 | 11.4% |
| $50,000 to $74,999 | 89,058 | 17.7% |
| $75,000 to $99,999 | 67,926 | 13.5% |
| $100,000 to $149,999 | 89,561 | 17.8% |
| $150,000 to $199,999 | 43,774 | 8.7% |
| $200,000+ | 41,259 | 8.2% |
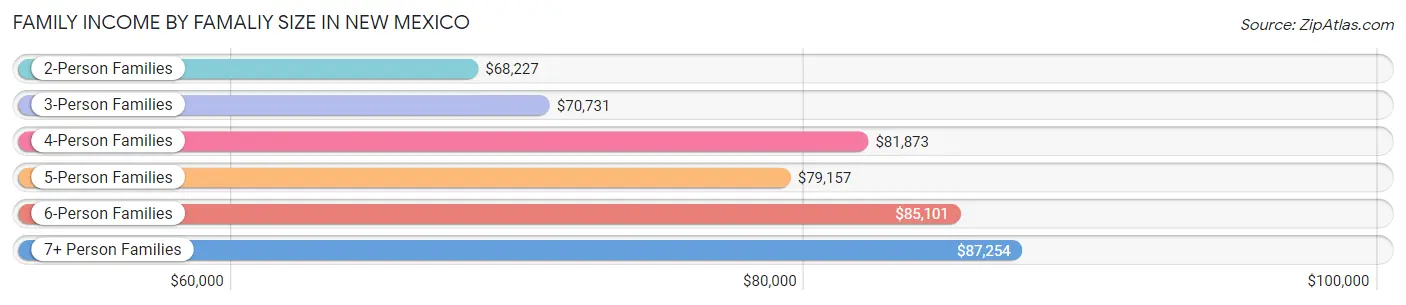
Family Income by Famaliy Size in New Mexico
7+ person families (8,915 | 1.8%) account for the highest median family income in New Mexico with $87,254 per family, while 2-person families (252,874 | 50.3%) have the highest median income of $34,114 per family member.
| Income Bracket | # Families | Median Income |
| 2-Person Families | 252,874 (50.3%) | $68,227 |
| 3-Person Families | 105,890 (21.0%) | $70,731 |
| 4-Person Families | 80,123 (15.9%) | $81,873 |
| 5-Person Families | 40,500 (8.1%) | $79,157 |
| 6-Person Families | 14,852 (2.9%) | $85,101 |
| 7+ Person Families | 8,915 (1.8%) | $87,254 |
| Total | 503,154 (100.0%) | $72,422 |
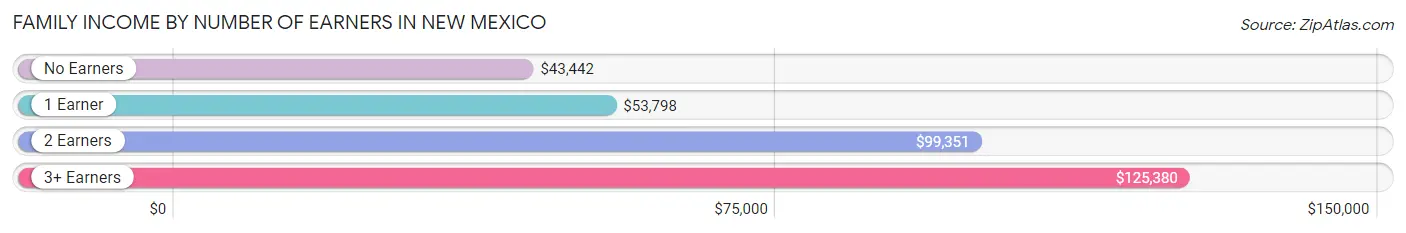
Family Income by Number of Earners in New Mexico
The median family income in New Mexico is $72,422, with families comprising 3+ earners (42,801) having the highest median family income of $125,380, while families with no earners (96,585) have the lowest median family income of $43,442, accounting for 8.5% and 19.2% of families, respectively.
| Number of Earners | # Families | Median Income |
| No Earners | 96,585 (19.2%) | $43,442 |
| 1 Earner | 186,872 (37.1%) | $53,798 |
| 2 Earners | 176,896 (35.2%) | $99,351 |
| 3+ Earners | 42,801 (8.5%) | $125,380 |
| Total | 503,154 (100.0%) | $72,422 |
Household Income in New Mexico
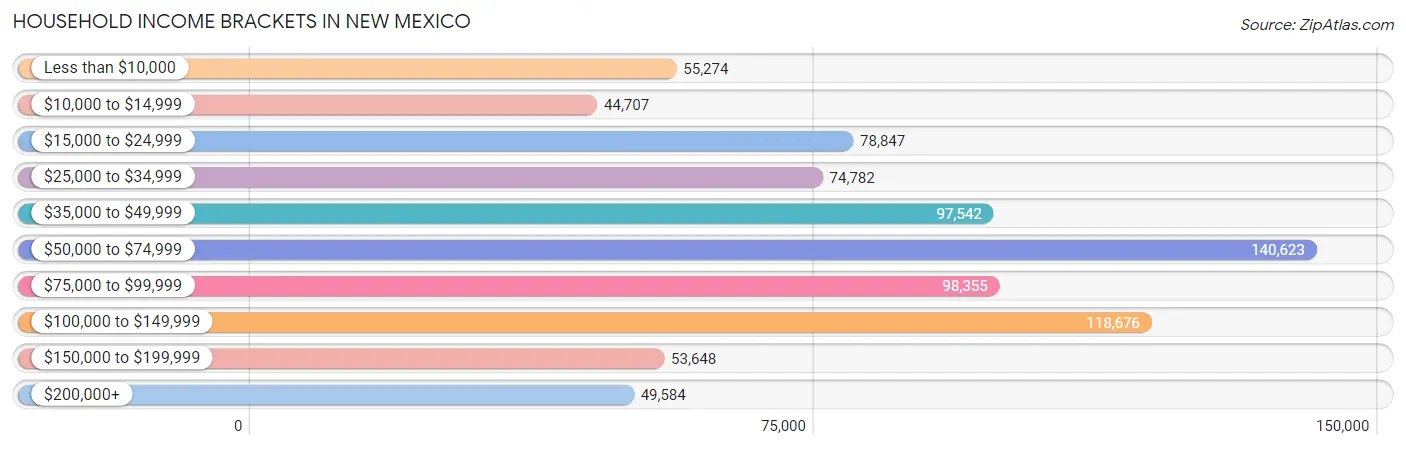
Household Income Brackets in New Mexico
With 140,623 households falling in the category, the $50,000 to $74,999 income range is the most frequent in New Mexico, accounting for 17.3% of all households. In contrast, only 44,707 households (5.5%) fall into the $10,000 to $14,999 income bracket, making it the least populous group.
| Income Bracket | # Households | % Households |
| Less than $10,000 | 55,274 | 6.8% |
| $10,000 to $14,999 | 44,707 | 5.5% |
| $15,000 to $24,999 | 78,847 | 9.7% |
| $25,000 to $34,999 | 74,782 | 9.2% |
| $35,000 to $49,999 | 97,542 | 12.0% |
| $50,000 to $74,999 | 140,623 | 17.3% |
| $75,000 to $99,999 | 98,355 | 12.1% |
| $100,000 to $149,999 | 118,676 | 14.6% |
| $150,000 to $199,999 | 53,648 | 6.6% |
| $200,000+ | 49,584 | 6.1% |
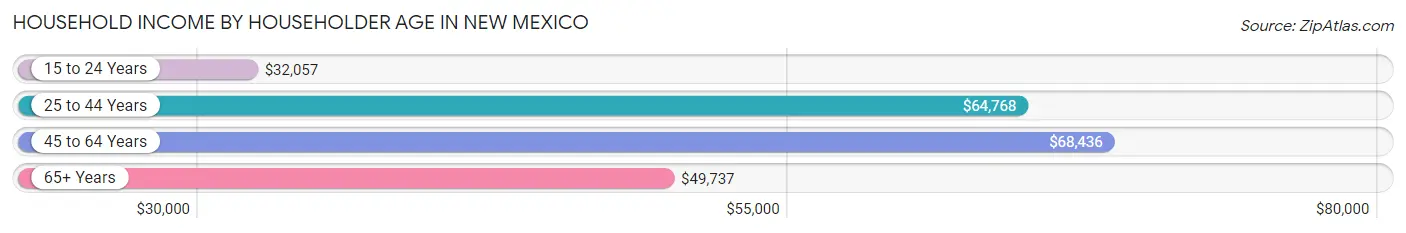
Household Income by Householder Age in New Mexico
The median household income in New Mexico is $58,722, with the highest median household income of $68,436 found in the 45 to 64 years age bracket for the primary householder. A total of 288,188 households (35.4%) fall into this category. Meanwhile, the 15 to 24 years age bracket for the primary householder has the lowest median household income of $32,057, with 34,520 households (4.3%) in this group.
| Income Bracket | # Households | Median Income |
| 15 to 24 Years | 34,520 (4.3%) | $32,057 |
| 25 to 44 Years | 247,382 (30.4%) | $64,768 |
| 45 to 64 Years | 288,188 (35.4%) | $68,436 |
| 65+ Years | 242,762 (29.9%) | $49,737 |
| Total | 812,852 (100.0%) | $58,722 |
Poverty in New Mexico
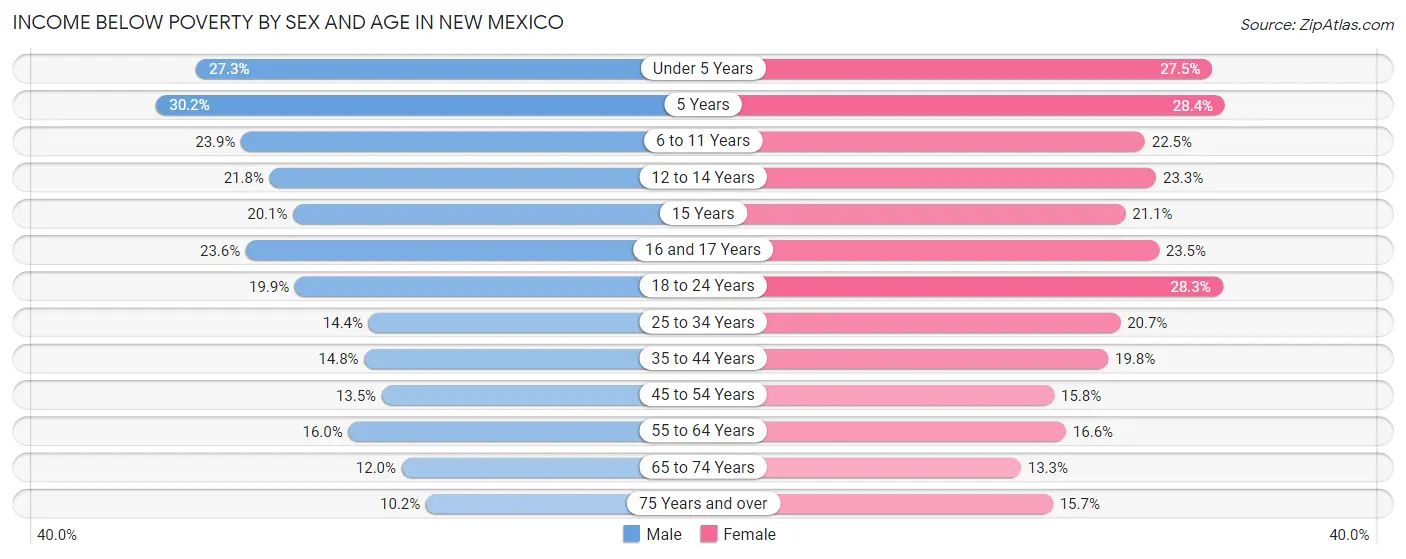
Income Below Poverty by Sex and Age in New Mexico
With 16.9% poverty level for males and 19.7% for females among the residents of New Mexico, 5 year old males and 5 year old females are the most vulnerable to poverty, with 3,751 males (30.2%) and 3,342 females (28.4%) in their respective age groups living below the poverty level.
| Age Bracket | Male | Female |
| Under 5 Years | 15,903 (27.3%) | 15,261 (27.5%) |
| 5 Years | 3,751 (30.2%) | 3,342 (28.4%) |
| 6 to 11 Years | 19,207 (23.9%) | 17,655 (22.5%) |
| 12 to 14 Years | 9,551 (21.8%) | 9,542 (23.3%) |
| 15 Years | 2,805 (20.1%) | 2,808 (21.0%) |
| 16 and 17 Years | 6,719 (23.6%) | 6,566 (23.5%) |
| 18 to 24 Years | 19,662 (19.9%) | 26,415 (28.3%) |
| 25 to 34 Years | 20,041 (14.4%) | 27,804 (20.7%) |
| 35 to 44 Years | 19,405 (14.8%) | 25,405 (19.8%) |
| 45 to 54 Years | 15,597 (13.5%) | 18,698 (15.8%) |
| 55 to 64 Years | 20,595 (16.0%) | 23,167 (16.6%) |
| 65 to 74 Years | 12,971 (12.0%) | 15,922 (13.3%) |
| 75 Years and over | 6,670 (10.2%) | 13,189 (15.7%) |
| Total | 172,877 (16.9%) | 205,774 (19.7%) |
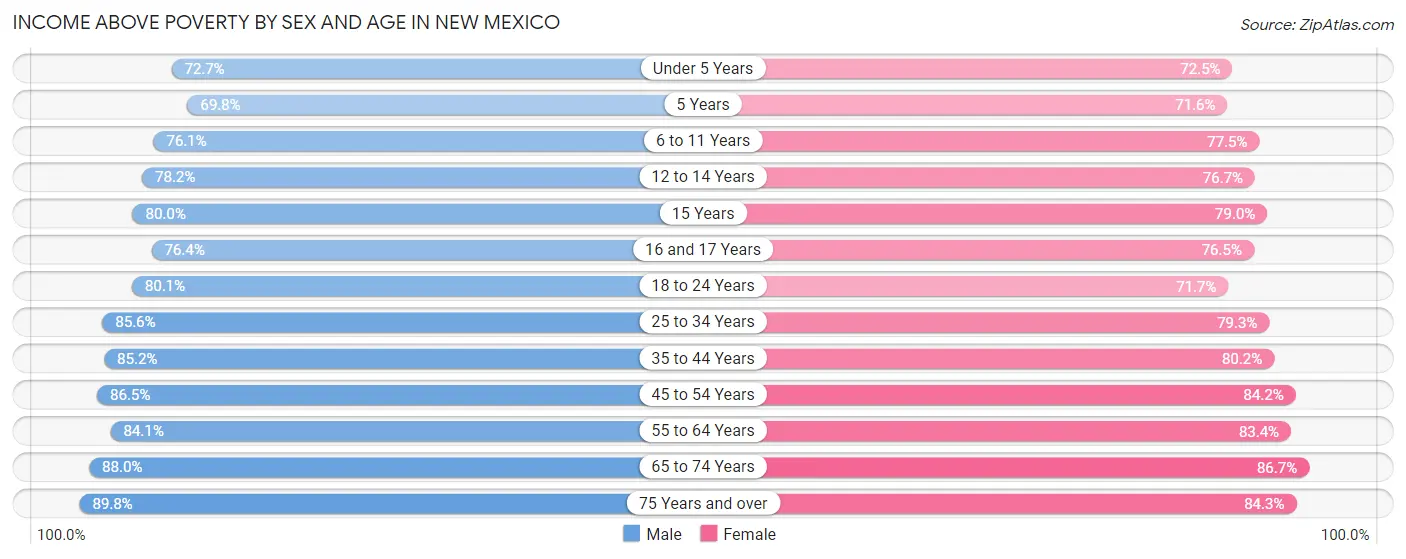
Income Above Poverty by Sex and Age in New Mexico
According to the poverty statistics in New Mexico, males aged 75 years and over and females aged 65 to 74 years are the age groups that are most secure financially, with 89.8% of males and 86.7% of females in these age groups living above the poverty line.
| Age Bracket | Male | Female |
| Under 5 Years | 42,437 (72.7%) | 40,225 (72.5%) |
| 5 Years | 8,661 (69.8%) | 8,411 (71.6%) |
| 6 to 11 Years | 61,121 (76.1%) | 60,821 (77.5%) |
| 12 to 14 Years | 34,252 (78.2%) | 31,356 (76.7%) |
| 15 Years | 11,182 (79.9%) | 10,534 (78.9%) |
| 16 and 17 Years | 21,796 (76.4%) | 21,329 (76.5%) |
| 18 to 24 Years | 79,026 (80.1%) | 67,025 (71.7%) |
| 25 to 34 Years | 118,758 (85.6%) | 106,709 (79.3%) |
| 35 to 44 Years | 111,974 (85.2%) | 103,078 (80.2%) |
| 45 to 54 Years | 100,158 (86.5%) | 99,968 (84.2%) |
| 55 to 64 Years | 108,566 (84.1%) | 116,054 (83.4%) |
| 65 to 74 Years | 95,234 (88.0%) | 103,846 (86.7%) |
| 75 Years and over | 58,777 (89.8%) | 71,017 (84.3%) |
| Total | 851,942 (83.1%) | 840,373 (80.3%) |
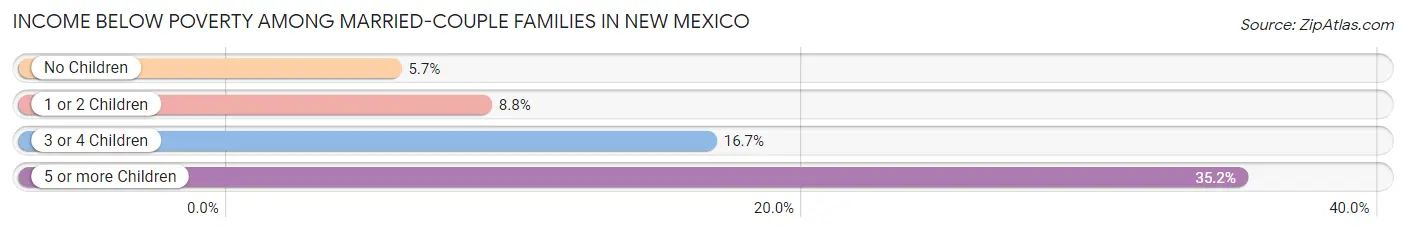
Income Below Poverty Among Married-Couple Families in New Mexico
The poverty statistics for married-couple families in New Mexico show that 7.7% or 26,400 of the total 341,009 families live below the poverty line. Families with 5 or more children have the highest poverty rate of 35.1%, comprising of 973 families. On the other hand, families with no children have the lowest poverty rate of 5.7%, which includes 12,082 families.
| Children | Above Poverty | Below Poverty |
| No Children | 200,219 (94.3%) | 12,082 (5.7%) |
| 1 or 2 Children | 89,083 (91.2%) | 8,641 (8.8%) |
| 3 or 4 Children | 23,512 (83.3%) | 4,704 (16.7%) |
| 5 or more Children | 1,795 (64.8%) | 973 (35.1%) |
| Total | 314,609 (92.3%) | 26,400 (7.7%) |
Income Below Poverty Among Single-Parent Households in New Mexico
According to the poverty data in New Mexico, 19.3% or 9,707 single-father households and 29.3% or 32,743 single-mother households are living below the poverty line. Among single-father households, those with 5 or more children have the highest poverty rate, with 296 households (60.9%) experiencing poverty. Likewise, among single-mother households, those with 5 or more children have the highest poverty rate, with 1,144 households (69.6%) falling below the poverty line.
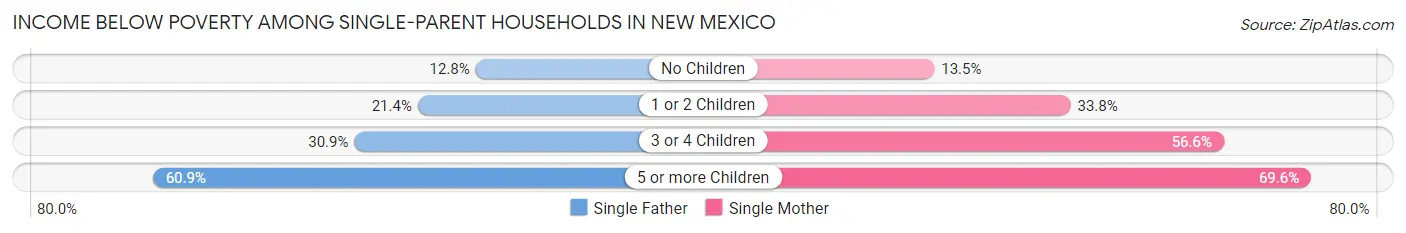
| Children | Single Father | Single Mother |
| No Children | 2,579 (12.8%) | 5,537 (13.5%) |
| 1 or 2 Children | 5,313 (21.4%) | 19,387 (33.8%) |
| 3 or 4 Children | 1,519 (30.9%) | 6,675 (56.6%) |
| 5 or more Children | 296 (60.9%) | 1,144 (69.6%) |
| Total | 9,707 (19.3%) | 32,743 (29.3%) |
Income Below Poverty Among Married-Couple vs Single-Parent Households in New Mexico
The poverty data for New Mexico shows that 26,400 of the married-couple family households (7.7%) and 42,450 of the single-parent households (26.2%) are living below the poverty level. Within the married-couple family households, those with 5 or more children have the highest poverty rate, with 973 households (35.1%) falling below the poverty line. Among the single-parent households, those with 5 or more children have the highest poverty rate, with 1,440 household (67.6%) living below poverty.
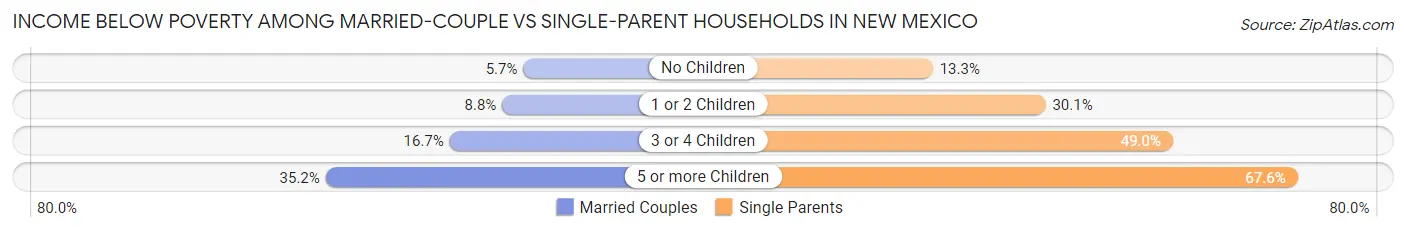
| Children | Married-Couple Families | Single-Parent Households |
| No Children | 12,082 (5.7%) | 8,116 (13.3%) |
| 1 or 2 Children | 8,641 (8.8%) | 24,700 (30.1%) |
| 3 or 4 Children | 4,704 (16.7%) | 8,194 (49.0%) |
| 5 or more Children | 973 (35.1%) | 1,440 (67.6%) |
| Total | 26,400 (7.7%) | 42,450 (26.2%) |
Largest Zip Codes by Population in New Mexico
The largest zip codes in New Mexico by population are 87121 (76,980), 87114 (67,805), 87120 (65,918), 87124 (57,239), and 87111 (56,830).
1.87121
76,980 (3.64%)
2.87114
67,805 (3.21%)
3.87120
65,918 (3.12%)
4.87124
57,239 (2.71%)
5.87111
56,830 (2.69%)
6.87105
55,295 (2.62%)
7.87507
51,580 (2.44%)
8.87144
48,815 (2.31%)
9.87031
46,590 (2.21%)
10.87401
46,398 (2.20%)
11.88101
45,619 (2.16%)
12.87123
43,351 (2.05%)
13.87112
42,632 (2.02%)
14.88240
41,652 (1.97%)
15.87110
40,404 (1.91%)
16.87109
40,313 (1.91%)
17.88220
39,809 (1.88%)
18.88001
39,358 (1.86%)
19.88310
36,990 (1.75%)
20.87108
36,147 (1.71%)
21.87505
31,857 (1.51%)
22.88012
31,800 (1.51%)
23.88011
30,831 (1.46%)
24.88203
29,499 (1.40%)
25.87107
27,873 (1.32%)
26.88005
27,279 (1.29%)
27.88201
26,521 (1.26%)
28.87106
25,825 (1.22%)
29.88007
24,983 (1.18%)
30.88030
24,066 (1.14%)
Largest Cities by Population in New Mexico
The largest cities in New Mexico by population are Albuquerque (562,551), Las Cruces (111,273), Rio Rancho (104,351), Santa Fe (87,617), and Roswell (48,035).
562,551 (26.63%)
111,273 (5.27%)
104,351 (4.94%)
4.Santa Fe
87,617 (4.15%)
5.Roswell
48,035 (2.27%)
46,457 (2.20%)
7.Hobbs
39,782 (1.88%)
8.Clovis
38,453 (1.82%)
37,601 (1.78%)
10.Carlsbad
31,755 (1.50%)
11.Alamogordo
30,996 (1.47%)
12.Gallup
21,672 (1.03%)
13.Los Lunas
17,452 (0.83%)
14.Sunland Park
16,773 (0.79%)
15.Chaparral
15,290 (0.72%)
16.Deming
14,756 (0.70%)
17.Los Alamos
13,460 (0.64%)
18.Las Vegas
13,194 (0.62%)
19.Artesia
12,632 (0.60%)
20.Portales
12,085 (0.57%)
21.Lovington
11,495 (0.54%)
22.North Valley
11,256 (0.53%)
23.Espanola
10,473 (0.50%)
24.Silver City
9,650 (0.46%)
25.Bernalillo
9,286 (0.44%)
26.Grants
9,177 (0.43%)
27.Anthony
8,708 (0.41%)
28.Socorro
8,605 (0.41%)
29.Corrales
8,495 (0.40%)
30.Shiprock
8,275 (0.39%)
Largest Counties by Population in New Mexico
The largest counties in New Mexico by population are Bernalillo County (674,692), Dona Ana County (219,870), Santa Fe County (154,481), Sandoval County (149,460), and San Juan County (121,798).
674,692 (31.94%)
219,870 (10.41%)
154,481 (7.31%)
149,460 (7.08%)
121,798 (5.77%)
76,613 (3.63%)
73,103 (3.46%)
72,073 (3.41%)
67,850 (3.21%)
64,701 (3.06%)
11.Eddy County
61,264 (2.90%)
12.Curry County
48,327 (2.29%)
40,285 (1.91%)
14.Taos County
34,475 (1.63%)
15.Grant County
28,006 (1.33%)
27,215 (1.29%)
27,211 (1.29%)
18.Luna County
25,393 (1.20%)
20,222 (0.96%)
19,253 (0.91%)
19,142 (0.91%)
16,453 (0.78%)
15,203 (0.72%)
12,370 (0.59%)
11,506 (0.54%)
26.Quay County
8,641 (0.41%)
4,413 (0.21%)
28.Mora County
4,208 (0.20%)
4,160 (0.20%)
30.Union County
4,074 (0.19%)
Race in New Mexico
The most populous races in New Mexico are White / Caucasian (1,250,614 | 59.2%), Hispanic or Latino (1,051,626 | 49.8%), and Two or more Races (348,588 | 16.5%).
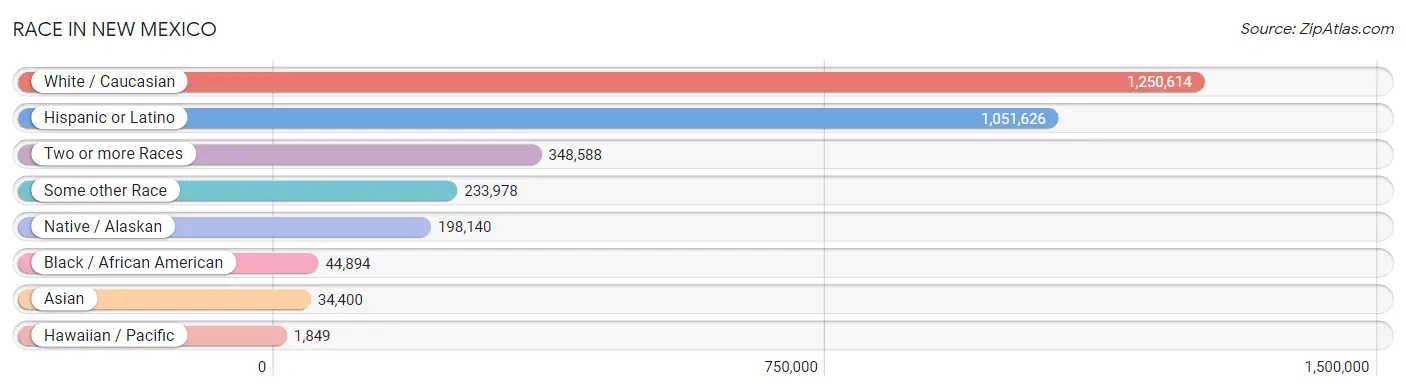
| Race | # Population | % Population |
| Asian | 34,400 | 1.6% |
| Black / African American | 44,894 | 2.1% |
| Hawaiian / Pacific | 1,849 | 0.1% |
| Hispanic or Latino | 1,051,626 | 49.8% |
| Native / Alaskan | 198,140 | 9.4% |
| White / Caucasian | 1,250,614 | 59.2% |
| Two or more Races | 348,588 | 16.5% |
| Some other Race | 233,978 | 11.1% |
| Total | 2,112,463 | 100.0% |
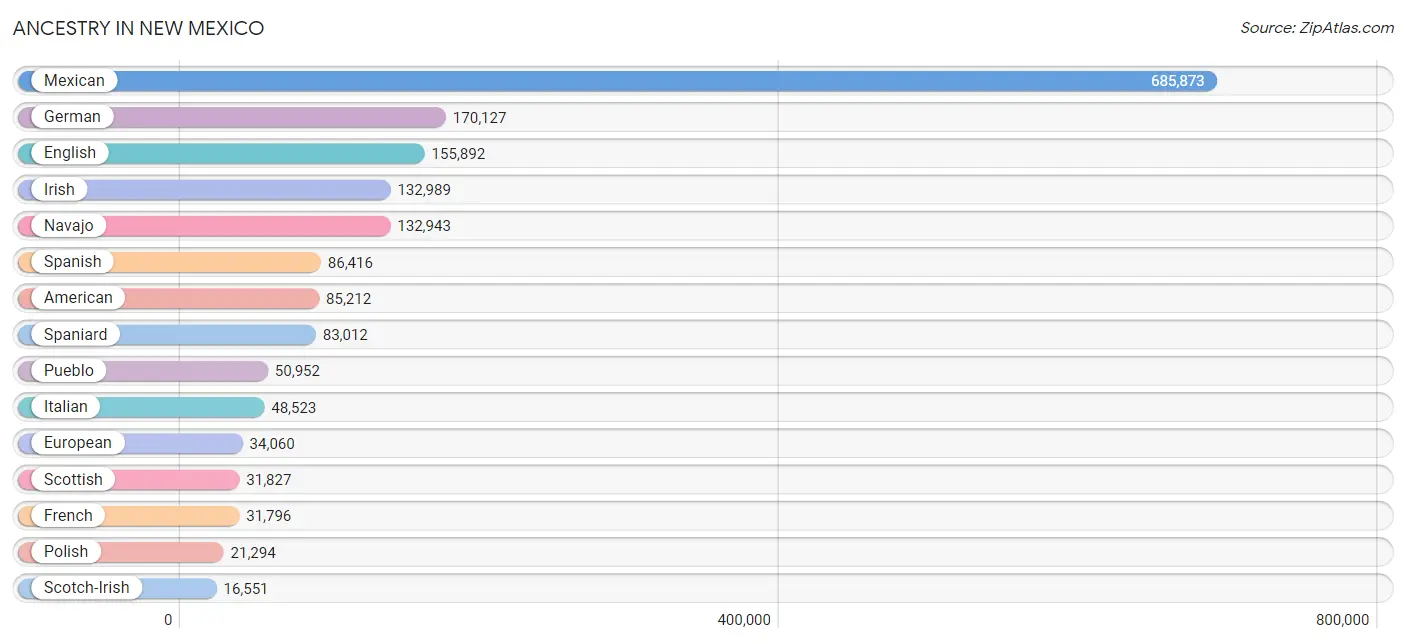
Ancestry in New Mexico
The most populous ancestries reported in New Mexico are Mexican (685,873 | 32.5%), German (170,127 | 8.1%), English (155,892 | 7.4%), Irish (132,989 | 6.3%), and Navajo (132,943 | 6.3%), together accounting for 60.5% of all New Mexico residents.
| Ancestry | # Population | % Population |
| Afghan | 399 | 0.0% |
| African | 4,005 | 0.2% |
| Alaska Native | 58 | 0.0% |
| Alaskan Athabascan | 267 | 0.0% |
| Albanian | 87 | 0.0% |
| Aleut | 103 | 0.0% |
| Alsatian | 33 | 0.0% |
| American | 85,212 | 4.0% |
| Apache | 11,251 | 0.5% |
| Arab | 6,582 | 0.3% |
| Arapaho | 32 | 0.0% |
| Argentinean | 609 | 0.0% |
| Armenian | 631 | 0.0% |
| Australian | 354 | 0.0% |
| Austrian | 2,476 | 0.1% |
| Bahamian | 16 | 0.0% |
| Bangladeshi | 100 | 0.0% |
| Barbadian | 26 | 0.0% |
| Basque | 772 | 0.0% |
| Belgian | 1,498 | 0.1% |
| Belizean | 67 | 0.0% |
| Bhutanese | 5,821 | 0.3% |
| Blackfeet | 896 | 0.0% |
| Bolivian | 463 | 0.0% |
| Brazilian | 492 | 0.0% |
| British | 12,041 | 0.6% |
| British West Indian | 96 | 0.0% |
| Bulgarian | 183 | 0.0% |
| Burmese | 4,578 | 0.2% |
| Cajun | 413 | 0.0% |
| Cambodian | 103 | 0.0% |
| Canadian | 2,356 | 0.1% |
| Celtic | 762 | 0.0% |
| Central American | 10,423 | 0.5% |
| Central American Indian | 2,097 | 0.1% |
| Cherokee | 6,412 | 0.3% |
| Cheyenne | 497 | 0.0% |
| Chickasaw | 570 | 0.0% |
| Chilean | 863 | 0.0% |
| Chinese | 6 | 0.0% |
| Chippewa | 875 | 0.0% |
| Choctaw | 1,869 | 0.1% |
| Colombian | 2,969 | 0.1% |
| Colville | 13 | 0.0% |
| Comanche | 821 | 0.0% |
| Costa Rican | 458 | 0.0% |
| Cree | 125 | 0.0% |
| Creek | 501 | 0.0% |
| Croatian | 1,035 | 0.1% |
| Crow | 55 | 0.0% |
| Cuban | 5,725 | 0.3% |
| Cypriot | 24 | 0.0% |
| Czech | 4,105 | 0.2% |
| Czechoslovakian | 896 | 0.0% |
| Danish | 6,595 | 0.3% |
| Delaware | 44 | 0.0% |
| Dominican | 2,524 | 0.1% |
| Dutch | 15,078 | 0.7% |
| Dutch West Indian | 355 | 0.0% |
| Eastern European | 4,107 | 0.2% |
| Ecuadorian | 1,093 | 0.1% |
| Egyptian | 234 | 0.0% |
| English | 155,892 | 7.4% |
| Estonian | 201 | 0.0% |
| Ethiopian | 328 | 0.0% |
| European | 34,060 | 1.6% |
| Filipino | 443 | 0.0% |
| Finnish | 2,390 | 0.1% |
| French | 31,796 | 1.5% |
| French American Indian | 35 | 0.0% |
| French Canadian | 5,109 | 0.2% |
| German | 170,127 | 8.1% |
| German Russian | 49 | 0.0% |
| Ghanaian | 107 | 0.0% |
| Greek | 4,525 | 0.2% |
| Guamanian / Chamorro | 760 | 0.0% |
| Guatemalan | 3,150 | 0.2% |
| Guyanese | 122 | 0.0% |
| Haitian | 358 | 0.0% |
| Honduran | 1,383 | 0.1% |
| Hopi | 1,428 | 0.1% |
| Houma | 4 | 0.0% |
| Hungarian | 3,695 | 0.2% |
| Icelander | 63 | 0.0% |
| Indian (Asian) | 8,249 | 0.4% |
| Indonesian | 31 | 0.0% |
| Inupiat | 131 | 0.0% |
| Iranian | 1,366 | 0.1% |
| Iraqi | 468 | 0.0% |
| Irish | 132,989 | 6.3% |
| Iroquois | 412 | 0.0% |
| Israeli | 150 | 0.0% |
| Italian | 48,523 | 2.3% |
| Jamaican | 964 | 0.1% |
| Japanese | 188 | 0.0% |
| Jordanian | 153 | 0.0% |
| Kenyan | 206 | 0.0% |
| Kiowa | 377 | 0.0% |
| Korean | 15,376 | 0.7% |
| Laotian | 353 | 0.0% |
| Latvian | 485 | 0.0% |
| Lebanese | 2,412 | 0.1% |
| Liberian | 185 | 0.0% |
| Lithuanian | 1,684 | 0.1% |
| Lumbee | 30 | 0.0% |
| Luxembourger | 84 | 0.0% |
| Macedonian | 16 | 0.0% |
| Malaysian | 404 | 0.0% |
| Maltese | 38 | 0.0% |
| Menominee | 40 | 0.0% |
| Mexican | 685,873 | 32.5% |
| Mexican American Indian | 4,972 | 0.2% |
| Mongolian | 34 | 0.0% |
| Moroccan | 149 | 0.0% |
| Native Hawaiian | 2,362 | 0.1% |
| Navajo | 132,943 | 6.3% |
| New Zealander | 126 | 0.0% |
| Nicaraguan | 1,049 | 0.1% |
| Nigerian | 1,553 | 0.1% |
| Northern European | 5,066 | 0.2% |
| Norwegian | 15,084 | 0.7% |
| Osage | 188 | 0.0% |
| Paiute | 102 | 0.0% |
| Pakistani | 1,411 | 0.1% |
| Palestinian | 674 | 0.0% |
| Panamanian | 742 | 0.0% |
| Paraguayan | 48 | 0.0% |
| Pennsylvania German | 363 | 0.0% |
| Peruvian | 1,640 | 0.1% |
| Pima | 901 | 0.0% |
| Polish | 21,294 | 1.0% |
| Portuguese | 4,703 | 0.2% |
| Potawatomi | 368 | 0.0% |
| Pueblo | 50,952 | 2.4% |
| Puerto Rican | 10,796 | 0.5% |
| Puget Sound Salish | 1 | 0.0% |
| Romanian | 996 | 0.1% |
| Russian | 7,913 | 0.4% |
| Salvadoran | 3,482 | 0.2% |
| Samoan | 740 | 0.0% |
| Scandinavian | 6,628 | 0.3% |
| Scotch-Irish | 16,551 | 0.8% |
| Scottish | 31,827 | 1.5% |
| Seminole | 257 | 0.0% |
| Serbian | 731 | 0.0% |
| Shoshone | 153 | 0.0% |
| Sierra Leonean | 45 | 0.0% |
| Sioux | 1,691 | 0.1% |
| Slavic | 637 | 0.0% |
| Slovak | 1,352 | 0.1% |
| Slovene | 462 | 0.0% |
| Somali | 2 | 0.0% |
| South African | 172 | 0.0% |
| South American | 8,702 | 0.4% |
| South American Indian | 300 | 0.0% |
| Soviet Union | 8 | 0.0% |
| Spaniard | 83,012 | 3.9% |
| Spanish | 86,416 | 4.1% |
| Spanish American | 7,066 | 0.3% |
| Spanish American Indian | 544 | 0.0% |
| Sri Lankan | 6,235 | 0.3% |
| Subsaharan African | 8,049 | 0.4% |
| Sudanese | 29 | 0.0% |
| Swedish | 15,722 | 0.7% |
| Swiss | 3,674 | 0.2% |
| Syrian | 546 | 0.0% |
| Thai | 5,983 | 0.3% |
| Tlingit-Haida | 133 | 0.0% |
| Tohono O'Odham | 259 | 0.0% |
| Tongan | 37 | 0.0% |
| Trinidadian and Tobagonian | 57 | 0.0% |
| Tsimshian | 78 | 0.0% |
| Turkish | 583 | 0.0% |
| U.S. Virgin Islander | 31 | 0.0% |
| Ugandan | 31 | 0.0% |
| Ukrainian | 2,764 | 0.1% |
| Uruguayan | 92 | 0.0% |
| Ute | 627 | 0.0% |
| Venezuelan | 848 | 0.0% |
| Vietnamese | 902 | 0.0% |
| Welsh | 10,293 | 0.5% |
| West Indian | 300 | 0.0% |
| Yakama | 9 | 0.0% |
| Yaqui | 476 | 0.0% |
| Yugoslavian | 430 | 0.0% |
| Yuman | 54 | 0.0% |
| Yup'ik | 9 | 0.0% |
| Zimbabwean | 143 | 0.0% | View All 188 Rows |
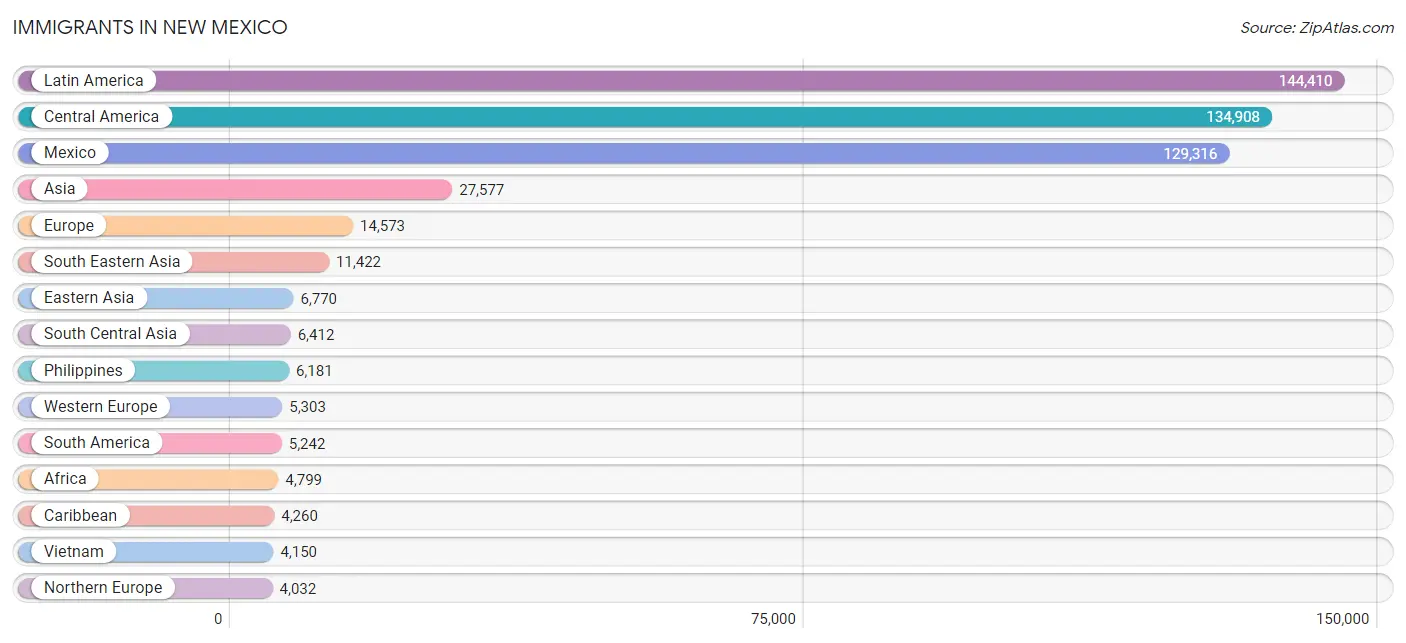
Immigrants in New Mexico
The most numerous immigrant groups reported in New Mexico came from Latin America (144,410 | 6.8%), Central America (134,908 | 6.4%), Mexico (129,316 | 6.1%), Asia (27,577 | 1.3%), and Europe (14,573 | 0.7%), together accounting for 21.3% of all New Mexico residents.
| Immigration Origin | # Population | % Population |
| Afghanistan | 387 | 0.0% |
| Africa | 4,799 | 0.2% |
| Albania | 44 | 0.0% |
| Argentina | 486 | 0.0% |
| Armenia | 26 | 0.0% |
| Asia | 27,577 | 1.3% |
| Australia | 360 | 0.0% |
| Austria | 160 | 0.0% |
| Azores | 10 | 0.0% |
| Bahamas | 11 | 0.0% |
| Bangladesh | 477 | 0.0% |
| Belarus | 20 | 0.0% |
| Belgium | 150 | 0.0% |
| Belize | 15 | 0.0% |
| Bolivia | 276 | 0.0% |
| Bosnia and Herzegovina | 23 | 0.0% |
| Brazil | 441 | 0.0% |
| Bulgaria | 92 | 0.0% |
| Cambodia | 39 | 0.0% |
| Cameroon | 187 | 0.0% |
| Canada | 2,195 | 0.1% |
| Caribbean | 4,260 | 0.2% |
| Central America | 134,908 | 6.4% |
| Chile | 445 | 0.0% |
| China | 3,800 | 0.2% |
| Colombia | 1,258 | 0.1% |
| Congo | 77 | 0.0% |
| Costa Rica | 179 | 0.0% |
| Croatia | 6 | 0.0% |
| Cuba | 2,989 | 0.1% |
| Czechoslovakia | 307 | 0.0% |
| Denmark | 68 | 0.0% |
| Dominica | 40 | 0.0% |
| Dominican Republic | 378 | 0.0% |
| Eastern Africa | 1,378 | 0.1% |
| Eastern Asia | 6,770 | 0.3% |
| Eastern Europe | 3,360 | 0.2% |
| Ecuador | 659 | 0.0% |
| Egypt | 65 | 0.0% |
| El Salvador | 1,561 | 0.1% |
| England | 1,770 | 0.1% |
| Eritrea | 20 | 0.0% |
| Ethiopia | 205 | 0.0% |
| Europe | 14,573 | 0.7% |
| Fiji | 31 | 0.0% |
| France | 704 | 0.0% |
| Germany | 3,753 | 0.2% |
| Ghana | 189 | 0.0% |
| Greece | 542 | 0.0% |
| Guatemala | 2,049 | 0.1% |
| Guyana | 114 | 0.0% |
| Haiti | 113 | 0.0% |
| Honduras | 1,154 | 0.1% |
| Hong Kong | 130 | 0.0% |
| Hungary | 123 | 0.0% |
| India | 3,002 | 0.1% |
| Indonesia | 225 | 0.0% |
| Iran | 970 | 0.1% |
| Iraq | 567 | 0.0% |
| Ireland | 222 | 0.0% |
| Israel | 236 | 0.0% |
| Italy | 581 | 0.0% |
| Jamaica | 443 | 0.0% |
| Japan | 1,338 | 0.1% |
| Jordan | 346 | 0.0% |
| Kazakhstan | 48 | 0.0% |
| Kenya | 363 | 0.0% |
| Korea | 1,632 | 0.1% |
| Kuwait | 463 | 0.0% |
| Laos | 201 | 0.0% |
| Latin America | 144,410 | 6.8% |
| Latvia | 186 | 0.0% |
| Lebanon | 275 | 0.0% |
| Liberia | 140 | 0.0% |
| Lithuania | 8 | 0.0% |
| Malaysia | 87 | 0.0% |
| Mexico | 129,316 | 6.1% |
| Micronesia | 151 | 0.0% |
| Middle Africa | 743 | 0.0% |
| Moldova | 22 | 0.0% |
| Morocco | 130 | 0.0% |
| Nepal | 531 | 0.0% |
| Netherlands | 392 | 0.0% |
| Nicaragua | 353 | 0.0% |
| Nigeria | 1,297 | 0.1% |
| Northern Africa | 263 | 0.0% |
| Northern Europe | 4,032 | 0.2% |
| Norway | 131 | 0.0% |
| Oceania | 766 | 0.0% |
| Pakistan | 659 | 0.0% |
| Panama | 192 | 0.0% |
| Peru | 934 | 0.0% |
| Philippines | 6,181 | 0.3% |
| Poland | 512 | 0.0% |
| Portugal | 71 | 0.0% |
| Romania | 383 | 0.0% |
| Russia | 750 | 0.0% |
| Saudi Arabia | 276 | 0.0% |
| Scotland | 186 | 0.0% |
| Serbia | 304 | 0.0% |
| Sierra Leone | 23 | 0.0% |
| Singapore | 37 | 0.0% |
| South Africa | 354 | 0.0% |
| South America | 5,242 | 0.3% |
| South Central Asia | 6,412 | 0.3% |
| South Eastern Asia | 11,422 | 0.5% |
| Southern Europe | 1,868 | 0.1% |
| Spain | 673 | 0.0% |
| Sri Lanka | 159 | 0.0% |
| St. Vincent and the Grenadines | 9 | 0.0% |
| Sudan | 29 | 0.0% |
| Sweden | 147 | 0.0% |
| Switzerland | 120 | 0.0% |
| Syria | 201 | 0.0% |
| Taiwan | 530 | 0.0% |
| Thailand | 474 | 0.0% |
| Trinidad and Tobago | 78 | 0.0% |
| Turkey | 364 | 0.0% |
| Uganda | 64 | 0.0% |
| Ukraine | 383 | 0.0% |
| Uruguay | 28 | 0.0% |
| Uzbekistan | 128 | 0.0% |
| Venezuela | 561 | 0.0% |
| Vietnam | 4,150 | 0.2% |
| West Indies | 100 | 0.0% |
| Western Africa | 1,809 | 0.1% |
| Western Asia | 2,848 | 0.1% |
| Western Europe | 5,303 | 0.3% |
| Zaire | 459 | 0.0% |
| Zimbabwe | 170 | 0.0% | View All 130 Rows |
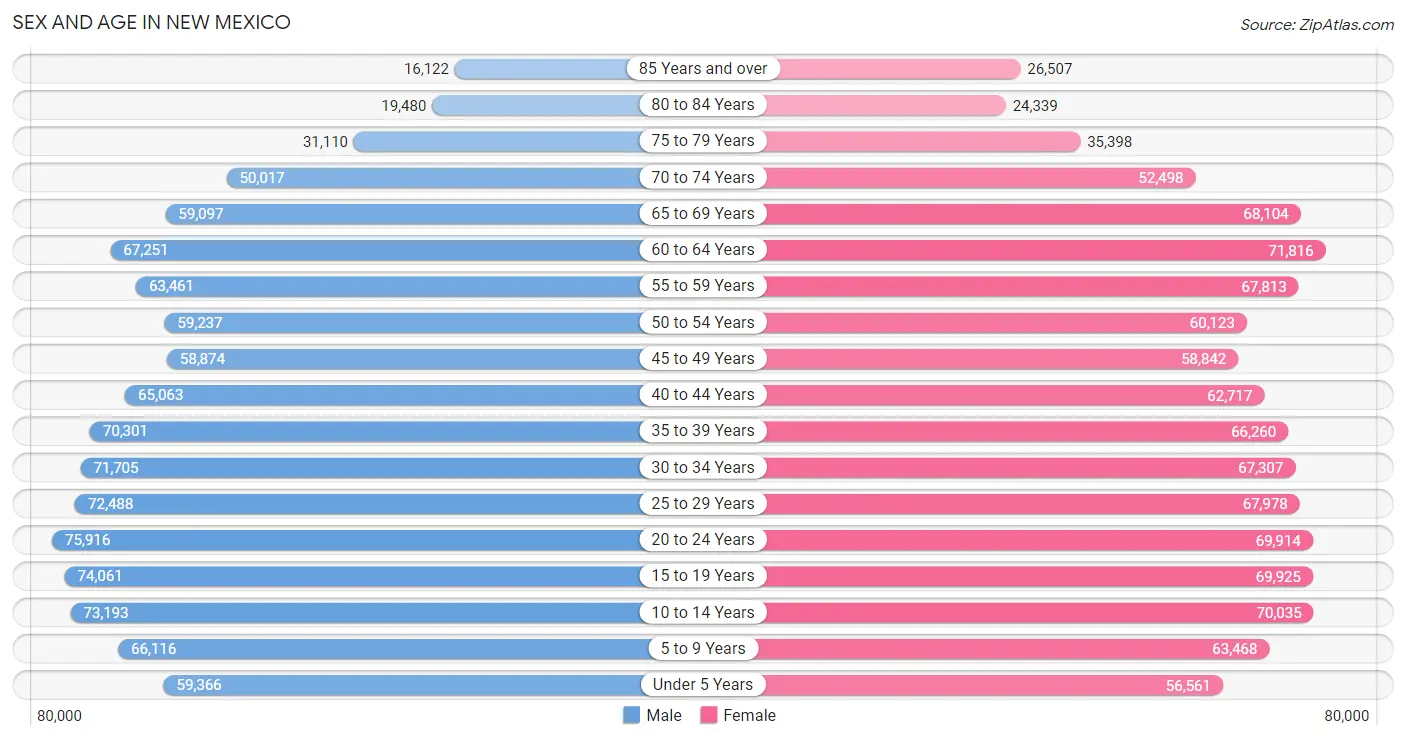
Sex and Age in New Mexico
Sex and Age in New Mexico
The most populous age groups in New Mexico are 20 to 24 Years (75,916 | 7.2%) for men and 60 to 64 Years (71,816 | 6.8%) for women.
| Age Bracket | Male | Female |
| Under 5 Years | 59,366 (5.6%) | 56,561 (5.3%) |
| 5 to 9 Years | 66,116 (6.3%) | 63,468 (6.0%) |
| 10 to 14 Years | 73,193 (7.0%) | 70,035 (6.6%) |
| 15 to 19 Years | 74,061 (7.0%) | 69,925 (6.6%) |
| 20 to 24 Years | 75,916 (7.2%) | 69,914 (6.6%) |
| 25 to 29 Years | 72,488 (6.9%) | 67,978 (6.4%) |
| 30 to 34 Years | 71,705 (6.8%) | 67,307 (6.4%) |
| 35 to 39 Years | 70,301 (6.7%) | 66,260 (6.2%) |
| 40 to 44 Years | 65,063 (6.2%) | 62,717 (5.9%) |
| 45 to 49 Years | 58,874 (5.6%) | 58,842 (5.6%) |
| 50 to 54 Years | 59,237 (5.6%) | 60,123 (5.7%) |
| 55 to 59 Years | 63,461 (6.0%) | 67,813 (6.4%) |
| 60 to 64 Years | 67,251 (6.4%) | 71,816 (6.8%) |
| 65 to 69 Years | 59,097 (5.6%) | 68,104 (6.4%) |
| 70 to 74 Years | 50,017 (4.8%) | 52,498 (5.0%) |
| 75 to 79 Years | 31,110 (2.9%) | 35,398 (3.3%) |
| 80 to 84 Years | 19,480 (1.8%) | 24,339 (2.3%) |
| 85 Years and over | 16,122 (1.5%) | 26,507 (2.5%) |
| Total | 1,052,858 (100.0%) | 1,059,605 (100.0%) |
Families and Households in New Mexico
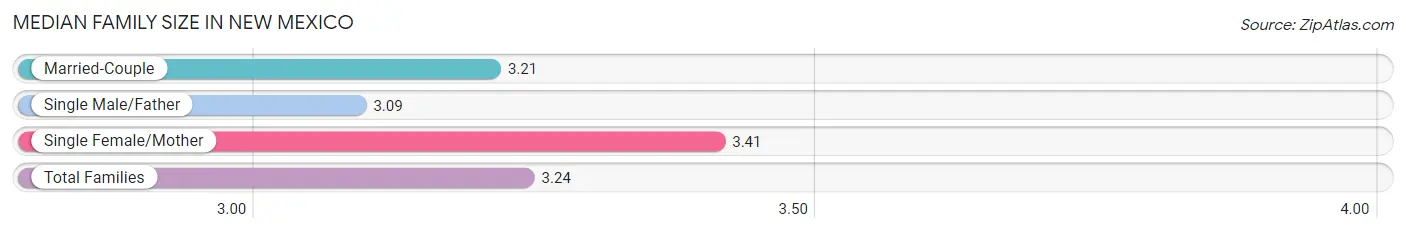
Median Family Size in New Mexico
The median family size in New Mexico is 3.24 persons per family, with single female/mother families (111,782 | 22.2%) accounting for the largest median family size of 3.41 persons per family. On the other hand, single male/father families (50,363 | 10.0%) represent the smallest median family size with 3.09 persons per family.
| Family Type | # Families | Family Size |
| Married-Couple | 341,009 (67.8%) | 3.21 |
| Single Male/Father | 50,363 (10.0%) | 3.09 |
| Single Female/Mother | 111,782 (22.2%) | 3.41 |
| Total Families | 503,154 (100.0%) | 3.24 |
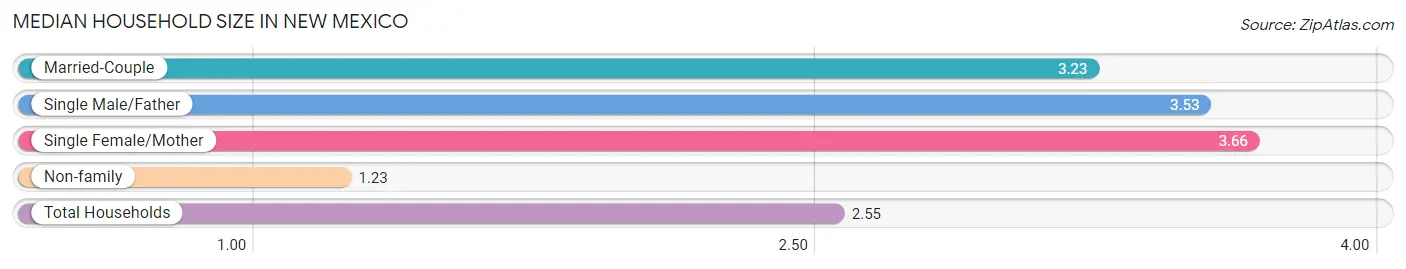
Median Household Size in New Mexico
The median household size in New Mexico is 2.55 persons per household, with single female/mother households (111,782 | 13.8%) accounting for the largest median household size of 3.66 persons per household. non-family households (309,698 | 38.1%) represent the smallest median household size with 1.23 persons per household.
| Household Type | # Households | Household Size |
| Married-Couple | 341,009 (41.9%) | 3.23 |
| Single Male/Father | 50,363 (6.2%) | 3.53 |
| Single Female/Mother | 111,782 (13.8%) | 3.66 |
| Non-family | 309,698 (38.1%) | 1.23 |
| Total Households | 812,852 (100.0%) | 2.55 |
Household Size by Marriage Status in New Mexico
Out of a total of 812,852 households in New Mexico, 503,154 (61.9%) are family households, while 309,698 (38.1%) are nonfamily households. The most numerous type of family households are 2-person households, comprising 232,851, and the most common type of nonfamily households are 1-person households, comprising 256,762.
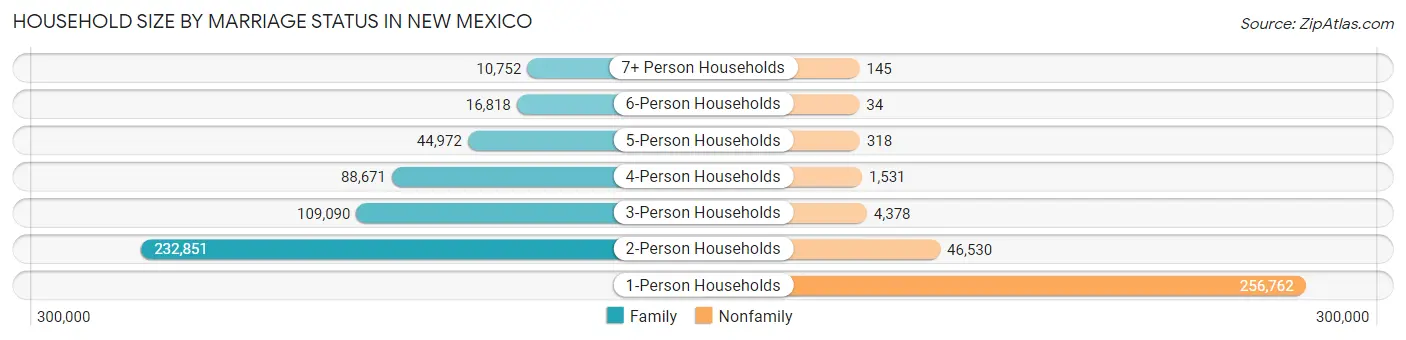
| Household Size | Family Households | Nonfamily Households |
| 1-Person Households | - | 256,762 (31.6%) |
| 2-Person Households | 232,851 (28.6%) | 46,530 (5.7%) |
| 3-Person Households | 109,090 (13.4%) | 4,378 (0.5%) |
| 4-Person Households | 88,671 (10.9%) | 1,531 (0.2%) |
| 5-Person Households | 44,972 (5.5%) | 318 (0.0%) |
| 6-Person Households | 16,818 (2.1%) | 34 (0.0%) |
| 7+ Person Households | 10,752 (1.3%) | 145 (0.0%) |
| Total | 503,154 (61.9%) | 309,698 (38.1%) |
Female Fertility in New Mexico
Fertility by Age in New Mexico
Average fertility rate in New Mexico is 55.0 births per 1,000 women. Women in the age bracket of 20 to 34 years have the highest fertility rate with 90.0 births per 1,000 women. Women in the age bracket of 20 to 34 years acount for 71.1% of all women with births.
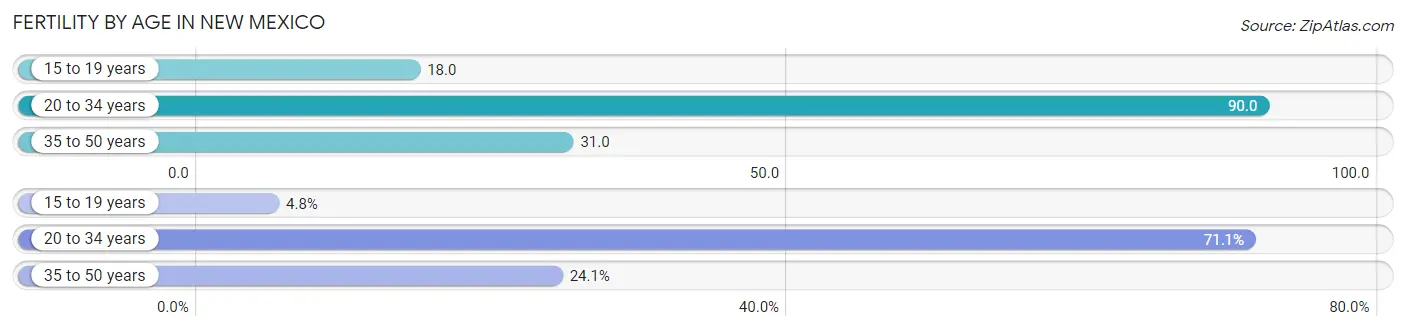
| Age Bracket | Women with Births | Births / 1,000 Women |
| 15 to 19 years | 1,253 (4.8%) | 18.0 |
| 20 to 34 years | 18,483 (71.1%) | 90.0 |
| 35 to 50 years | 6,255 (24.1%) | 31.0 |
| Total | 25,991 (100.0%) | 55.0 |
Fertility by Age by Marriage Status in New Mexico
53.8% of women with births (25,991) in New Mexico are married. The highest percentage of unmarried women with births falls into 15 to 19 years age bracket with 91.6% of them unmarried at the time of birth, while the lowest percentage of unmarried women with births belong to 35 to 50 years age bracket with 30.7% of them unmarried.
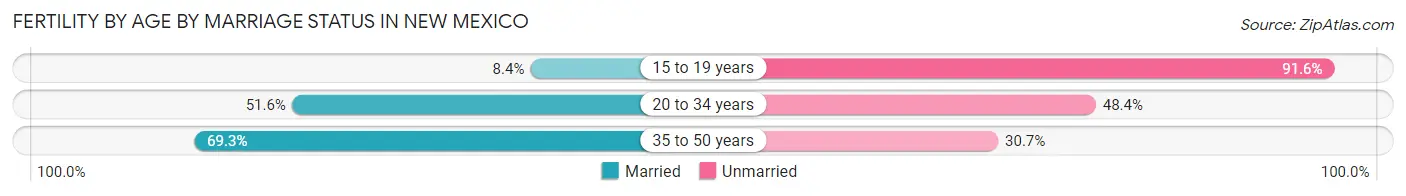
| Age Bracket | Married | Unmarried |
| 15 to 19 years | 105 (8.4%) | 1,148 (91.6%) |
| 20 to 34 years | 9,537 (51.6%) | 8,946 (48.4%) |
| 35 to 50 years | 4,335 (69.3%) | 1,920 (30.7%) |
| Total | 13,983 (53.8%) | 12,008 (46.2%) |
Fertility by Education in New Mexico
Average fertility rate in New Mexico is 55.0 births per 1,000 women. Women with the education attainment of graduate degree have the highest fertility rate of 62.0 births per 1,000 women, while women with the education attainment of less than high school have the lowest fertility at 43.0 births per 1,000 women. Women with the education attainment of college or associate's degree represent 36.0% of all women with births.
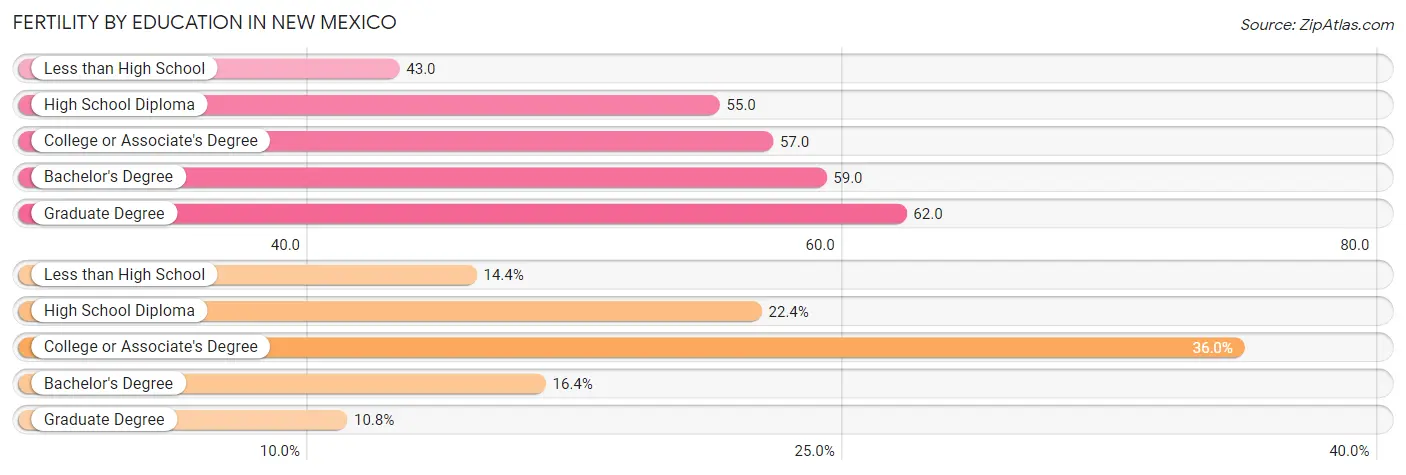
| Educational Attainment | Women with Births | Births / 1,000 Women |
| Less than High School | 3,748 (14.4%) | 43.0 |
| High School Diploma | 5,830 (22.4%) | 55.0 |
| College or Associate's Degree | 9,359 (36.0%) | 57.0 |
| Bachelor's Degree | 4,252 (16.4%) | 59.0 |
| Graduate Degree | 2,802 (10.8%) | 62.0 |
| Total | 25,991 (100.0%) | 55.0 |
Fertility by Education by Marriage Status in New Mexico
46.2% of women with births in New Mexico are unmarried. Women with the educational attainment of graduate degree are most likely to be married with 90.1% of them married at childbirth, while women with the educational attainment of less than high school are least likely to be married with 72.8% of them unmarried at childbirth.
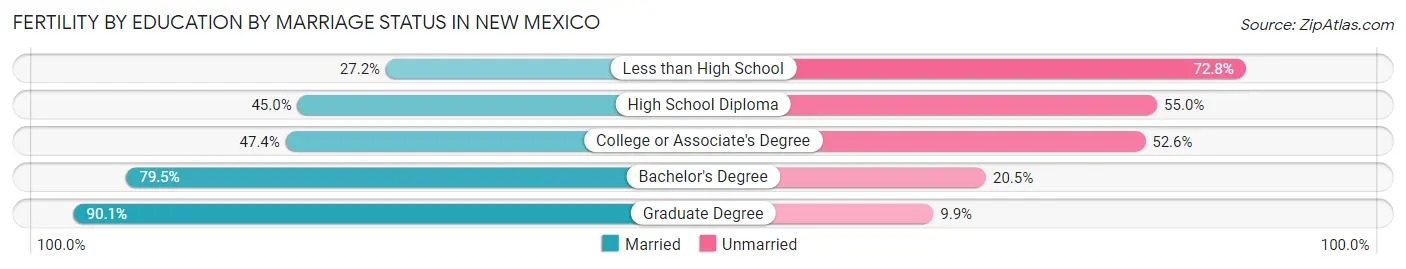
| Educational Attainment | Married | Unmarried |
| Less than High School | 1,019 (27.2%) | 2,729 (72.8%) |
| High School Diploma | 2,624 (45.0%) | 3,206 (55.0%) |
| College or Associate's Degree | 4,436 (47.4%) | 4,923 (52.6%) |
| Bachelor's Degree | 3,380 (79.5%) | 872 (20.5%) |
| Graduate Degree | 2,525 (90.1%) | 277 (9.9%) |
| Total | 13,983 (53.8%) | 12,008 (46.2%) |
Employment Characteristics in New Mexico
Employment by Class of Employer in New Mexico
Among the 901,687 employed individuals in New Mexico, private company employees (526,403 | 58.4%), local government employees (75,773 | 8.4%), and federal government employees (72,767 | 8.1%) make up the most common classes of employment.
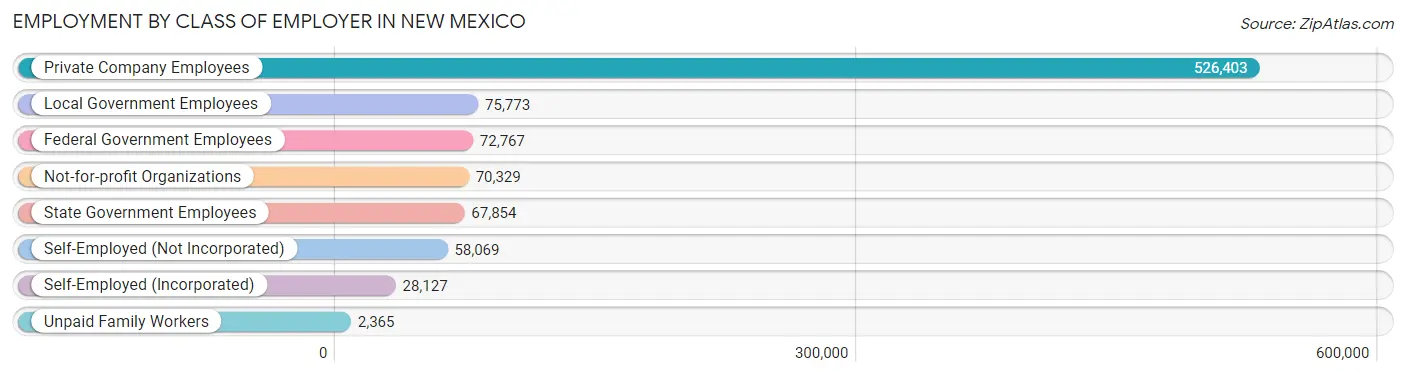
| Employer Class | # Employees | % Employees |
| Private Company Employees | 526,403 | 58.4% |
| Self-Employed (Incorporated) | 28,127 | 3.1% |
| Self-Employed (Not Incorporated) | 58,069 | 6.4% |
| Not-for-profit Organizations | 70,329 | 7.8% |
| Local Government Employees | 75,773 | 8.4% |
| State Government Employees | 67,854 | 7.5% |
| Federal Government Employees | 72,767 | 8.1% |
| Unpaid Family Workers | 2,365 | 0.3% |
| Total | 901,687 | 100.0% |
Employment Status by Age in New Mexico
According to the labor force statistics for New Mexico, out of the total population over 16 years of age (1,696,331), 57.6% or 977,087 individuals are in the labor force, with 6.2% or 60,579 of them unemployed. The age group with the highest labor force participation rate is 35 to 44 years, with 78.6% or 207,772 individuals in the labor force. Within the labor force, the 16 to 19 years age range has the highest percentage of unemployed individuals, with 15.1% or 6,514 of them being unemployed.
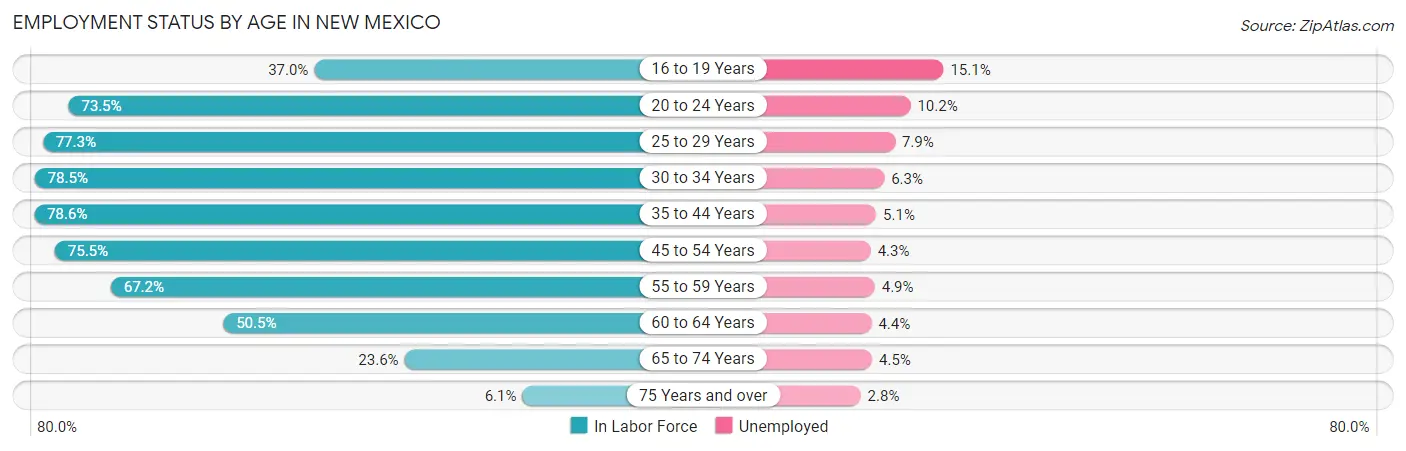
| Age Bracket | In Labor Force | Unemployed |
| 16 to 19 Years | 43,139 (37.0%) | 6,514 (15.1%) |
| 20 to 24 Years | 107,185 (73.5%) | 10,933 (10.2%) |
| 25 to 29 Years | 108,580 (77.3%) | 8,578 (7.9%) |
| 30 to 34 Years | 109,124 (78.5%) | 6,875 (6.3%) |
| 35 to 44 Years | 207,772 (78.6%) | 10,596 (5.1%) |
| 45 to 54 Years | 178,992 (75.5%) | 7,697 (4.3%) |
| 55 to 59 Years | 88,216 (67.2%) | 4,323 (4.9%) |
| 60 to 64 Years | 70,229 (50.5%) | 3,090 (4.4%) |
| 65 to 74 Years | 54,213 (23.6%) | 2,440 (4.5%) |
| 75 Years and over | 9,330 (6.1%) | 261 (2.8%) |
| Total | 977,087 (57.6%) | 60,579 (6.2%) |
Employment Status by Educational Attainment in New Mexico
According to labor force statistics for New Mexico, 72.6% of individuals (763,197) out of the total population between 25 and 64 years of age (1,051,236) are in the labor force, with 5.4% or 41,213 of them being unemployed. The group with the highest labor force participation rate are those with the educational attainment of bachelor's degree or higher, with 83.7% or 246,818 individuals in the labor force. Within the labor force, individuals with less than high school education have the highest percentage of unemployment, with 9.8% or 7,135 of them being unemployed.
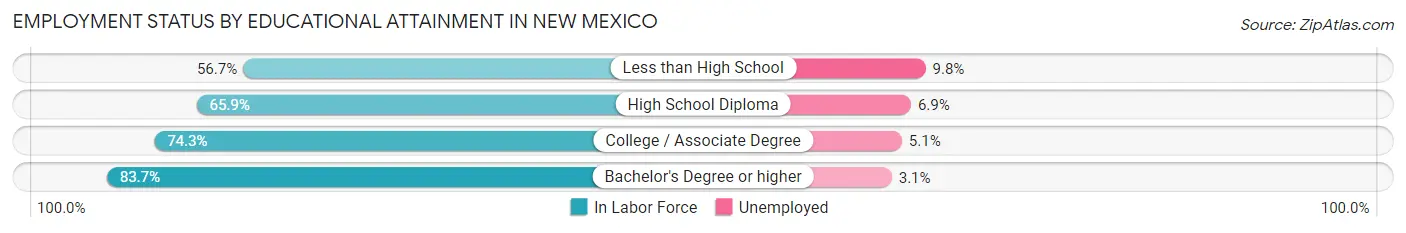
| Educational Attainment | In Labor Force | Unemployed |
| Less than High School | 72,810 (56.7%) | 12,584 (9.8%) |
| High School Diploma | 182,242 (65.9%) | 19,081 (6.9%) |
| College / Associate Degree | 261,087 (74.3%) | 17,921 (5.1%) |
| Bachelor's Degree or higher | 246,818 (83.7%) | 9,141 (3.1%) |
| Total | 763,197 (72.6%) | 56,767 (5.4%) |
Employment Occupations by Sex in New Mexico
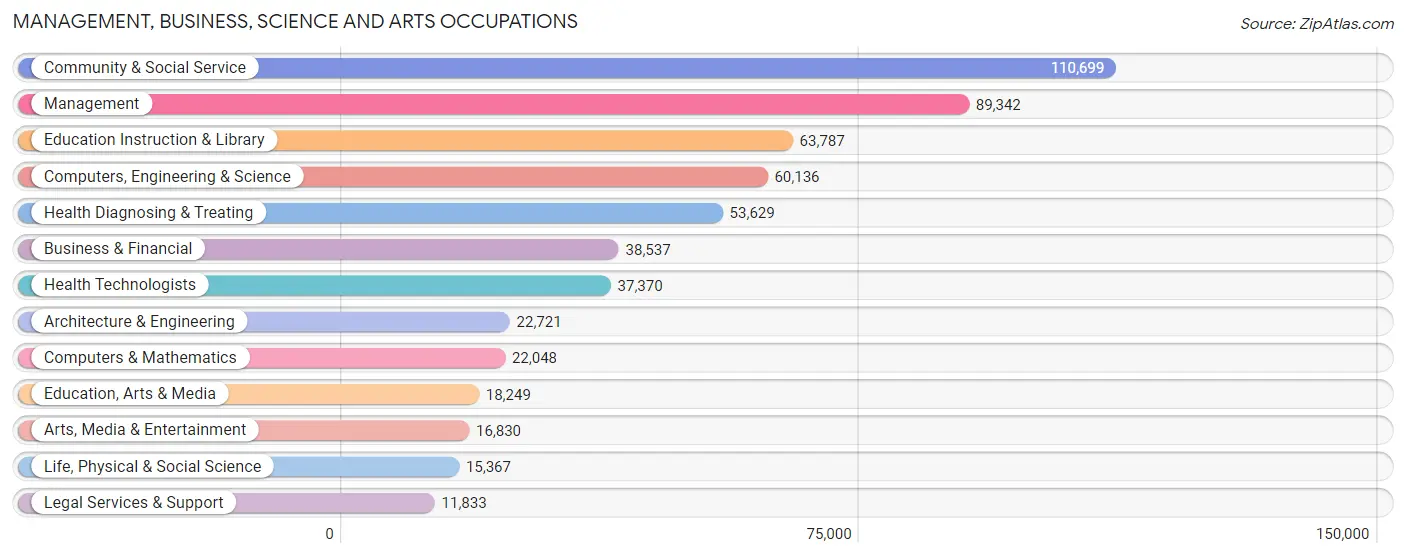
Management, Business, Science and Arts Occupations
The most common Management, Business, Science and Arts occupations in New Mexico are Community & Social Service (110,699 | 12.3%), Management (89,342 | 9.9%), Education Instruction & Library (63,787 | 7.1%), Computers, Engineering & Science (60,136 | 6.7%), and Health Diagnosing & Treating (53,629 | 5.9%).
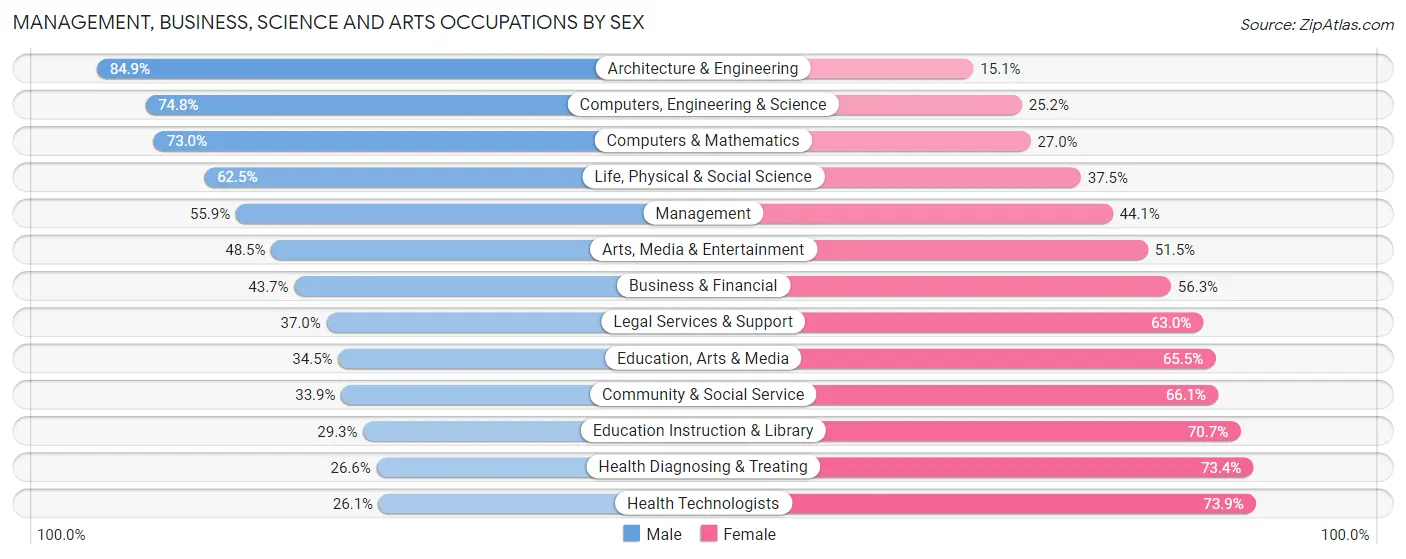
Management, Business, Science and Arts Occupations by Sex
Within the Management, Business, Science and Arts occupations in New Mexico, the most male-oriented occupations are Architecture & Engineering (84.9%), Computers, Engineering & Science (74.8%), and Computers & Mathematics (73.0%), while the most female-oriented occupations are Health Technologists (73.9%), Health Diagnosing & Treating (73.4%), and Education Instruction & Library (70.7%).
| Occupation | Male | Female |
| Management | 49,931 (55.9%) | 39,411 (44.1%) |
| Business & Financial | 16,854 (43.7%) | 21,683 (56.3%) |
| Computers, Engineering & Science | 45,005 (74.8%) | 15,131 (25.2%) |
| Computers & Mathematics | 16,102 (73.0%) | 5,946 (27.0%) |
| Architecture & Engineering | 19,296 (84.9%) | 3,425 (15.1%) |
| Life, Physical & Social Science | 9,607 (62.5%) | 5,760 (37.5%) |
| Community & Social Service | 37,556 (33.9%) | 73,143 (66.1%) |
| Education, Arts & Media | 6,303 (34.5%) | 11,946 (65.5%) |
| Legal Services & Support | 4,378 (37.0%) | 7,455 (63.0%) |
| Education Instruction & Library | 18,707 (29.3%) | 45,080 (70.7%) |
| Arts, Media & Entertainment | 8,168 (48.5%) | 8,662 (51.5%) |
| Health Diagnosing & Treating | 14,251 (26.6%) | 39,378 (73.4%) |
| Health Technologists | 9,751 (26.1%) | 27,619 (73.9%) |
| Total (Category) | 163,597 (46.4%) | 188,746 (53.6%) |
| Total (Overall) | 475,057 (52.6%) | 427,771 (47.4%) |
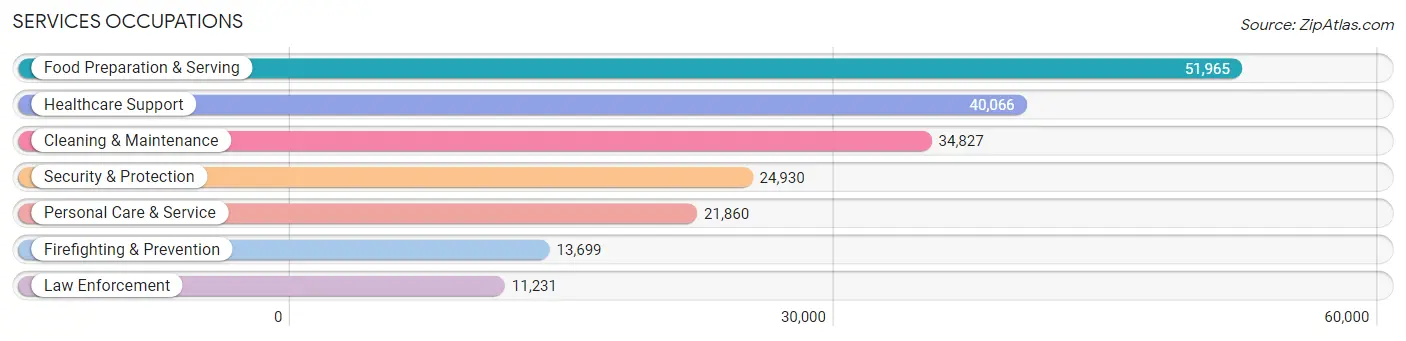
Services Occupations
The most common Services occupations in New Mexico are Food Preparation & Serving (51,965 | 5.8%), Healthcare Support (40,066 | 4.4%), Cleaning & Maintenance (34,827 | 3.9%), Security & Protection (24,930 | 2.8%), and Personal Care & Service (21,860 | 2.4%).
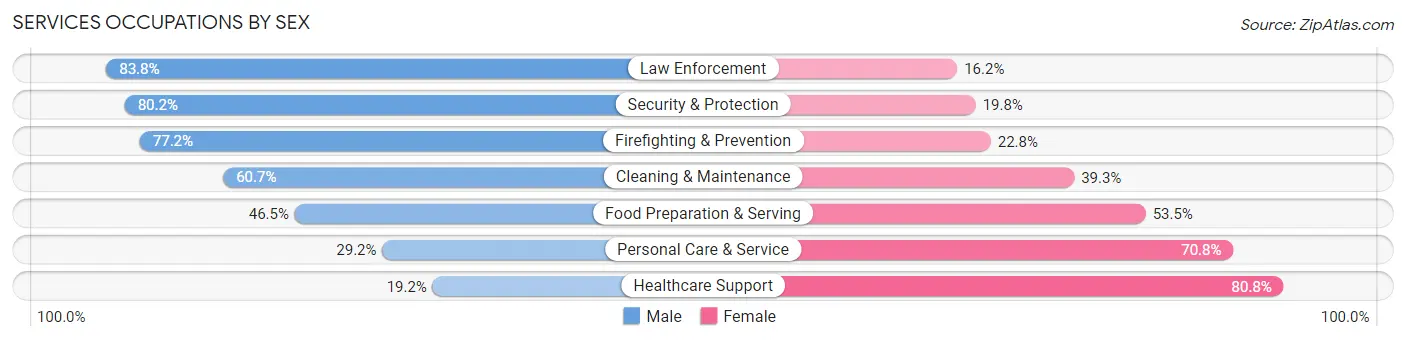
Services Occupations by Sex
Within the Services occupations in New Mexico, the most male-oriented occupations are Law Enforcement (83.8%), Security & Protection (80.2%), and Firefighting & Prevention (77.2%), while the most female-oriented occupations are Healthcare Support (80.8%), Personal Care & Service (70.8%), and Food Preparation & Serving (53.5%).
| Occupation | Male | Female |
| Healthcare Support | 7,689 (19.2%) | 32,377 (80.8%) |
| Security & Protection | 19,986 (80.2%) | 4,944 (19.8%) |
| Firefighting & Prevention | 10,572 (77.2%) | 3,127 (22.8%) |
| Law Enforcement | 9,414 (83.8%) | 1,817 (16.2%) |
| Food Preparation & Serving | 24,164 (46.5%) | 27,801 (53.5%) |
| Cleaning & Maintenance | 21,125 (60.7%) | 13,702 (39.3%) |
| Personal Care & Service | 6,374 (29.2%) | 15,486 (70.8%) |
| Total (Category) | 79,338 (45.7%) | 94,310 (54.3%) |
| Total (Overall) | 475,057 (52.6%) | 427,771 (47.4%) |
Sales and Office Occupations
The most common Sales and Office occupations in New Mexico are Office & Administration (100,799 | 11.2%), and Sales & Related (83,647 | 9.3%).

Sales and Office Occupations by Sex
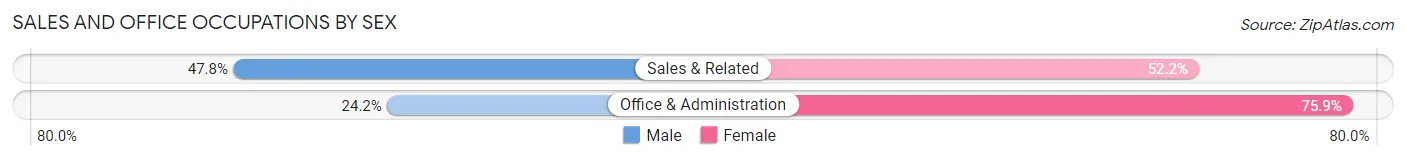
| Occupation | Male | Female |
| Sales & Related | 39,997 (47.8%) | 43,650 (52.2%) |
| Office & Administration | 24,340 (24.1%) | 76,459 (75.8%) |
| Total (Category) | 64,337 (34.9%) | 120,109 (65.1%) |
| Total (Overall) | 475,057 (52.6%) | 427,771 (47.4%) |
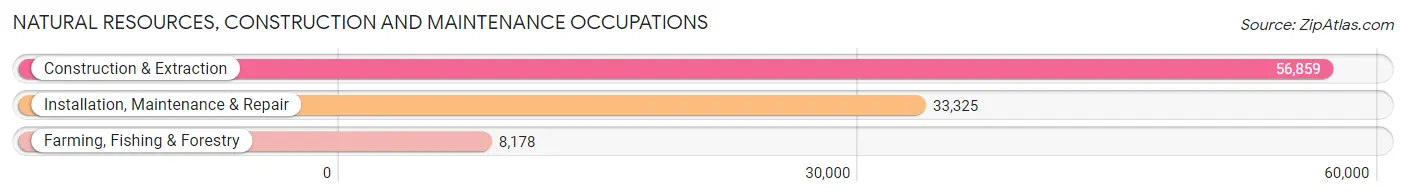
Natural Resources, Construction and Maintenance Occupations
The most common Natural Resources, Construction and Maintenance occupations in New Mexico are Construction & Extraction (56,859 | 6.3%), Installation, Maintenance & Repair (33,325 | 3.7%), and Farming, Fishing & Forestry (8,178 | 0.9%).
Natural Resources, Construction and Maintenance Occupations by Sex
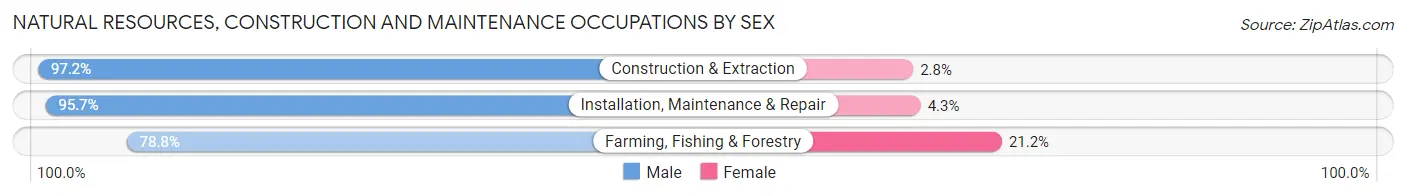
| Occupation | Male | Female |
| Farming, Fishing & Forestry | 6,442 (78.8%) | 1,736 (21.2%) |
| Construction & Extraction | 55,286 (97.2%) | 1,573 (2.8%) |
| Installation, Maintenance & Repair | 31,882 (95.7%) | 1,443 (4.3%) |
| Total (Category) | 93,610 (95.2%) | 4,752 (4.8%) |
| Total (Overall) | 475,057 (52.6%) | 427,771 (47.4%) |
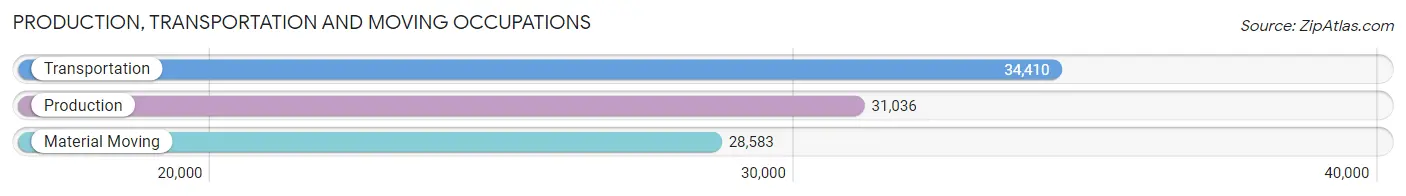
Production, Transportation and Moving Occupations
The most common Production, Transportation and Moving occupations in New Mexico are Transportation (34,410 | 3.8%), Production (31,036 | 3.4%), and Material Moving (28,583 | 3.2%).
Production, Transportation and Moving Occupations by Sex
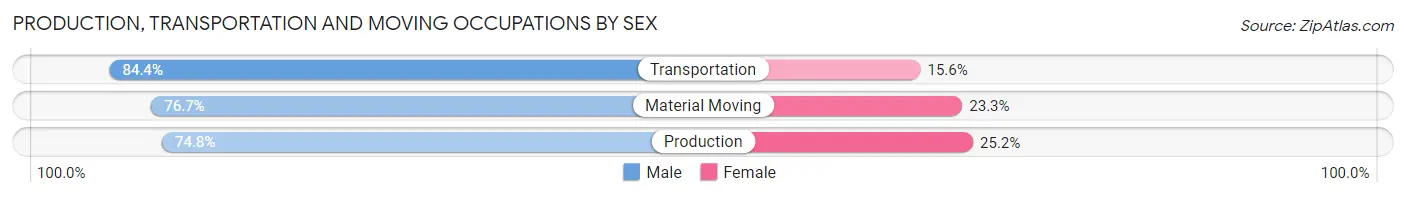
| Occupation | Male | Female |
| Production | 23,201 (74.8%) | 7,835 (25.2%) |
| Transportation | 29,041 (84.4%) | 5,369 (15.6%) |
| Material Moving | 21,933 (76.7%) | 6,650 (23.3%) |
| Total (Category) | 74,175 (78.9%) | 19,854 (21.1%) |
| Total (Overall) | 475,057 (52.6%) | 427,771 (47.4%) |
Employment Industries by Sex in New Mexico
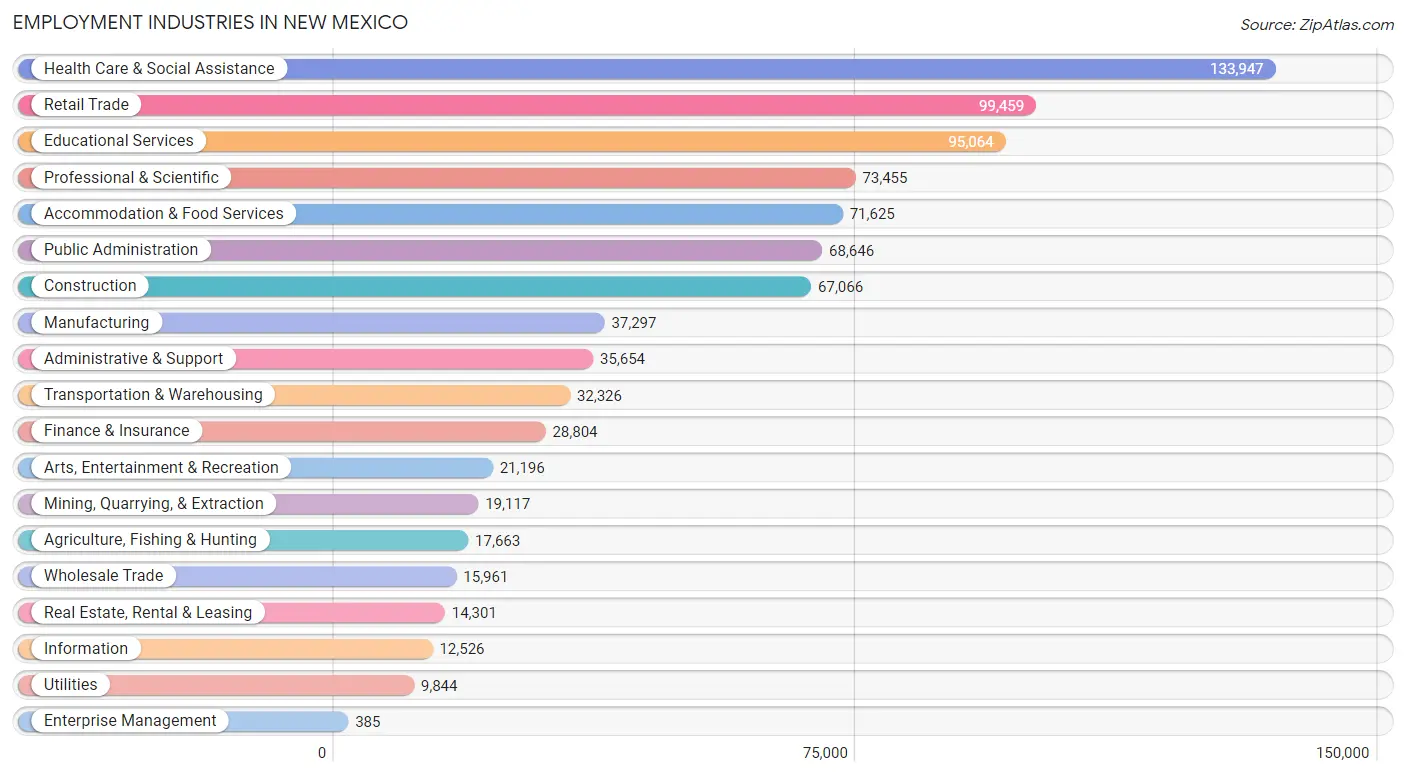
Employment Industries in New Mexico
The major employment industries in New Mexico include Health Care & Social Assistance (133,947 | 14.8%), Retail Trade (99,459 | 11.0%), Educational Services (95,064 | 10.5%), Professional & Scientific (73,455 | 8.1%), and Accommodation & Food Services (71,625 | 7.9%).
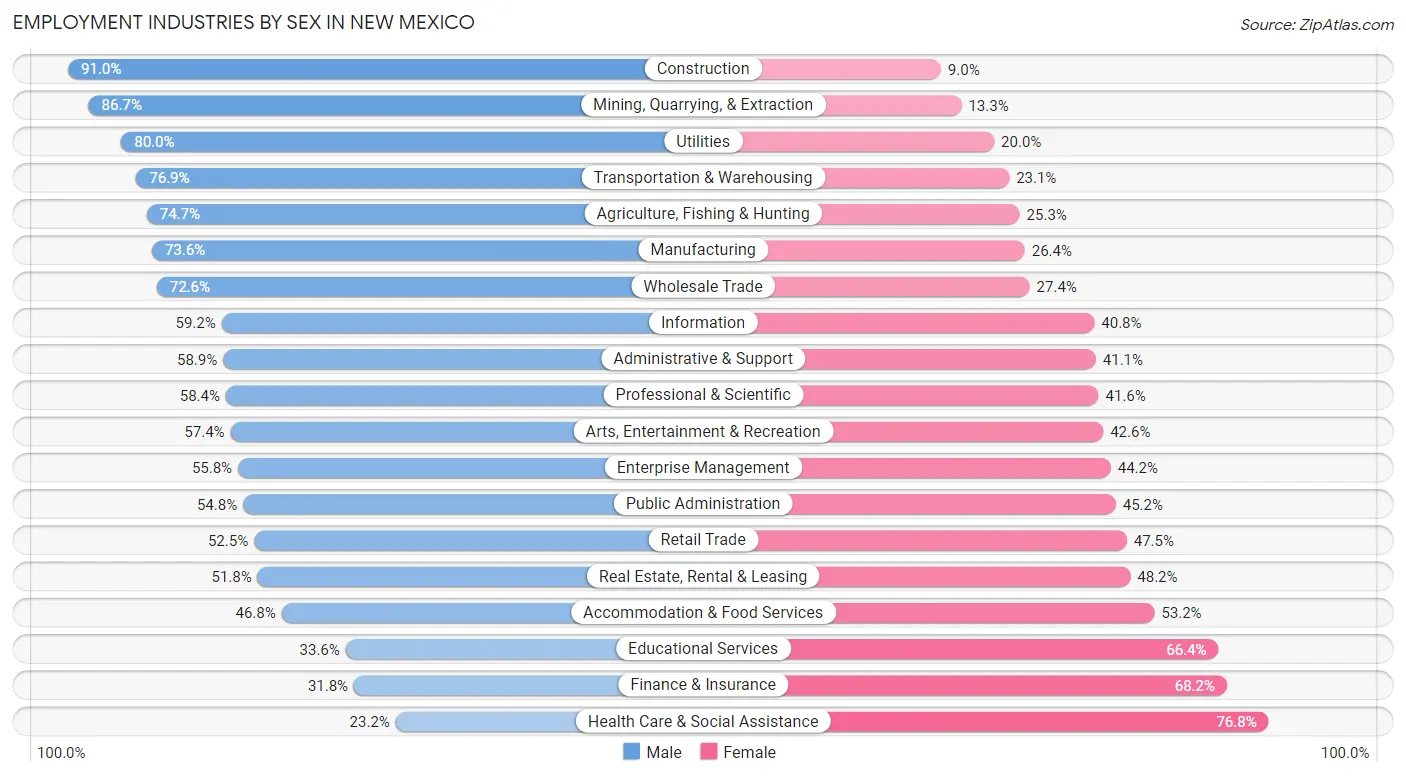
Employment Industries by Sex in New Mexico
The New Mexico industries that see more men than women are Construction (91.0%), Mining, Quarrying, & Extraction (86.7%), and Utilities (80.0%), whereas the industries that tend to have a higher number of women are Health Care & Social Assistance (76.8%), Finance & Insurance (68.2%), and Educational Services (66.4%).
| Industry | Male | Female |
| Agriculture, Fishing & Hunting | 13,194 (74.7%) | 4,469 (25.3%) |
| Mining, Quarrying, & Extraction | 16,583 (86.7%) | 2,534 (13.3%) |
| Construction | 61,031 (91.0%) | 6,035 (9.0%) |
| Manufacturing | 27,462 (73.6%) | 9,835 (26.4%) |
| Wholesale Trade | 11,593 (72.6%) | 4,368 (27.4%) |
| Retail Trade | 52,234 (52.5%) | 47,225 (47.5%) |
| Transportation & Warehousing | 24,845 (76.9%) | 7,481 (23.1%) |
| Utilities | 7,873 (80.0%) | 1,971 (20.0%) |
| Information | 7,420 (59.2%) | 5,106 (40.8%) |
| Finance & Insurance | 9,168 (31.8%) | 19,636 (68.2%) |
| Real Estate, Rental & Leasing | 7,405 (51.8%) | 6,896 (48.2%) |
| Professional & Scientific | 42,867 (58.4%) | 30,588 (41.6%) |
| Enterprise Management | 215 (55.8%) | 170 (44.2%) |
| Administrative & Support | 21,010 (58.9%) | 14,644 (41.1%) |
| Educational Services | 31,906 (33.6%) | 63,158 (66.4%) |
| Health Care & Social Assistance | 31,076 (23.2%) | 102,871 (76.8%) |
| Arts, Entertainment & Recreation | 12,166 (57.4%) | 9,030 (42.6%) |
| Accommodation & Food Services | 33,518 (46.8%) | 38,107 (53.2%) |
| Public Administration | 37,617 (54.8%) | 31,029 (45.2%) |
| Total | 475,057 (52.6%) | 427,771 (47.4%) |
Education in New Mexico
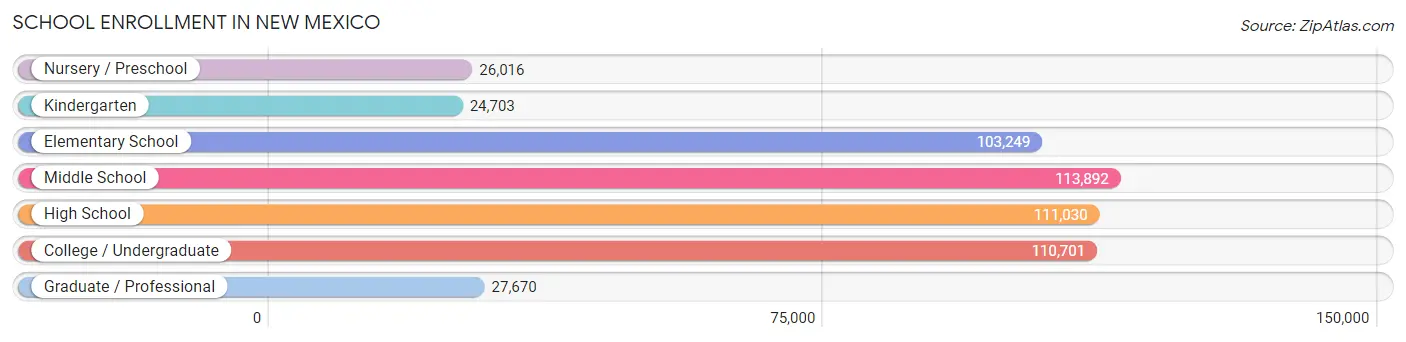
School Enrollment in New Mexico
The most common levels of schooling among the 517,261 students in New Mexico are middle school (113,892 | 22.0%), high school (111,030 | 21.5%), and college / undergraduate (110,701 | 21.4%).
| School Level | # Students | % Students |
| Nursery / Preschool | 26,016 | 5.0% |
| Kindergarten | 24,703 | 4.8% |
| Elementary School | 103,249 | 20.0% |
| Middle School | 113,892 | 22.0% |
| High School | 111,030 | 21.5% |
| College / Undergraduate | 110,701 | 21.4% |
| Graduate / Professional | 27,670 | 5.3% |
| Total | 517,261 | 100.0% |
School Enrollment by Age by Funding Source in New Mexico
Out of a total of 517,261 students who are enrolled in schools in New Mexico, 57,933 (11.2%) attend a private institution, while the remaining 459,328 (88.8%) are enrolled in public schools. The age group of 3 to 4 year olds has the highest likelihood of being enrolled in private schools, with 5,009 (24.8% in the age bracket) enrolled. Conversely, the age group of 10 to 14 year olds has the lowest likelihood of being enrolled in a private school, with 127,209 (91.8% in the age bracket) attending a public institution.
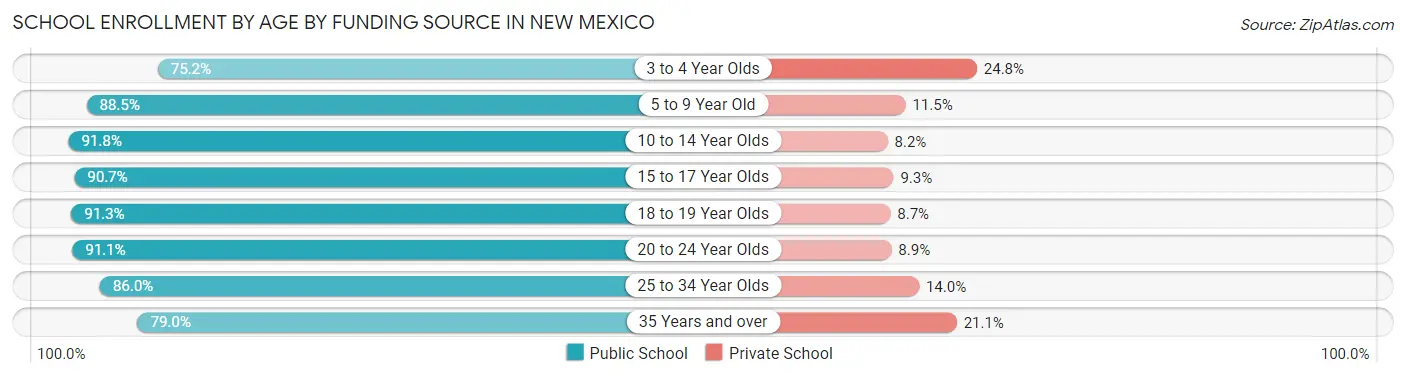
| Age Bracket | Public School | Private School |
| 3 to 4 Year Olds | 15,181 (75.2%) | 5,009 (24.8%) |
| 5 to 9 Year Old | 106,746 (88.5%) | 13,910 (11.5%) |
| 10 to 14 Year Olds | 127,209 (91.8%) | 11,336 (8.2%) |
| 15 to 17 Year Olds | 72,809 (90.7%) | 7,439 (9.3%) |
| 18 to 19 Year Olds | 35,691 (91.3%) | 3,402 (8.7%) |
| 20 to 24 Year Olds | 43,316 (91.1%) | 4,224 (8.9%) |
| 25 to 34 Year Olds | 30,307 (86.0%) | 4,945 (14.0%) |
| 35 Years and over | 28,214 (78.9%) | 7,523 (21.0%) |
| Total | 459,328 (88.8%) | 57,933 (11.2%) |
Educational Attainment by Field of Study in New Mexico
Business (69,529 | 15.2%), education (62,778 | 13.7%), science & technology (41,836 | 9.2%), social sciences (36,169 | 7.9%), and bio, nature & agricultural (35,584 | 7.8%) are the most common fields of study among 456,893 individuals in New Mexico who have obtained a bachelor's degree or higher.
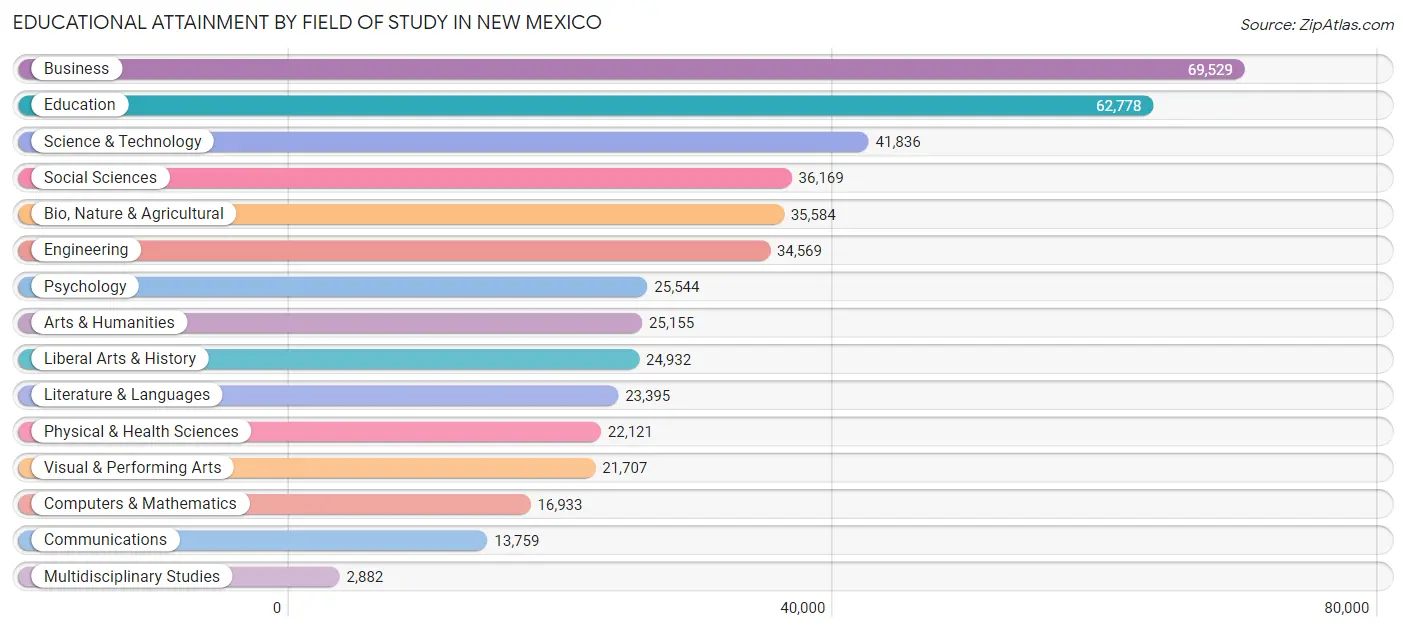
| Field of Study | # Graduates | % Graduates |
| Computers & Mathematics | 16,933 | 3.7% |
| Bio, Nature & Agricultural | 35,584 | 7.8% |
| Physical & Health Sciences | 22,121 | 4.8% |
| Psychology | 25,544 | 5.6% |
| Social Sciences | 36,169 | 7.9% |
| Engineering | 34,569 | 7.6% |
| Multidisciplinary Studies | 2,882 | 0.6% |
| Science & Technology | 41,836 | 9.2% |
| Business | 69,529 | 15.2% |
| Education | 62,778 | 13.7% |
| Literature & Languages | 23,395 | 5.1% |
| Liberal Arts & History | 24,932 | 5.5% |
| Visual & Performing Arts | 21,707 | 4.8% |
| Communications | 13,759 | 3.0% |
| Arts & Humanities | 25,155 | 5.5% |
| Total | 456,893 | 100.0% |
Transportation & Commute in New Mexico
Vehicle Availability by Sex in New Mexico
The most prevalent vehicle ownership categories in New Mexico are males with 2 vehicles (187,667, accounting for 39.5%) and females with 2 vehicles (156,746, making up 44.9%).
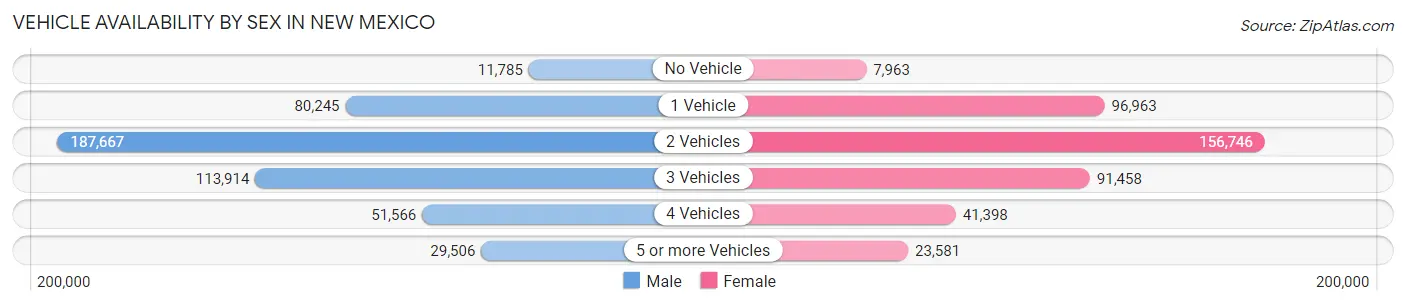
| Vehicles Available | Male | Female |
| No Vehicle | 11,785 (2.5%) | 7,963 (1.9%) |
| 1 Vehicle | 80,245 (16.9%) | 96,963 (23.2%) |
| 2 Vehicles | 187,667 (39.5%) | 156,746 (37.5%) |
| 3 Vehicles | 113,914 (24.0%) | 91,458 (21.9%) |
| 4 Vehicles | 51,566 (10.9%) | 41,398 (9.9%) |
| 5 or more Vehicles | 29,506 (6.2%) | 23,581 (5.6%) |
| Total | 474,683 (100.0%) | 418,109 (100.0%) |
Commute Time in New Mexico
The most frequently occuring commute durations in New Mexico are 15 to 19 minutes (143,079 commuters, 17.5%), 10 to 14 minutes (131,366 commuters, 16.1%), and 20 to 24 minutes (118,969 commuters, 14.6%).
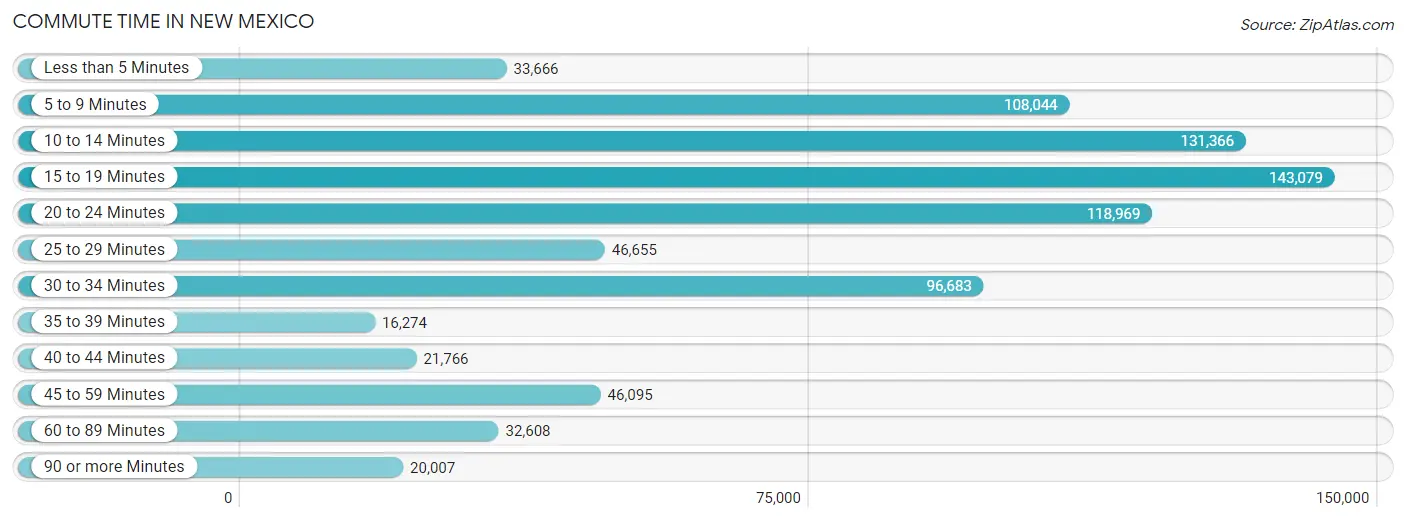
| Commute Time | # Commuters | % Commuters |
| Less than 5 Minutes | 33,666 | 4.1% |
| 5 to 9 Minutes | 108,044 | 13.3% |
| 10 to 14 Minutes | 131,366 | 16.1% |
| 15 to 19 Minutes | 143,079 | 17.5% |
| 20 to 24 Minutes | 118,969 | 14.6% |
| 25 to 29 Minutes | 46,655 | 5.7% |
| 30 to 34 Minutes | 96,683 | 11.9% |
| 35 to 39 Minutes | 16,274 | 2.0% |
| 40 to 44 Minutes | 21,766 | 2.7% |
| 45 to 59 Minutes | 46,095 | 5.7% |
| 60 to 89 Minutes | 32,608 | 4.0% |
| 90 or more Minutes | 20,007 | 2.5% |
Commute Time by Sex in New Mexico
The most common commute times in New Mexico are 15 to 19 minutes (77,084 commuters, 17.5%) for males and 15 to 19 minutes (65,995 commuters, 17.6%) for females.
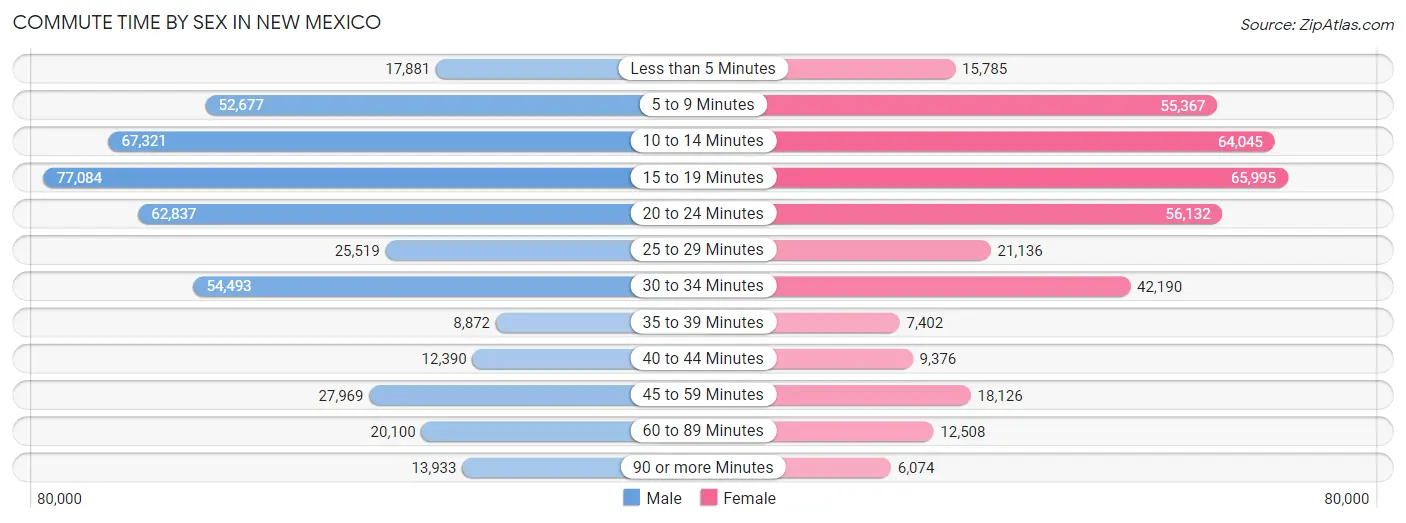
| Commute Time | Male | Female |
| Less than 5 Minutes | 17,881 (4.1%) | 15,785 (4.2%) |
| 5 to 9 Minutes | 52,677 (11.9%) | 55,367 (14.8%) |
| 10 to 14 Minutes | 67,321 (15.3%) | 64,045 (17.1%) |
| 15 to 19 Minutes | 77,084 (17.5%) | 65,995 (17.6%) |
| 20 to 24 Minutes | 62,837 (14.2%) | 56,132 (15.0%) |
| 25 to 29 Minutes | 25,519 (5.8%) | 21,136 (5.7%) |
| 30 to 34 Minutes | 54,493 (12.3%) | 42,190 (11.3%) |
| 35 to 39 Minutes | 8,872 (2.0%) | 7,402 (2.0%) |
| 40 to 44 Minutes | 12,390 (2.8%) | 9,376 (2.5%) |
| 45 to 59 Minutes | 27,969 (6.3%) | 18,126 (4.8%) |
| 60 to 89 Minutes | 20,100 (4.6%) | 12,508 (3.3%) |
| 90 or more Minutes | 13,933 (3.2%) | 6,074 (1.6%) |
Time of Departure to Work by Sex in New Mexico
The most frequent times of departure to work in New Mexico are 7:00 AM to 7:29 AM (64,991, 14.7%) for males and 7:30 AM to 7:59 AM (69,931, 18.7%) for females.
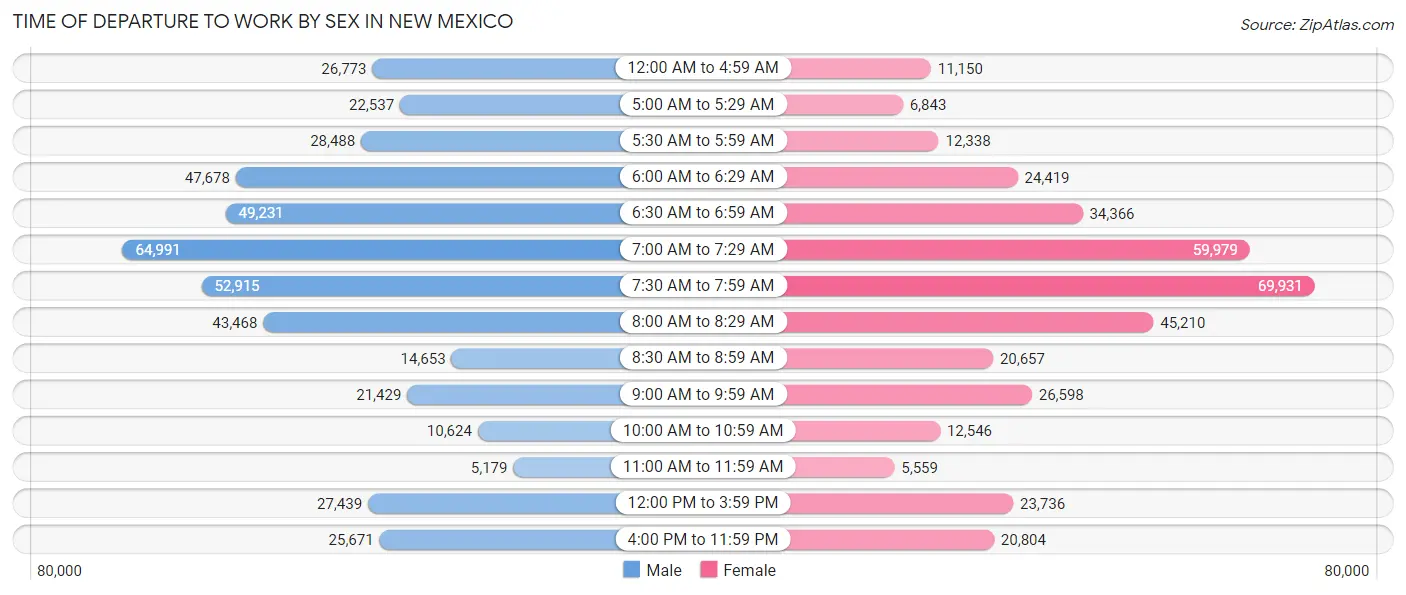
| Time of Departure | Male | Female |
| 12:00 AM to 4:59 AM | 26,773 (6.1%) | 11,150 (3.0%) |
| 5:00 AM to 5:29 AM | 22,537 (5.1%) | 6,843 (1.8%) |
| 5:30 AM to 5:59 AM | 28,488 (6.5%) | 12,338 (3.3%) |
| 6:00 AM to 6:29 AM | 47,678 (10.8%) | 24,419 (6.5%) |
| 6:30 AM to 6:59 AM | 49,231 (11.2%) | 34,366 (9.2%) |
| 7:00 AM to 7:29 AM | 64,991 (14.7%) | 59,979 (16.0%) |
| 7:30 AM to 7:59 AM | 52,915 (12.0%) | 69,931 (18.7%) |
| 8:00 AM to 8:29 AM | 43,468 (9.9%) | 45,210 (12.1%) |
| 8:30 AM to 8:59 AM | 14,653 (3.3%) | 20,657 (5.5%) |
| 9:00 AM to 9:59 AM | 21,429 (4.9%) | 26,598 (7.1%) |
| 10:00 AM to 10:59 AM | 10,624 (2.4%) | 12,546 (3.4%) |
| 11:00 AM to 11:59 AM | 5,179 (1.2%) | 5,559 (1.5%) |
| 12:00 PM to 3:59 PM | 27,439 (6.2%) | 23,736 (6.3%) |
| 4:00 PM to 11:59 PM | 25,671 (5.8%) | 20,804 (5.6%) |
| Total | 441,076 (100.0%) | 374,136 (100.0%) |
Housing Occupancy in New Mexico
Occupancy by Ownership in New Mexico
Of the total 812,852 dwellings in New Mexico, owner-occupied units account for 558,179 (68.7%), while renter-occupied units make up 254,673 (31.3%).
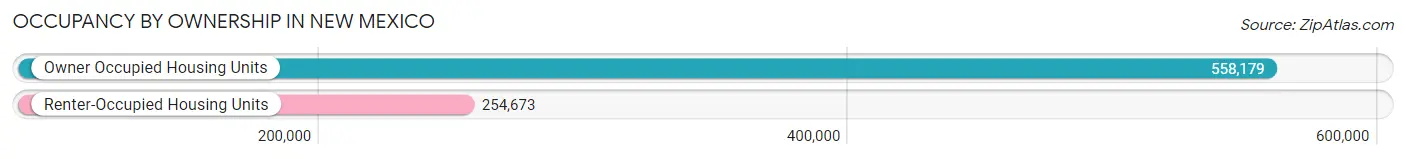
| Occupancy | # Housing Units | % Housing Units |
| Owner Occupied Housing Units | 558,179 | 68.7% |
| Renter-Occupied Housing Units | 254,673 | 31.3% |
| Total Occupied Housing Units | 812,852 | 100.0% |
Occupancy by Household Size in New Mexico
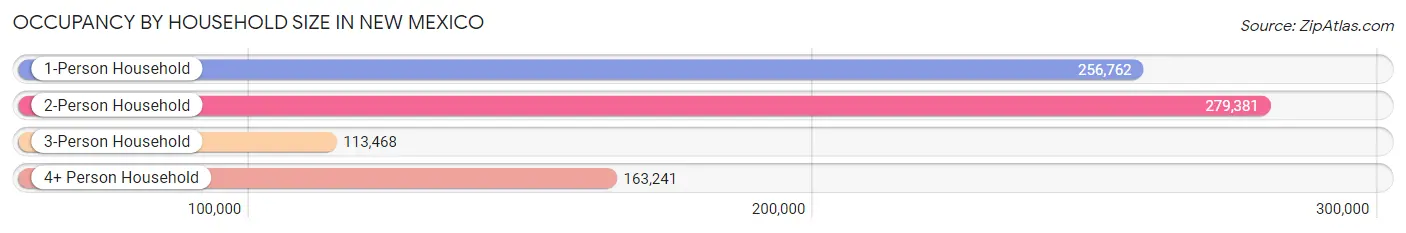
| Household Size | # Housing Units | % Housing Units |
| 1-Person Household | 256,762 | 31.6% |
| 2-Person Household | 279,381 | 34.4% |
| 3-Person Household | 113,468 | 14.0% |
| 4+ Person Household | 163,241 | 20.1% |
| Total Housing Units | 812,852 | 100.0% |
Occupancy by Ownership by Household Size in New Mexico
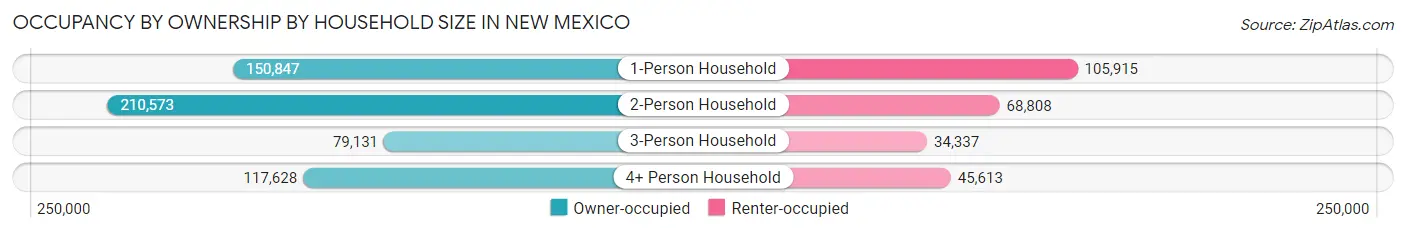
| Household Size | Owner-occupied | Renter-occupied |
| 1-Person Household | 150,847 (58.8%) | 105,915 (41.2%) |
| 2-Person Household | 210,573 (75.4%) | 68,808 (24.6%) |
| 3-Person Household | 79,131 (69.7%) | 34,337 (30.3%) |
| 4+ Person Household | 117,628 (72.1%) | 45,613 (27.9%) |
| Total Housing Units | 558,179 (68.7%) | 254,673 (31.3%) |
Occupancy by Educational Attainment in New Mexico
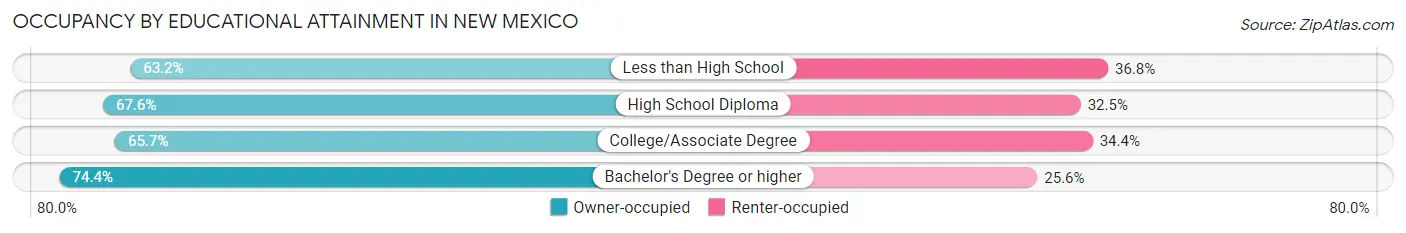
| Household Size | Owner-occupied | Renter-occupied |
| Less than High School | 57,201 (63.2%) | 33,273 (36.8%) |
| High School Diploma | 123,228 (67.5%) | 59,184 (32.5%) |
| College/Associate Degree | 180,483 (65.6%) | 94,433 (34.4%) |
| Bachelor's Degree or higher | 197,267 (74.4%) | 67,783 (25.6%) |
Occupancy by Age of Householder in New Mexico
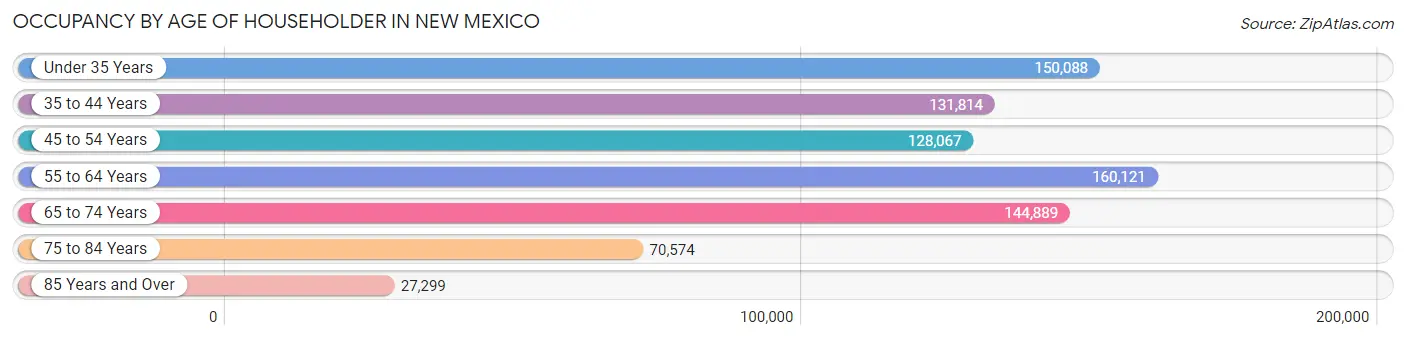
| Age Bracket | # Households | % Households |
| Under 35 Years | 150,088 | 18.5% |
| 35 to 44 Years | 131,814 | 16.2% |
| 45 to 54 Years | 128,067 | 15.8% |
| 55 to 64 Years | 160,121 | 19.7% |
| 65 to 74 Years | 144,889 | 17.8% |
| 75 to 84 Years | 70,574 | 8.7% |
| 85 Years and Over | 27,299 | 3.4% |
| Total | 812,852 | 100.0% |
Housing Finances in New Mexico
Median Income by Occupancy in New Mexico
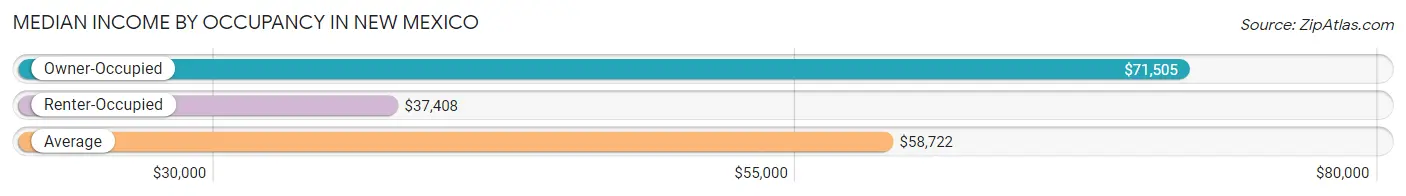
| Occupancy Type | # Households | Median Income |
| Owner-Occupied | 558,179 (68.7%) | $71,505 |
| Renter-Occupied | 254,673 (31.3%) | $37,408 |
| Average | 812,852 (100.0%) | $58,722 |
Occupancy by Householder Income Bracket in New Mexico
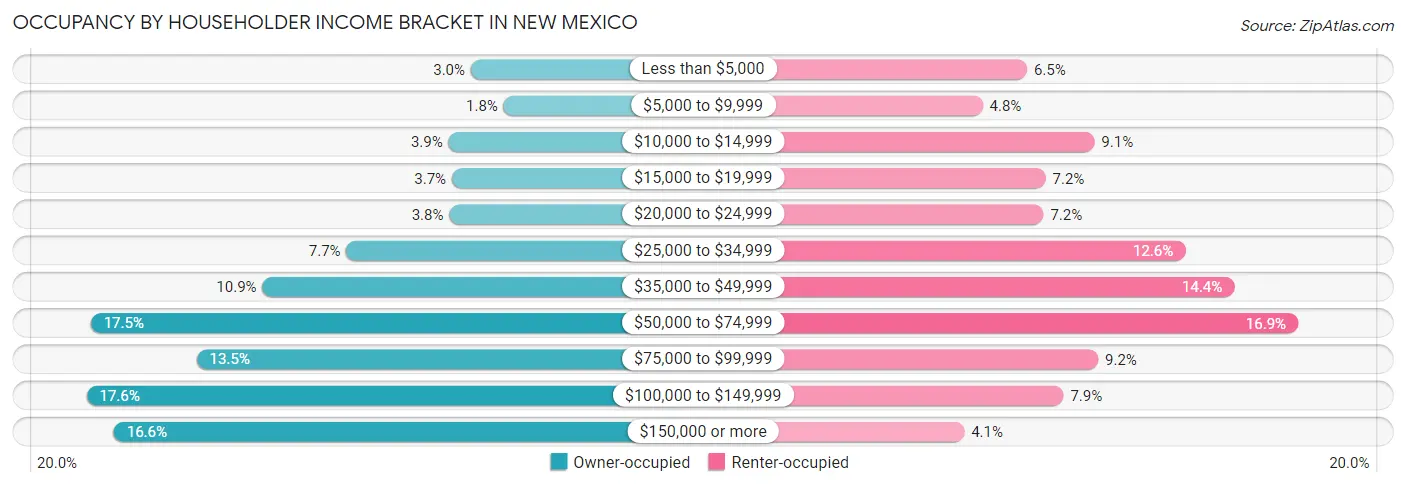
| Income Bracket | Owner-occupied | Renter-occupied |
| Less than $5,000 | 16,744 (3.0%) | 16,639 (6.5%) |
| $5,000 to $9,999 | 9,759 (1.8%) | 12,336 (4.8%) |
| $10,000 to $14,999 | 21,498 (3.8%) | 23,178 (9.1%) |
| $15,000 to $19,999 | 20,773 (3.7%) | 18,447 (7.2%) |
| $20,000 to $24,999 | 21,307 (3.8%) | 18,243 (7.2%) |
| $25,000 to $34,999 | 43,198 (7.7%) | 31,965 (12.6%) |
| $35,000 to $49,999 | 61,091 (10.9%) | 36,712 (14.4%) |
| $50,000 to $74,999 | 97,594 (17.5%) | 42,918 (16.9%) |
| $75,000 to $99,999 | 75,098 (13.5%) | 23,534 (9.2%) |
| $100,000 to $149,999 | 98,475 (17.6%) | 20,164 (7.9%) |
| $150,000 or more | 92,642 (16.6%) | 10,537 (4.1%) |
| Total | 558,179 (100.0%) | 254,673 (100.0%) |
Monthly Housing Cost Tiers in New Mexico
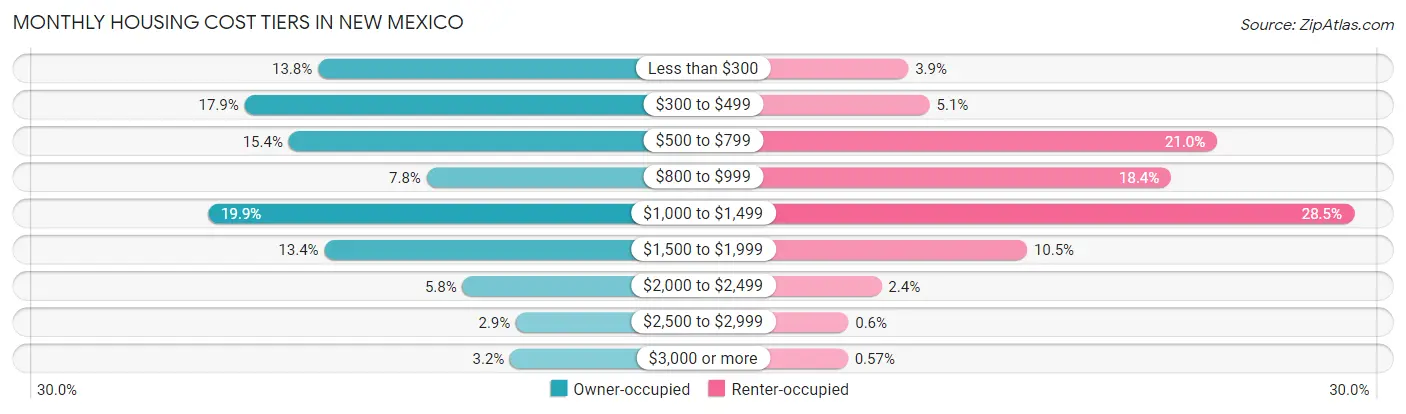
| Monthly Cost | Owner-occupied | Renter-occupied |
| Less than $300 | 76,978 (13.8%) | 9,947 (3.9%) |
| $300 to $499 | 99,645 (17.8%) | 12,957 (5.1%) |
| $500 to $799 | 86,023 (15.4%) | 53,412 (21.0%) |
| $800 to $999 | 43,508 (7.8%) | 46,947 (18.4%) |
| $1,000 to $1,499 | 110,884 (19.9%) | 72,638 (28.5%) |
| $1,500 to $1,999 | 75,034 (13.4%) | 26,652 (10.5%) |
| $2,000 to $2,499 | 32,437 (5.8%) | 6,189 (2.4%) |
| $2,500 to $2,999 | 15,936 (2.9%) | 1,524 (0.6%) |
| $3,000 or more | 17,734 (3.2%) | 1,455 (0.6%) |
| Total | 558,179 (100.0%) | 254,673 (100.0%) |
Physical Housing Characteristics in New Mexico
Housing Structures in New Mexico
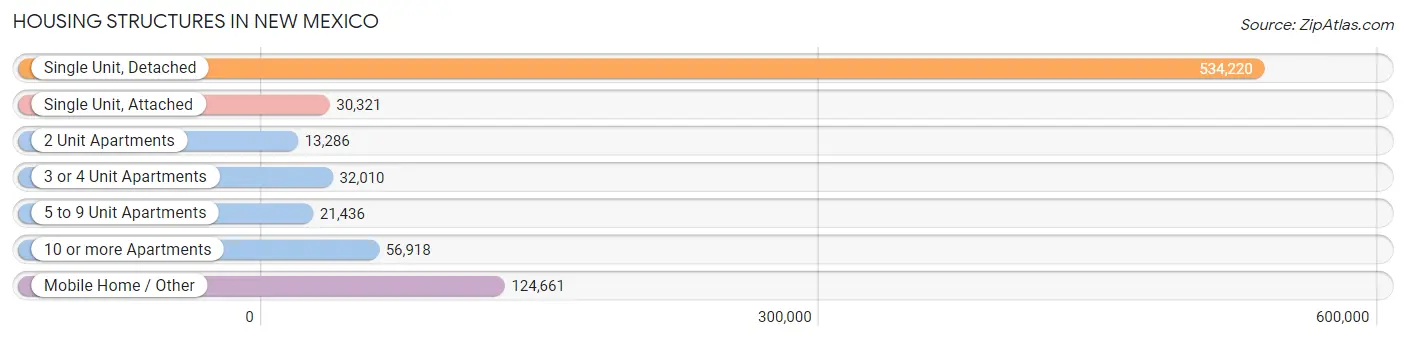
| Structure Type | # Housing Units | % Housing Units |
| Single Unit, Detached | 534,220 | 65.7% |
| Single Unit, Attached | 30,321 | 3.7% |
| 2 Unit Apartments | 13,286 | 1.6% |
| 3 or 4 Unit Apartments | 32,010 | 3.9% |
| 5 to 9 Unit Apartments | 21,436 | 2.6% |
| 10 or more Apartments | 56,918 | 7.0% |
| Mobile Home / Other | 124,661 | 15.3% |
| Total | 812,852 | 100.0% |
Housing Structures by Occupancy in New Mexico
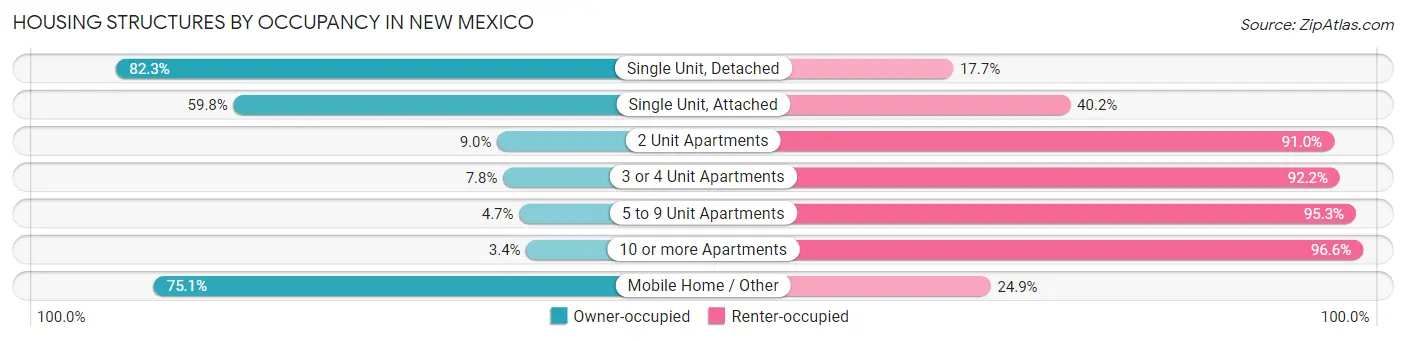
| Structure Type | Owner-occupied | Renter-occupied |
| Single Unit, Detached | 439,789 (82.3%) | 94,431 (17.7%) |
| Single Unit, Attached | 18,120 (59.8%) | 12,201 (40.2%) |
| 2 Unit Apartments | 1,194 (9.0%) | 12,092 (91.0%) |
| 3 or 4 Unit Apartments | 2,511 (7.8%) | 29,499 (92.2%) |
| 5 to 9 Unit Apartments | 1,016 (4.7%) | 20,420 (95.3%) |
| 10 or more Apartments | 1,921 (3.4%) | 54,997 (96.6%) |
| Mobile Home / Other | 93,628 (75.1%) | 31,033 (24.9%) |
| Total | 558,179 (68.7%) | 254,673 (31.3%) |
Housing Structures by Number of Rooms in New Mexico
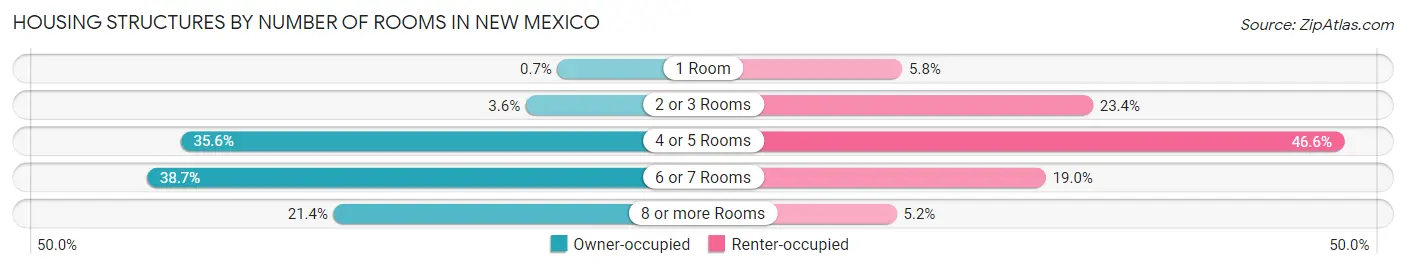
| Number of Rooms | Owner-occupied | Renter-occupied |
| 1 Room | 3,901 (0.7%) | 14,636 (5.8%) |
| 2 or 3 Rooms | 20,277 (3.6%) | 59,578 (23.4%) |
| 4 or 5 Rooms | 198,611 (35.6%) | 118,640 (46.6%) |
| 6 or 7 Rooms | 215,932 (38.7%) | 48,471 (19.0%) |
| 8 or more Rooms | 119,458 (21.4%) | 13,348 (5.2%) |
| Total | 558,179 (100.0%) | 254,673 (100.0%) |
Housing Structure by Heating Type in New Mexico
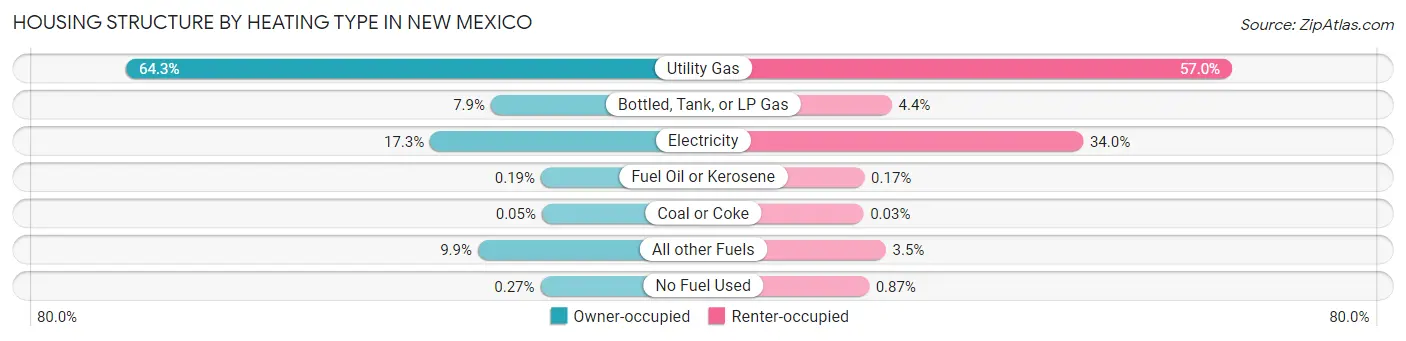
| Heating Type | Owner-occupied | Renter-occupied |
| Utility Gas | 358,963 (64.3%) | 145,212 (57.0%) |
| Bottled, Tank, or LP Gas | 44,237 (7.9%) | 11,264 (4.4%) |
| Electricity | 96,653 (17.3%) | 86,593 (34.0%) |
| Fuel Oil or Kerosene | 1,086 (0.2%) | 427 (0.2%) |
| Coal or Coke | 252 (0.1%) | 75 (0.0%) |
| All other Fuels | 55,473 (9.9%) | 8,889 (3.5%) |
| No Fuel Used | 1,515 (0.3%) | 2,213 (0.9%) |
| Total | 558,179 (100.0%) | 254,673 (100.0%) |
Household Vehicle Usage in New Mexico
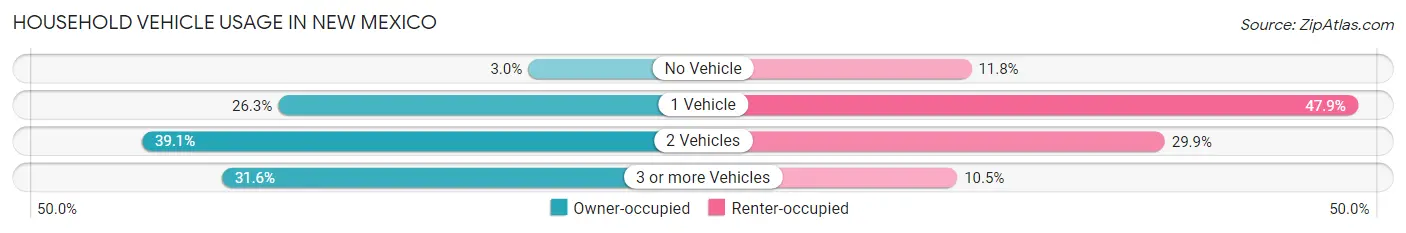
| Vehicles per Household | Owner-occupied | Renter-occupied |
| No Vehicle | 16,760 (3.0%) | 30,071 (11.8%) |
| 1 Vehicle | 147,037 (26.3%) | 121,852 (47.8%) |
| 2 Vehicles | 217,989 (39.1%) | 76,053 (29.9%) |
| 3 or more Vehicles | 176,393 (31.6%) | 26,697 (10.5%) |
| Total | 558,179 (100.0%) | 254,673 (100.0%) |
Real Estate & Mortgages in New Mexico
Real Estate and Mortgage Overview in New Mexico
| Characteristic | Without Mortgage | With Mortgage |
| Housing Units | 264,309 | 293,870 |
| Median Property Value | $177,500 | $238,700 |
| Median Household Income | $54,146 | $63,041 |
| Monthly Housing Costs | $413 | $17,210 |
| Real Estate Taxes | $1,241 | $15,296 |
Property Value by Mortgage Status in New Mexico
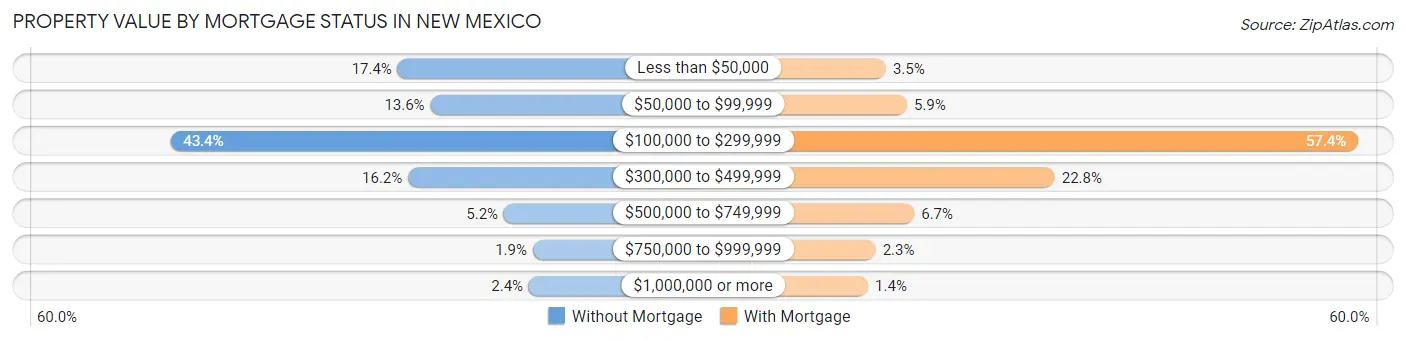
| Property Value | Without Mortgage | With Mortgage |
| Less than $50,000 | 45,897 (17.4%) | 10,235 (3.5%) |
| $50,000 to $99,999 | 35,993 (13.6%) | 17,271 (5.9%) |
| $100,000 to $299,999 | 114,570 (43.3%) | 168,740 (57.4%) |
| $300,000 to $499,999 | 42,750 (16.2%) | 66,900 (22.8%) |
| $500,000 to $749,999 | 13,807 (5.2%) | 19,717 (6.7%) |
| $750,000 to $999,999 | 5,066 (1.9%) | 6,780 (2.3%) |
| $1,000,000 or more | 6,226 (2.4%) | 4,227 (1.4%) |
| Total | 264,309 (100.0%) | 293,870 (100.0%) |
Household Income by Mortgage Status in New Mexico
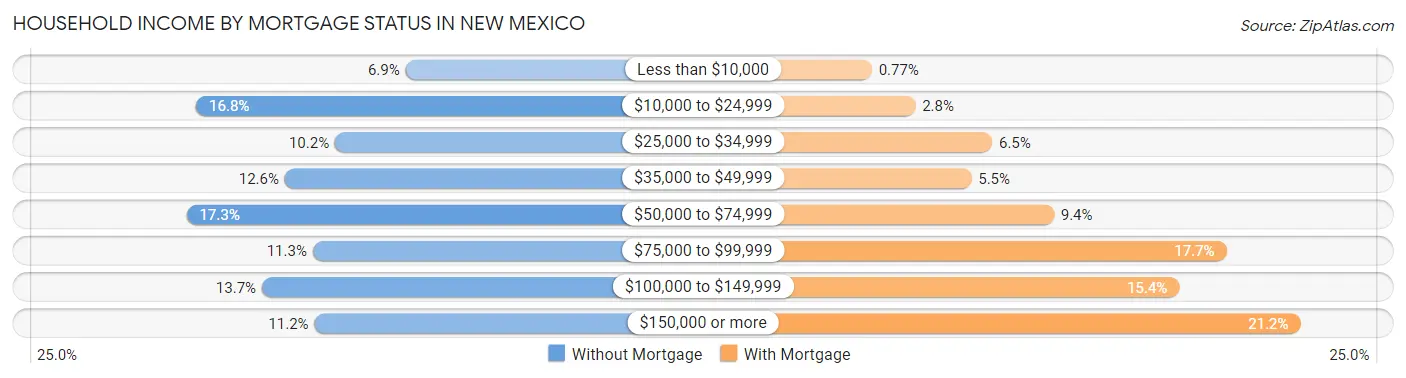
| Household Income | Without Mortgage | With Mortgage |
| Less than $10,000 | 18,144 (6.9%) | 2,253 (0.8%) |
| $10,000 to $24,999 | 44,475 (16.8%) | 8,359 (2.8%) |
| $25,000 to $34,999 | 27,007 (10.2%) | 19,103 (6.5%) |
| $35,000 to $49,999 | 33,336 (12.6%) | 16,191 (5.5%) |
| $50,000 to $74,999 | 45,699 (17.3%) | 27,755 (9.4%) |
| $75,000 to $99,999 | 29,827 (11.3%) | 51,895 (17.7%) |
| $100,000 to $149,999 | 36,220 (13.7%) | 45,271 (15.4%) |
| $150,000 or more | 29,601 (11.2%) | 62,255 (21.2%) |
| Total | 264,309 (100.0%) | 293,870 (100.0%) |
Property Value to Household Income Ratio in New Mexico
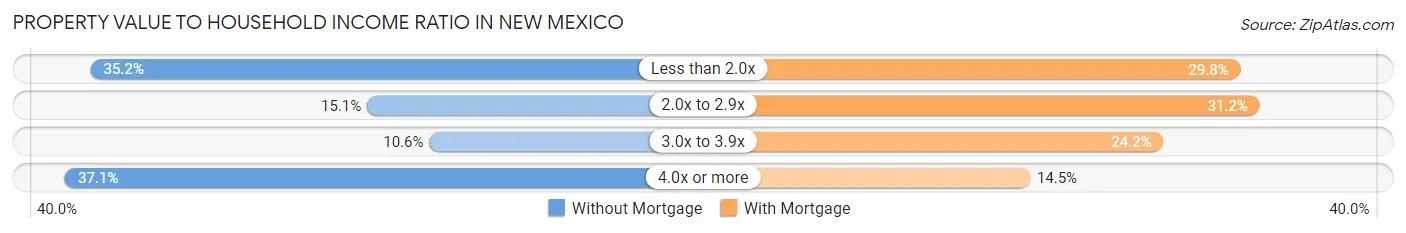
| Value-to-Income Ratio | Without Mortgage | With Mortgage |
| Less than 2.0x | 93,050 (35.2%) | 87,653 (29.8%) |
| 2.0x to 2.9x | 39,951 (15.1%) | 91,749 (31.2%) |
| 3.0x to 3.9x | 28,016 (10.6%) | 71,207 (24.2%) |
| 4.0x or more | 97,957 (37.1%) | 42,702 (14.5%) |
| Total | 264,309 (100.0%) | 293,870 (100.0%) |
Real Estate Taxes by Mortgage Status in New Mexico
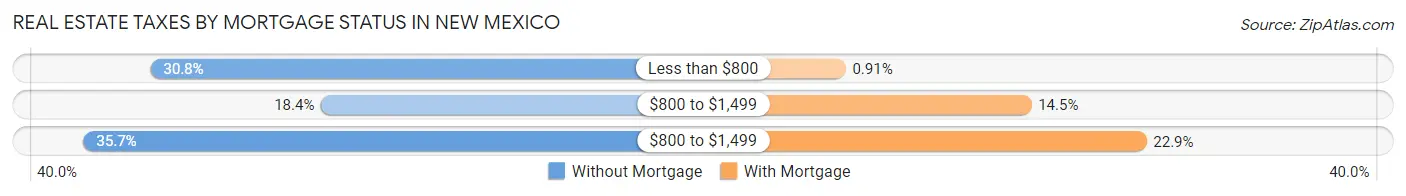
| Property Taxes | Without Mortgage | With Mortgage |
| Less than $800 | 81,431 (30.8%) | 2,684 (0.9%) |
| $800 to $1,499 | 48,629 (18.4%) | 42,543 (14.5%) |
| $800 to $1,499 | 94,366 (35.7%) | 67,275 (22.9%) |
| Total | 264,309 (100.0%) | 293,870 (100.0%) |
Health & Disability in New Mexico
Health Insurance Coverage by Age in New Mexico
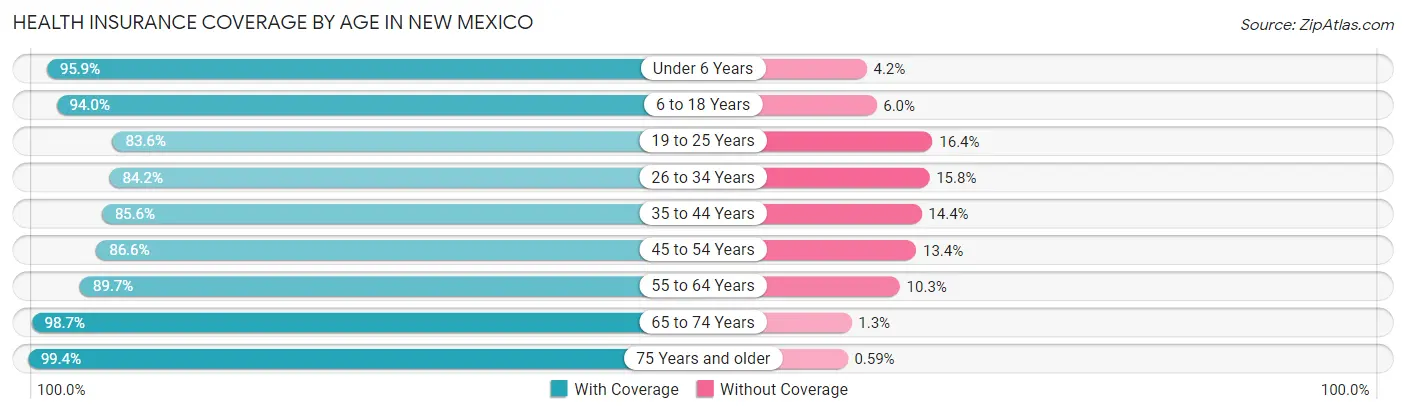
| Age Bracket | With Coverage | Without Coverage |
| Under 6 Years | 134,770 (95.9%) | 5,831 (4.2%) |
| 6 to 18 Years | 340,184 (94.0%) | 21,552 (6.0%) |
| 19 to 25 Years | 162,989 (83.6%) | 32,029 (16.4%) |
| 26 to 34 Years | 203,154 (84.2%) | 38,247 (15.8%) |
| 35 to 44 Years | 220,485 (85.6%) | 37,019 (14.4%) |
| 45 to 54 Years | 202,690 (86.6%) | 31,305 (13.4%) |
| 55 to 64 Years | 240,685 (89.7%) | 27,697 (10.3%) |
| 65 to 74 Years | 224,984 (98.7%) | 2,989 (1.3%) |
| 75 Years and older | 148,776 (99.4%) | 877 (0.6%) |
| Total | 1,878,717 (90.5%) | 197,546 (9.5%) |
Health Insurance Coverage by Citizenship Status in New Mexico
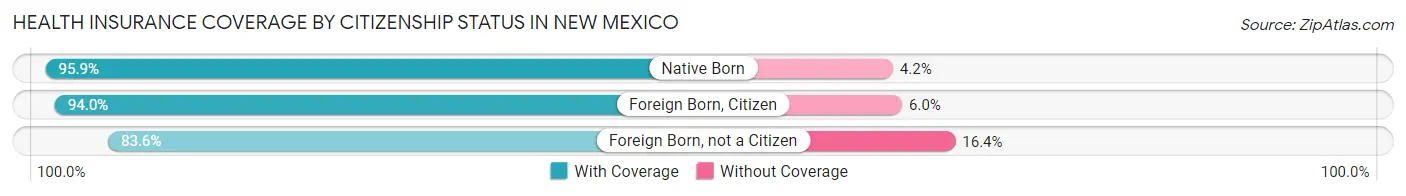
| Citizenship Status | With Coverage | Without Coverage |
| Native Born | 134,770 (95.9%) | 5,831 (4.2%) |
| Foreign Born, Citizen | 340,184 (94.0%) | 21,552 (6.0%) |
| Foreign Born, not a Citizen | 162,989 (83.6%) | 32,029 (16.4%) |
Health Insurance Coverage by Household Income in New Mexico
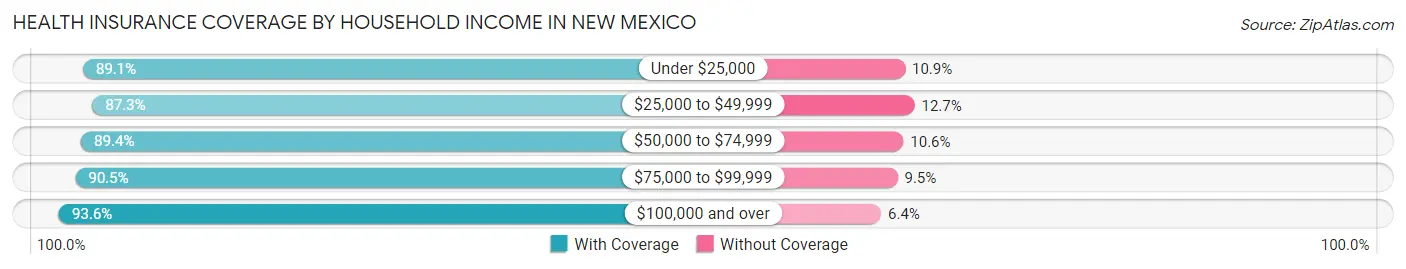
| Household Income | With Coverage | Without Coverage |
| Under $25,000 | 300,017 (89.1%) | 36,756 (10.9%) |
| $25,000 to $49,999 | 351,562 (87.3%) | 51,120 (12.7%) |
| $50,000 to $74,999 | 317,155 (89.4%) | 37,623 (10.6%) |
| $75,000 to $99,999 | 253,397 (90.5%) | 26,641 (9.5%) |
| $100,000 and over | 640,216 (93.6%) | 43,986 (6.4%) |
Public vs Private Health Insurance Coverage by Age in New Mexico
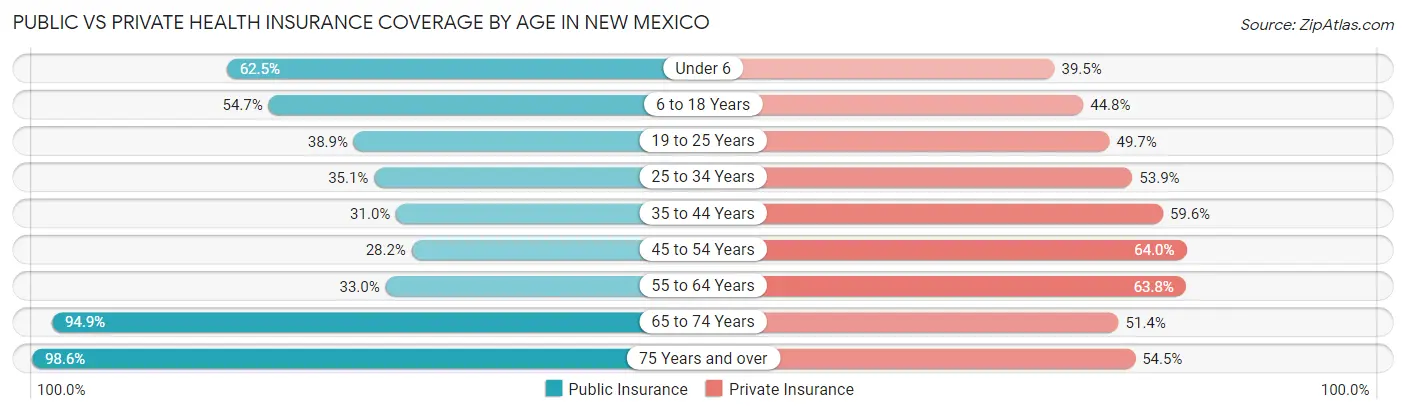
| Age Bracket | Public Insurance | Private Insurance |
| Under 6 | 87,846 (62.5%) | 55,523 (39.5%) |
| 6 to 18 Years | 197,959 (54.7%) | 162,156 (44.8%) |
| 19 to 25 Years | 75,840 (38.9%) | 96,931 (49.7%) |
| 25 to 34 Years | 84,757 (35.1%) | 130,213 (53.9%) |
| 35 to 44 Years | 79,900 (31.0%) | 153,488 (59.6%) |
| 45 to 54 Years | 65,868 (28.1%) | 149,643 (63.9%) |
| 55 to 64 Years | 88,606 (33.0%) | 171,317 (63.8%) |
| 65 to 74 Years | 216,398 (94.9%) | 117,142 (51.4%) |
| 75 Years and over | 147,596 (98.6%) | 81,507 (54.5%) |
| Total | 1,044,770 (50.3%) | 1,117,920 (53.8%) |
Disability Status by Sex by Age in New Mexico
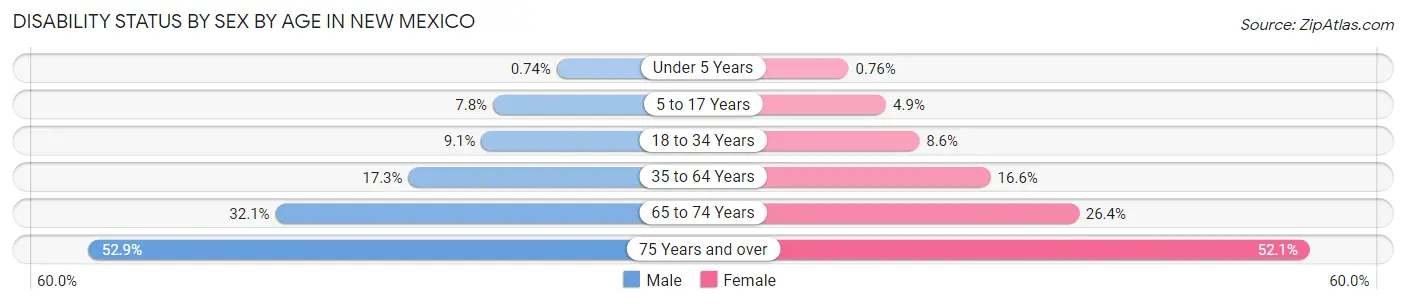
| Age Bracket | Male | Female |
| Under 5 Years | 437 (0.7%) | 428 (0.8%) |
| 5 to 17 Years | 14,283 (7.8%) | 8,645 (4.9%) |
| 18 to 34 Years | 21,441 (9.1%) | 19,944 (8.6%) |
| 35 to 64 Years | 64,566 (17.3%) | 63,989 (16.6%) |
| 65 to 74 Years | 34,699 (32.1%) | 31,605 (26.4%) |
| 75 Years and over | 34,589 (52.8%) | 43,886 (52.1%) |
Disability Class by Sex by Age in New Mexico
Disability Class: Hearing Difficulty
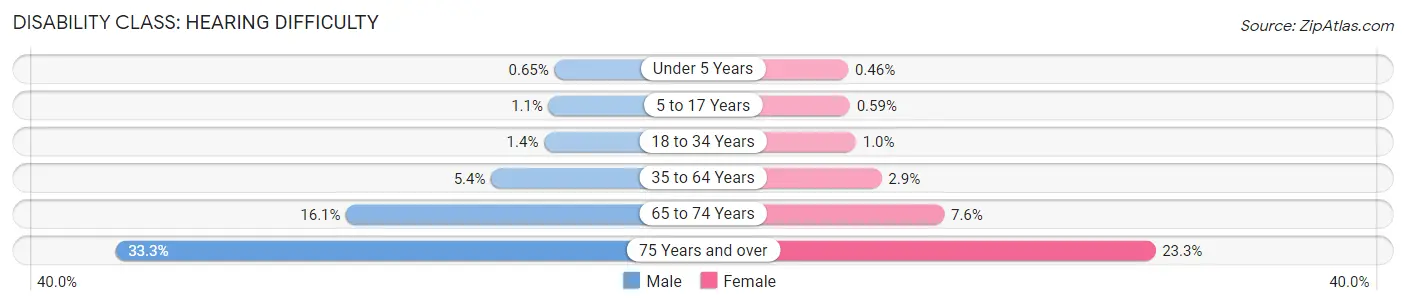
| Age Bracket | Male | Female |
| Under 5 Years | 385 (0.6%) | 261 (0.5%) |
| 5 to 17 Years | 1,960 (1.1%) | 1,036 (0.6%) |
| 18 to 34 Years | 3,336 (1.4%) | 2,394 (1.0%) |
| 35 to 64 Years | 20,009 (5.3%) | 11,332 (2.9%) |
| 65 to 74 Years | 17,429 (16.1%) | 9,090 (7.6%) |
| 75 Years and over | 21,777 (33.3%) | 19,598 (23.3%) |
Disability Class: Vision Difficulty
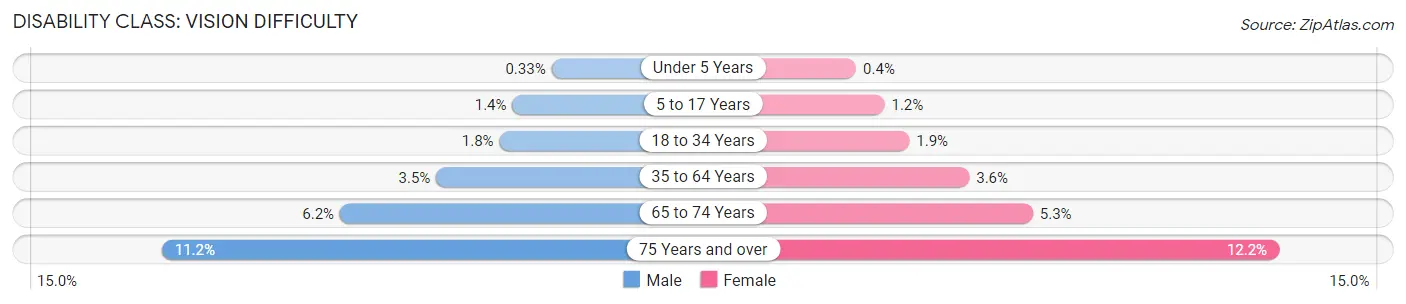
| Age Bracket | Male | Female |
| Under 5 Years | 194 (0.3%) | 225 (0.4%) |
| 5 to 17 Years | 2,591 (1.4%) | 2,085 (1.2%) |
| 18 to 34 Years | 4,186 (1.8%) | 4,336 (1.9%) |
| 35 to 64 Years | 13,238 (3.5%) | 13,702 (3.5%) |
| 65 to 74 Years | 6,727 (6.2%) | 6,369 (5.3%) |
| 75 Years and over | 7,320 (11.2%) | 10,251 (12.2%) |
Disability Class: Cognitive Difficulty
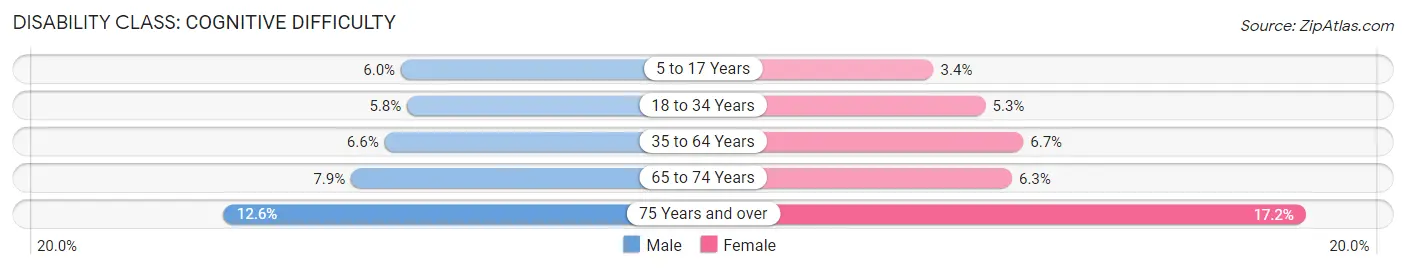
| Age Bracket | Male | Female |
| 5 to 17 Years | 10,985 (6.0%) | 5,964 (3.4%) |
| 18 to 34 Years | 13,633 (5.8%) | 12,342 (5.3%) |
| 35 to 64 Years | 24,846 (6.6%) | 26,009 (6.7%) |
| 65 to 74 Years | 8,531 (7.9%) | 7,567 (6.3%) |
| 75 Years and over | 8,245 (12.6%) | 14,497 (17.2%) |
Disability Class: Ambulatory Difficulty
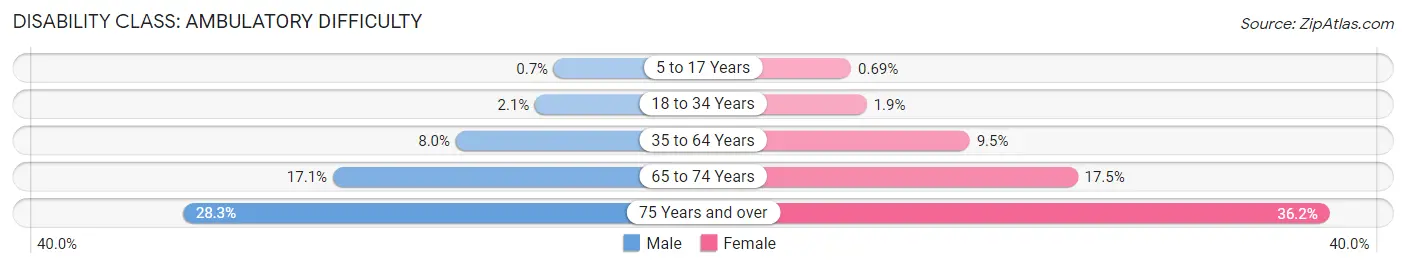
| Age Bracket | Male | Female |
| 5 to 17 Years | 1,274 (0.7%) | 1,208 (0.7%) |
| 18 to 34 Years | 4,911 (2.1%) | 4,268 (1.8%) |
| 35 to 64 Years | 29,860 (8.0%) | 36,648 (9.5%) |
| 65 to 74 Years | 18,514 (17.1%) | 20,956 (17.5%) |
| 75 Years and over | 18,492 (28.2%) | 30,488 (36.2%) |
Disability Class: Self-Care Difficulty
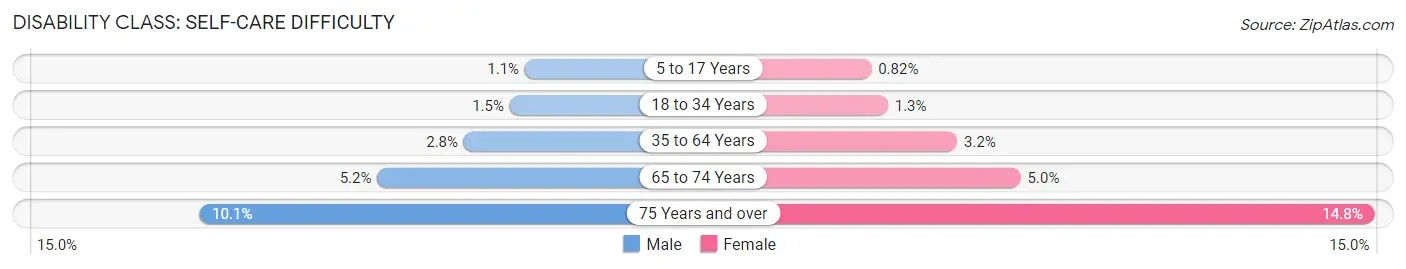
| Age Bracket | Male | Female |
| 5 to 17 Years | 1,954 (1.1%) | 1,439 (0.8%) |
| 18 to 34 Years | 3,489 (1.5%) | 2,959 (1.3%) |
| 35 to 64 Years | 10,351 (2.8%) | 12,377 (3.2%) |
| 65 to 74 Years | 5,602 (5.2%) | 5,968 (5.0%) |
| 75 Years and over | 6,634 (10.1%) | 12,485 (14.8%) |
Technology Access in New Mexico
Computing Device Access in New Mexico
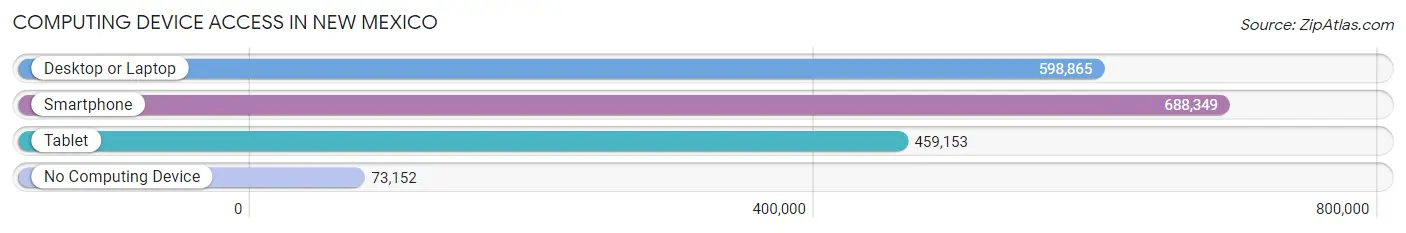
| Device Type | # Households | % Households |
| Desktop or Laptop | 598,865 | 73.7% |
| Smartphone | 688,349 | 84.7% |
| Tablet | 459,153 | 56.5% |
| No Computing Device | 73,152 | 9.0% |
| Total | 812,852 | 100.0% |
Internet Access in New Mexico
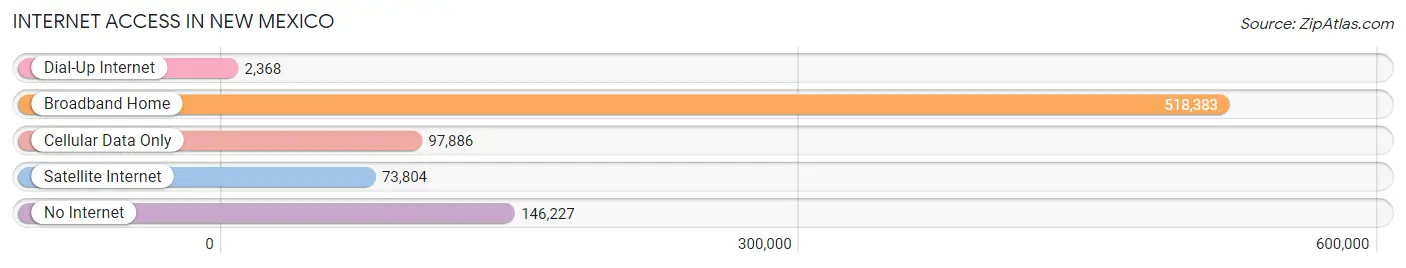
| Internet Type | # Households | % Households |
| Dial-Up Internet | 2,368 | 0.3% |
| Broadband Home | 518,383 | 63.8% |
| Cellular Data Only | 97,886 | 12.0% |
| Satellite Internet | 73,804 | 9.1% |
| No Internet | 146,227 | 18.0% |
| Total | 812,852 | 100.0% |
New Mexico Summary
New Mexico is a state located in the southwestern region of the United States. It is the fifth-largest state in the country and the 36th most populous. It is bordered by Arizona to the west, Colorado to the north, Oklahoma to the northeast, and Texas to the east. The state has a diverse geography, ranging from the high plains of the Rio Grande Valley to the rugged Rocky Mountains in the north.
History
The area that is now New Mexico has been inhabited by various Native American tribes for thousands of years. The first Europeans to explore the region were Spanish conquistadors in the 16th century. The area was claimed by Spain in 1598 and became part of Mexico after the Mexican War of Independence in 1821. The United States acquired the area in 1848 as part of the Treaty of Guadalupe Hidalgo, which ended the Mexican-American War. New Mexico became the 47th state in the Union in 1912.
Geography
New Mexico is located in the southwestern region of the United States. It is bordered by Arizona to the west, Colorado to the north, Oklahoma to the northeast, and Texas to the east. The state has a total area of 121,590 square miles, making it the fifth-largest state in the country.
The state has a diverse geography, ranging from the high plains of the Rio Grande Valley in the south to the rugged Rocky Mountains in the north. The highest point in the state is Wheeler Peak, which rises to an elevation of 13,161 feet. The Rio Grande, which forms the border between New Mexico and Mexico, is the longest river in the state.
Economy
New Mexico’s economy is largely based on the extraction and processing of natural resources, such as oil, natural gas, and minerals. The state is also a major producer of agricultural products, such as cattle, dairy, and chile peppers. Tourism is also an important part of the economy, with visitors drawn to the state’s many national parks and monuments.
The state’s largest employers are the federal government, the University of New Mexico, and the state government. The state’s largest private employers are Intel, Presbyterian Healthcare Services, and Sandia National Laboratories.
Demographics
As of 2019, the population of New Mexico was estimated to be 2,095,428. The state has a population density of 17.3 people per square mile, making it the 36th most populous state in the country.
The largest ethnic group in the state is Hispanic or Latino, making up 47.7% of the population. The second-largest ethnic group is White, making up 40.3% of the population. Other ethnic groups include Native American (9.2%), African American (2.2%), and Asian (1.2%).
The median household income in New Mexico is $48,945, and the median age is 37. The state’s poverty rate is 19.2%, which is higher than the national average. The state’s unemployment rate is 4.7%, which is lower than the national average.
Common Questions
When was New Mexico Incorporated?
New Mexico was Incorporated into the Union on Jan 6, 1912.
What is the Total Area of New Mexico?
Total Area of New Mexico is 121,590 Square Miles.
What is the Total Land Area of New Mexico?
Total Land Area of New Mexico is 121,297 Square Miles.
What is the Total Water Area of New Mexico?
Total Water Area of New Mexico is 293 Square Miles.
What is the Average Elevation in New Mexico?
Average Elevation in New Mexico is 5,700 Feet.
What is the Highest Elevation in New Mexico?
Highest Elevation in New Mexico is 13,161 Feet.
What is the Lowest Elevation in New Mexico?
Lowest Elevation in New Mexico is 2842 Feet.
What is the Population Density in New Mexico?
Population Density in New Mexico is 17.4 People per Square Mile.
What is Per Capita Income in New Mexico?
Per Capita income in New Mexico is $32,667.
What is the Median Family Income in New Mexico?
Median Family Income in New Mexico is $72,422.
What is the Median Household income in New Mexico?
Median Household Income in New Mexico is $58,722.
What is Income or Wage Gap in New Mexico?
Income or Wage Gap in New Mexico is 25.7%.
Women in New Mexico earn 74.3 cents for every dollar earned by a man.
What is Family Income Deficit in New Mexico?
Family Income Deficit in New Mexico is $11,080.
Families that are below poverty line in New Mexico earn $11,080 less on average than the poverty threshold level.
What is Inequality or Gini Index in New Mexico?
Inequality or Gini Index in New Mexico is 0.48.
What is the Total Population of New Mexico?
Total Population of New Mexico is 2,112,463.
What is the Total Male Population of New Mexico?
Total Male Population of New Mexico is 1,052,858.
What is the Total Female Population of New Mexico?
Total Female Population of New Mexico is 1,059,605.
What is the Ratio of Males per 100 Females in New Mexico?
There are 99.36 Males per 100 Females in New Mexico.
What is the Ratio of Females per 100 Males in New Mexico?
There are 100.64 Females per 100 Males in New Mexico.
What is the Median Population Age in New Mexico?
Median Population Age in New Mexico is 38.6 Years.
What is the Average Family Size in New Mexico
Average Family Size in New Mexico is 3.2 People.
What is the Average Household Size in New Mexico
Average Household Size in New Mexico is 2.5 People.
How Large is the Labor Force in New Mexico?
There are 977,087 People in the Labor Forcein in New Mexico.
What is the Percentage of People in the Labor Force in New Mexico?
57.6% of People are in the Labor Force in New Mexico.
What is the Unemployment Rate in New Mexico?
Unemployment Rate in New Mexico is 6.2%.