Lake Isabella, CA Map & Demographics
Lake Isabella Map
Lake Isabella Overview
$17,569
PER CAPITA INCOME
$27,360
AVG FAMILY INCOME
$27,116
AVG HOUSEHOLD INCOME
46.1%
WAGE / INCOME GAP [ % ]
53.9¢/ $1
WAGE / INCOME GAP [ $ ]
0.42
INEQUALITY / GINI INDEX
3,514
TOTAL POPULATION
1,736
MALE POPULATION
1,778
FEMALE POPULATION
97.64
MALES / 100 FEMALES
102.42
FEMALES / 100 MALES
40.5
MEDIAN AGE
2.9
AVG FAMILY SIZE
2.3
AVG HOUSEHOLD SIZE
929
LABOR FORCE [ PEOPLE ]
37.1%
PERCENT IN LABOR FORCE
10.0%
UNEMPLOYMENT RATE
Lake Isabella Zip Codes
Lake Isabella Area Codes
Income in Lake Isabella
Income Overview in Lake Isabella
Per Capita Income in Lake Isabella is $17,569, while median incomes of families and households are $27,360 and $27,116 respectively.
| Characteristic | Number | Measure |
| Per Capita Income | 3,514 | $17,569 |
| Median Family Income | 868 | $27,360 |
| Mean Family Income | 868 | $38,813 |
| Median Household Income | 1,537 | $27,116 |
| Mean Household Income | 1,537 | $39,208 |
| Income Deficit | 868 | $0 |
| Wage / Income Gap (%) | 3,514 | 46.13% |
| Wage / Income Gap ($) | 3,514 | 53.87¢ per $1 |
| Gini / Inequality Index | 3,514 | 0.42 |
Earnings by Sex in Lake Isabella
Average Earnings in Lake Isabella are $28,150, $48,065 for men and $25,895 for women, a difference of 46.1%.
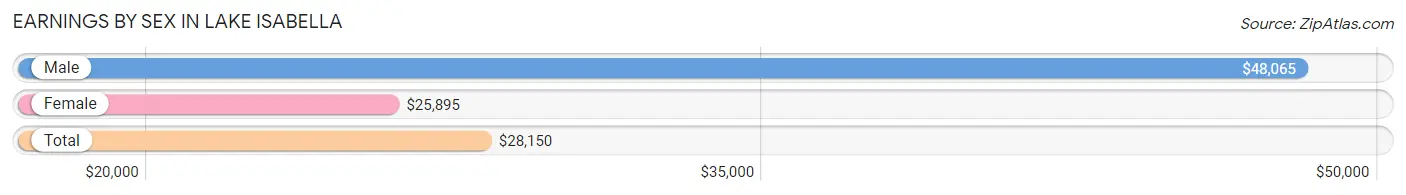
| Sex | Number | Average Earnings |
| Male | 430 (45.0%) | $48,065 |
| Female | 525 (55.0%) | $25,895 |
| Total | 955 (100.0%) | $28,150 |
Earnings by Sex by Income Bracket in Lake Isabella
The most common earnings brackets in Lake Isabella are $75,000 to $99,999 for men (89 | 20.7%) and $25,000 to $29,999 for women (169 | 32.2%).
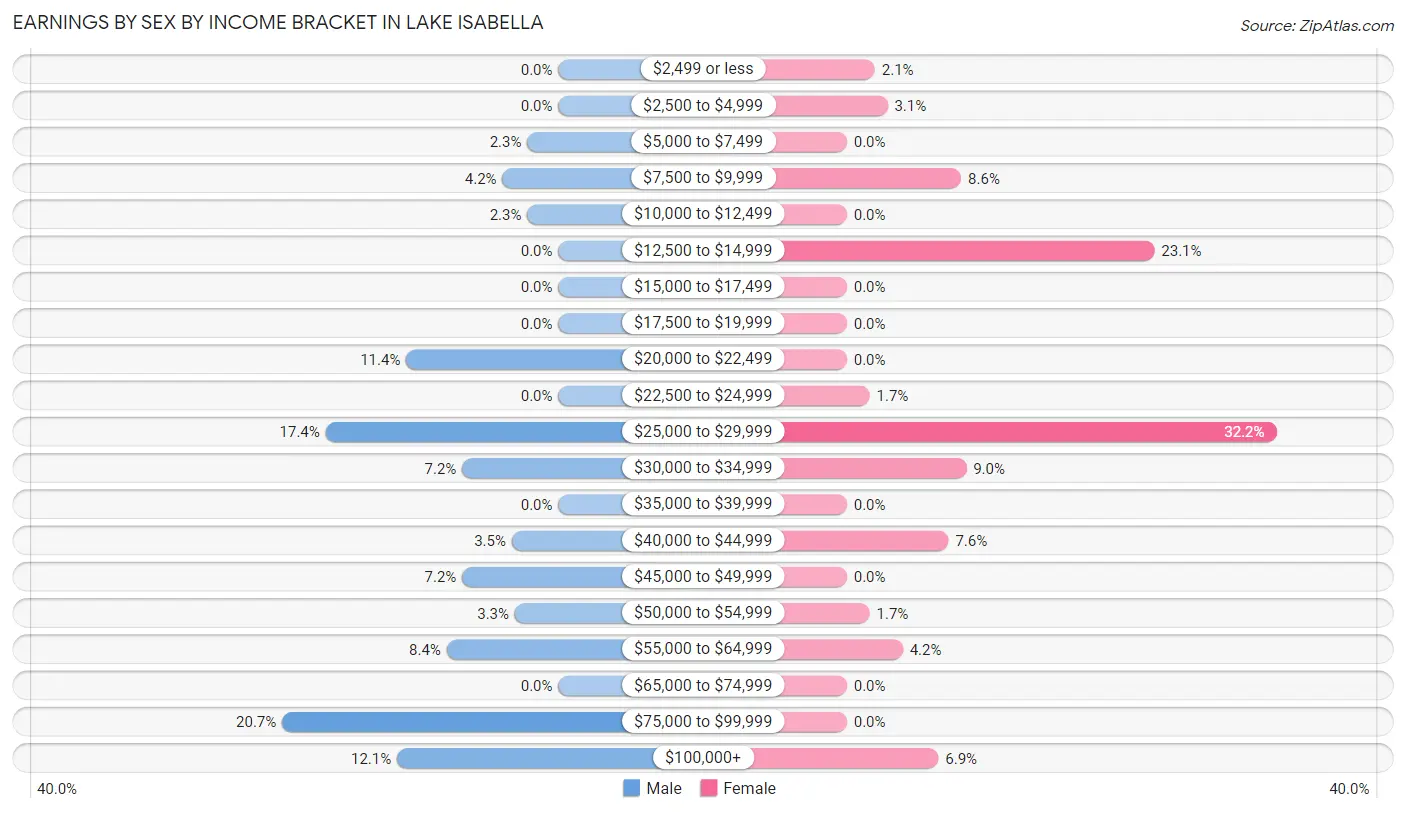
| Income | Male | Female |
| $2,499 or less | 0 (0.0%) | 11 (2.1%) |
| $2,500 to $4,999 | 0 (0.0%) | 16 (3.0%) |
| $5,000 to $7,499 | 10 (2.3%) | 0 (0.0%) |
| $7,500 to $9,999 | 18 (4.2%) | 45 (8.6%) |
| $10,000 to $12,499 | 10 (2.3%) | 0 (0.0%) |
| $12,500 to $14,999 | 0 (0.0%) | 121 (23.1%) |
| $15,000 to $17,499 | 0 (0.0%) | 0 (0.0%) |
| $17,500 to $19,999 | 0 (0.0%) | 0 (0.0%) |
| $20,000 to $22,499 | 49 (11.4%) | 0 (0.0%) |
| $22,500 to $24,999 | 0 (0.0%) | 9 (1.7%) |
| $25,000 to $29,999 | 75 (17.4%) | 169 (32.2%) |
| $30,000 to $34,999 | 31 (7.2%) | 47 (8.9%) |
| $35,000 to $39,999 | 0 (0.0%) | 0 (0.0%) |
| $40,000 to $44,999 | 15 (3.5%) | 40 (7.6%) |
| $45,000 to $49,999 | 31 (7.2%) | 0 (0.0%) |
| $50,000 to $54,999 | 14 (3.3%) | 9 (1.7%) |
| $55,000 to $64,999 | 36 (8.4%) | 22 (4.2%) |
| $65,000 to $74,999 | 0 (0.0%) | 0 (0.0%) |
| $75,000 to $99,999 | 89 (20.7%) | 0 (0.0%) |
| $100,000+ | 52 (12.1%) | 36 (6.9%) |
| Total | 430 (100.0%) | 525 (100.0%) |
Earnings by Sex by Educational Attainment in Lake Isabella
Average earnings in Lake Isabella are $48,790 for men and $25,806 for women, a difference of 47.1%. Men with an educational attainment of college or associate's degree enjoy the highest average annual earnings of $76,845, while those with high school diploma education earn the least with $37,500. Women with an educational attainment of college or associate's degree earn the most with the average annual earnings of $26,605, while those with high school diploma education have the smallest earnings of $13,834.
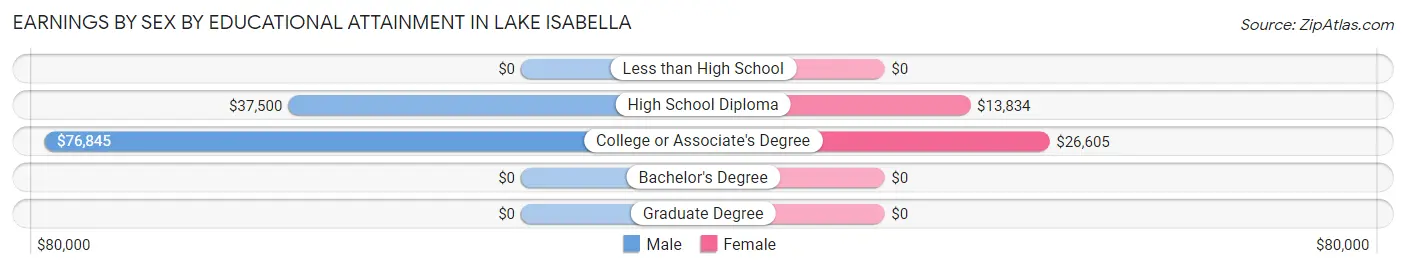
| Educational Attainment | Male Income | Female Income |
| Less than High School | - | - |
| High School Diploma | $37,500 | $13,834 |
| College or Associate's Degree | $76,845 | $26,605 |
| Bachelor's Degree | - | - |
| Graduate Degree | - | - |
| Total | $48,790 | $25,806 |
Family Income in Lake Isabella
Family Income Brackets in Lake Isabella
According to the Lake Isabella family income data, there are 333 families falling into the $25,000 to $34,999 income range, which is the most common income bracket and makes up 38.4% of all families.
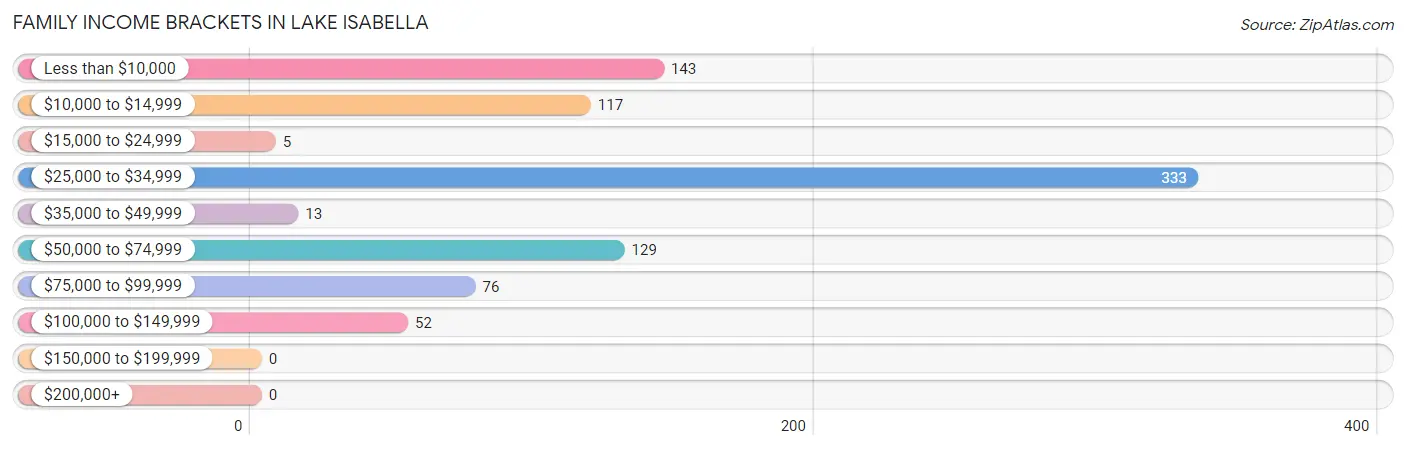
| Income Bracket | # Families | % Families |
| Less than $10,000 | 143 | 16.5% |
| $10,000 to $14,999 | 117 | 13.5% |
| $15,000 to $24,999 | 5 | 0.6% |
| $25,000 to $34,999 | 333 | 38.4% |
| $35,000 to $49,999 | 13 | 1.5% |
| $50,000 to $74,999 | 129 | 14.9% |
| $75,000 to $99,999 | 76 | 8.8% |
| $100,000 to $149,999 | 52 | 6.0% |
| $150,000 to $199,999 | 0 | 0.0% |
| $200,000+ | 0 | 0.0% |
Family Income by Famaliy Size in Lake Isabella
2-person families (474 | 54.6%) account for the highest median family income in Lake Isabella with $30,000 per family, while 2-person families (474 | 54.6%) have the highest median income of $15,000 per family member.
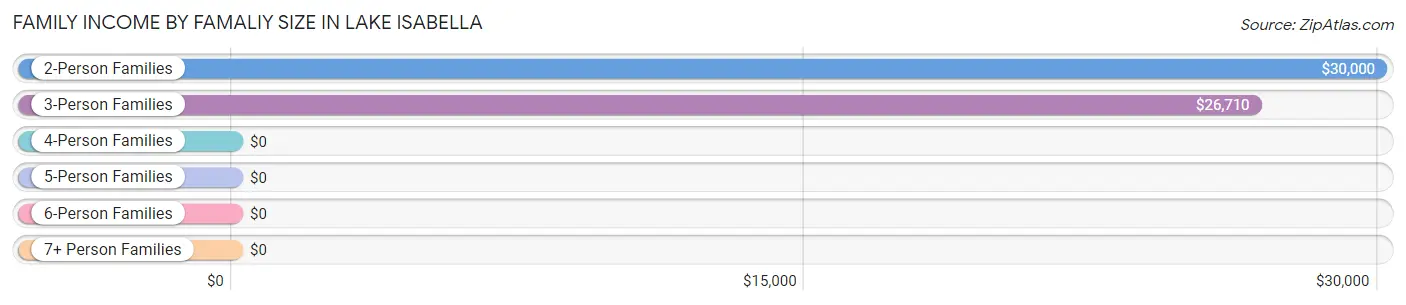
| Income Bracket | # Families | Median Income |
| 2-Person Families | 474 (54.6%) | $30,000 |
| 3-Person Families | 212 (24.4%) | $26,710 |
| 4-Person Families | 71 (8.2%) | $0 |
| 5-Person Families | 29 (3.3%) | $0 |
| 6-Person Families | 82 (9.5%) | $0 |
| 7+ Person Families | 0 (0.0%) | $0 |
| Total | 868 (100.0%) | $27,360 |
Family Income by Number of Earners in Lake Isabella
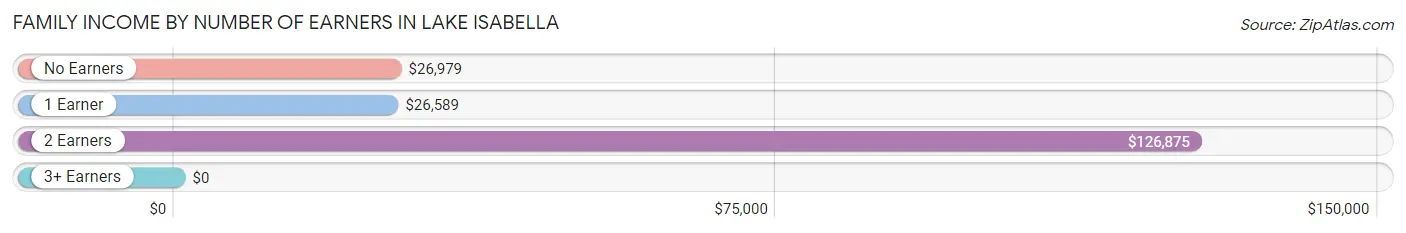
| Number of Earners | # Families | Median Income |
| No Earners | 314 (36.2%) | $26,979 |
| 1 Earner | 451 (52.0%) | $26,589 |
| 2 Earners | 89 (10.2%) | $126,875 |
| 3+ Earners | 14 (1.6%) | $0 |
| Total | 868 (100.0%) | $27,360 |
Household Income in Lake Isabella
Household Income Brackets in Lake Isabella
With 427 households falling in the category, the $25,000 to $34,999 income range is the most frequent in Lake Isabella, accounting for 27.8% of all households.
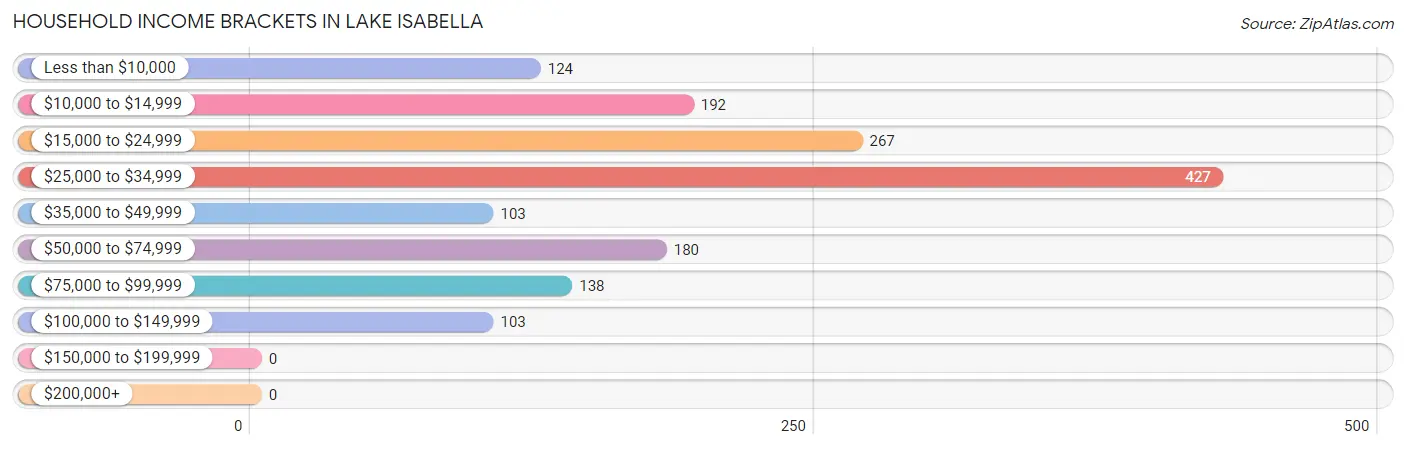
| Income Bracket | # Households | % Households |
| Less than $10,000 | 124 | 8.1% |
| $10,000 to $14,999 | 192 | 12.5% |
| $15,000 to $24,999 | 267 | 17.4% |
| $25,000 to $34,999 | 427 | 27.8% |
| $35,000 to $49,999 | 103 | 6.7% |
| $50,000 to $74,999 | 180 | 11.7% |
| $75,000 to $99,999 | 138 | 9.0% |
| $100,000 to $149,999 | 103 | 6.7% |
| $150,000 to $199,999 | 0 | 0.0% |
| $200,000+ | 0 | 0.0% |
Household Income by Householder Age in Lake Isabella
The median household income in Lake Isabella is $27,116, with the highest median household income of $33,103 found in the 65+ years age bracket for the primary householder. A total of 552 households (35.9%) fall into this category.
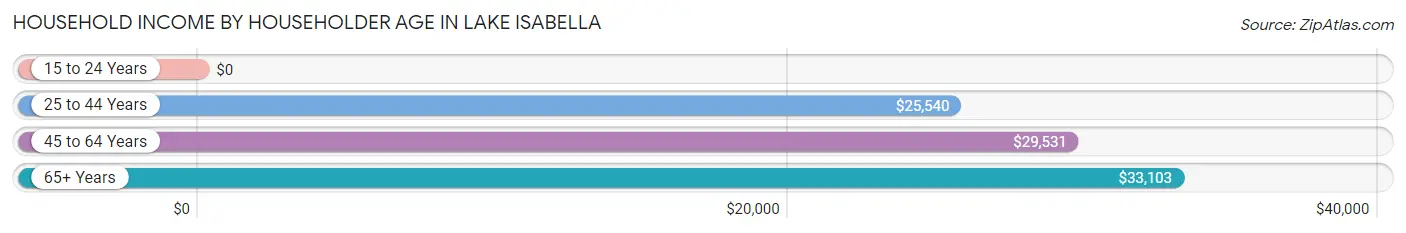
| Income Bracket | # Households | Median Income |
| 15 to 24 Years | 0 (0.0%) | $0 |
| 25 to 44 Years | 451 (29.3%) | $25,540 |
| 45 to 64 Years | 534 (34.7%) | $29,531 |
| 65+ Years | 552 (35.9%) | $33,103 |
| Total | 1,537 (100.0%) | $27,116 |
Poverty in Lake Isabella
Income Below Poverty by Sex and Age in Lake Isabella
With 35.4% poverty level for males and 37.4% for females among the residents of Lake Isabella, 15 year old males and under 5 year old females are the most vulnerable to poverty, with 57 males (100.0%) and 105 females (100.0%) in their respective age groups living below the poverty level.
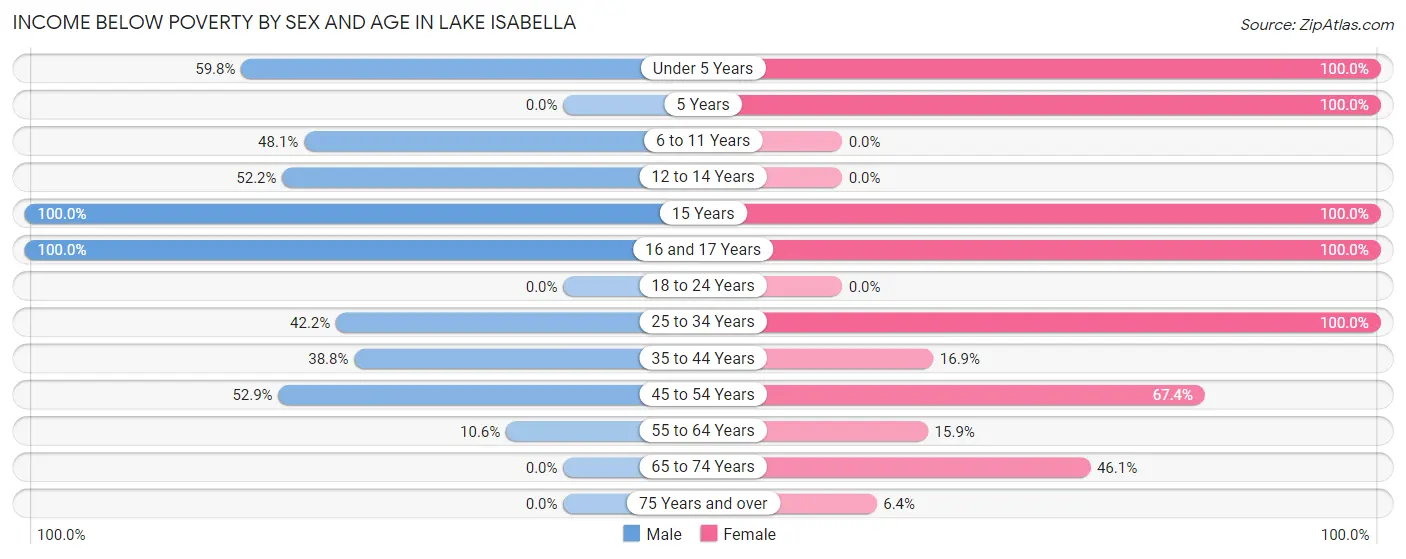
| Age Bracket | Male | Female |
| Under 5 Years | 55 (59.8%) | 105 (100.0%) |
| 5 Years | 0 (0.0%) | 19 (100.0%) |
| 6 to 11 Years | 51 (48.1%) | 0 (0.0%) |
| 12 to 14 Years | 170 (52.1%) | 0 (0.0%) |
| 15 Years | 57 (100.0%) | 9 (100.0%) |
| 16 and 17 Years | 57 (100.0%) | 13 (100.0%) |
| 18 to 24 Years | 0 (0.0%) | 0 (0.0%) |
| 25 to 34 Years | 62 (42.2%) | 200 (100.0%) |
| 35 to 44 Years | 26 (38.8%) | 48 (16.9%) |
| 45 to 54 Years | 101 (52.9%) | 126 (67.4%) |
| 55 to 64 Years | 36 (10.6%) | 44 (15.9%) |
| 65 to 74 Years | 0 (0.0%) | 82 (46.1%) |
| 75 Years and over | 0 (0.0%) | 13 (6.4%) |
| Total | 615 (35.4%) | 659 (37.4%) |
Income Above Poverty by Sex and Age in Lake Isabella
According to the poverty statistics in Lake Isabella, males aged 5 years and females aged 6 to 11 years are the age groups that are most secure financially, with 100.0% of males and 100.0% of females in these age groups living above the poverty line.
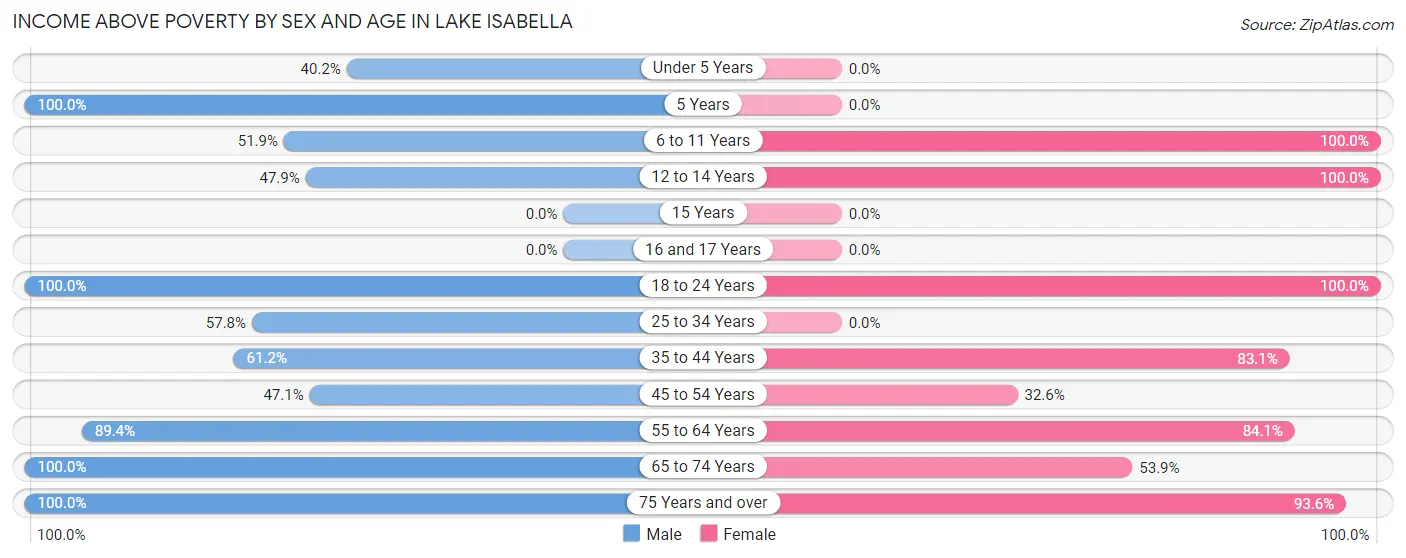
| Age Bracket | Male | Female |
| Under 5 Years | 37 (40.2%) | 0 (0.0%) |
| 5 Years | 19 (100.0%) | 0 (0.0%) |
| 6 to 11 Years | 55 (51.9%) | 6 (100.0%) |
| 12 to 14 Years | 156 (47.8%) | 253 (100.0%) |
| 15 Years | 0 (0.0%) | 0 (0.0%) |
| 16 and 17 Years | 0 (0.0%) | 0 (0.0%) |
| 18 to 24 Years | 18 (100.0%) | 28 (100.0%) |
| 25 to 34 Years | 85 (57.8%) | 0 (0.0%) |
| 35 to 44 Years | 41 (61.2%) | 236 (83.1%) |
| 45 to 54 Years | 90 (47.1%) | 61 (32.6%) |
| 55 to 64 Years | 303 (89.4%) | 232 (84.1%) |
| 65 to 74 Years | 170 (100.0%) | 96 (53.9%) |
| 75 Years and over | 147 (100.0%) | 190 (93.6%) |
| Total | 1,121 (64.6%) | 1,102 (62.6%) |
Income Below Poverty Among Married-Couple Families in Lake Isabella
The poverty statistics for married-couple families in Lake Isabella show that 17.8% or 71 of the total 398 families live below the poverty line. Families with 1 or 2 children have the highest poverty rate of 100.0%, comprising of 11 families. On the other hand, families with no children have the lowest poverty rate of 11.3%, which includes 38 families.
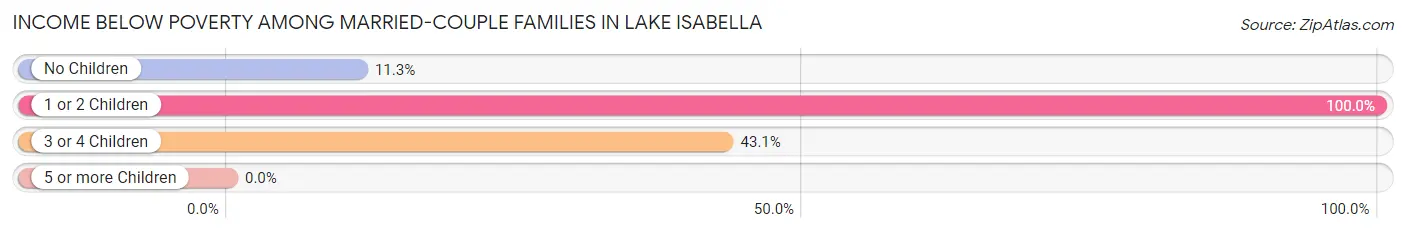
| Children | Above Poverty | Below Poverty |
| No Children | 298 (88.7%) | 38 (11.3%) |
| 1 or 2 Children | 0 (0.0%) | 11 (100.0%) |
| 3 or 4 Children | 29 (56.9%) | 22 (43.1%) |
| 5 or more Children | 0 (0.0%) | 0 (0.0%) |
| Total | 327 (82.2%) | 71 (17.8%) |
Income Below Poverty Among Single-Parent Households in Lake Isabella
According to the poverty data in Lake Isabella, 11.4% or 10 single-father households and 55.5% or 212 single-mother households are living below the poverty line. Among single-father households, those with 1 or 2 children have the highest poverty rate, with 10 households (23.8%) experiencing poverty. Likewise, among single-mother households, those with 3 or 4 children have the highest poverty rate, with 45 households (100.0%) falling below the poverty line.
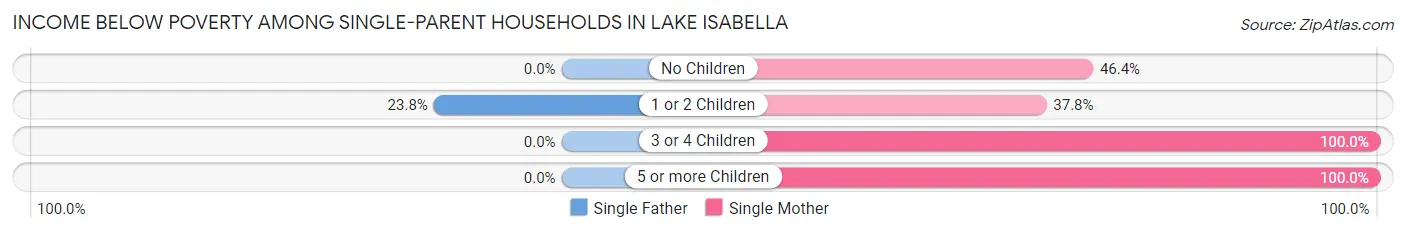
| Children | Single Father | Single Mother |
| No Children | 0 (0.0%) | 13 (46.4%) |
| 1 or 2 Children | 10 (23.8%) | 94 (37.8%) |
| 3 or 4 Children | 0 (0.0%) | 45 (100.0%) |
| 5 or more Children | 0 (0.0%) | 60 (100.0%) |
| Total | 10 (11.4%) | 212 (55.5%) |
Income Below Poverty Among Married-Couple vs Single-Parent Households in Lake Isabella
The poverty data for Lake Isabella shows that 71 of the married-couple family households (17.8%) and 222 of the single-parent households (47.2%) are living below the poverty level. Within the married-couple family households, those with 1 or 2 children have the highest poverty rate, with 11 households (100.0%) falling below the poverty line. Among the single-parent households, those with 3 or 4 children have the highest poverty rate, with 45 household (100.0%) living below poverty.
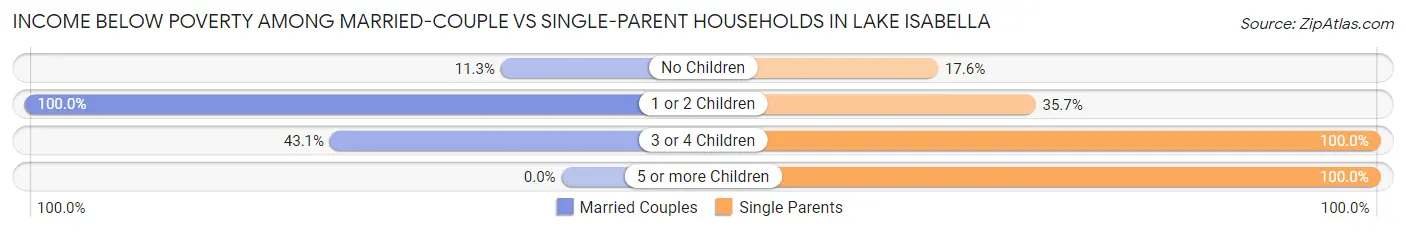
| Children | Married-Couple Families | Single-Parent Households |
| No Children | 38 (11.3%) | 13 (17.6%) |
| 1 or 2 Children | 11 (100.0%) | 104 (35.7%) |
| 3 or 4 Children | 22 (43.1%) | 45 (100.0%) |
| 5 or more Children | 0 (0.0%) | 60 (100.0%) |
| Total | 71 (17.8%) | 222 (47.2%) |
Race in Lake Isabella
The most populous races in Lake Isabella are White / Caucasian (2,688 | 76.5%), Hispanic or Latino (671 | 19.1%), and Some other Race (444 | 12.6%).
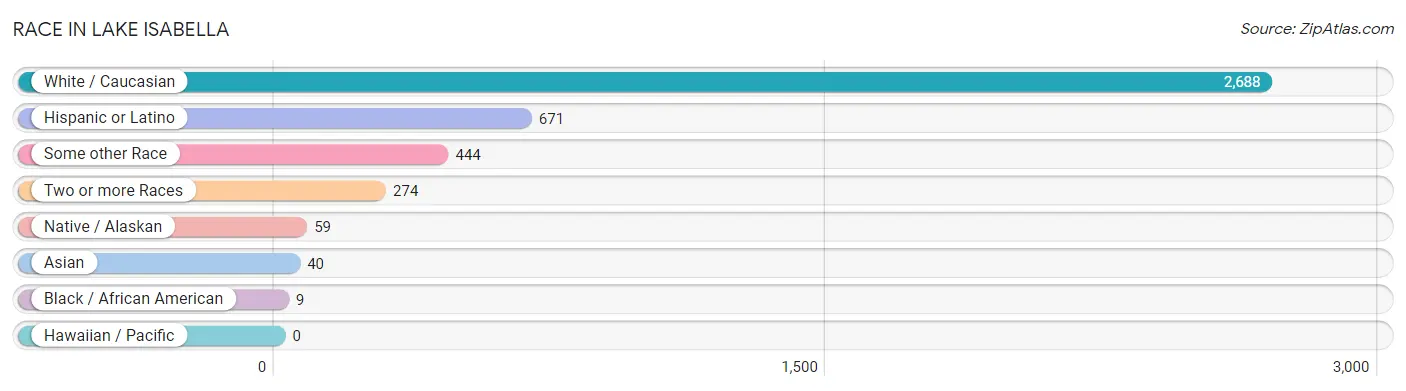
| Race | # Population | % Population |
| Asian | 40 | 1.1% |
| Black / African American | 9 | 0.3% |
| Hawaiian / Pacific | 0 | 0.0% |
| Hispanic or Latino | 671 | 19.1% |
| Native / Alaskan | 59 | 1.7% |
| White / Caucasian | 2,688 | 76.5% |
| Two or more Races | 274 | 7.8% |
| Some other Race | 444 | 12.6% |
| Total | 3,514 | 100.0% |
Ancestry in Lake Isabella
The most populous ancestries reported in Lake Isabella are American (660 | 18.8%), Mexican (553 | 15.7%), German (486 | 13.8%), English (382 | 10.9%), and Irish (382 | 10.9%), together accounting for 70.1% of all Lake Isabella residents.
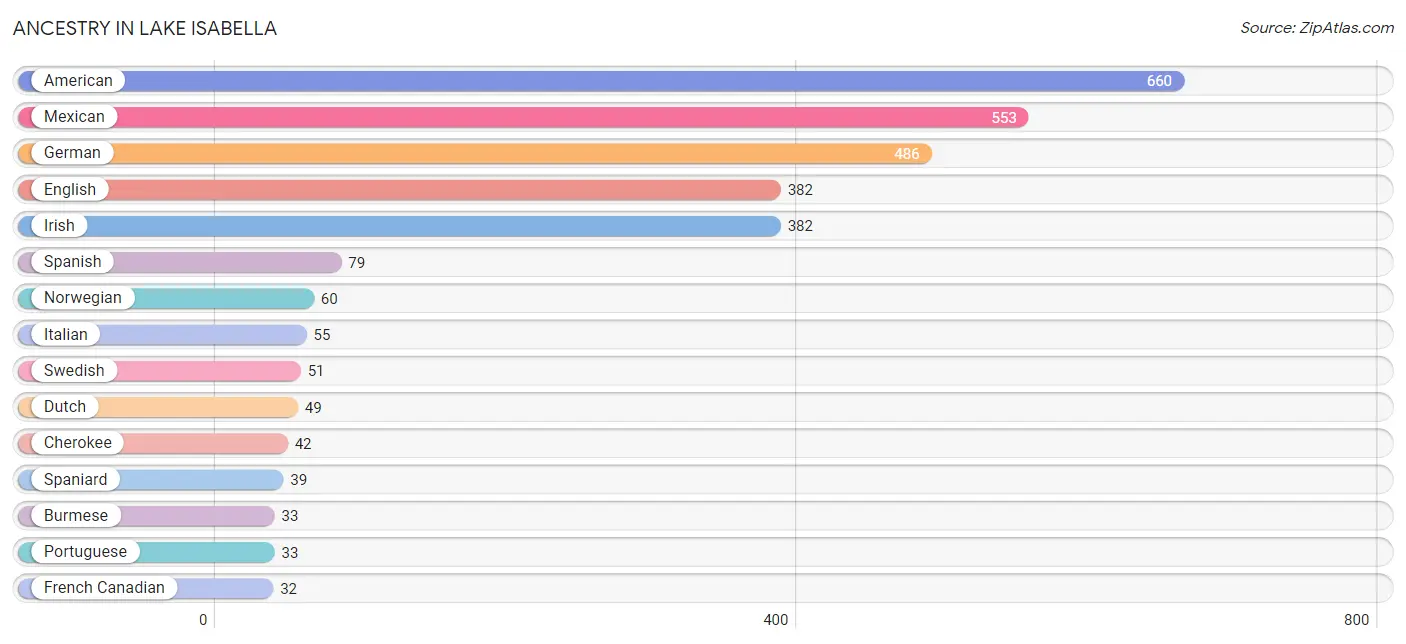
| Ancestry | # Population | % Population |
| American | 660 | 18.8% |
| Bhutanese | 24 | 0.7% |
| Burmese | 33 | 0.9% |
| Cherokee | 42 | 1.2% |
| Dutch | 49 | 1.4% |
| Eastern European | 28 | 0.8% |
| English | 382 | 10.9% |
| French Canadian | 32 | 0.9% |
| German | 486 | 13.8% |
| Irish | 382 | 10.9% |
| Italian | 55 | 1.6% |
| Mexican | 553 | 15.7% |
| Northern European | 12 | 0.3% |
| Norwegian | 60 | 1.7% |
| Polish | 26 | 0.7% |
| Portuguese | 33 | 0.9% |
| Scottish | 30 | 0.9% |
| Sioux | 10 | 0.3% |
| Spaniard | 39 | 1.1% |
| Spanish | 79 | 2.2% |
| Swedish | 51 | 1.5% |
| Welsh | 16 | 0.5% | View All 22 Rows |
Immigrants in Lake Isabella
The most numerous immigrant groups reported in Lake Isabella came from Central America (103 | 2.9%), Latin America (103 | 2.9%), Mexico (103 | 2.9%), Asia (40 | 1.1%), and Eastern Asia (40 | 1.1%), together accounting for 11.1% of all Lake Isabella residents.
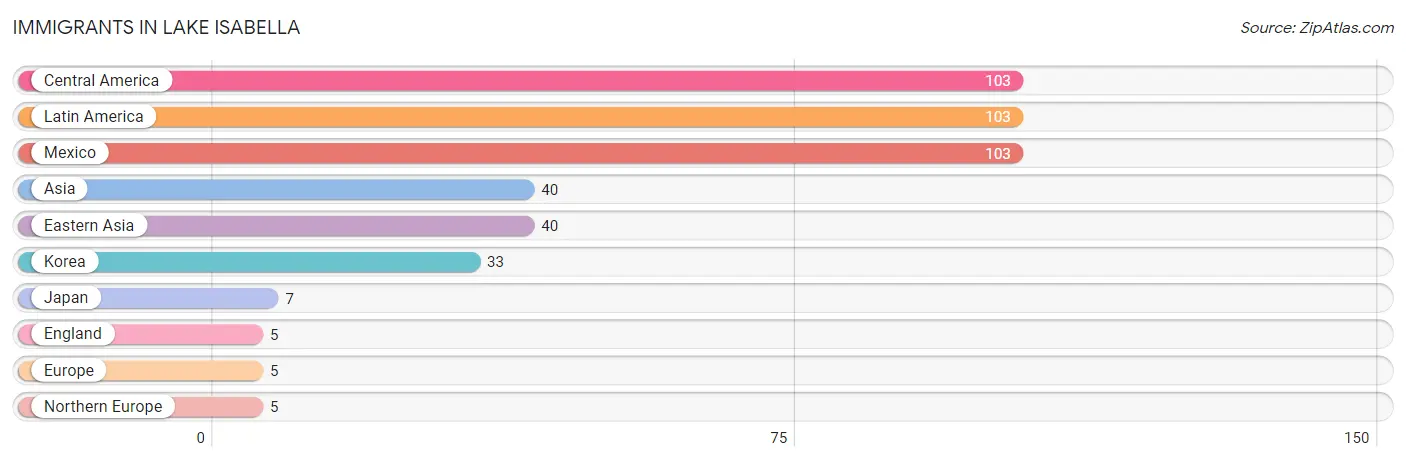
| Immigration Origin | # Population | % Population |
| Asia | 40 | 1.1% |
| Central America | 103 | 2.9% |
| Eastern Asia | 40 | 1.1% |
| England | 5 | 0.1% |
| Europe | 5 | 0.1% |
| Japan | 7 | 0.2% |
| Korea | 33 | 0.9% |
| Latin America | 103 | 2.9% |
| Mexico | 103 | 2.9% |
| Northern Europe | 5 | 0.1% | View All 10 Rows |
Sex and Age in Lake Isabella
Sex and Age in Lake Isabella
The most populous age groups in Lake Isabella are 10 to 14 Years (414 | 23.8%) for men and 10 to 14 Years (267 | 15.0%) for women.
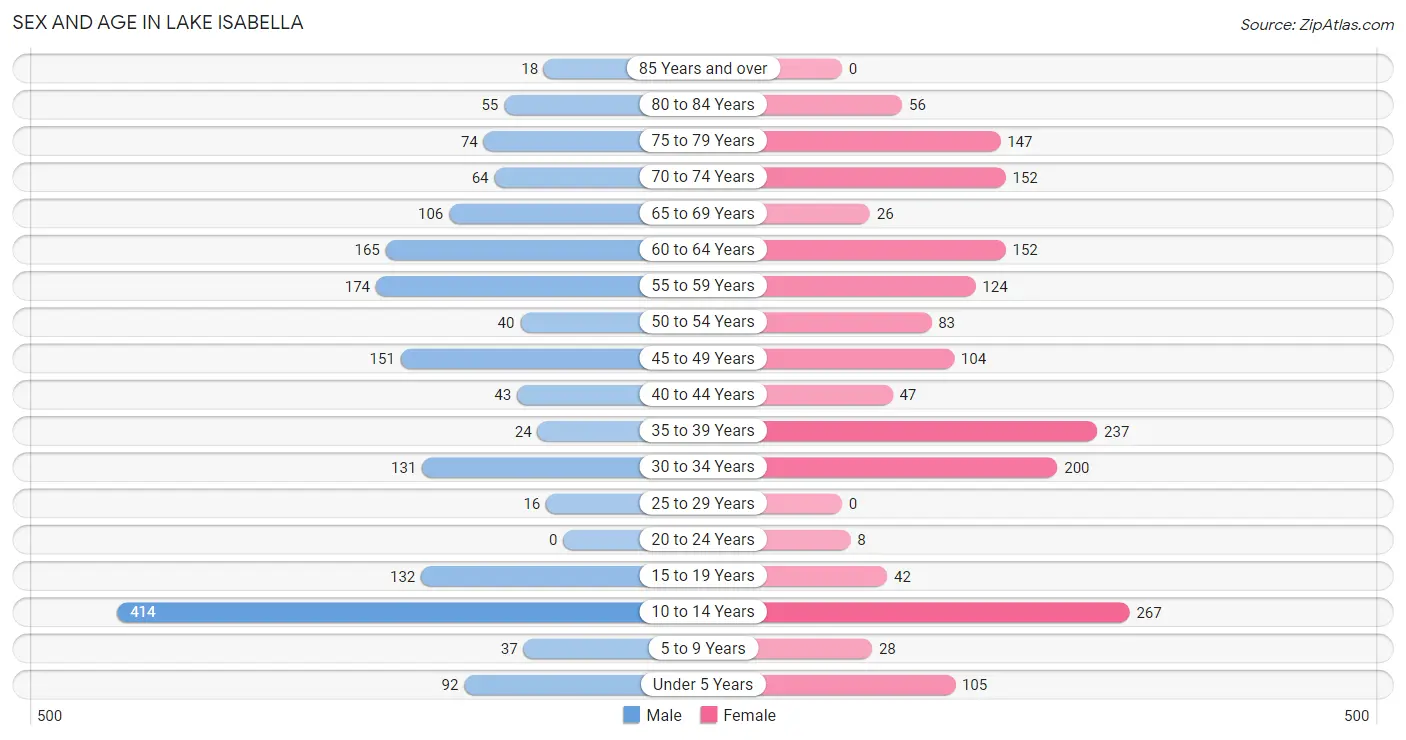
| Age Bracket | Male | Female |
| Under 5 Years | 92 (5.3%) | 105 (5.9%) |
| 5 to 9 Years | 37 (2.1%) | 28 (1.6%) |
| 10 to 14 Years | 414 (23.8%) | 267 (15.0%) |
| 15 to 19 Years | 132 (7.6%) | 42 (2.4%) |
| 20 to 24 Years | 0 (0.0%) | 8 (0.4%) |
| 25 to 29 Years | 16 (0.9%) | 0 (0.0%) |
| 30 to 34 Years | 131 (7.5%) | 200 (11.3%) |
| 35 to 39 Years | 24 (1.4%) | 237 (13.3%) |
| 40 to 44 Years | 43 (2.5%) | 47 (2.6%) |
| 45 to 49 Years | 151 (8.7%) | 104 (5.9%) |
| 50 to 54 Years | 40 (2.3%) | 83 (4.7%) |
| 55 to 59 Years | 174 (10.0%) | 124 (7.0%) |
| 60 to 64 Years | 165 (9.5%) | 152 (8.6%) |
| 65 to 69 Years | 106 (6.1%) | 26 (1.5%) |
| 70 to 74 Years | 64 (3.7%) | 152 (8.6%) |
| 75 to 79 Years | 74 (4.3%) | 147 (8.3%) |
| 80 to 84 Years | 55 (3.2%) | 56 (3.2%) |
| 85 Years and over | 18 (1.0%) | 0 (0.0%) |
| Total | 1,736 (100.0%) | 1,778 (100.0%) |
Families and Households in Lake Isabella
Median Family Size in Lake Isabella
The median family size in Lake Isabella is 2.92 persons per family, with single female/mother families (382 | 44.0%) accounting for the largest median family size of 3.39 persons per family. On the other hand, single male/father families (88 | 10.1%) represent the smallest median family size with 2.43 persons per family.
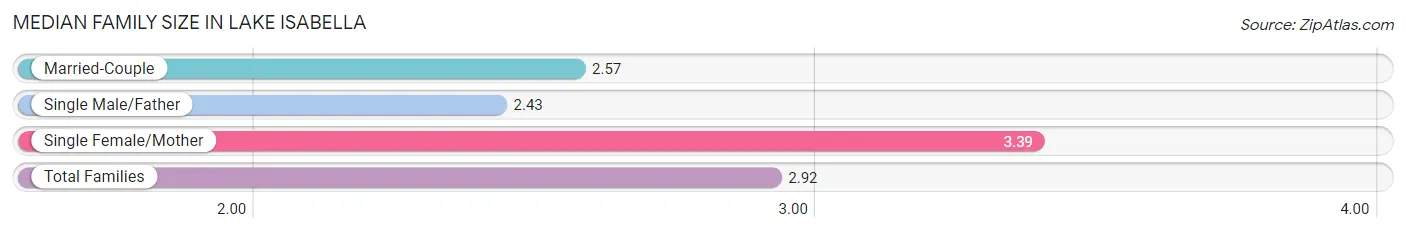
| Family Type | # Families | Family Size |
| Married-Couple | 398 (45.9%) | 2.57 |
| Single Male/Father | 88 (10.1%) | 2.43 |
| Single Female/Mother | 382 (44.0%) | 3.39 |
| Total Families | 868 (100.0%) | 2.92 |
Median Household Size in Lake Isabella
The median household size in Lake Isabella is 2.29 persons per household, with single female/mother households (382 | 24.8%) accounting for the largest median household size of 3.74 persons per household. non-family households (669 | 43.5%) represent the smallest median household size with 1.21 persons per household.
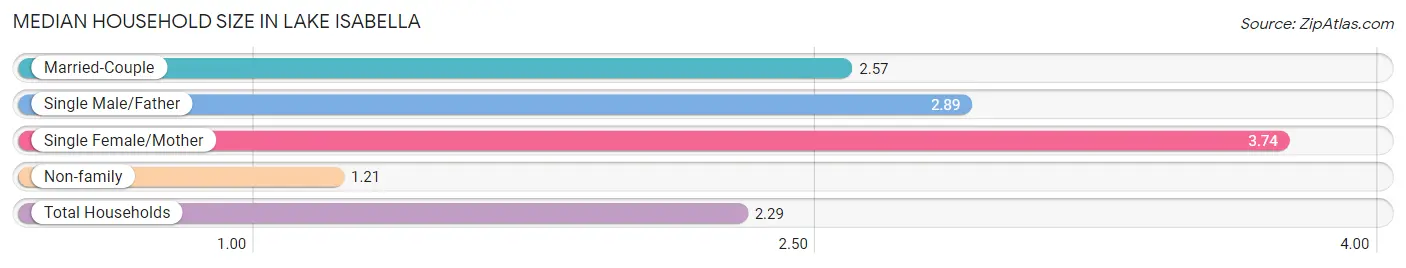
| Household Type | # Households | Household Size |
| Married-Couple | 398 (25.9%) | 2.57 |
| Single Male/Father | 88 (5.7%) | 2.89 |
| Single Female/Mother | 382 (24.8%) | 3.74 |
| Non-family | 669 (43.5%) | 1.21 |
| Total Households | 1,537 (100.0%) | 2.29 |
Household Size by Marriage Status in Lake Isabella
Out of a total of 1,537 households in Lake Isabella, 868 (56.5%) are family households, while 669 (43.5%) are nonfamily households. The most numerous type of family households are 2-person households, comprising 431, and the most common type of nonfamily households are 1-person households, comprising 573.
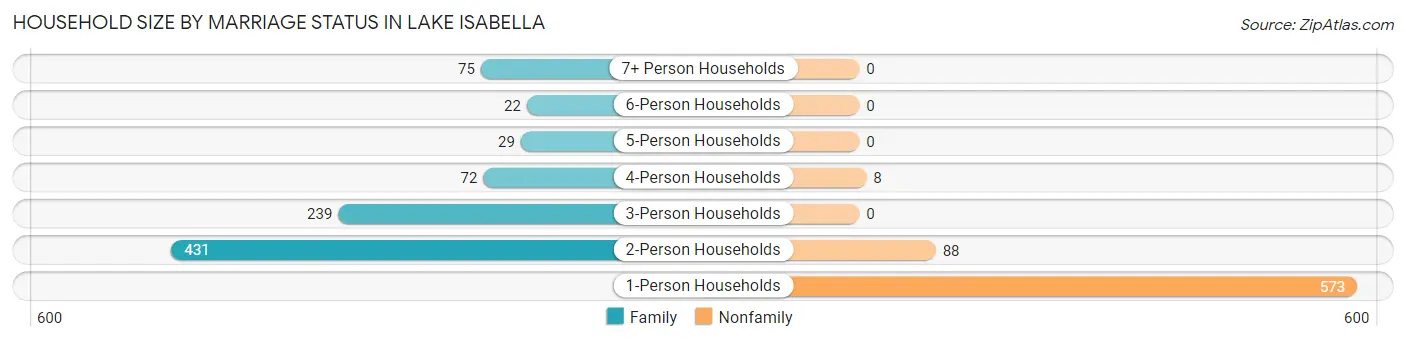
| Household Size | Family Households | Nonfamily Households |
| 1-Person Households | - | 573 (37.3%) |
| 2-Person Households | 431 (28.0%) | 88 (5.7%) |
| 3-Person Households | 239 (15.5%) | 0 (0.0%) |
| 4-Person Households | 72 (4.7%) | 8 (0.5%) |
| 5-Person Households | 29 (1.9%) | 0 (0.0%) |
| 6-Person Households | 22 (1.4%) | 0 (0.0%) |
| 7+ Person Households | 75 (4.9%) | 0 (0.0%) |
| Total | 868 (56.5%) | 669 (43.5%) |
Female Fertility in Lake Isabella
Fertility by Age in Lake Isabella
| Age Bracket | Women with Births | Births / 1,000 Women |
| 15 to 19 years | 0 (0.0%) | 0.0 |
| 20 to 34 years | 0 (0.0%) | 0.0 |
| 35 to 50 years | 0 (0.0%) | 0.0 |
| Total | 0 (0.0%) | 0.0 |
Fertility by Age by Marriage Status in Lake Isabella
| Age Bracket | Married | Unmarried |
| 15 to 19 years | 0 (0.0%) | 0 (0.0%) |
| 20 to 34 years | 0 (0.0%) | 0 (0.0%) |
| 35 to 50 years | 0 (0.0%) | 0 (0.0%) |
| Total | 0 (0.0%) | 0 (0.0%) |
Fertility by Education in Lake Isabella
| Educational Attainment | Women with Births | Births / 1,000 Women |
| Less than High School | 0 (0.0%) | 0.0 |
| High School Diploma | 0 (0.0%) | 0.0 |
| College or Associate's Degree | 0 (0.0%) | 0.0 |
| Bachelor's Degree | 0 (0.0%) | 0.0 |
| Graduate Degree | 0 (0.0%) | 0.0 |
| Total | 0 (0.0%) | 0.0 |
Fertility by Education by Marriage Status in Lake Isabella
| Educational Attainment | Married | Unmarried |
| Less than High School | 0 (0.0%) | 0 (0.0%) |
| High School Diploma | 0 (0.0%) | 0 (0.0%) |
| College or Associate's Degree | 0 (0.0%) | 0 (0.0%) |
| Bachelor's Degree | 0 (0.0%) | 0 (0.0%) |
| Graduate Degree | 0 (0.0%) | 0 (0.0%) |
| Total | 0 (0.0%) | 0 (0.0%) |
Employment Characteristics in Lake Isabella
Employment by Class of Employer in Lake Isabella
Among the 836 employed individuals in Lake Isabella, private company employees (534 | 63.9%), local government employees (95 | 11.4%), and state government employees (59 | 7.1%) make up the most common classes of employment.
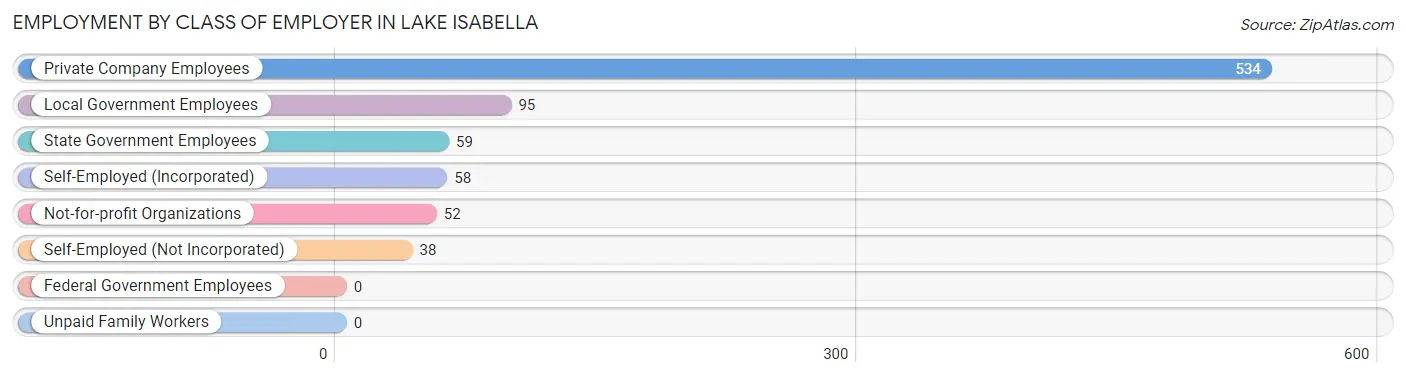
| Employer Class | # Employees | % Employees |
| Private Company Employees | 534 | 63.9% |
| Self-Employed (Incorporated) | 58 | 6.9% |
| Self-Employed (Not Incorporated) | 38 | 4.5% |
| Not-for-profit Organizations | 52 | 6.2% |
| Local Government Employees | 95 | 11.4% |
| State Government Employees | 59 | 7.1% |
| Federal Government Employees | 0 | 0.0% |
| Unpaid Family Workers | 0 | 0.0% |
| Total | 836 | 100.0% |
Employment Status by Age in Lake Isabella
According to the labor force statistics for Lake Isabella, out of the total population over 16 years of age (2,505), 37.1% or 929 individuals are in the labor force, with 10.0% or 93 of them unemployed. The age group with the highest labor force participation rate is 20 to 24 years, with 100.0% or 8 individuals in the labor force. Within the labor force, the 16 to 19 years age range has the highest percentage of unemployed individuals, with 100.0% or 38 of them being unemployed.
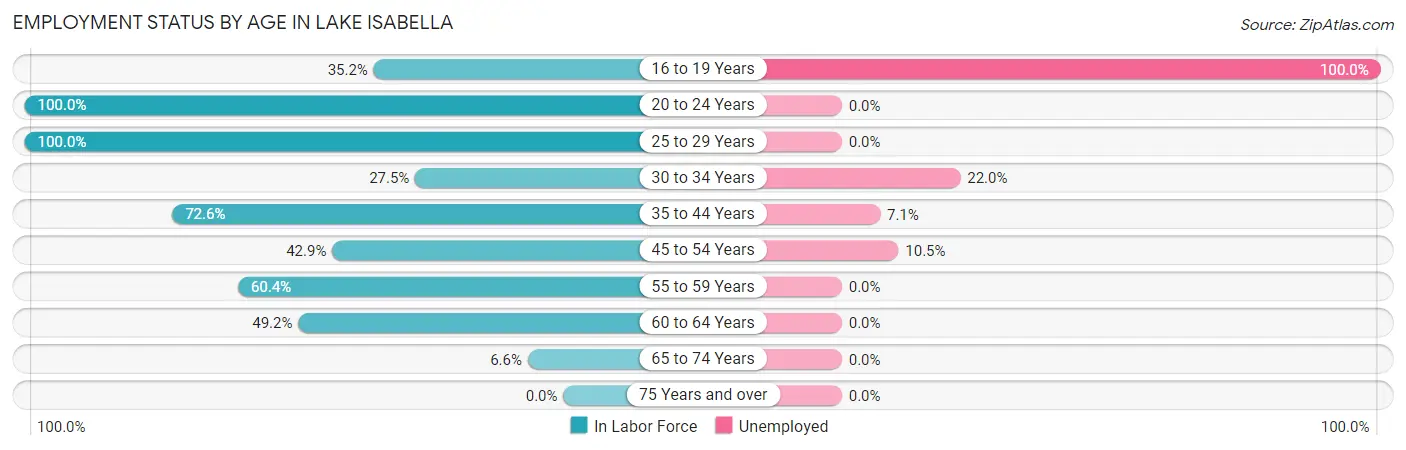
| Age Bracket | In Labor Force | Unemployed |
| 16 to 19 Years | 38 (35.2%) | 38 (100.0%) |
| 20 to 24 Years | 8 (100.0%) | 0 (0.0%) |
| 25 to 29 Years | 16 (100.0%) | 0 (0.0%) |
| 30 to 34 Years | 91 (27.5%) | 20 (22.0%) |
| 35 to 44 Years | 255 (72.6%) | 18 (7.1%) |
| 45 to 54 Years | 162 (42.9%) | 17 (10.5%) |
| 55 to 59 Years | 180 (60.4%) | 0 (0.0%) |
| 60 to 64 Years | 156 (49.2%) | 0 (0.0%) |
| 65 to 74 Years | 23 (6.6%) | 0 (0.0%) |
| 75 Years and over | 0 (0.0%) | 0 (0.0%) |
| Total | 929 (37.1%) | 93 (10.0%) |
Employment Status by Educational Attainment in Lake Isabella
According to labor force statistics for Lake Isabella, 50.9% of individuals (861) out of the total population between 25 and 64 years of age (1,691) are in the labor force, with 6.4% or 55 of them being unemployed. The group with the highest labor force participation rate are those with the educational attainment of college / associate degree, with 66.1% or 454 individuals in the labor force. Within the labor force, individuals with college / associate degree education have the highest percentage of unemployment, with 7.7% or 35 of them being unemployed.
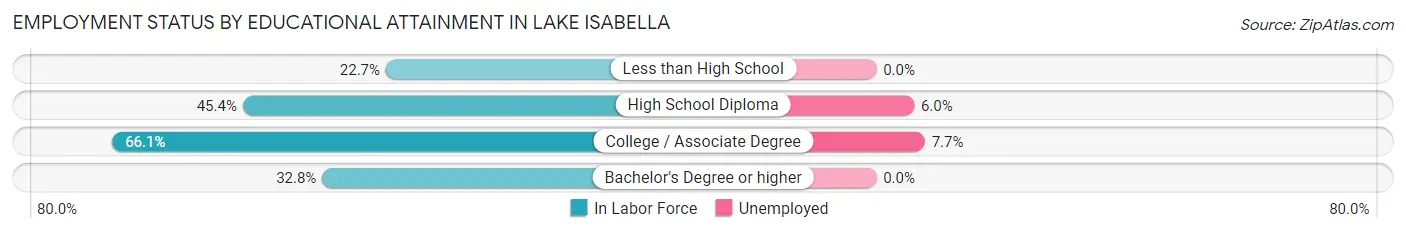
| Educational Attainment | In Labor Force | Unemployed |
| Less than High School | 34 (22.7%) | 0 (0.0%) |
| High School Diploma | 331 (45.4%) | 44 (6.0%) |
| College / Associate Degree | 454 (66.1%) | 53 (7.7%) |
| Bachelor's Degree or higher | 41 (32.8%) | 0 (0.0%) |
| Total | 861 (50.9%) | 108 (6.4%) |
Employment Occupations by Sex in Lake Isabella
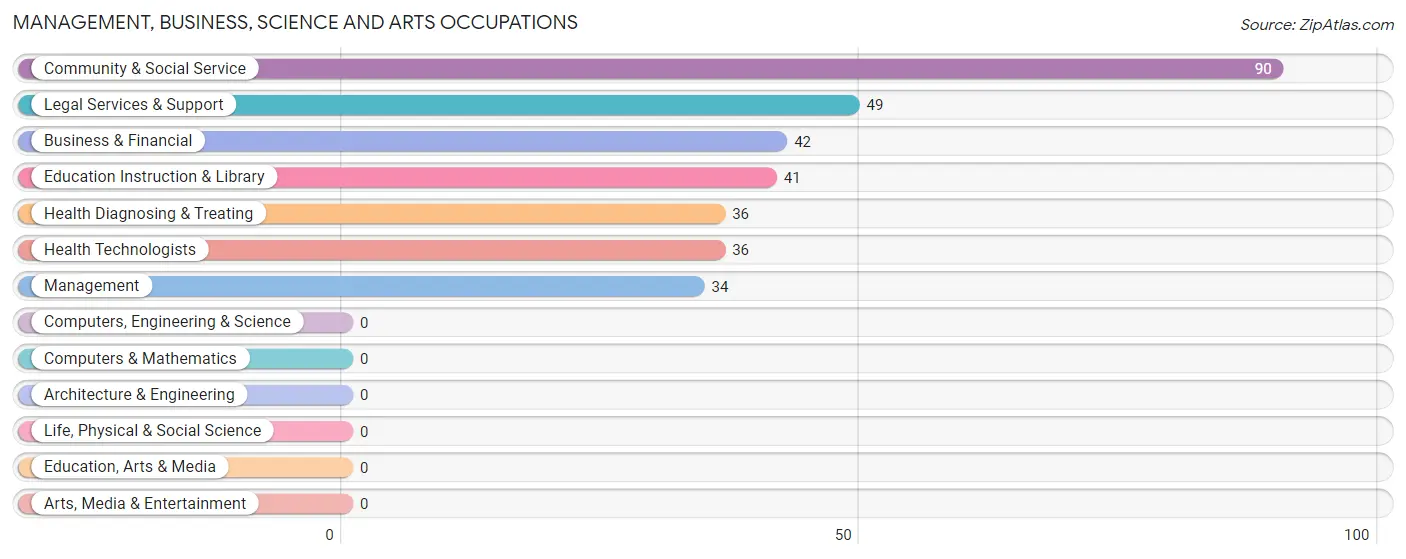
Management, Business, Science and Arts Occupations
The most common Management, Business, Science and Arts occupations in Lake Isabella are Community & Social Service (90 | 10.8%), Legal Services & Support (49 | 5.9%), Business & Financial (42 | 5.0%), Education Instruction & Library (41 | 4.9%), and Health Diagnosing & Treating (36 | 4.3%).
Management, Business, Science and Arts Occupations by Sex
Within the Management, Business, Science and Arts occupations in Lake Isabella, the most male-oriented occupations are Business & Financial (100.0%), Management (61.8%), and Education Instruction & Library (24.4%), while the most female-oriented occupations are Legal Services & Support (100.0%), Health Diagnosing & Treating (100.0%), and Health Technologists (100.0%).
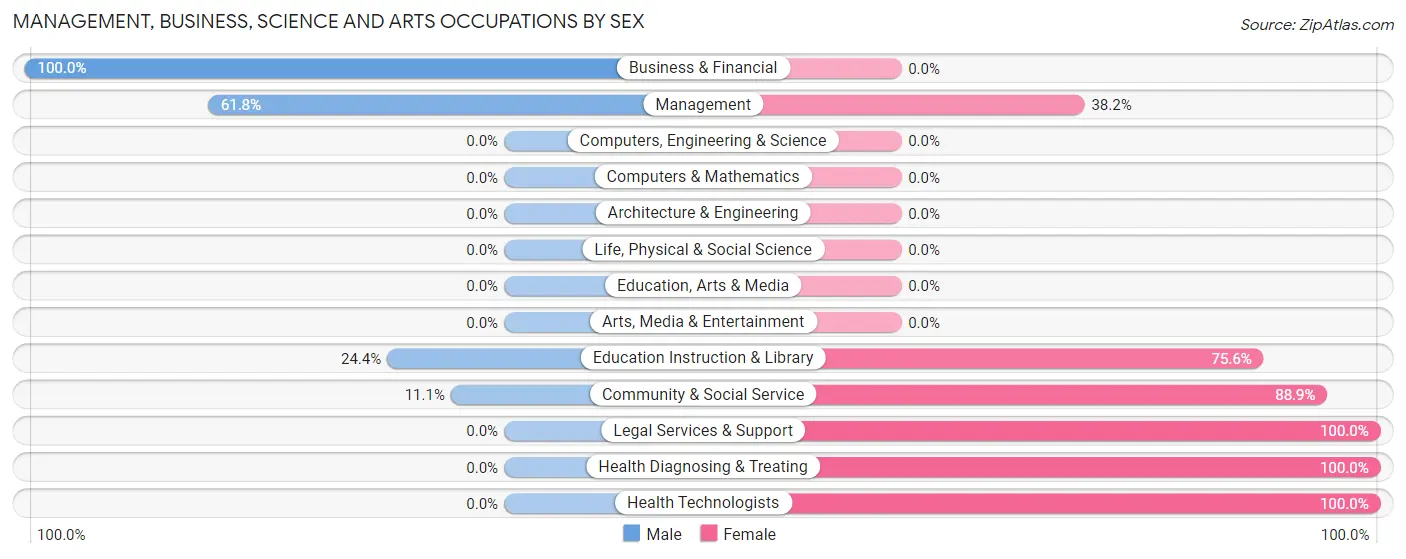
| Occupation | Male | Female |
| Management | 21 (61.8%) | 13 (38.2%) |
| Business & Financial | 42 (100.0%) | 0 (0.0%) |
| Computers, Engineering & Science | 0 (0.0%) | 0 (0.0%) |
| Computers & Mathematics | 0 (0.0%) | 0 (0.0%) |
| Architecture & Engineering | 0 (0.0%) | 0 (0.0%) |
| Life, Physical & Social Science | 0 (0.0%) | 0 (0.0%) |
| Community & Social Service | 10 (11.1%) | 80 (88.9%) |
| Education, Arts & Media | 0 (0.0%) | 0 (0.0%) |
| Legal Services & Support | 0 (0.0%) | 49 (100.0%) |
| Education Instruction & Library | 10 (24.4%) | 31 (75.6%) |
| Arts, Media & Entertainment | 0 (0.0%) | 0 (0.0%) |
| Health Diagnosing & Treating | 0 (0.0%) | 36 (100.0%) |
| Health Technologists | 0 (0.0%) | 36 (100.0%) |
| Total (Category) | 73 (36.1%) | 129 (63.9%) |
| Total (Overall) | 392 (46.9%) | 444 (53.1%) |
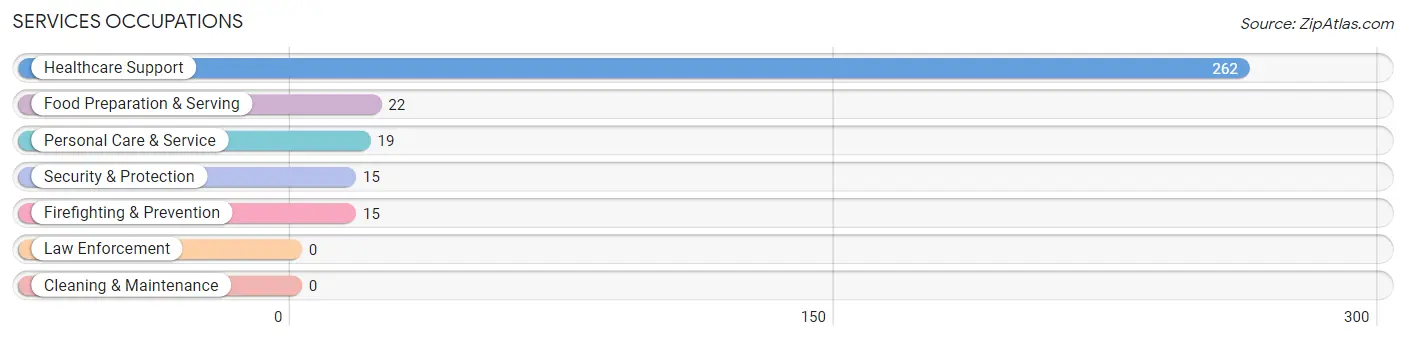
Services Occupations
The most common Services occupations in Lake Isabella are Healthcare Support (262 | 31.3%), Food Preparation & Serving (22 | 2.6%), Personal Care & Service (19 | 2.3%), Security & Protection (15 | 1.8%), and Firefighting & Prevention (15 | 1.8%).
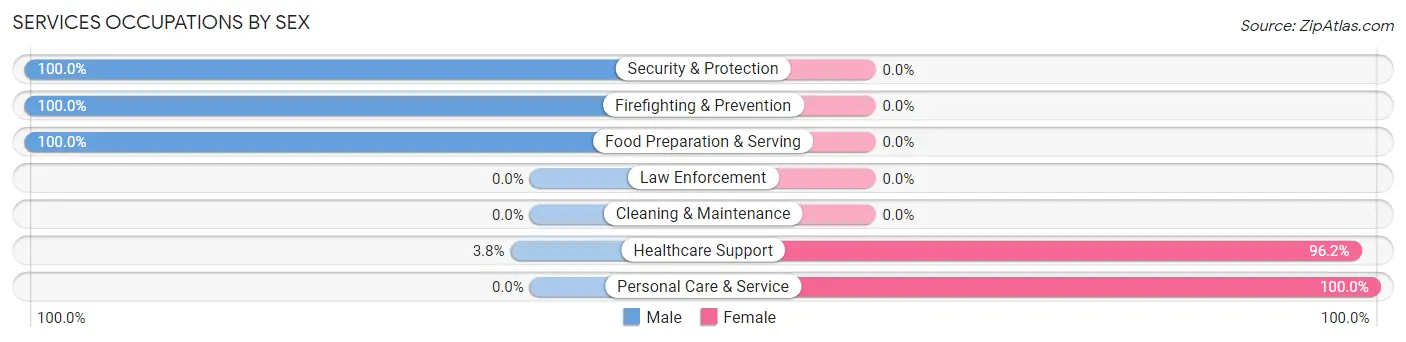
Services Occupations by Sex
Within the Services occupations in Lake Isabella, the most male-oriented occupations are Security & Protection (100.0%), Firefighting & Prevention (100.0%), and Food Preparation & Serving (100.0%), while the most female-oriented occupations are Personal Care & Service (100.0%), and Healthcare Support (96.2%).
| Occupation | Male | Female |
| Healthcare Support | 10 (3.8%) | 252 (96.2%) |
| Security & Protection | 15 (100.0%) | 0 (0.0%) |
| Firefighting & Prevention | 15 (100.0%) | 0 (0.0%) |
| Law Enforcement | 0 (0.0%) | 0 (0.0%) |
| Food Preparation & Serving | 22 (100.0%) | 0 (0.0%) |
| Cleaning & Maintenance | 0 (0.0%) | 0 (0.0%) |
| Personal Care & Service | 0 (0.0%) | 19 (100.0%) |
| Total (Category) | 47 (14.8%) | 271 (85.2%) |
| Total (Overall) | 392 (46.9%) | 444 (53.1%) |
Sales and Office Occupations
The most common Sales and Office occupations in Lake Isabella are , and Sales & Related (109 | 13.0%).
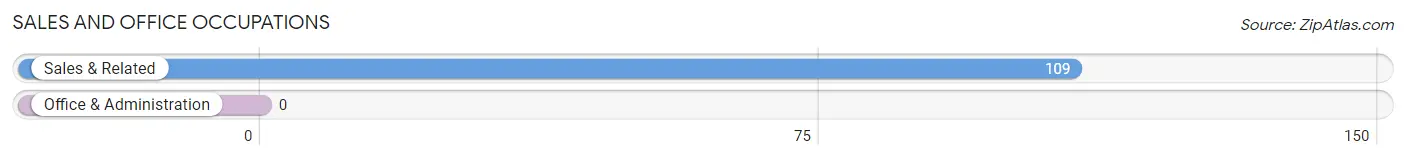
Sales and Office Occupations by Sex
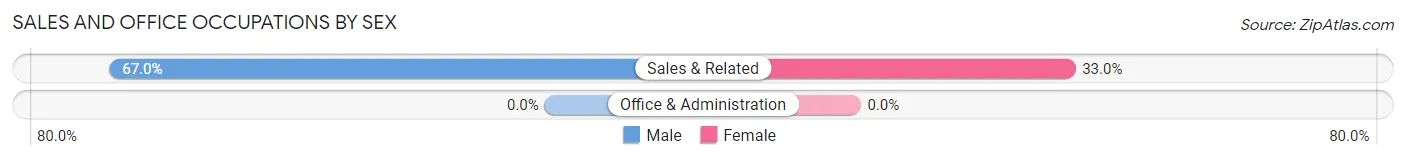
| Occupation | Male | Female |
| Sales & Related | 73 (67.0%) | 36 (33.0%) |
| Office & Administration | 0 (0.0%) | 0 (0.0%) |
| Total (Category) | 73 (67.0%) | 36 (33.0%) |
| Total (Overall) | 392 (46.9%) | 444 (53.1%) |
Natural Resources, Construction and Maintenance Occupations
The most common Natural Resources, Construction and Maintenance occupations in Lake Isabella are Construction & Extraction (53 | 6.3%), and Installation, Maintenance & Repair (24 | 2.9%).
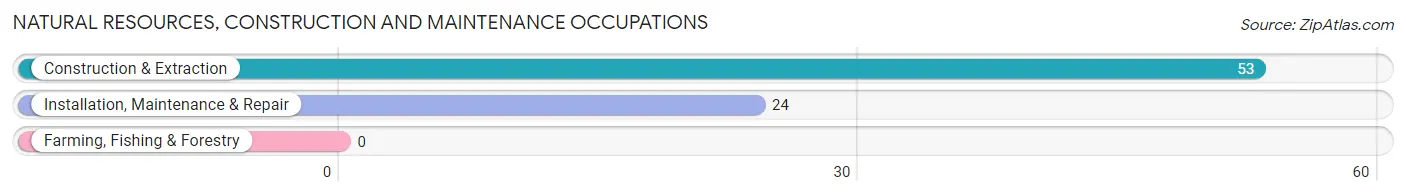
Natural Resources, Construction and Maintenance Occupations by Sex
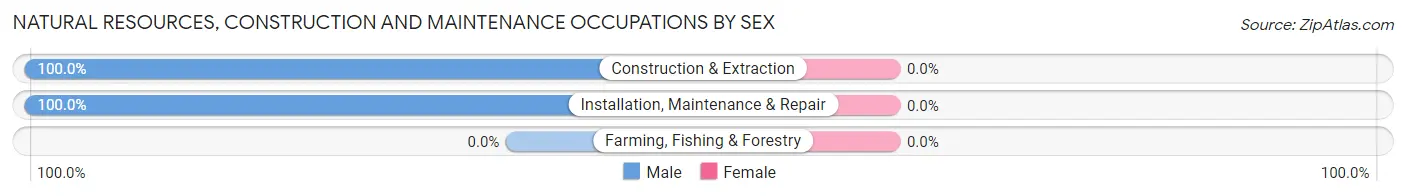
| Occupation | Male | Female |
| Farming, Fishing & Forestry | 0 (0.0%) | 0 (0.0%) |
| Construction & Extraction | 53 (100.0%) | 0 (0.0%) |
| Installation, Maintenance & Repair | 24 (100.0%) | 0 (0.0%) |
| Total (Category) | 77 (100.0%) | 0 (0.0%) |
| Total (Overall) | 392 (46.9%) | 444 (53.1%) |
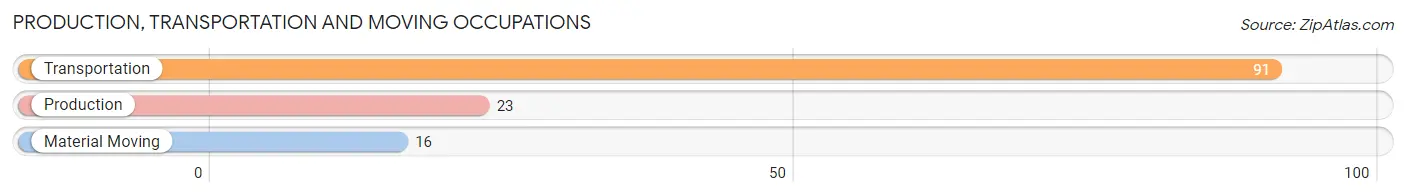
Production, Transportation and Moving Occupations
The most common Production, Transportation and Moving occupations in Lake Isabella are Transportation (91 | 10.9%), Production (23 | 2.8%), and Material Moving (16 | 1.9%).
Production, Transportation and Moving Occupations by Sex
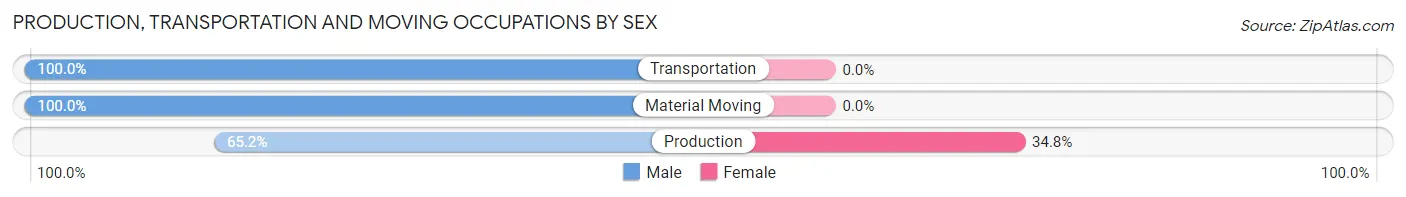
| Occupation | Male | Female |
| Production | 15 (65.2%) | 8 (34.8%) |
| Transportation | 91 (100.0%) | 0 (0.0%) |
| Material Moving | 16 (100.0%) | 0 (0.0%) |
| Total (Category) | 122 (93.9%) | 8 (6.1%) |
| Total (Overall) | 392 (46.9%) | 444 (53.1%) |
Employment Industries by Sex in Lake Isabella
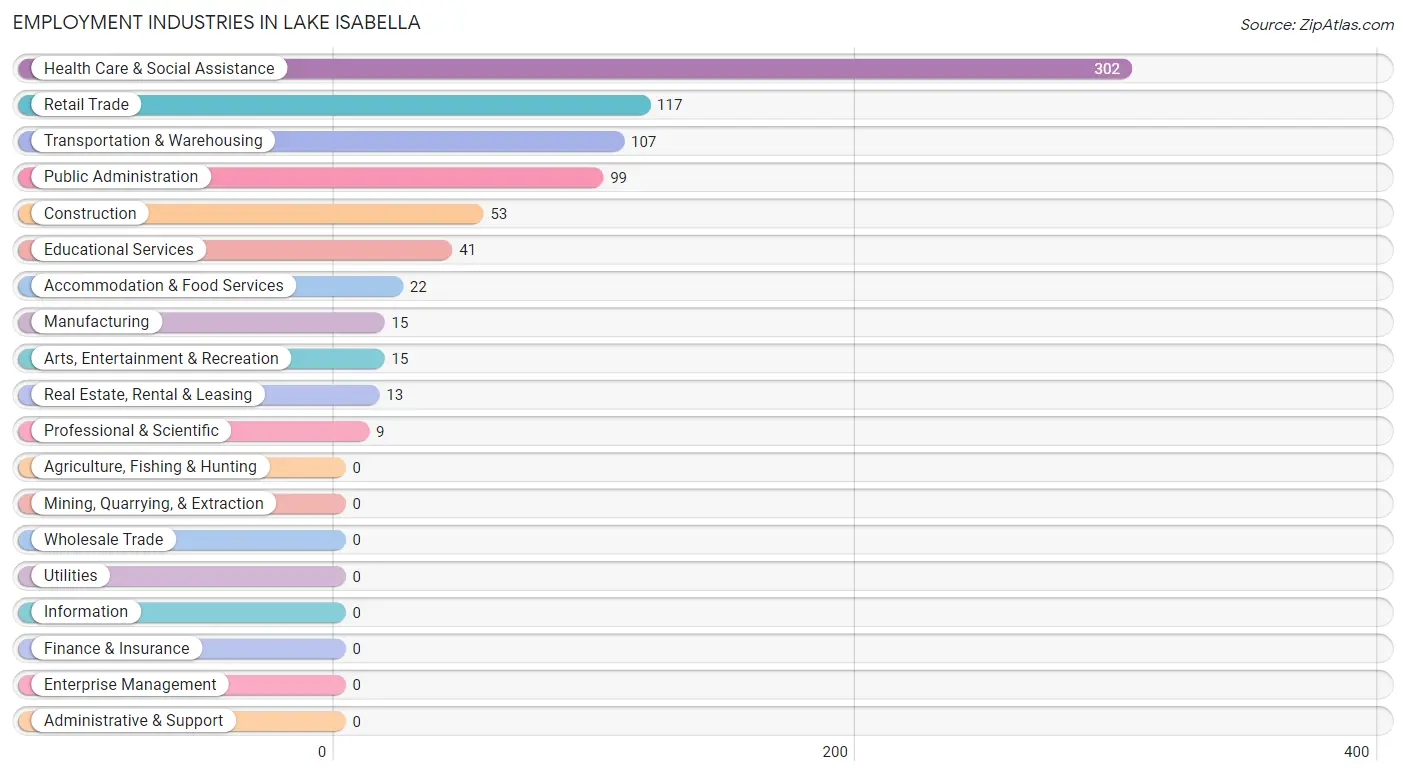
Employment Industries in Lake Isabella
The major employment industries in Lake Isabella include Health Care & Social Assistance (302 | 36.1%), Retail Trade (117 | 14.0%), Transportation & Warehousing (107 | 12.8%), Public Administration (99 | 11.8%), and Construction (53 | 6.3%).
Employment Industries by Sex in Lake Isabella
The Lake Isabella industries that see more men than women are Construction (100.0%), Manufacturing (100.0%), and Transportation & Warehousing (100.0%), whereas the industries that tend to have a higher number of women are Real Estate, Rental & Leasing (100.0%), Professional & Scientific (100.0%), and Public Administration (100.0%).
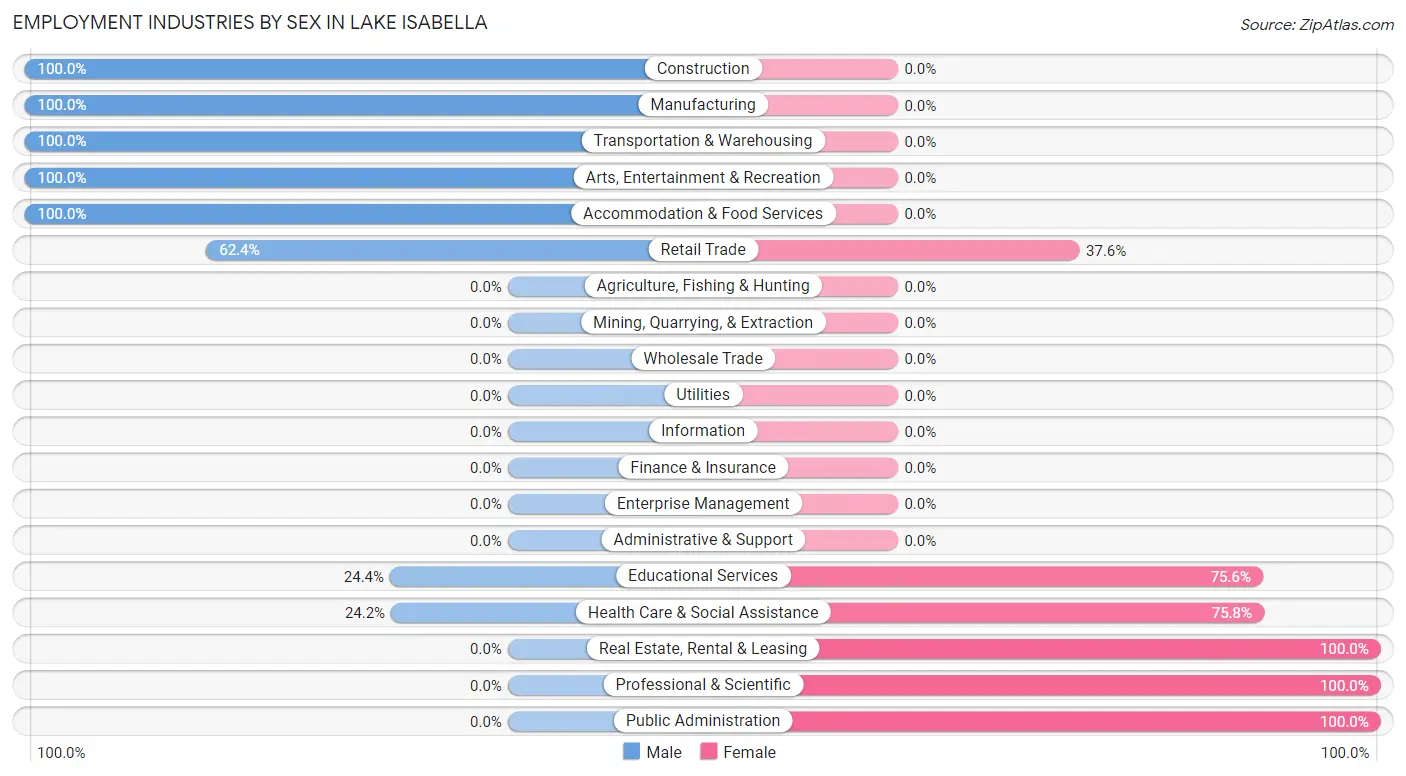
| Industry | Male | Female |
| Agriculture, Fishing & Hunting | 0 (0.0%) | 0 (0.0%) |
| Mining, Quarrying, & Extraction | 0 (0.0%) | 0 (0.0%) |
| Construction | 53 (100.0%) | 0 (0.0%) |
| Manufacturing | 15 (100.0%) | 0 (0.0%) |
| Wholesale Trade | 0 (0.0%) | 0 (0.0%) |
| Retail Trade | 73 (62.4%) | 44 (37.6%) |
| Transportation & Warehousing | 107 (100.0%) | 0 (0.0%) |
| Utilities | 0 (0.0%) | 0 (0.0%) |
| Information | 0 (0.0%) | 0 (0.0%) |
| Finance & Insurance | 0 (0.0%) | 0 (0.0%) |
| Real Estate, Rental & Leasing | 0 (0.0%) | 13 (100.0%) |
| Professional & Scientific | 0 (0.0%) | 9 (100.0%) |
| Enterprise Management | 0 (0.0%) | 0 (0.0%) |
| Administrative & Support | 0 (0.0%) | 0 (0.0%) |
| Educational Services | 10 (24.4%) | 31 (75.6%) |
| Health Care & Social Assistance | 73 (24.2%) | 229 (75.8%) |
| Arts, Entertainment & Recreation | 15 (100.0%) | 0 (0.0%) |
| Accommodation & Food Services | 22 (100.0%) | 0 (0.0%) |
| Public Administration | 0 (0.0%) | 99 (100.0%) |
| Total | 392 (46.9%) | 444 (53.1%) |
Education in Lake Isabella
School Enrollment in Lake Isabella
The most common levels of schooling among the 871 students in Lake Isabella are middle school (593 | 68.1%), high school (158 | 18.1%), and nursery / preschool (74 | 8.5%).
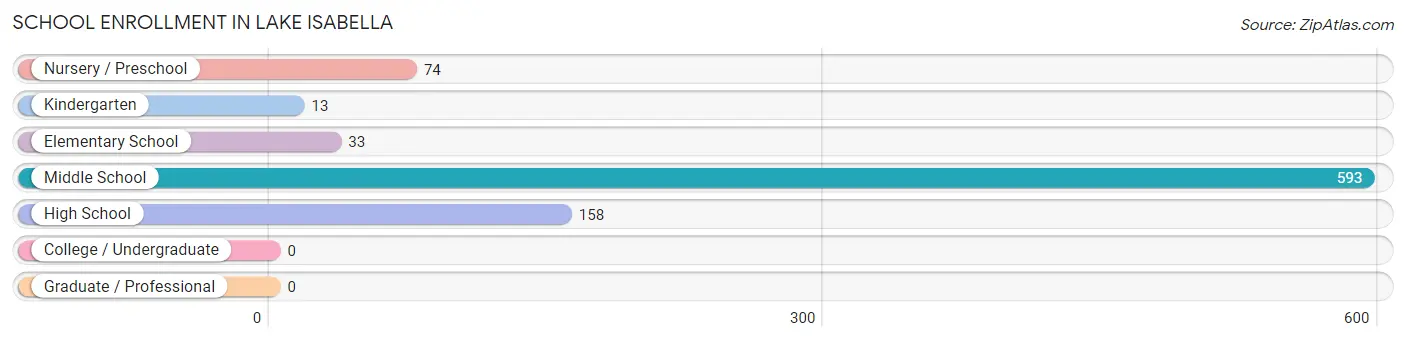
| School Level | # Students | % Students |
| Nursery / Preschool | 74 | 8.5% |
| Kindergarten | 13 | 1.5% |
| Elementary School | 33 | 3.8% |
| Middle School | 593 | 68.1% |
| High School | 158 | 18.1% |
| College / Undergraduate | 0 | 0.0% |
| Graduate / Professional | 0 | 0.0% |
| Total | 871 | 100.0% |
School Enrollment by Age by Funding Source in Lake Isabella
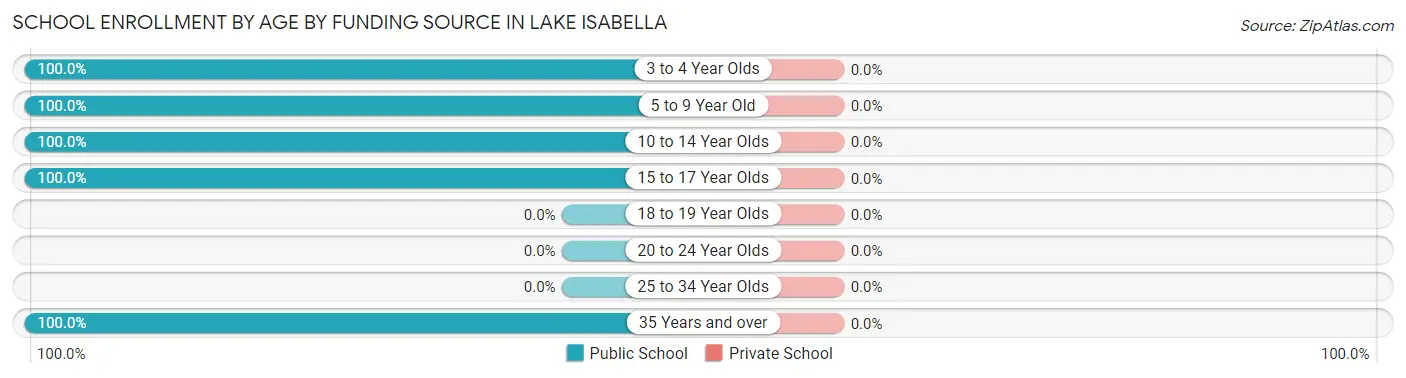
| Age Bracket | Public School | Private School |
| 3 to 4 Year Olds | 36 (100.0%) | 0 (0.0%) |
| 5 to 9 Year Old | 56 (100.0%) | 0 (0.0%) |
| 10 to 14 Year Olds | 681 (100.0%) | 0 (0.0%) |
| 15 to 17 Year Olds | 79 (100.0%) | 0 (0.0%) |
| 18 to 19 Year Olds | 0 (0.0%) | 0 (0.0%) |
| 20 to 24 Year Olds | 0 (0.0%) | 0 (0.0%) |
| 25 to 34 Year Olds | 0 (0.0%) | 0 (0.0%) |
| 35 Years and over | 19 (100.0%) | 0 (0.0%) |
| Total | 871 (100.0%) | 0 (0.0%) |
Educational Attainment by Field of Study in Lake Isabella
Business (56 | 32.4%), science & technology (53 | 30.6%), liberal arts & history (22 | 12.7%), literature & languages (12 | 6.9%), and bio, nature & agricultural (10 | 5.8%) are the most common fields of study among 173 individuals in Lake Isabella who have obtained a bachelor's degree or higher.
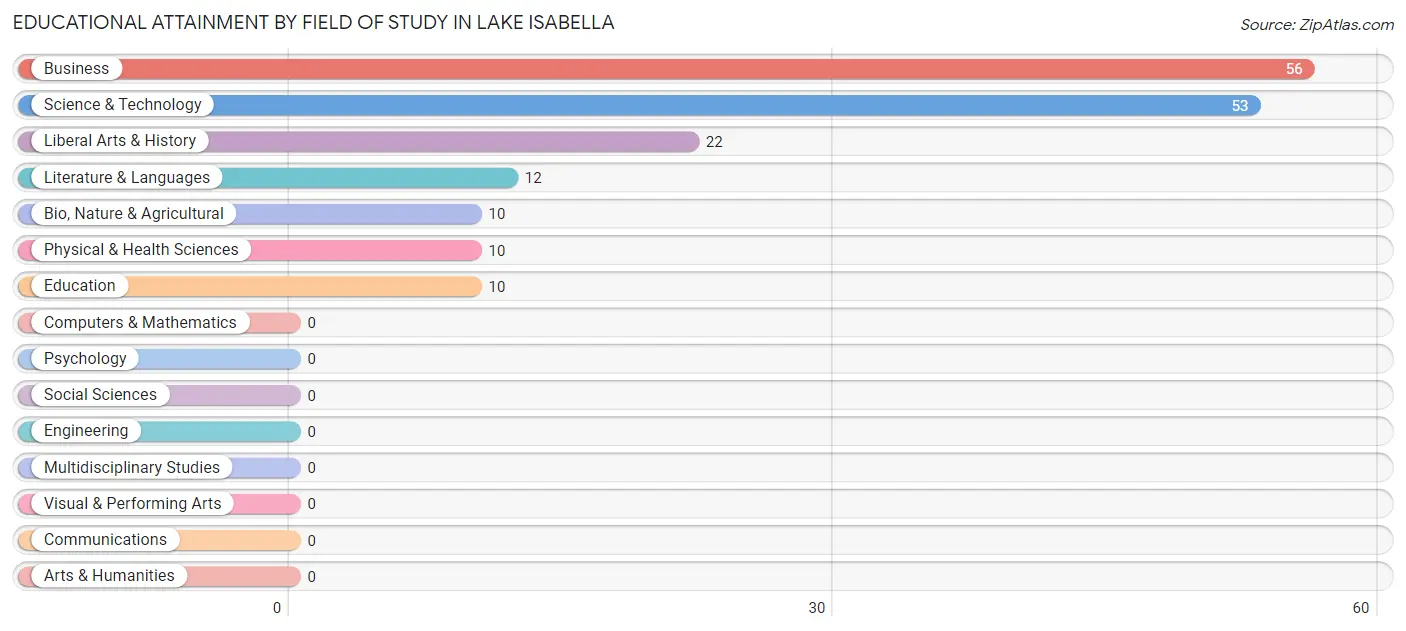
| Field of Study | # Graduates | % Graduates |
| Computers & Mathematics | 0 | 0.0% |
| Bio, Nature & Agricultural | 10 | 5.8% |
| Physical & Health Sciences | 10 | 5.8% |
| Psychology | 0 | 0.0% |
| Social Sciences | 0 | 0.0% |
| Engineering | 0 | 0.0% |
| Multidisciplinary Studies | 0 | 0.0% |
| Science & Technology | 53 | 30.6% |
| Business | 56 | 32.4% |
| Education | 10 | 5.8% |
| Literature & Languages | 12 | 6.9% |
| Liberal Arts & History | 22 | 12.7% |
| Visual & Performing Arts | 0 | 0.0% |
| Communications | 0 | 0.0% |
| Arts & Humanities | 0 | 0.0% |
| Total | 173 | 100.0% |
Transportation & Commute in Lake Isabella
Vehicle Availability by Sex in Lake Isabella
The most prevalent vehicle ownership categories in Lake Isabella are males with 2 vehicles (208, accounting for 53.1%) and females with 2 vehicles (84, making up 46.9%).
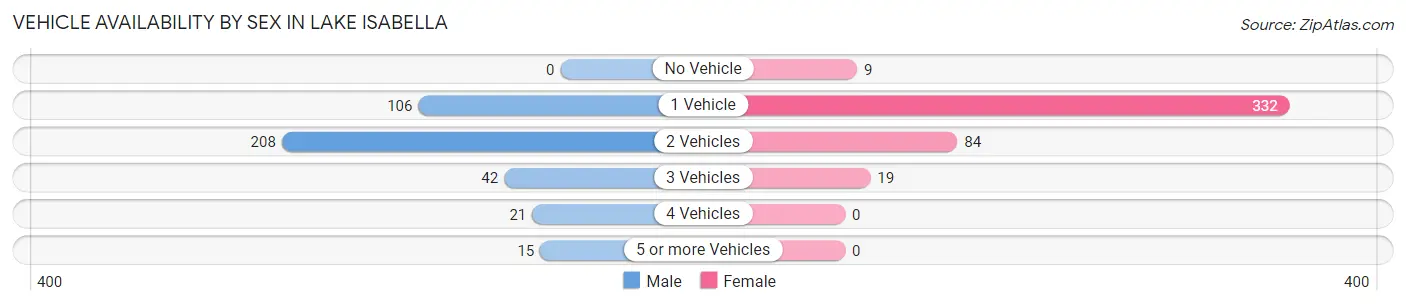
| Vehicles Available | Male | Female |
| No Vehicle | 0 (0.0%) | 9 (2.0%) |
| 1 Vehicle | 106 (27.0%) | 332 (74.8%) |
| 2 Vehicles | 208 (53.1%) | 84 (18.9%) |
| 3 Vehicles | 42 (10.7%) | 19 (4.3%) |
| 4 Vehicles | 21 (5.4%) | 0 (0.0%) |
| 5 or more Vehicles | 15 (3.8%) | 0 (0.0%) |
| Total | 392 (100.0%) | 444 (100.0%) |
Commute Time in Lake Isabella
The most frequently occuring commute durations in Lake Isabella are less than 5 minutes (264 commuters, 32.4%), 15 to 19 minutes (147 commuters, 18.0%), and 5 to 9 minutes (142 commuters, 17.4%).
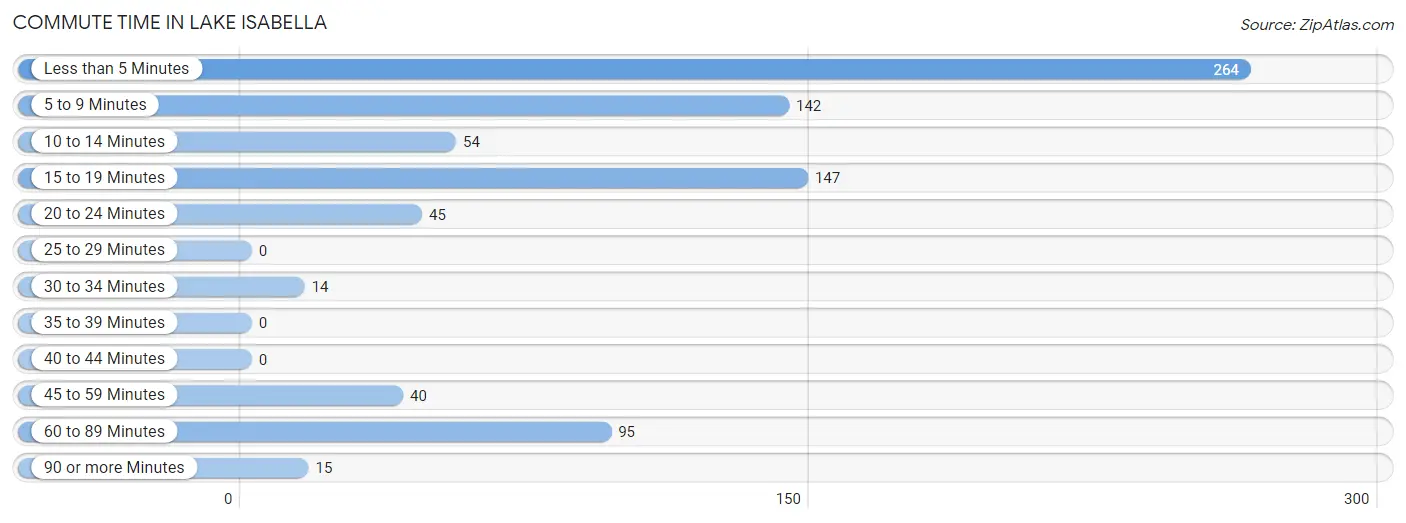
| Commute Time | # Commuters | % Commuters |
| Less than 5 Minutes | 264 | 32.4% |
| 5 to 9 Minutes | 142 | 17.4% |
| 10 to 14 Minutes | 54 | 6.6% |
| 15 to 19 Minutes | 147 | 18.0% |
| 20 to 24 Minutes | 45 | 5.5% |
| 25 to 29 Minutes | 0 | 0.0% |
| 30 to 34 Minutes | 14 | 1.7% |
| 35 to 39 Minutes | 0 | 0.0% |
| 40 to 44 Minutes | 0 | 0.0% |
| 45 to 59 Minutes | 40 | 4.9% |
| 60 to 89 Minutes | 95 | 11.6% |
| 90 or more Minutes | 15 | 1.8% |
Commute Time by Sex in Lake Isabella
The most common commute times in Lake Isabella are 60 to 89 minutes (95 commuters, 24.2%) for males and less than 5 minutes (227 commuters, 53.5%) for females.
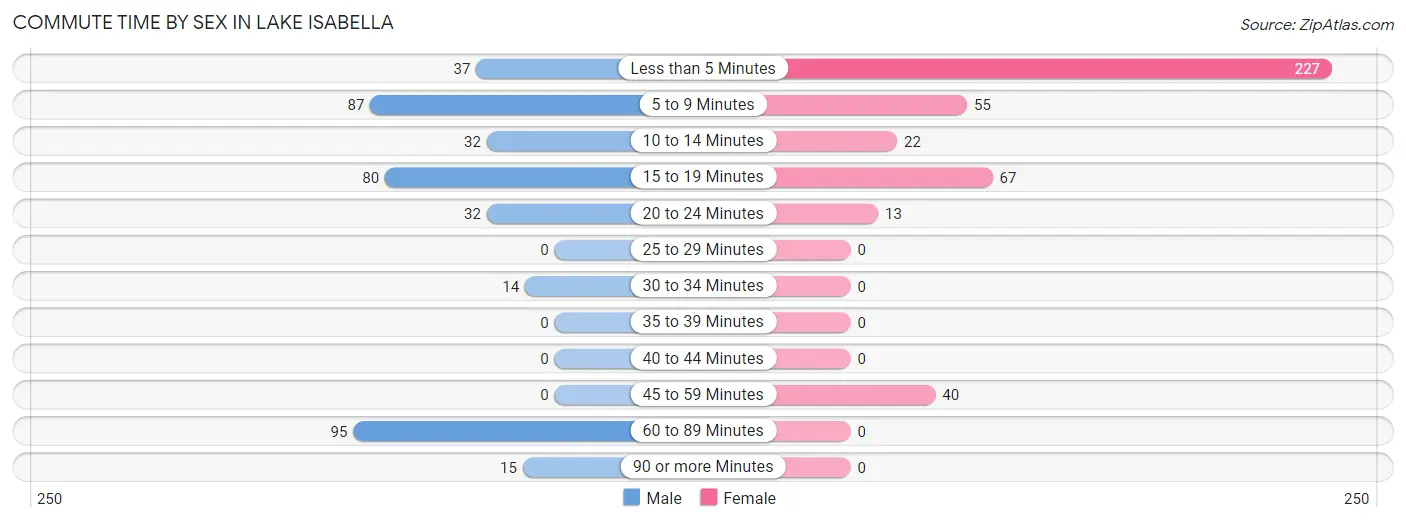
| Commute Time | Male | Female |
| Less than 5 Minutes | 37 (9.4%) | 227 (53.5%) |
| 5 to 9 Minutes | 87 (22.2%) | 55 (13.0%) |
| 10 to 14 Minutes | 32 (8.2%) | 22 (5.2%) |
| 15 to 19 Minutes | 80 (20.4%) | 67 (15.8%) |
| 20 to 24 Minutes | 32 (8.2%) | 13 (3.1%) |
| 25 to 29 Minutes | 0 (0.0%) | 0 (0.0%) |
| 30 to 34 Minutes | 14 (3.6%) | 0 (0.0%) |
| 35 to 39 Minutes | 0 (0.0%) | 0 (0.0%) |
| 40 to 44 Minutes | 0 (0.0%) | 0 (0.0%) |
| 45 to 59 Minutes | 0 (0.0%) | 40 (9.4%) |
| 60 to 89 Minutes | 95 (24.2%) | 0 (0.0%) |
| 90 or more Minutes | 15 (3.8%) | 0 (0.0%) |
Time of Departure to Work by Sex in Lake Isabella
The most frequent times of departure to work in Lake Isabella are 7:00 AM to 7:29 AM (70, 17.9%) for males and 8:00 AM to 8:29 AM (208, 49.1%) for females.
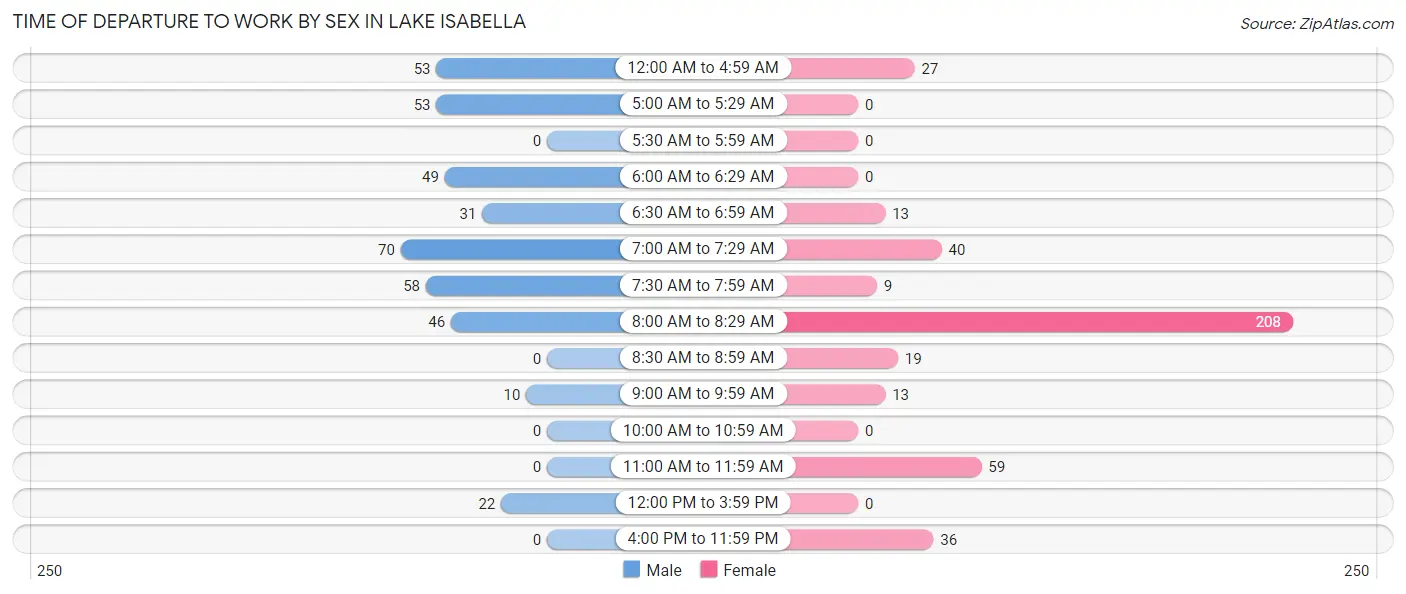
| Time of Departure | Male | Female |
| 12:00 AM to 4:59 AM | 53 (13.5%) | 27 (6.4%) |
| 5:00 AM to 5:29 AM | 53 (13.5%) | 0 (0.0%) |
| 5:30 AM to 5:59 AM | 0 (0.0%) | 0 (0.0%) |
| 6:00 AM to 6:29 AM | 49 (12.5%) | 0 (0.0%) |
| 6:30 AM to 6:59 AM | 31 (7.9%) | 13 (3.1%) |
| 7:00 AM to 7:29 AM | 70 (17.9%) | 40 (9.4%) |
| 7:30 AM to 7:59 AM | 58 (14.8%) | 9 (2.1%) |
| 8:00 AM to 8:29 AM | 46 (11.7%) | 208 (49.1%) |
| 8:30 AM to 8:59 AM | 0 (0.0%) | 19 (4.5%) |
| 9:00 AM to 9:59 AM | 10 (2.5%) | 13 (3.1%) |
| 10:00 AM to 10:59 AM | 0 (0.0%) | 0 (0.0%) |
| 11:00 AM to 11:59 AM | 0 (0.0%) | 59 (13.9%) |
| 12:00 PM to 3:59 PM | 22 (5.6%) | 0 (0.0%) |
| 4:00 PM to 11:59 PM | 0 (0.0%) | 36 (8.5%) |
| Total | 392 (100.0%) | 424 (100.0%) |
Housing Occupancy in Lake Isabella
Occupancy by Ownership in Lake Isabella
Of the total 1,537 dwellings in Lake Isabella, owner-occupied units account for 942 (61.3%), while renter-occupied units make up 595 (38.7%).
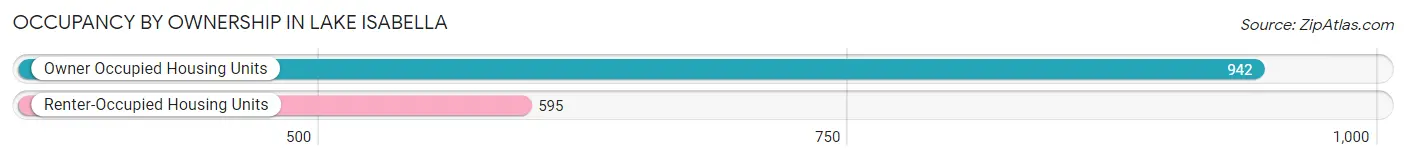
| Occupancy | # Housing Units | % Housing Units |
| Owner Occupied Housing Units | 942 | 61.3% |
| Renter-Occupied Housing Units | 595 | 38.7% |
| Total Occupied Housing Units | 1,537 | 100.0% |
Occupancy by Household Size in Lake Isabella
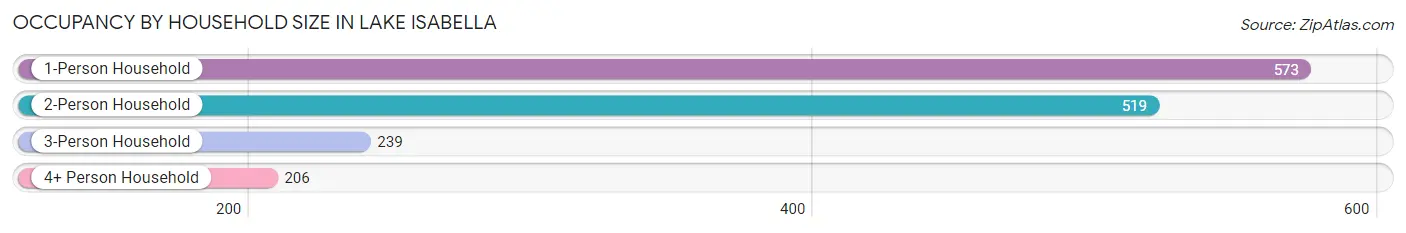
| Household Size | # Housing Units | % Housing Units |
| 1-Person Household | 573 | 37.3% |
| 2-Person Household | 519 | 33.8% |
| 3-Person Household | 239 | 15.5% |
| 4+ Person Household | 206 | 13.4% |
| Total Housing Units | 1,537 | 100.0% |
Occupancy by Ownership by Household Size in Lake Isabella
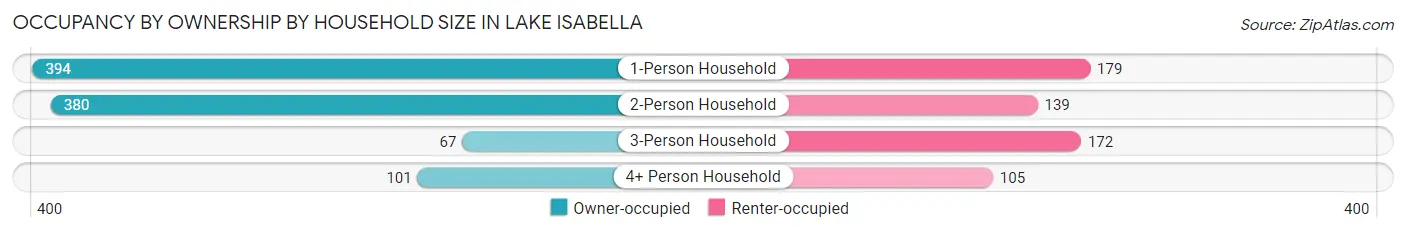
| Household Size | Owner-occupied | Renter-occupied |
| 1-Person Household | 394 (68.8%) | 179 (31.2%) |
| 2-Person Household | 380 (73.2%) | 139 (26.8%) |
| 3-Person Household | 67 (28.0%) | 172 (72.0%) |
| 4+ Person Household | 101 (49.0%) | 105 (51.0%) |
| Total Housing Units | 942 (61.3%) | 595 (38.7%) |
Occupancy by Educational Attainment in Lake Isabella
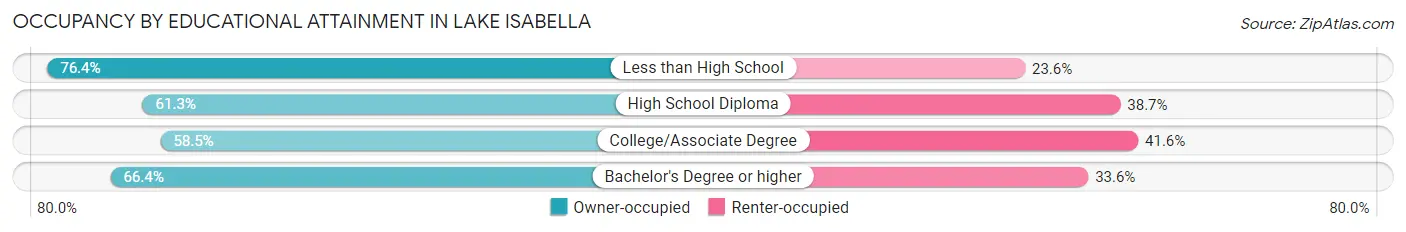
| Household Size | Owner-occupied | Renter-occupied |
| Less than High School | 55 (76.4%) | 17 (23.6%) |
| High School Diploma | 473 (61.3%) | 299 (38.7%) |
| College/Associate Degree | 339 (58.5%) | 241 (41.5%) |
| Bachelor's Degree or higher | 75 (66.4%) | 38 (33.6%) |
Occupancy by Age of Householder in Lake Isabella
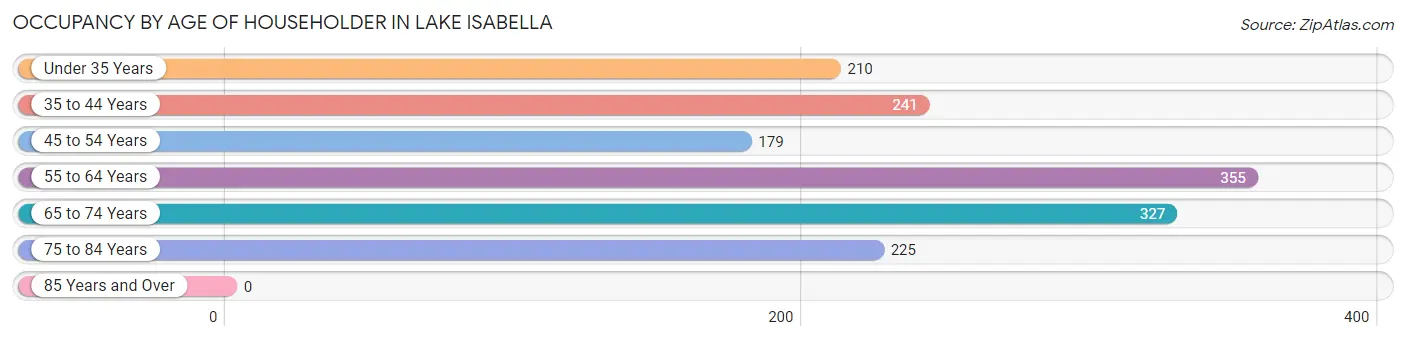
| Age Bracket | # Households | % Households |
| Under 35 Years | 210 | 13.7% |
| 35 to 44 Years | 241 | 15.7% |
| 45 to 54 Years | 179 | 11.7% |
| 55 to 64 Years | 355 | 23.1% |
| 65 to 74 Years | 327 | 21.3% |
| 75 to 84 Years | 225 | 14.6% |
| 85 Years and Over | 0 | 0.0% |
| Total | 1,537 | 100.0% |
Housing Finances in Lake Isabella
Median Income by Occupancy in Lake Isabella
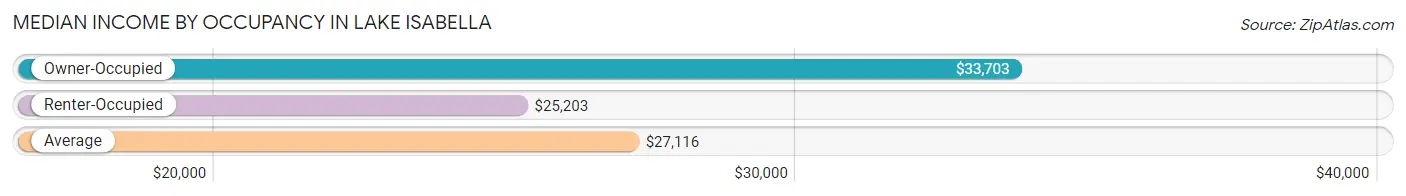
| Occupancy Type | # Households | Median Income |
| Owner-Occupied | 942 (61.3%) | $33,703 |
| Renter-Occupied | 595 (38.7%) | $25,203 |
| Average | 1,537 (100.0%) | $27,116 |
Occupancy by Householder Income Bracket in Lake Isabella
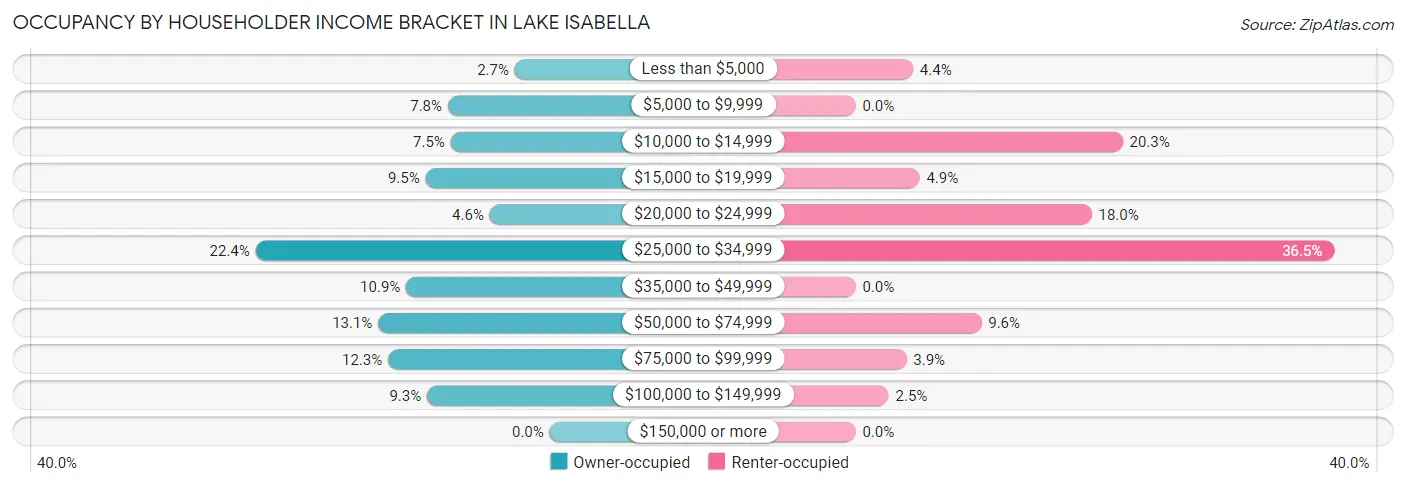
| Income Bracket | Owner-occupied | Renter-occupied |
| Less than $5,000 | 25 (2.6%) | 26 (4.4%) |
| $5,000 to $9,999 | 73 (7.7%) | 0 (0.0%) |
| $10,000 to $14,999 | 71 (7.5%) | 121 (20.3%) |
| $15,000 to $19,999 | 89 (9.5%) | 29 (4.9%) |
| $20,000 to $24,999 | 43 (4.6%) | 107 (18.0%) |
| $25,000 to $34,999 | 211 (22.4%) | 217 (36.5%) |
| $35,000 to $49,999 | 103 (10.9%) | 0 (0.0%) |
| $50,000 to $74,999 | 123 (13.1%) | 57 (9.6%) |
| $75,000 to $99,999 | 116 (12.3%) | 23 (3.9%) |
| $100,000 to $149,999 | 88 (9.3%) | 15 (2.5%) |
| $150,000 or more | 0 (0.0%) | 0 (0.0%) |
| Total | 942 (100.0%) | 595 (100.0%) |
Monthly Housing Cost Tiers in Lake Isabella
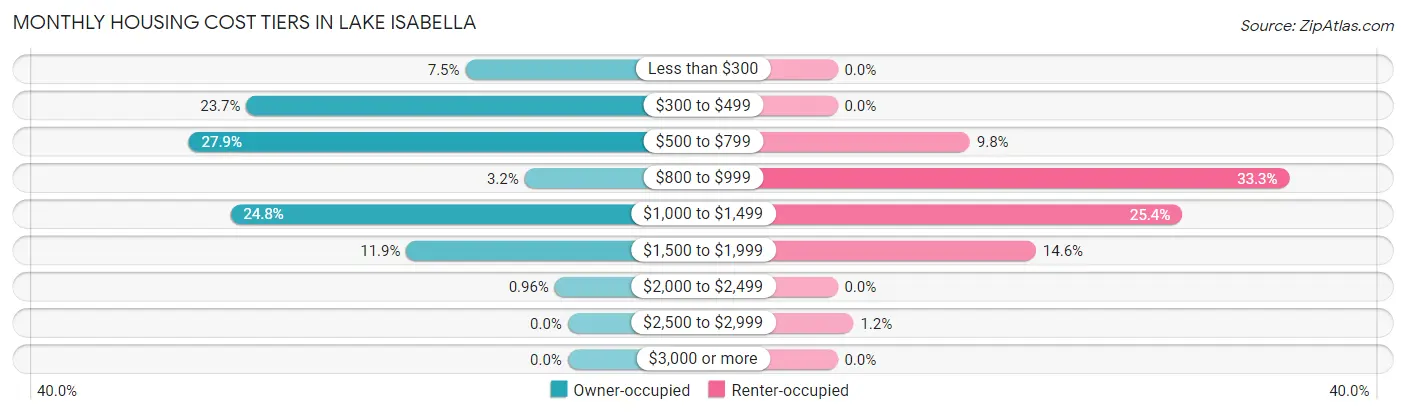
| Monthly Cost | Owner-occupied | Renter-occupied |
| Less than $300 | 71 (7.5%) | 0 (0.0%) |
| $300 to $499 | 223 (23.7%) | 0 (0.0%) |
| $500 to $799 | 263 (27.9%) | 58 (9.8%) |
| $800 to $999 | 30 (3.2%) | 198 (33.3%) |
| $1,000 to $1,499 | 234 (24.8%) | 151 (25.4%) |
| $1,500 to $1,999 | 112 (11.9%) | 87 (14.6%) |
| $2,000 to $2,499 | 9 (1.0%) | 0 (0.0%) |
| $2,500 to $2,999 | 0 (0.0%) | 7 (1.2%) |
| $3,000 or more | 0 (0.0%) | 0 (0.0%) |
| Total | 942 (100.0%) | 595 (100.0%) |
Physical Housing Characteristics in Lake Isabella
Housing Structures in Lake Isabella
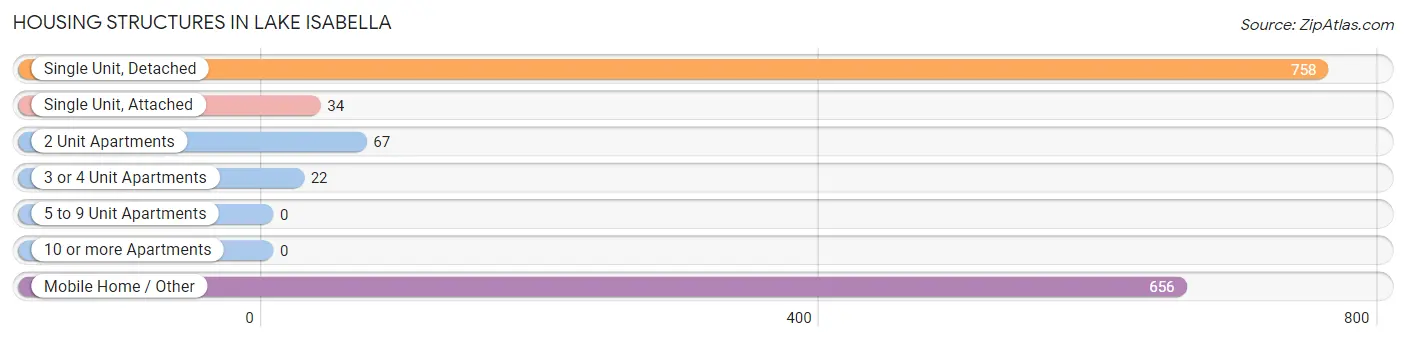
| Structure Type | # Housing Units | % Housing Units |
| Single Unit, Detached | 758 | 49.3% |
| Single Unit, Attached | 34 | 2.2% |
| 2 Unit Apartments | 67 | 4.4% |
| 3 or 4 Unit Apartments | 22 | 1.4% |
| 5 to 9 Unit Apartments | 0 | 0.0% |
| 10 or more Apartments | 0 | 0.0% |
| Mobile Home / Other | 656 | 42.7% |
| Total | 1,537 | 100.0% |
Housing Structures by Occupancy in Lake Isabella
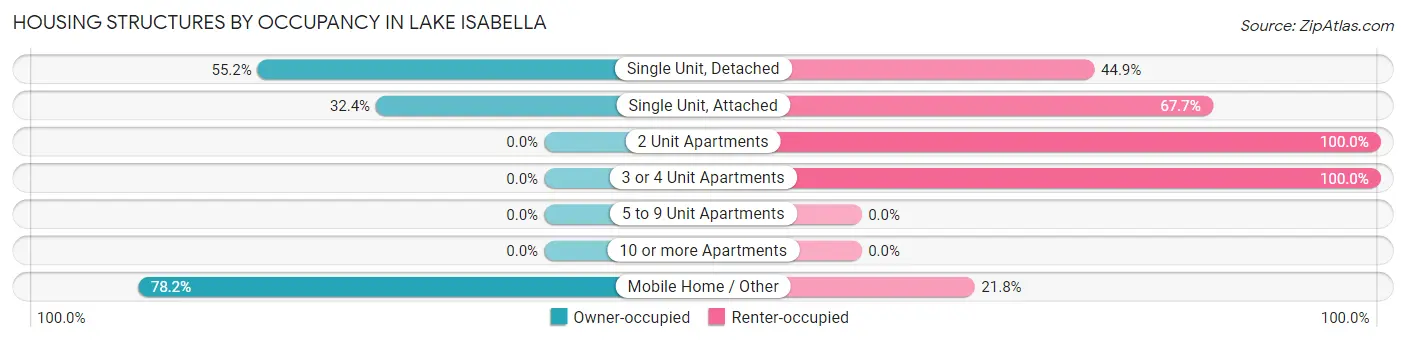
| Structure Type | Owner-occupied | Renter-occupied |
| Single Unit, Detached | 418 (55.1%) | 340 (44.9%) |
| Single Unit, Attached | 11 (32.4%) | 23 (67.6%) |
| 2 Unit Apartments | 0 (0.0%) | 67 (100.0%) |
| 3 or 4 Unit Apartments | 0 (0.0%) | 22 (100.0%) |
| 5 to 9 Unit Apartments | 0 (0.0%) | 0 (0.0%) |
| 10 or more Apartments | 0 (0.0%) | 0 (0.0%) |
| Mobile Home / Other | 513 (78.2%) | 143 (21.8%) |
| Total | 942 (61.3%) | 595 (38.7%) |
Housing Structures by Number of Rooms in Lake Isabella
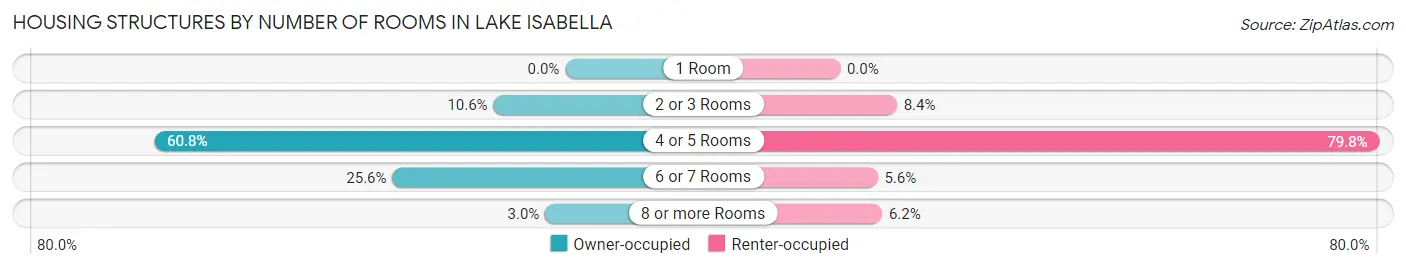
| Number of Rooms | Owner-occupied | Renter-occupied |
| 1 Room | 0 (0.0%) | 0 (0.0%) |
| 2 or 3 Rooms | 100 (10.6%) | 50 (8.4%) |
| 4 or 5 Rooms | 573 (60.8%) | 475 (79.8%) |
| 6 or 7 Rooms | 241 (25.6%) | 33 (5.6%) |
| 8 or more Rooms | 28 (3.0%) | 37 (6.2%) |
| Total | 942 (100.0%) | 595 (100.0%) |
Housing Structure by Heating Type in Lake Isabella
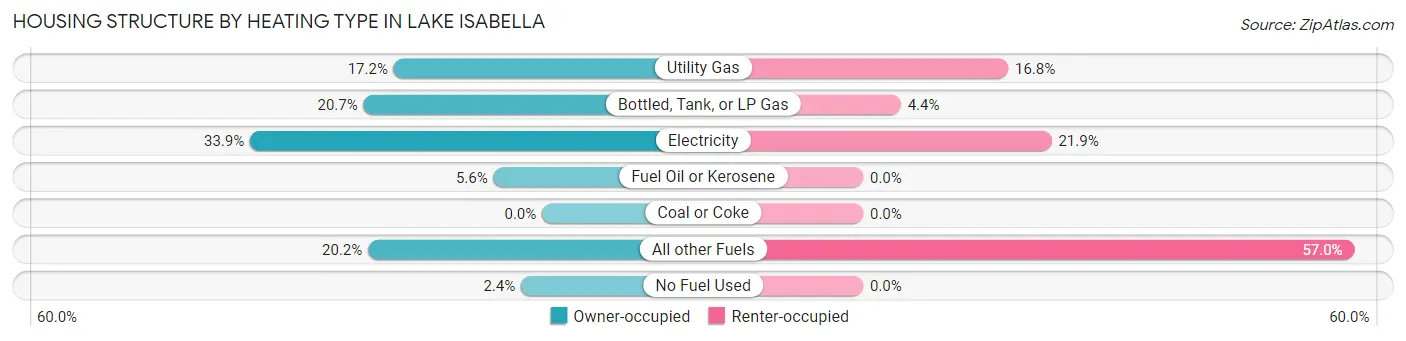
| Heating Type | Owner-occupied | Renter-occupied |
| Utility Gas | 162 (17.2%) | 100 (16.8%) |
| Bottled, Tank, or LP Gas | 195 (20.7%) | 26 (4.4%) |
| Electricity | 319 (33.9%) | 130 (21.8%) |
| Fuel Oil or Kerosene | 53 (5.6%) | 0 (0.0%) |
| Coal or Coke | 0 (0.0%) | 0 (0.0%) |
| All other Fuels | 190 (20.2%) | 339 (57.0%) |
| No Fuel Used | 23 (2.4%) | 0 (0.0%) |
| Total | 942 (100.0%) | 595 (100.0%) |
Household Vehicle Usage in Lake Isabella
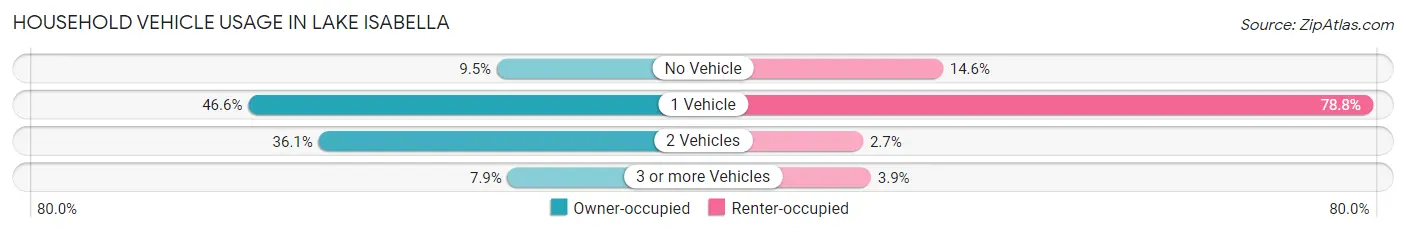
| Vehicles per Household | Owner-occupied | Renter-occupied |
| No Vehicle | 89 (9.5%) | 87 (14.6%) |
| 1 Vehicle | 439 (46.6%) | 469 (78.8%) |
| 2 Vehicles | 340 (36.1%) | 16 (2.7%) |
| 3 or more Vehicles | 74 (7.9%) | 23 (3.9%) |
| Total | 942 (100.0%) | 595 (100.0%) |
Real Estate & Mortgages in Lake Isabella
Real Estate and Mortgage Overview in Lake Isabella
| Characteristic | Without Mortgage | With Mortgage |
| Housing Units | 569 | 373 |
| Median Property Value | $87,800 | $161,000 |
| Median Household Income | $25,224 | $0 |
| Monthly Housing Costs | $482 | $0 |
| Real Estate Taxes | $986 | $0 |
Property Value by Mortgage Status in Lake Isabella
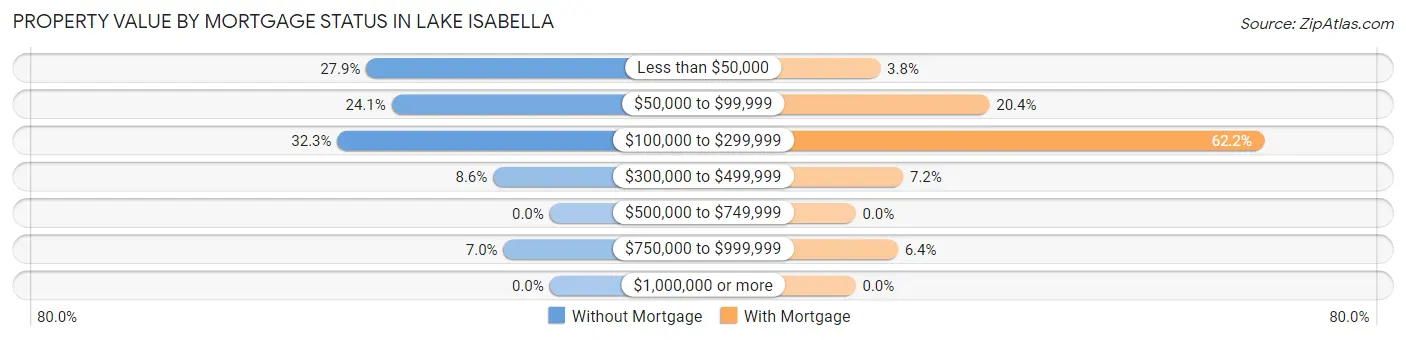
| Property Value | Without Mortgage | With Mortgage |
| Less than $50,000 | 159 (27.9%) | 14 (3.7%) |
| $50,000 to $99,999 | 137 (24.1%) | 76 (20.4%) |
| $100,000 to $299,999 | 184 (32.3%) | 232 (62.2%) |
| $300,000 to $499,999 | 49 (8.6%) | 27 (7.2%) |
| $500,000 to $749,999 | 0 (0.0%) | 0 (0.0%) |
| $750,000 to $999,999 | 40 (7.0%) | 24 (6.4%) |
| $1,000,000 or more | 0 (0.0%) | 0 (0.0%) |
| Total | 569 (100.0%) | 373 (100.0%) |
Household Income by Mortgage Status in Lake Isabella
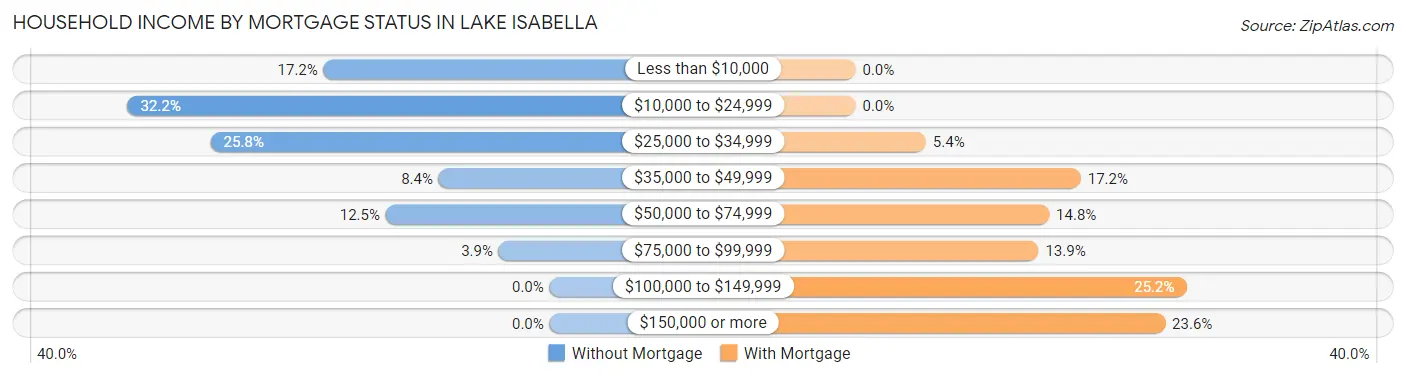
| Household Income | Without Mortgage | With Mortgage |
| Less than $10,000 | 98 (17.2%) | 0 (0.0%) |
| $10,000 to $24,999 | 183 (32.2%) | 0 (0.0%) |
| $25,000 to $34,999 | 147 (25.8%) | 20 (5.4%) |
| $35,000 to $49,999 | 48 (8.4%) | 64 (17.2%) |
| $50,000 to $74,999 | 71 (12.5%) | 55 (14.7%) |
| $75,000 to $99,999 | 22 (3.9%) | 52 (13.9%) |
| $100,000 to $149,999 | 0 (0.0%) | 94 (25.2%) |
| $150,000 or more | 0 (0.0%) | 88 (23.6%) |
| Total | 569 (100.0%) | 373 (100.0%) |
Property Value to Household Income Ratio in Lake Isabella
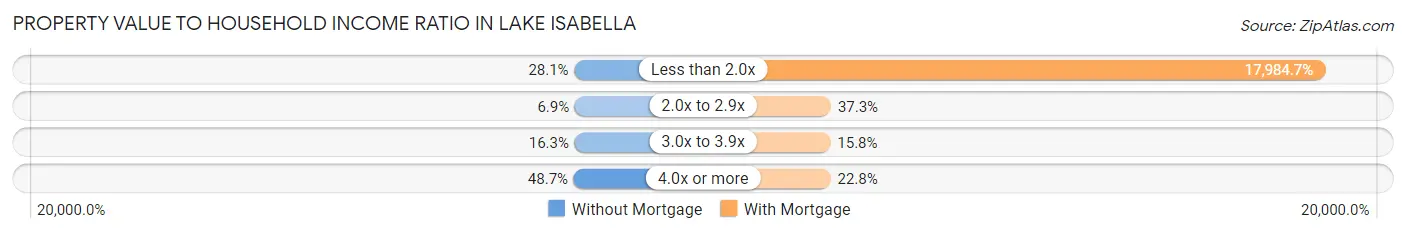
| Value-to-Income Ratio | Without Mortgage | With Mortgage |
| Less than 2.0x | 160 (28.1%) | 67,083 (17,984.7%) |
| 2.0x to 2.9x | 39 (6.9%) | 139 (37.3%) |
| 3.0x to 3.9x | 93 (16.3%) | 59 (15.8%) |
| 4.0x or more | 277 (48.7%) | 85 (22.8%) |
| Total | 569 (100.0%) | 373 (100.0%) |
Real Estate Taxes by Mortgage Status in Lake Isabella
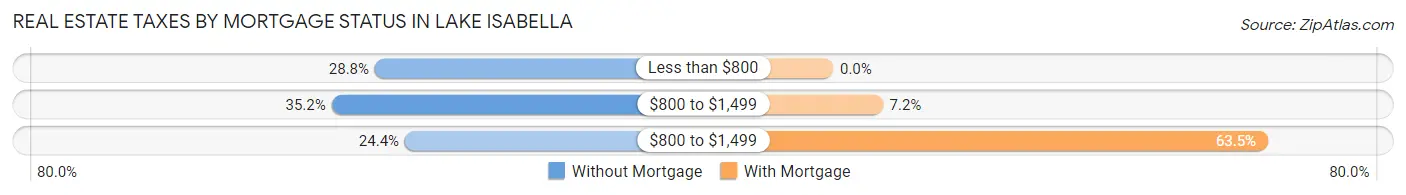
| Property Taxes | Without Mortgage | With Mortgage |
| Less than $800 | 164 (28.8%) | 0 (0.0%) |
| $800 to $1,499 | 200 (35.1%) | 27 (7.2%) |
| $800 to $1,499 | 139 (24.4%) | 237 (63.5%) |
| Total | 569 (100.0%) | 373 (100.0%) |
Health & Disability in Lake Isabella
Health Insurance Coverage by Age in Lake Isabella
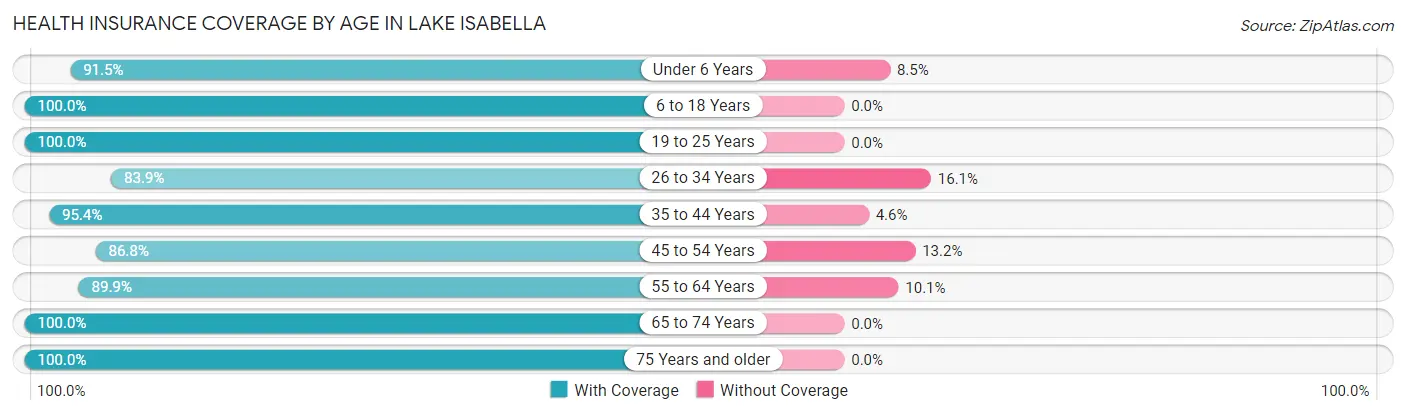
| Age Bracket | With Coverage | Without Coverage |
| Under 6 Years | 215 (91.5%) | 20 (8.5%) |
| 6 to 18 Years | 862 (100.0%) | 0 (0.0%) |
| 19 to 25 Years | 28 (100.0%) | 0 (0.0%) |
| 26 to 34 Years | 291 (83.9%) | 56 (16.1%) |
| 35 to 44 Years | 335 (95.4%) | 16 (4.6%) |
| 45 to 54 Years | 328 (86.8%) | 50 (13.2%) |
| 55 to 64 Years | 553 (89.9%) | 62 (10.1%) |
| 65 to 74 Years | 348 (100.0%) | 0 (0.0%) |
| 75 Years and older | 350 (100.0%) | 0 (0.0%) |
| Total | 3,310 (94.2%) | 204 (5.8%) |
Health Insurance Coverage by Citizenship Status in Lake Isabella
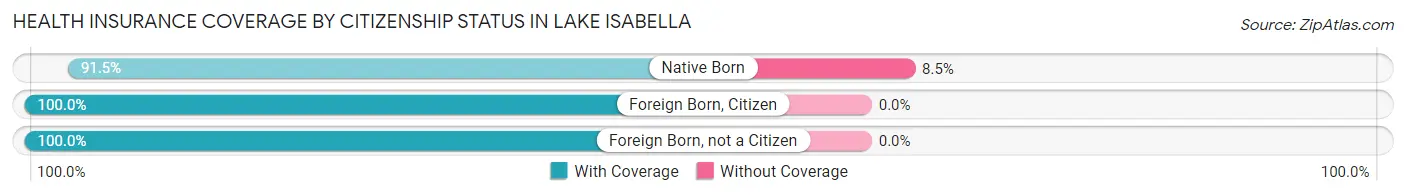
| Citizenship Status | With Coverage | Without Coverage |
| Native Born | 215 (91.5%) | 20 (8.5%) |
| Foreign Born, Citizen | 862 (100.0%) | 0 (0.0%) |
| Foreign Born, not a Citizen | 28 (100.0%) | 0 (0.0%) |
Health Insurance Coverage by Household Income in Lake Isabella
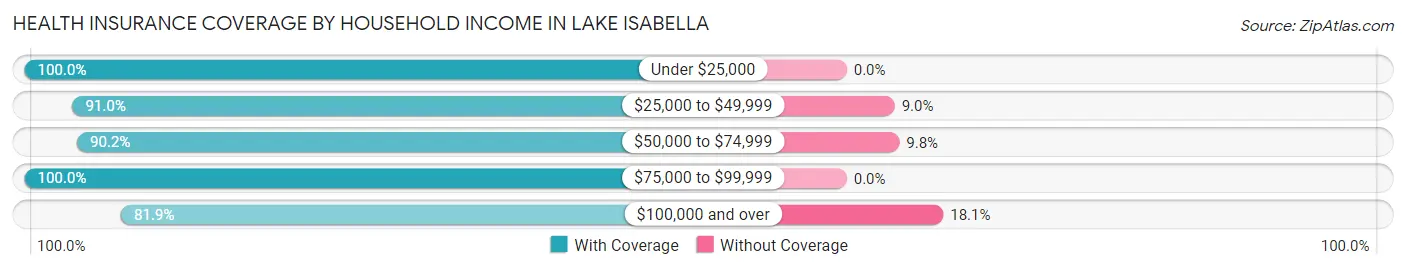
| Household Income | With Coverage | Without Coverage |
| Under $25,000 | 1,216 (100.0%) | 0 (0.0%) |
| $25,000 to $49,999 | 1,206 (91.0%) | 119 (9.0%) |
| $50,000 to $74,999 | 330 (90.2%) | 36 (9.8%) |
| $75,000 to $99,999 | 336 (100.0%) | 0 (0.0%) |
| $100,000 and over | 222 (81.9%) | 49 (18.1%) |
Public vs Private Health Insurance Coverage by Age in Lake Isabella
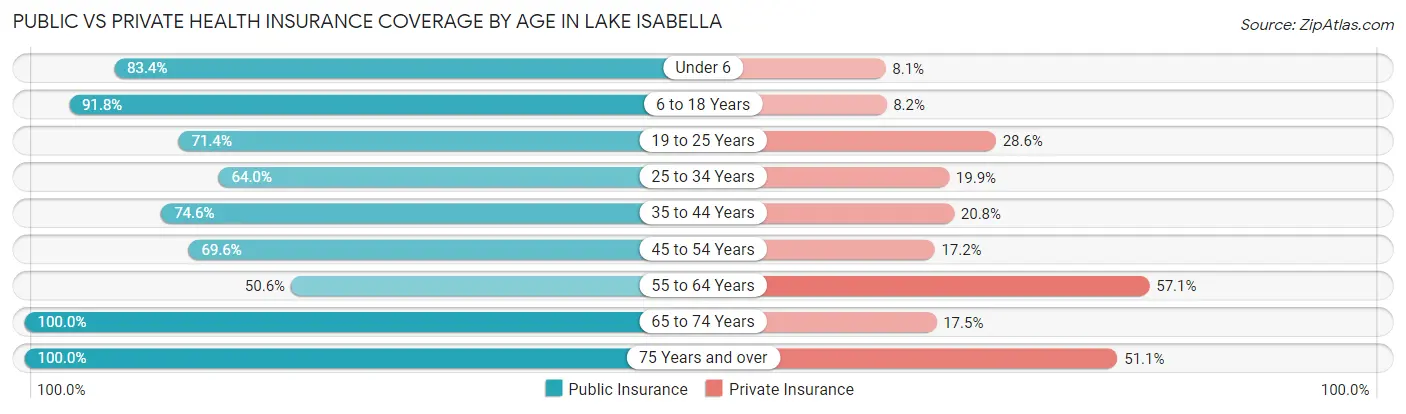
| Age Bracket | Public Insurance | Private Insurance |
| Under 6 | 196 (83.4%) | 19 (8.1%) |
| 6 to 18 Years | 791 (91.8%) | 71 (8.2%) |
| 19 to 25 Years | 20 (71.4%) | 8 (28.6%) |
| 25 to 34 Years | 222 (64.0%) | 69 (19.9%) |
| 35 to 44 Years | 262 (74.6%) | 73 (20.8%) |
| 45 to 54 Years | 263 (69.6%) | 65 (17.2%) |
| 55 to 64 Years | 311 (50.6%) | 351 (57.1%) |
| 65 to 74 Years | 348 (100.0%) | 61 (17.5%) |
| 75 Years and over | 350 (100.0%) | 179 (51.1%) |
| Total | 2,763 (78.6%) | 896 (25.5%) |
Disability Status by Sex by Age in Lake Isabella
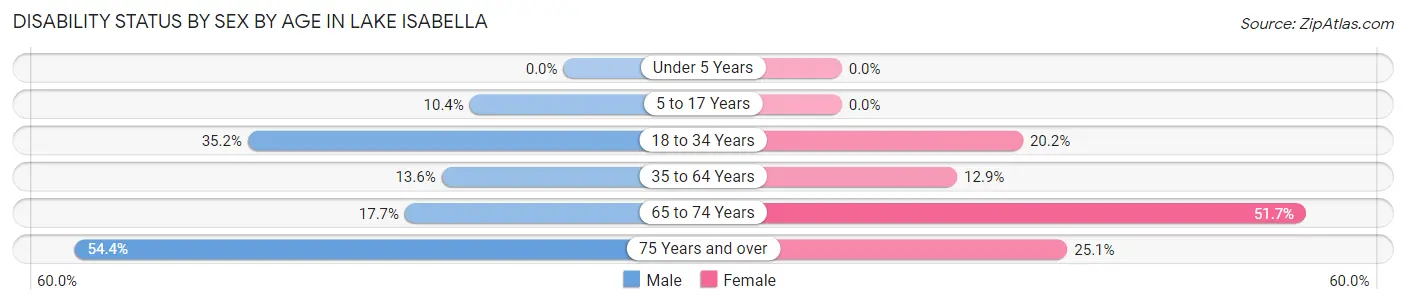
| Age Bracket | Male | Female |
| Under 5 Years | 0 (0.0%) | 0 (0.0%) |
| 5 to 17 Years | 59 (10.4%) | 0 (0.0%) |
| 18 to 34 Years | 58 (35.1%) | 46 (20.2%) |
| 35 to 64 Years | 81 (13.6%) | 96 (12.9%) |
| 65 to 74 Years | 30 (17.6%) | 92 (51.7%) |
| 75 Years and over | 80 (54.4%) | 51 (25.1%) |
Disability Class by Sex by Age in Lake Isabella
Disability Class: Hearing Difficulty
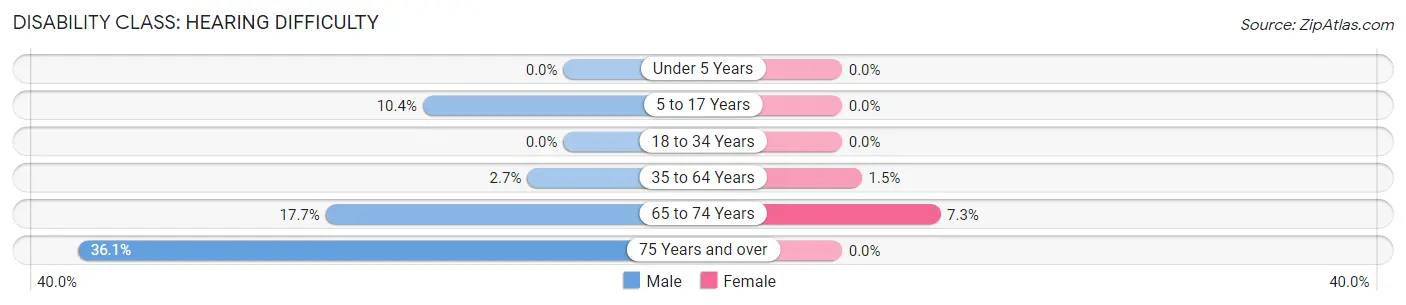
| Age Bracket | Male | Female |
| Under 5 Years | 0 (0.0%) | 0 (0.0%) |
| 5 to 17 Years | 59 (10.4%) | 0 (0.0%) |
| 18 to 34 Years | 0 (0.0%) | 0 (0.0%) |
| 35 to 64 Years | 16 (2.7%) | 11 (1.5%) |
| 65 to 74 Years | 30 (17.6%) | 13 (7.3%) |
| 75 Years and over | 53 (36.0%) | 0 (0.0%) |
Disability Class: Vision Difficulty
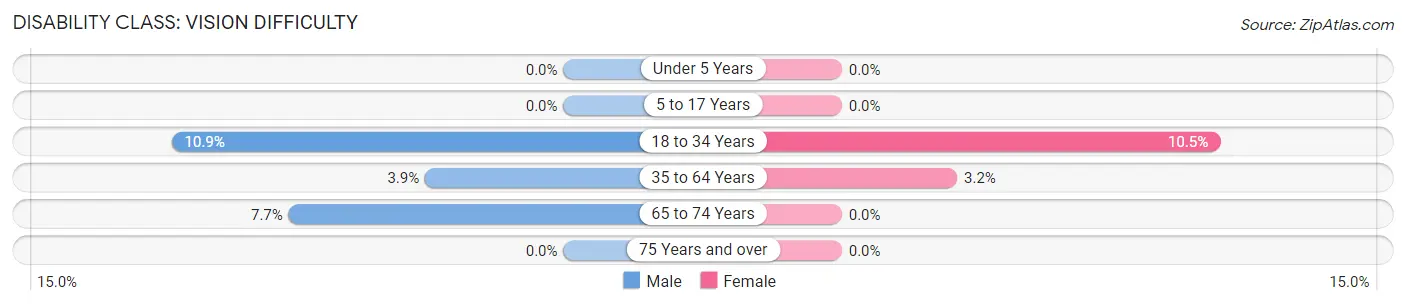
| Age Bracket | Male | Female |
| Under 5 Years | 0 (0.0%) | 0 (0.0%) |
| 5 to 17 Years | 0 (0.0%) | 0 (0.0%) |
| 18 to 34 Years | 18 (10.9%) | 24 (10.5%) |
| 35 to 64 Years | 23 (3.8%) | 24 (3.2%) |
| 65 to 74 Years | 13 (7.6%) | 0 (0.0%) |
| 75 Years and over | 0 (0.0%) | 0 (0.0%) |
Disability Class: Cognitive Difficulty
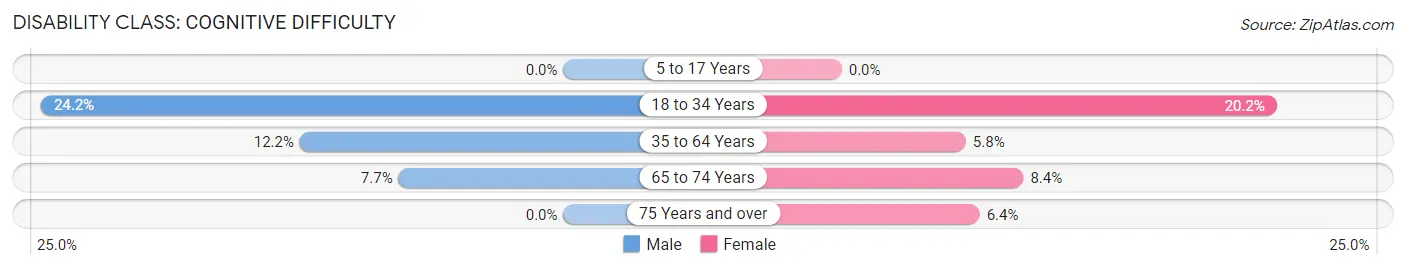
| Age Bracket | Male | Female |
| 5 to 17 Years | 0 (0.0%) | 0 (0.0%) |
| 18 to 34 Years | 40 (24.2%) | 46 (20.2%) |
| 35 to 64 Years | 73 (12.2%) | 43 (5.8%) |
| 65 to 74 Years | 13 (7.6%) | 15 (8.4%) |
| 75 Years and over | 0 (0.0%) | 13 (6.4%) |
Disability Class: Ambulatory Difficulty
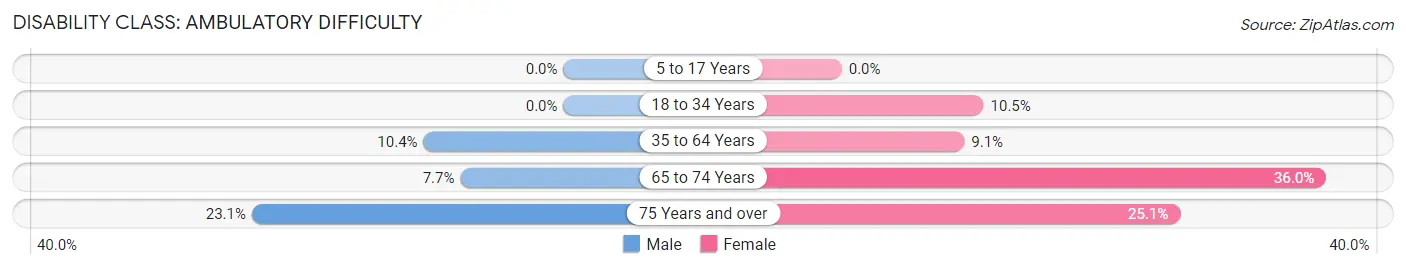
| Age Bracket | Male | Female |
| 5 to 17 Years | 0 (0.0%) | 0 (0.0%) |
| 18 to 34 Years | 0 (0.0%) | 24 (10.5%) |
| 35 to 64 Years | 62 (10.4%) | 68 (9.1%) |
| 65 to 74 Years | 13 (7.6%) | 64 (36.0%) |
| 75 Years and over | 34 (23.1%) | 51 (25.1%) |
Disability Class: Self-Care Difficulty
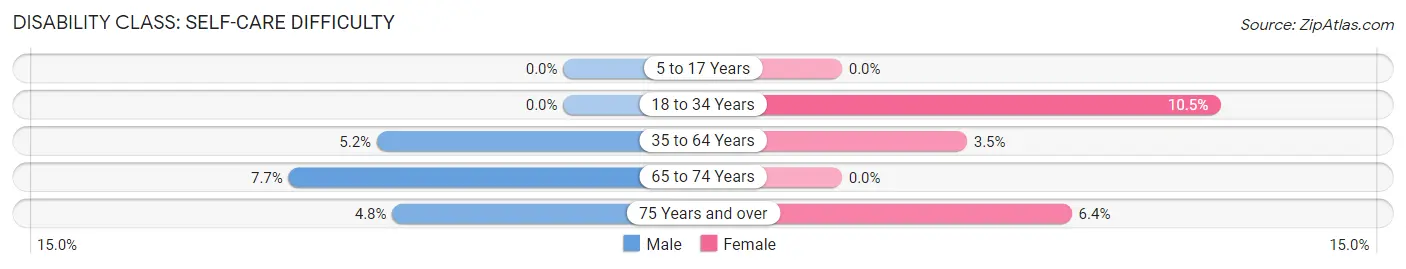
| Age Bracket | Male | Female |
| 5 to 17 Years | 0 (0.0%) | 0 (0.0%) |
| 18 to 34 Years | 0 (0.0%) | 24 (10.5%) |
| 35 to 64 Years | 31 (5.2%) | 26 (3.5%) |
| 65 to 74 Years | 13 (7.6%) | 0 (0.0%) |
| 75 Years and over | 7 (4.8%) | 13 (6.4%) |
Technology Access in Lake Isabella
Computing Device Access in Lake Isabella
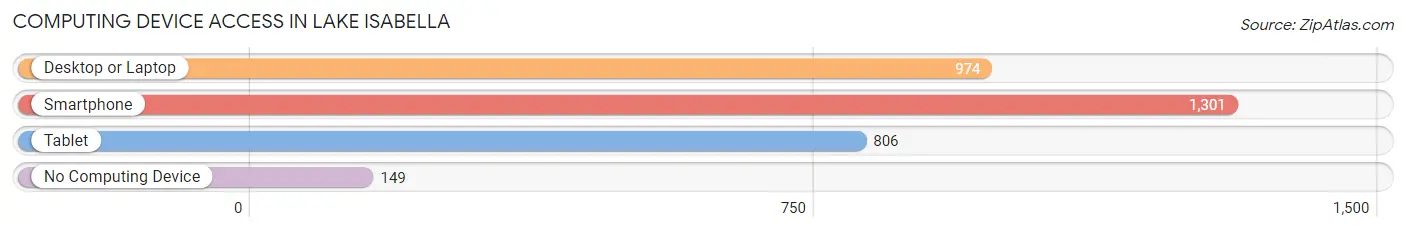
| Device Type | # Households | % Households |
| Desktop or Laptop | 974 | 63.4% |
| Smartphone | 1,301 | 84.7% |
| Tablet | 806 | 52.4% |
| No Computing Device | 149 | 9.7% |
| Total | 1,537 | 100.0% |
Internet Access in Lake Isabella
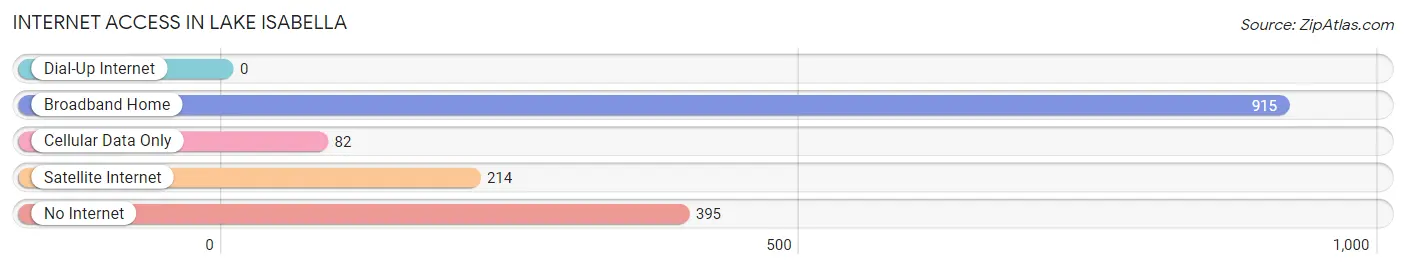
| Internet Type | # Households | % Households |
| Dial-Up Internet | 0 | 0.0% |
| Broadband Home | 915 | 59.5% |
| Cellular Data Only | 82 | 5.3% |
| Satellite Internet | 214 | 13.9% |
| No Internet | 395 | 25.7% |
| Total | 1,537 | 100.0% |
Lake Isabella Summary
Lake Isabella is a census-designated place located in Kern County, California, United States. It is situated in the southern Sierra Nevada, near the Kern River, and is part of the Kern River Valley. The population was 3,466 at the 2010 census, up from 3,315 at the 2000 census.
History
The area around Lake Isabella was first inhabited by the Yokuts and Paiute Native American tribes. The first Europeans to settle in the area were miners and ranchers in the mid-1800s. The town of Isabella was founded in 1867 and named after Isabella Yount, the wife of one of the first settlers.
The town grew rapidly in the late 19th century, and by the early 20th century, it had become a popular tourist destination. The town was destroyed by a flood in December 1937, and the residents were forced to rebuild.
In the 1950s, the area around Lake Isabella was developed for recreation and tourism. The lake was stocked with fish, and a number of resorts and campgrounds were built. The town of Isabella was incorporated in 1962.
Geography
Lake Isabella is located at 35°37'25" North, 118°30'45" West (35.623, -118.512). It is situated in the southern Sierra Nevada, near the Kern River, and is part of the Kern River Valley.
The town is located at an elevation of 2,845 feet (867 m). The area around Lake Isabella is mostly mountainous, with the highest peak in the area being Breckenridge Mountain, which rises to an elevation of 8,717 feet (2,655 m).
Economy
The economy of Lake Isabella is largely based on tourism and recreation. The town is home to a number of resorts, campgrounds, and other tourist attractions. The lake is stocked with fish, and is a popular destination for fishing and boating.
The town is also home to a number of businesses, including restaurants, retail stores, and service providers. The town is also home to a number of government offices, including the Kern County Sheriff's Office and the Kern County Fire Department.
Demographics
As of the 2010 census, there were 3,466 people, 1,521 households, and 945 families residing in the town. The population density was 1,072.3 people per square mile (414.7/km2). There were 1,845 housing units at an average density of 576.3 per square mile (222.7/km2).
The racial makeup of the town was 81.2% White, 0.7% African American, 1.3% Native American, 0.7% Asian, 0.1% Pacific Islander, 13.2% from other races, and 3.0% from two or more races. Hispanic or Latino of any race were 24.2% of the population.
The median income for a household in the town was $30,938, and the median income for a family was $37,813. Males had a median income of $30,938 versus $25,000 for females. The per capita income for the town was $15,945. About 16.2% of families and 19.7% of the population were below the poverty line, including 28.2% of those under age 18 and 8.3% of those age 65 or over.
Common Questions
What is Per Capita Income in Lake Isabella?
Per Capita income in Lake Isabella is $17,569.
What is the Median Family Income in Lake Isabella?
Median Family Income in Lake Isabella is $27,360.
What is the Median Household income in Lake Isabella?
Median Household Income in Lake Isabella is $27,116.
What is Income or Wage Gap in Lake Isabella?
Income or Wage Gap in Lake Isabella is 46.1%.
Women in Lake Isabella earn 53.9 cents for every dollar earned by a man.
What is Inequality or Gini Index in Lake Isabella?
Inequality or Gini Index in Lake Isabella is 0.42.
What is the Total Population of Lake Isabella?
Total Population of Lake Isabella is 3,514.
What is the Total Male Population of Lake Isabella?
Total Male Population of Lake Isabella is 1,736.
What is the Total Female Population of Lake Isabella?
Total Female Population of Lake Isabella is 1,778.
What is the Ratio of Males per 100 Females in Lake Isabella?
There are 97.64 Males per 100 Females in Lake Isabella.
What is the Ratio of Females per 100 Males in Lake Isabella?
There are 102.42 Females per 100 Males in Lake Isabella.
What is the Median Population Age in Lake Isabella?
Median Population Age in Lake Isabella is 40.5 Years.
What is the Average Family Size in Lake Isabella
Average Family Size in Lake Isabella is 2.9 People.
What is the Average Household Size in Lake Isabella
Average Household Size in Lake Isabella is 2.3 People.
How Large is the Labor Force in Lake Isabella?
There are 929 People in the Labor Forcein in Lake Isabella.
What is the Percentage of People in the Labor Force in Lake Isabella?
37.1% of People are in the Labor Force in Lake Isabella.
What is the Unemployment Rate in Lake Isabella?
Unemployment Rate in Lake Isabella is 10.0%.