Cities with the Highest Percentage of Population Employed in Legal Services & Support in New Jersey
RELATED REPORTS & OPTIONS
Legal Services & Support
New Jersey
Compare Cities
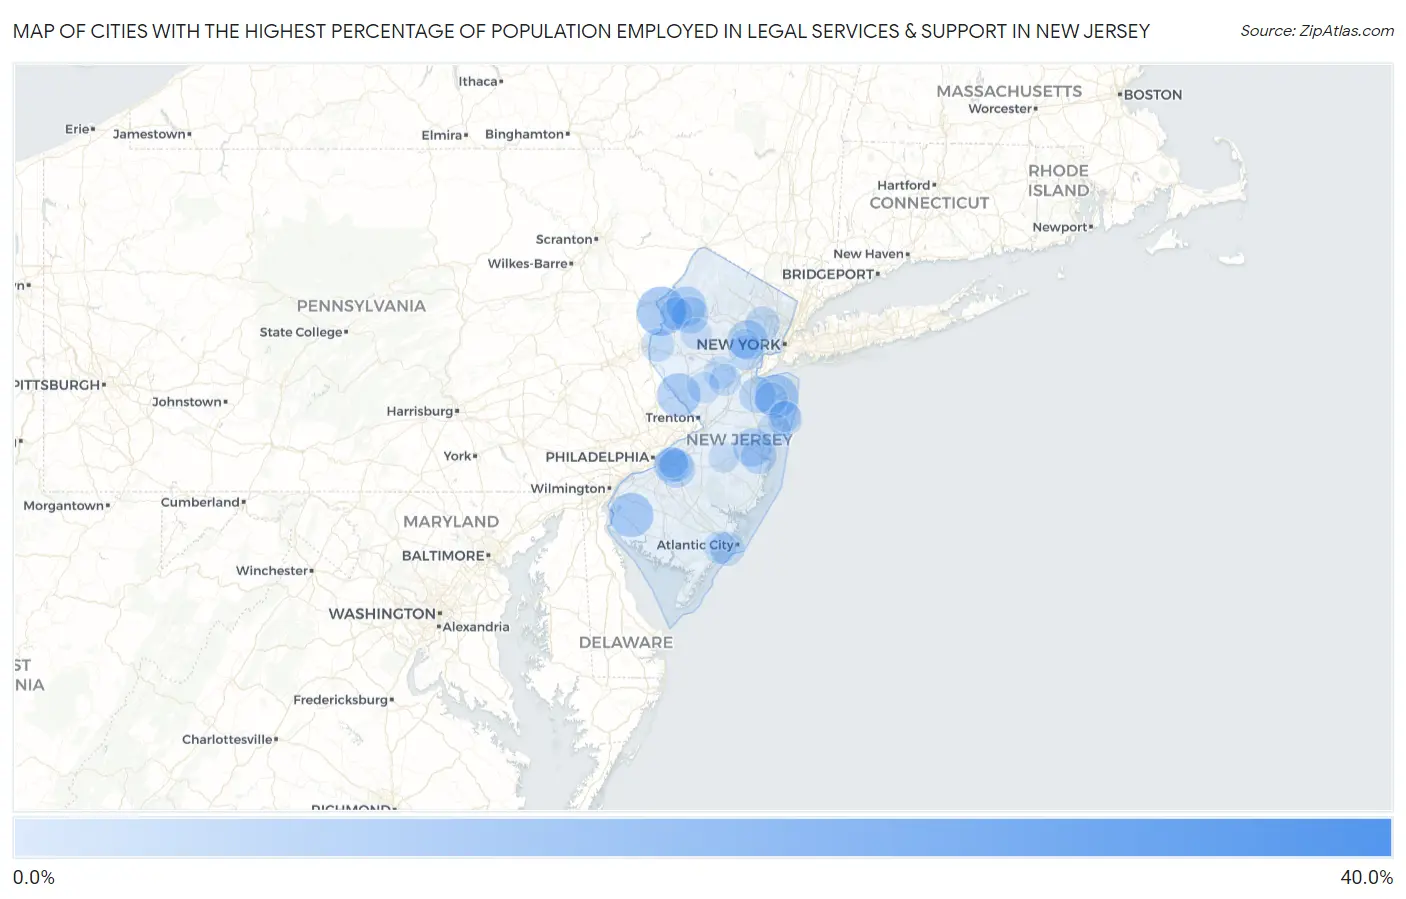
Map of Cities with the Highest Percentage of Population Employed in Legal Services & Support in New Jersey
0.0%
40.0%
Cities with the Highest Percentage of Population Employed in Legal Services & Support in New Jersey
| City | % Employed | vs State | vs National | |
| 1. | Bridgeport | 33.3% | 1.5%(+31.8)#1 | 1.2%(+32.1)#22 |
| 2. | Mount Royal | 17.9% | 1.5%(+16.4)#2 | 1.2%(+16.7)#76 |
| 3. | Stonebridge | 17.3% | 1.5%(+15.7)#3 | 1.2%(+16.1)#79 |
| 4. | Columbia | 13.5% | 1.5%(+11.9)#4 | 1.2%(+12.3)#131 |
| 5. | Alloway | 10.9% | 1.5%(+9.31)#5 | 1.2%(+9.67)#188 |
| 6. | Lambertville | 10.5% | 1.5%(+8.91)#6 | 1.2%(+9.28)#202 |
| 7. | Fairview | 10.3% | 1.5%(+8.76)#7 | 1.2%(+9.13)#209 |
| 8. | Cranford | 9.7% | 1.5%(+8.16)#8 | 1.2%(+8.53)#243 |
| 9. | Surf City Borough | 9.2% | 1.5%(+7.64)#9 | 1.2%(+8.00)#264 |
| 10. | Demarest Borough | 9.0% | 1.5%(+7.47)#10 | 1.2%(+7.84)#272 |
| 11. | Short Hills | 8.4% | 1.5%(+6.88)#11 | 1.2%(+7.25)#310 |
| 12. | Johnsonburg | 8.4% | 1.5%(+6.83)#12 | 1.2%(+7.19)#313 |
| 13. | Peapack And Gladstone Borough | 7.8% | 1.5%(+6.27)#13 | 1.2%(+6.64)#351 |
| 14. | Leisure Knoll | 7.8% | 1.5%(+6.23)#14 | 1.2%(+6.60)#354 |
| 15. | Three Bridges | 7.7% | 1.5%(+6.12)#15 | 1.2%(+6.48)#361 |
| 16. | North Caldwell Borough | 7.6% | 1.5%(+6.10)#16 | 1.2%(+6.46)#364 |
| 17. | New Vernon | 7.5% | 1.5%(+5.97)#17 | 1.2%(+6.33)#375 |
| 18. | Brookside | 7.5% | 1.5%(+5.94)#18 | 1.2%(+6.31)#381 |
| 19. | Springdale | 7.5% | 1.5%(+5.93)#19 | 1.2%(+6.29)#384 |
| 20. | Glen Rock Borough | 7.2% | 1.5%(+5.68)#20 | 1.2%(+6.05)#413 |
| 21. | Haddonfield Borough | 7.2% | 1.5%(+5.67)#21 | 1.2%(+6.03)#414 |
| 22. | Pennington Borough | 7.2% | 1.5%(+5.66)#22 | 1.2%(+6.02)#419 |
| 23. | Panther Valley | 7.1% | 1.5%(+5.60)#23 | 1.2%(+5.96)#425 |
| 24. | Longport Borough | 6.9% | 1.5%(+5.36)#24 | 1.2%(+5.73)#450 |
| 25. | Llewellyn Park | 6.8% | 1.5%(+5.28)#25 | 1.2%(+5.65)#459 |
| 26. | Morganville | 6.7% | 1.5%(+5.18)#26 | 1.2%(+5.55)#468 |
| 27. | Mendham Borough | 6.7% | 1.5%(+5.15)#27 | 1.2%(+5.52)#474 |
| 28. | Mountain Lakes Borough | 6.6% | 1.5%(+5.04)#28 | 1.2%(+5.41)#491 |
| 29. | Haworth Borough | 6.5% | 1.5%(+5.00)#29 | 1.2%(+5.36)#501 |
| 30. | Pleasantdale | 6.5% | 1.5%(+4.92)#30 | 1.2%(+5.29)#517 |
| 31. | Silver Ridge | 6.5% | 1.5%(+4.90)#31 | 1.2%(+5.27)#523 |
| 32. | Hopelawn | 6.4% | 1.5%(+4.88)#32 | 1.2%(+5.25)#528 |
| 33. | Glen Ridge Borough | 6.4% | 1.5%(+4.82)#33 | 1.2%(+5.18)#535 |
| 34. | Barclay | 6.3% | 1.5%(+4.74)#34 | 1.2%(+5.11)#546 |
| 35. | Lyons | 6.2% | 1.5%(+4.61)#35 | 1.2%(+4.98)#571 |
| 36. | Sea Girt Borough | 6.1% | 1.5%(+4.55)#36 | 1.2%(+4.92)#585 |
| 37. | Mantoloking Borough | 6.1% | 1.5%(+4.54)#37 | 1.2%(+4.91)#587 |
| 38. | Westfield | 6.0% | 1.5%(+4.48)#38 | 1.2%(+4.84)#595 |
| 39. | Essex Fells Borough | 6.0% | 1.5%(+4.45)#39 | 1.2%(+4.82)#602 |
| 40. | Florham Park Borough | 5.9% | 1.5%(+4.40)#40 | 1.2%(+4.77)#614 |
| 41. | Liberty Corner | 5.9% | 1.5%(+4.37)#41 | 1.2%(+4.74)#623 |
| 42. | Rockleigh Borough | 5.8% | 1.5%(+4.28)#42 | 1.2%(+4.65)#636 |
| 43. | Upper Montclair | 5.8% | 1.5%(+4.25)#43 | 1.2%(+4.62)#638 |
| 44. | Ocean Grove | 5.7% | 1.5%(+4.19)#44 | 1.2%(+4.55)#654 |
| 45. | Little Silver Borough | 5.6% | 1.5%(+4.06)#45 | 1.2%(+4.42)#682 |
| 46. | Interlaken Borough | 5.6% | 1.5%(+4.02)#46 | 1.2%(+4.39)#695 |
| 47. | Margate City | 5.6% | 1.5%(+4.02)#47 | 1.2%(+4.39)#696 |
| 48. | Greentree | 5.2% | 1.5%(+3.69)#48 | 1.2%(+4.05)#771 |
| 49. | Upper Stewartsville | 5.2% | 1.5%(+3.68)#49 | 1.2%(+4.04)#774 |
| 50. | Sea Bright Borough | 5.2% | 1.5%(+3.67)#50 | 1.2%(+4.03)#778 |
| 51. | Fair Haven Borough | 5.2% | 1.5%(+3.66)#51 | 1.2%(+4.03)#784 |
| 52. | Ho Ho Kus Borough | 5.2% | 1.5%(+3.63)#52 | 1.2%(+4.00)#794 |
| 53. | Allenwood | 5.2% | 1.5%(+3.63)#53 | 1.2%(+4.00)#797 |
| 54. | Grenloch | 5.2% | 1.5%(+3.62)#54 | 1.2%(+3.98)#802 |
| 55. | Basking Ridge | 5.0% | 1.5%(+3.42)#55 | 1.2%(+3.78)#851 |
| 56. | Lincroft | 5.0% | 1.5%(+3.41)#56 | 1.2%(+3.77)#854 |
| 57. | Hope | 4.9% | 1.5%(+3.36)#57 | 1.2%(+3.72)#864 |
| 58. | Westmont | 4.9% | 1.5%(+3.35)#58 | 1.2%(+3.71)#871 |
| 59. | Linwood | 4.9% | 1.5%(+3.33)#59 | 1.2%(+3.69)#882 |
| 60. | Wildwood Crest Borough | 4.8% | 1.5%(+3.27)#60 | 1.2%(+3.64)#898 |
| 61. | Weston | 4.8% | 1.5%(+3.24)#61 | 1.2%(+3.61)#911 |
| 62. | Northvale Borough | 4.6% | 1.5%(+3.06)#62 | 1.2%(+3.43)#980 |
| 63. | Oldwick | 4.6% | 1.5%(+3.05)#63 | 1.2%(+3.42)#983 |
| 64. | Far Hills Borough | 4.5% | 1.5%(+2.97)#64 | 1.2%(+3.34)#1,007 |
| 65. | Six Mile Run | 4.5% | 1.5%(+2.96)#65 | 1.2%(+3.33)#1,010 |
| 66. | Ringoes | 4.5% | 1.5%(+2.96)#66 | 1.2%(+3.32)#1,011 |
| 67. | Watchung Borough | 4.5% | 1.5%(+2.93)#67 | 1.2%(+3.29)#1,019 |
| 68. | Othello | 4.4% | 1.5%(+2.90)#68 | 1.2%(+3.26)#1,035 |
| 69. | Skillman | 4.4% | 1.5%(+2.87)#69 | 1.2%(+3.24)#1,040 |
| 70. | Wenonah Borough | 4.4% | 1.5%(+2.84)#70 | 1.2%(+3.21)#1,048 |
| 71. | Mountainside Borough | 4.3% | 1.5%(+2.76)#71 | 1.2%(+3.13)#1,083 |
| 72. | Seaside Park Borough | 4.2% | 1.5%(+2.68)#72 | 1.2%(+3.04)#1,122 |
| 73. | Alpine Borough | 4.1% | 1.5%(+2.59)#73 | 1.2%(+2.95)#1,159 |
| 74. | Rumson Borough | 4.1% | 1.5%(+2.55)#74 | 1.2%(+2.92)#1,179 |
| 75. | The Hills | 4.1% | 1.5%(+2.53)#75 | 1.2%(+2.90)#1,188 |
| 76. | Loch Arbour | 4.1% | 1.5%(+2.53)#76 | 1.2%(+2.90)#1,190 |
| 77. | Englewood Cliffs Borough | 4.1% | 1.5%(+2.53)#77 | 1.2%(+2.89)#1,194 |
| 78. | Long Valley | 4.1% | 1.5%(+2.51)#78 | 1.2%(+2.87)#1,203 |
| 79. | Garwood Borough | 4.0% | 1.5%(+2.48)#79 | 1.2%(+2.85)#1,215 |
| 80. | Cedar Knolls | 4.0% | 1.5%(+2.47)#80 | 1.2%(+2.84)#1,220 |
| 81. | Chatham Borough | 4.0% | 1.5%(+2.47)#81 | 1.2%(+2.83)#1,222 |
| 82. | Malaga | 4.0% | 1.5%(+2.46)#82 | 1.2%(+2.83)#1,225 |
| 83. | Woodcliff Lake Borough | 4.0% | 1.5%(+2.44)#83 | 1.2%(+2.81)#1,236 |
| 84. | Old Tappan Borough | 3.9% | 1.5%(+2.33)#84 | 1.2%(+2.70)#1,292 |
| 85. | Tenafly Borough | 3.9% | 1.5%(+2.32)#85 | 1.2%(+2.68)#1,298 |
| 86. | Barnegat Light Borough | 3.8% | 1.5%(+2.26)#86 | 1.2%(+2.63)#1,322 |
| 87. | Brielle Borough | 3.8% | 1.5%(+2.21)#87 | 1.2%(+2.58)#1,343 |
| 88. | Country Lake Estates | 3.7% | 1.5%(+2.20)#88 | 1.2%(+2.56)#1,361 |
| 89. | Beach Haven Borough | 3.7% | 1.5%(+2.17)#89 | 1.2%(+2.54)#1,378 |
| 90. | Upper Greenwood Lake | 3.7% | 1.5%(+2.14)#90 | 1.2%(+2.51)#1,404 |
| 91. | Harvey Cedars Borough | 3.7% | 1.5%(+2.14)#91 | 1.2%(+2.50)#1,411 |
| 92. | Kingston Estates | 3.7% | 1.5%(+2.11)#92 | 1.2%(+2.47)#1,428 |
| 93. | Manasquan Borough | 3.6% | 1.5%(+2.07)#93 | 1.2%(+2.44)#1,453 |
| 94. | Oradell Borough | 3.6% | 1.5%(+2.02)#94 | 1.2%(+2.38)#1,491 |
| 95. | Oakland Borough | 3.6% | 1.5%(+2.01)#95 | 1.2%(+2.37)#1,497 |
| 96. | Upper Saddle River Borough | 3.6% | 1.5%(+2.00)#96 | 1.2%(+2.37)#1,499 |
| 97. | Monmouth Beach Borough | 3.6% | 1.5%(+2.00)#97 | 1.2%(+2.37)#1,500 |
| 98. | Shrewsbury Borough | 3.5% | 1.5%(+1.96)#98 | 1.2%(+2.33)#1,524 |
| 99. | Allenhurst Borough | 3.5% | 1.5%(+1.95)#99 | 1.2%(+2.31)#1,541 |
| 100. | Summit | 3.5% | 1.5%(+1.93)#100 | 1.2%(+2.30)#1,554 |
Common Questions
What are the Top 10 Cities with the Highest Percentage of Population Employed in Legal Services & Support in New Jersey?
Top 10 Cities with the Highest Percentage of Population Employed in Legal Services & Support in New Jersey are:
#1
13.5%
#2
10.9%
#3
10.5%
#4
10.3%
#5
8.4%
#6
8.4%
#7
7.8%
#8
7.5%
#9
7.1%
#10
6.7%
What city has the Highest Percentage of Population Employed in Legal Services & Support in New Jersey?
Columbia has the Highest Percentage of Population Employed in Legal Services & Support in New Jersey with 13.5%.
What is the Percentage of Population Employed in Legal Services & Support in the State of New Jersey?
Percentage of Population Employed in Legal Services & Support in New Jersey is 1.5%.
What is the Percentage of Population Employed in Legal Services & Support in the United States?
Percentage of Population Employed in Legal Services & Support in the United States is 1.2%.