Cities with the Highest Percentage of Population Employed in Legal Services & Support in Maryland
RELATED REPORTS & OPTIONS
Legal Services & Support
Maryland
Compare Cities
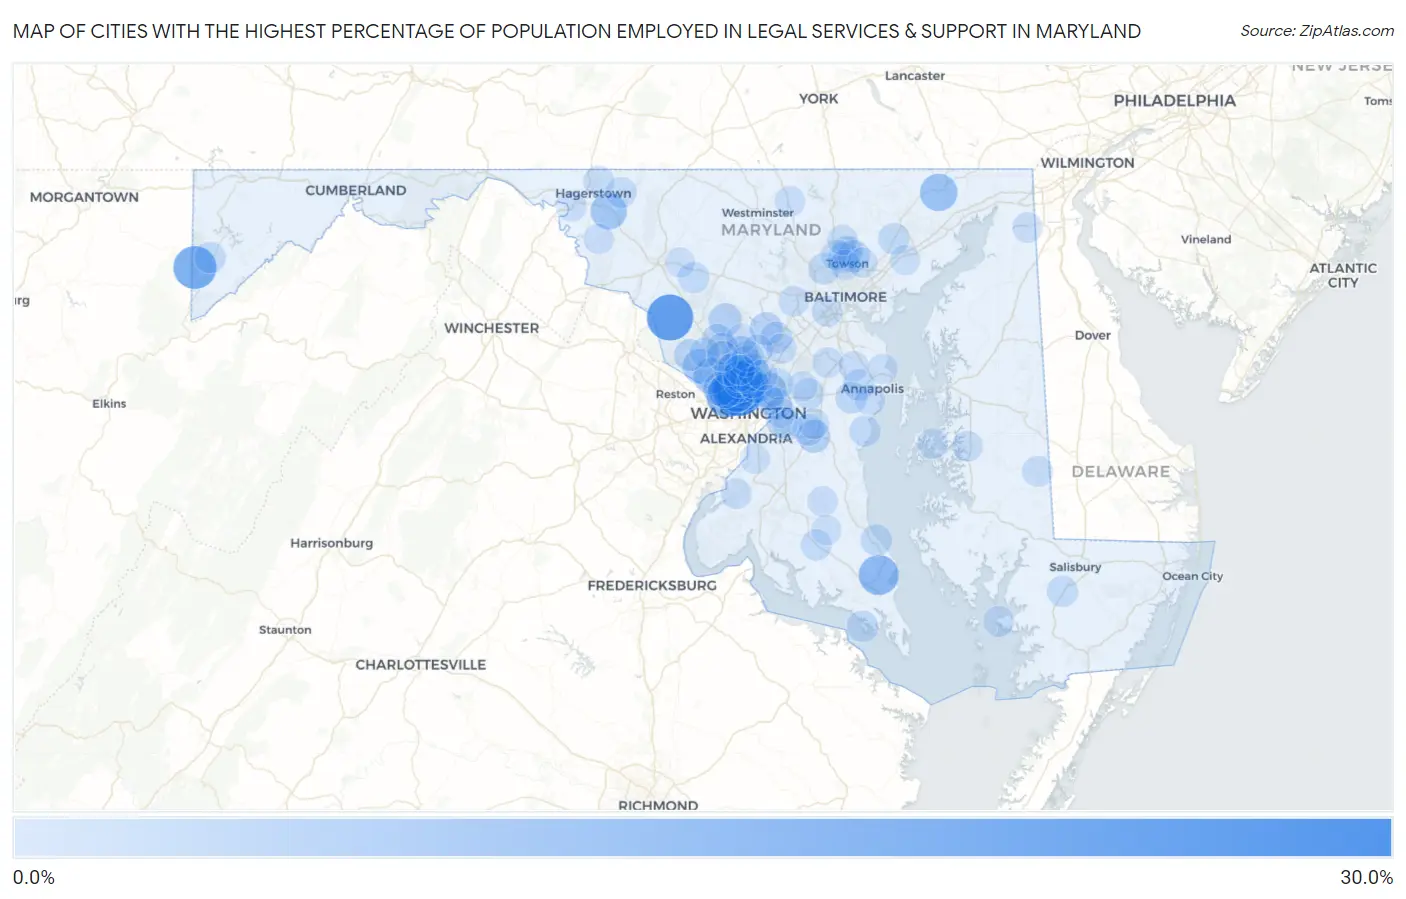
Map of Cities with the Highest Percentage of Population Employed in Legal Services & Support in Maryland
0.0%
30.0%
Cities with the Highest Percentage of Population Employed in Legal Services & Support in Maryland
| City | % Employed | vs State | vs National | |
| 1. | Chevy Chase Village | 25.9% | 1.8%(+24.1)#1 | 1.2%(+24.7)#30 |
| 2. | Chevy Chase Section Three | 25.5% | 1.8%(+23.7)#2 | 1.2%(+24.3)#33 |
| 3. | Barnesville | 21.6% | 1.8%(+19.8)#3 | 1.2%(+20.4)#52 |
| 4. | Somerset | 18.2% | 1.8%(+16.4)#4 | 1.2%(+17.0)#74 |
| 5. | Crellin | 17.7% | 1.8%(+15.9)#5 | 1.2%(+16.5)#77 |
| 6. | Brookmont | 16.4% | 1.8%(+14.7)#6 | 1.2%(+15.2)#88 |
| 7. | Martin S Additions | 14.3% | 1.8%(+12.6)#7 | 1.2%(+13.2)#113 |
| 8. | Solomons | 13.8% | 1.8%(+12.0)#8 | 1.2%(+12.6)#126 |
| 9. | Chevy Chase Section Five | 13.7% | 1.8%(+12.0)#9 | 1.2%(+12.6)#127 |
| 10. | Friendship Heights Village | 12.7% | 1.8%(+10.9)#10 | 1.2%(+11.5)#147 |
| 11. | Garrett Park | 11.4% | 1.8%(+9.61)#11 | 1.2%(+10.2)#172 |
| 12. | Darlington | 11.0% | 1.8%(+9.19)#12 | 1.2%(+9.78)#185 |
| 13. | Chevy Chase | 10.8% | 1.8%(+9.00)#13 | 1.2%(+9.59)#190 |
| 14. | Bethesda | 9.9% | 1.8%(+8.10)#14 | 1.2%(+8.69)#231 |
| 15. | Beaver Creek | 9.6% | 1.8%(+7.80)#15 | 1.2%(+8.39)#247 |
| 16. | South Kensington | 9.5% | 1.8%(+7.71)#16 | 1.2%(+8.30)#253 |
| 17. | Potomac | 9.0% | 1.8%(+7.22)#17 | 1.2%(+7.81)#274 |
| 18. | Kensington | 8.0% | 1.8%(+6.26)#18 | 1.2%(+6.85)#340 |
| 19. | University Park | 8.0% | 1.8%(+6.24)#19 | 1.2%(+6.83)#342 |
| 20. | Travilah | 7.8% | 1.8%(+6.06)#20 | 1.2%(+6.65)#349 |
| 21. | Cabin John | 6.8% | 1.8%(+5.08)#21 | 1.2%(+5.66)#458 |
| 22. | Glen Echo | 6.6% | 1.8%(+4.80)#22 | 1.2%(+5.39)#496 |
| 23. | North Chevy Chase | 6.1% | 1.8%(+4.34)#23 | 1.2%(+4.93)#583 |
| 24. | Forest Glen | 6.1% | 1.8%(+4.32)#24 | 1.2%(+4.91)#586 |
| 25. | Laytonsville | 6.1% | 1.8%(+4.29)#25 | 1.2%(+4.88)#593 |
| 26. | Upper Marlboro | 5.8% | 1.8%(+4.00)#26 | 1.2%(+4.59)#645 |
| 27. | Leisure World | 5.7% | 1.8%(+3.95)#27 | 1.2%(+4.54)#655 |
| 28. | Highland | 5.4% | 1.8%(+3.65)#28 | 1.2%(+4.23)#727 |
| 29. | Four Corners | 4.9% | 1.8%(+3.11)#29 | 1.2%(+3.70)#877 |
| 30. | Hampton | 4.8% | 1.8%(+3.07)#30 | 1.2%(+3.66)#894 |
| 31. | Washington Grove | 4.8% | 1.8%(+2.99)#31 | 1.2%(+3.58)#921 |
| 32. | Lewistown | 4.8% | 1.8%(+2.99)#32 | 1.2%(+3.58)#922 |
| 33. | Darnestown | 4.6% | 1.8%(+2.81)#33 | 1.2%(+3.40)#990 |
| 34. | Derwood | 4.5% | 1.8%(+2.73)#34 | 1.2%(+3.32)#1,015 |
| 35. | Riva | 4.4% | 1.8%(+2.60)#35 | 1.2%(+3.19)#1,052 |
| 36. | Cheverly | 4.4% | 1.8%(+2.59)#36 | 1.2%(+3.18)#1,055 |
| 37. | Fulton | 4.4% | 1.8%(+2.59)#37 | 1.2%(+3.18)#1,061 |
| 38. | North Bethesda | 4.3% | 1.8%(+2.51)#38 | 1.2%(+3.10)#1,095 |
| 39. | Chevy Chase View | 4.2% | 1.8%(+2.42)#39 | 1.2%(+3.01)#1,142 |
| 40. | Takoma Park | 4.1% | 1.8%(+2.31)#40 | 1.2%(+2.90)#1,192 |
| 41. | Parole | 4.0% | 1.8%(+2.20)#41 | 1.2%(+2.79)#1,244 |
| 42. | Berwyn Heights | 4.0% | 1.8%(+2.18)#42 | 1.2%(+2.77)#1,256 |
| 43. | Marlboro Village | 3.9% | 1.8%(+2.17)#43 | 1.2%(+2.75)#1,265 |
| 44. | Kemp Mill | 3.9% | 1.8%(+2.14)#44 | 1.2%(+2.73)#1,275 |
| 45. | Silver Spring | 3.9% | 1.8%(+2.13)#45 | 1.2%(+2.72)#1,278 |
| 46. | Long Beach | 3.9% | 1.8%(+2.13)#46 | 1.2%(+2.72)#1,282 |
| 47. | Pikesville | 3.9% | 1.8%(+2.10)#47 | 1.2%(+2.69)#1,295 |
| 48. | Oakland | 3.9% | 1.8%(+2.09)#48 | 1.2%(+2.68)#1,299 |
| 49. | Tall Timbers | 3.8% | 1.8%(+1.99)#49 | 1.2%(+2.58)#1,344 |
| 50. | Monrovia | 3.7% | 1.8%(+1.96)#50 | 1.2%(+2.54)#1,373 |
| 51. | Fairwood | 3.7% | 1.8%(+1.95)#51 | 1.2%(+2.54)#1,377 |
| 52. | Pleasant Hills | 3.7% | 1.8%(+1.94)#52 | 1.2%(+2.53)#1,387 |
| 53. | Eden | 3.6% | 1.8%(+1.86)#53 | 1.2%(+2.45)#1,436 |
| 54. | Shady Side | 3.5% | 1.8%(+1.75)#54 | 1.2%(+2.34)#1,519 |
| 55. | Layhill | 3.5% | 1.8%(+1.74)#55 | 1.2%(+2.33)#1,522 |
| 56. | Mechanicsville | 3.5% | 1.8%(+1.72)#56 | 1.2%(+2.30)#1,545 |
| 57. | Glenmont | 3.5% | 1.8%(+1.71)#57 | 1.2%(+2.30)#1,552 |
| 58. | Lutherville | 3.5% | 1.8%(+1.69)#58 | 1.2%(+2.28)#1,565 |
| 59. | District Heights | 3.3% | 1.8%(+1.55)#59 | 1.2%(+2.14)#1,666 |
| 60. | Chance | 3.3% | 1.8%(+1.53)#60 | 1.2%(+2.12)#1,682 |
| 61. | Timonium | 3.3% | 1.8%(+1.49)#61 | 1.2%(+2.08)#1,710 |
| 62. | Federalsburg | 3.2% | 1.8%(+1.46)#62 | 1.2%(+2.05)#1,726 |
| 63. | Paramount Long Meadow | 3.2% | 1.8%(+1.46)#63 | 1.2%(+2.05)#1,728 |
| 64. | Arbutus | 3.2% | 1.8%(+1.45)#64 | 1.2%(+2.04)#1,741 |
| 65. | Cavetown | 3.1% | 1.8%(+1.37)#65 | 1.2%(+1.96)#1,811 |
| 66. | Rockville | 3.1% | 1.8%(+1.35)#66 | 1.2%(+1.94)#1,821 |
| 67. | Cloverly | 3.1% | 1.8%(+1.31)#67 | 1.2%(+1.90)#1,846 |
| 68. | Brock Hall | 3.0% | 1.8%(+1.25)#68 | 1.2%(+1.84)#1,906 |
| 69. | Mays Chapel | 3.0% | 1.8%(+1.23)#69 | 1.2%(+1.82)#1,924 |
| 70. | Easton | 3.0% | 1.8%(+1.21)#70 | 1.2%(+1.80)#1,954 |
| 71. | Bryans Road | 2.9% | 1.8%(+1.14)#71 | 1.2%(+1.73)#2,022 |
| 72. | St Michaels | 2.8% | 1.8%(+1.07)#72 | 1.2%(+1.66)#2,082 |
| 73. | Aquasco | 2.8% | 1.8%(+1.07)#73 | 1.2%(+1.66)#2,085 |
| 74. | Ellicott City | 2.8% | 1.8%(+1.06)#74 | 1.2%(+1.65)#2,092 |
| 75. | Williamsport | 2.8% | 1.8%(+1.05)#75 | 1.2%(+1.64)#2,101 |
| 76. | Annapolis Neck | 2.8% | 1.8%(+1.05)#76 | 1.2%(+1.64)#2,105 |
| 77. | Keedysville | 2.8% | 1.8%(+1.04)#77 | 1.2%(+1.63)#2,116 |
| 78. | Odenton | 2.8% | 1.8%(+0.996)#78 | 1.2%(+1.59)#2,168 |
| 79. | Hillandale | 2.8% | 1.8%(+0.990)#79 | 1.2%(+1.58)#2,174 |
| 80. | Towson | 2.7% | 1.8%(+0.972)#80 | 1.2%(+1.56)#2,189 |
| 81. | Herald Harbor | 2.7% | 1.8%(+0.969)#81 | 1.2%(+1.56)#2,193 |
| 82. | Honeygo | 2.7% | 1.8%(+0.961)#82 | 1.2%(+1.55)#2,205 |
| 83. | Seat Pleasant | 2.7% | 1.8%(+0.926)#83 | 1.2%(+1.51)#2,237 |
| 84. | West Laurel | 2.7% | 1.8%(+0.892)#84 | 1.2%(+1.48)#2,272 |
| 85. | Cottage City | 2.6% | 1.8%(+0.867)#85 | 1.2%(+1.46)#2,291 |
| 86. | Cockeysville | 2.6% | 1.8%(+0.825)#86 | 1.2%(+1.41)#2,352 |
| 87. | Chesapeake City | 2.6% | 1.8%(+0.804)#87 | 1.2%(+1.39)#2,375 |
| 88. | Hampstead | 2.6% | 1.8%(+0.779)#88 | 1.2%(+1.37)#2,396 |
| 89. | Glenn Dale | 2.5% | 1.8%(+0.751)#89 | 1.2%(+1.34)#2,428 |
| 90. | Forestville | 2.5% | 1.8%(+0.724)#90 | 1.2%(+1.31)#2,449 |
| 91. | Olney | 2.5% | 1.8%(+0.716)#91 | 1.2%(+1.31)#2,455 |
| 92. | Cape St Claire | 2.5% | 1.8%(+0.692)#92 | 1.2%(+1.28)#2,486 |
| 93. | Carney | 2.5% | 1.8%(+0.684)#93 | 1.2%(+1.27)#2,495 |
| 94. | Fort Washington | 2.4% | 1.8%(+0.658)#94 | 1.2%(+1.25)#2,536 |
| 95. | Golden Beach | 2.4% | 1.8%(+0.645)#95 | 1.2%(+1.23)#2,558 |
| 96. | Spring Ridge | 2.4% | 1.8%(+0.609)#96 | 1.2%(+1.20)#2,606 |
| 97. | North Potomac | 2.4% | 1.8%(+0.601)#97 | 1.2%(+1.19)#2,615 |
| 98. | Joppatowne | 2.4% | 1.8%(+0.588)#98 | 1.2%(+1.18)#2,637 |
| 99. | Ten Mile Creek | 2.3% | 1.8%(+0.571)#99 | 1.2%(+1.16)#2,661 |
| 100. | North Kensington | 2.3% | 1.8%(+0.560)#100 | 1.2%(+1.15)#2,680 |
Common Questions
What are the Top 10 Cities with the Highest Percentage of Population Employed in Legal Services & Support in Maryland?
Top 10 Cities with the Highest Percentage of Population Employed in Legal Services & Support in Maryland are:
#1
25.9%
#2
25.5%
#3
21.6%
#4
18.2%
#5
17.7%
#6
16.4%
#7
14.3%
#8
13.8%
#9
13.7%
#10
12.7%
What city has the Highest Percentage of Population Employed in Legal Services & Support in Maryland?
Chevy Chase Village has the Highest Percentage of Population Employed in Legal Services & Support in Maryland with 25.9%.
What is the Percentage of Population Employed in Legal Services & Support in the State of Maryland?
Percentage of Population Employed in Legal Services & Support in Maryland is 1.8%.
What is the Percentage of Population Employed in Legal Services & Support in the United States?
Percentage of Population Employed in Legal Services & Support in the United States is 1.2%.