Delleker, CA Map & Demographics
Delleker Map
Delleker Overview
$19,058
PER CAPITA INCOME
$63,482
AVG FAMILY INCOME
$50,769
AVG HOUSEHOLD INCOME
0.29
INEQUALITY / GINI INDEX
383
TOTAL POPULATION
240
MALE POPULATION
143
FEMALE POPULATION
167.83
MALES / 100 FEMALES
59.58
FEMALES / 100 MALES
39.6
MEDIAN AGE
5.0
AVG FAMILY SIZE
2.6
AVG HOUSEHOLD SIZE
103
LABOR FORCE [ PEOPLE ]
38.9%
PERCENT IN LABOR FORCE
33.0%
UNEMPLOYMENT RATE
Income in Delleker
Income Overview in Delleker
Per Capita Income in Delleker is $19,058, while median incomes of families and households are $63,482 and $50,769 respectively.
| Characteristic | Number | Measure |
| Per Capita Income | 383 | $19,058 |
| Median Family Income | 59 | $63,482 |
| Mean Family Income | 59 | $59,669 |
| Median Household Income | 146 | $50,769 |
| Mean Household Income | 146 | $50,967 |
| Income Deficit | 59 | $0 |
| Wage / Income Gap (%) | 383 | 0.00% |
| Wage / Income Gap ($) | 383 | 100.00¢ per $1 |
| Gini / Inequality Index | 383 | 0.29 |
Earnings by Sex in Delleker
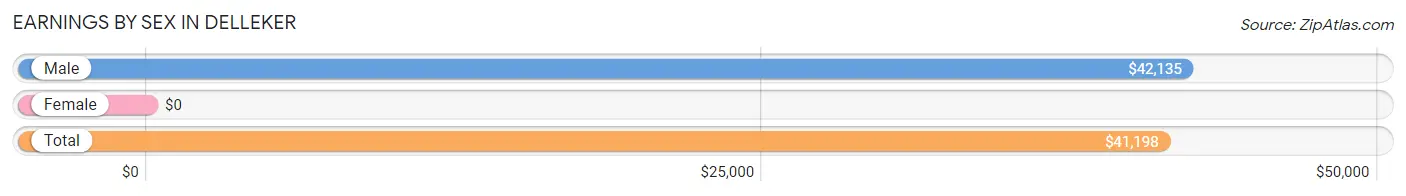
| Sex | Number | Average Earnings |
| Male | 51 (73.9%) | $42,135 |
| Female | 18 (26.1%) | $0 |
| Total | 69 (100.0%) | $41,198 |
Earnings by Sex by Income Bracket in Delleker
The most common earnings brackets in Delleker are $40,000 to $44,999 for men (35 | 68.6%) and $22,500 to $24,999 for women (14 | 77.8%).
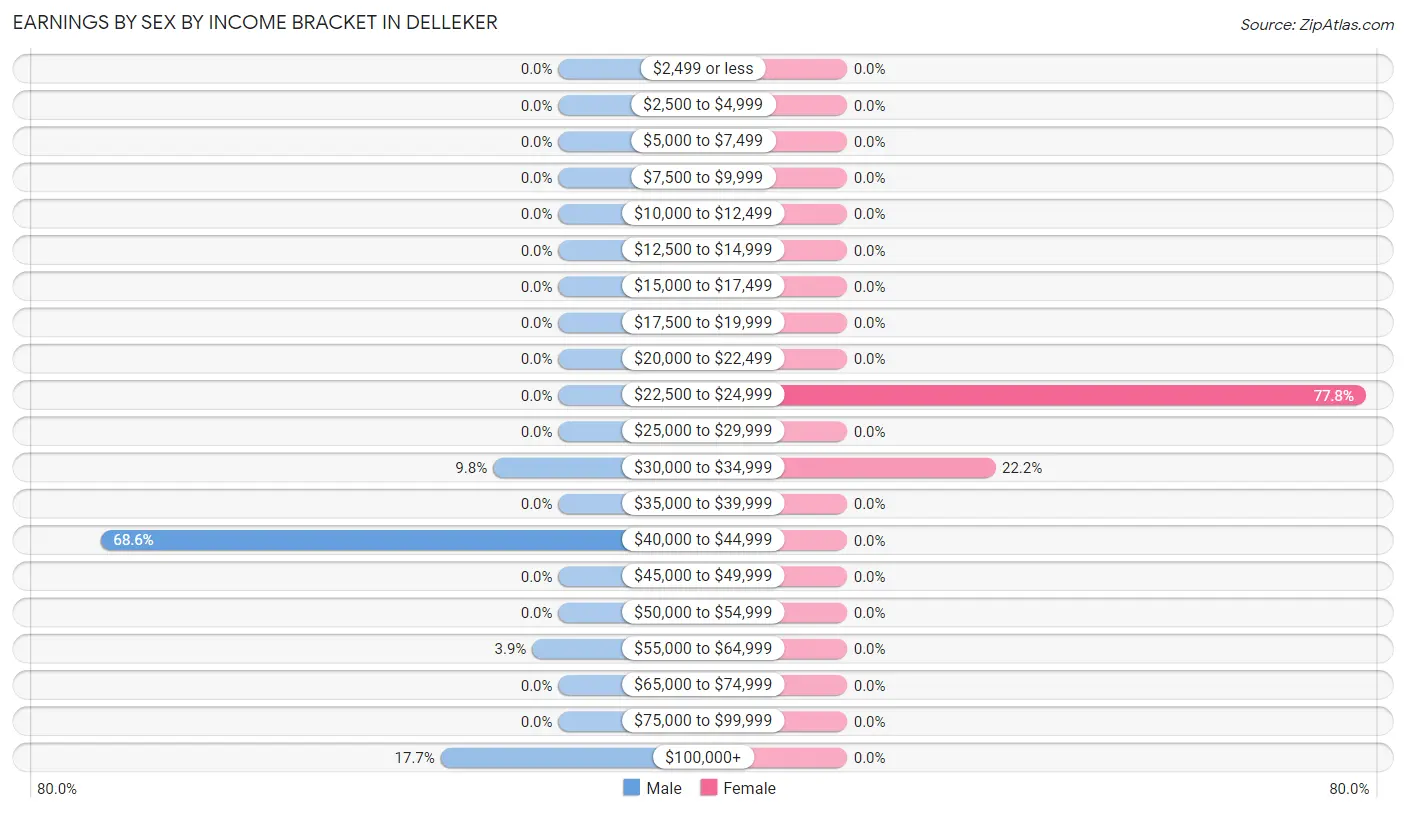
| Income | Male | Female |
| $2,499 or less | 0 (0.0%) | 0 (0.0%) |
| $2,500 to $4,999 | 0 (0.0%) | 0 (0.0%) |
| $5,000 to $7,499 | 0 (0.0%) | 0 (0.0%) |
| $7,500 to $9,999 | 0 (0.0%) | 0 (0.0%) |
| $10,000 to $12,499 | 0 (0.0%) | 0 (0.0%) |
| $12,500 to $14,999 | 0 (0.0%) | 0 (0.0%) |
| $15,000 to $17,499 | 0 (0.0%) | 0 (0.0%) |
| $17,500 to $19,999 | 0 (0.0%) | 0 (0.0%) |
| $20,000 to $22,499 | 0 (0.0%) | 0 (0.0%) |
| $22,500 to $24,999 | 0 (0.0%) | 14 (77.8%) |
| $25,000 to $29,999 | 0 (0.0%) | 0 (0.0%) |
| $30,000 to $34,999 | 5 (9.8%) | 4 (22.2%) |
| $35,000 to $39,999 | 0 (0.0%) | 0 (0.0%) |
| $40,000 to $44,999 | 35 (68.6%) | 0 (0.0%) |
| $45,000 to $49,999 | 0 (0.0%) | 0 (0.0%) |
| $50,000 to $54,999 | 0 (0.0%) | 0 (0.0%) |
| $55,000 to $64,999 | 2 (3.9%) | 0 (0.0%) |
| $65,000 to $74,999 | 0 (0.0%) | 0 (0.0%) |
| $75,000 to $99,999 | 0 (0.0%) | 0 (0.0%) |
| $100,000+ | 9 (17.6%) | 0 (0.0%) |
| Total | 51 (100.0%) | 18 (100.0%) |
Earnings by Sex by Educational Attainment in Delleker
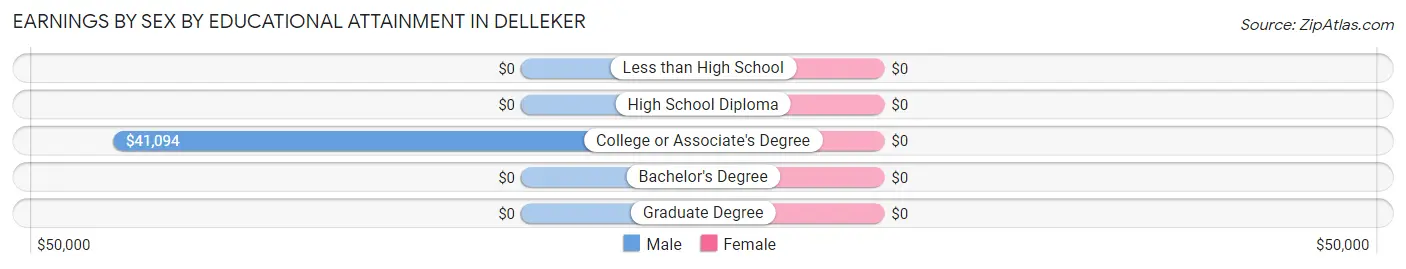
| Educational Attainment | Male Income | Female Income |
| Less than High School | - | - |
| High School Diploma | - | - |
| College or Associate's Degree | $41,094 | $0 |
| Bachelor's Degree | - | - |
| Graduate Degree | - | - |
| Total | $42,135 | $0 |
Family Income in Delleker
Family Income Brackets in Delleker
According to the Delleker family income data, there are 21 families falling into the $75,000 to $99,999 income range, which is the most common income bracket and makes up 35.6% of all families.
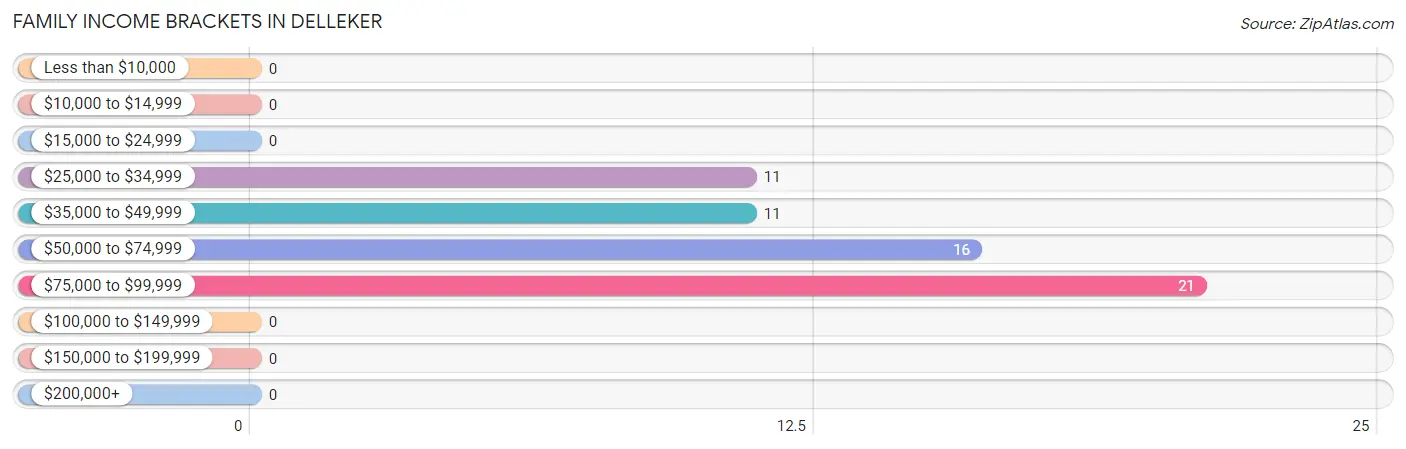
| Income Bracket | # Families | % Families |
| Less than $10,000 | 0 | 0.0% |
| $10,000 to $14,999 | 0 | 0.0% |
| $15,000 to $24,999 | 0 | 0.0% |
| $25,000 to $34,999 | 11 | 18.6% |
| $35,000 to $49,999 | 11 | 18.6% |
| $50,000 to $74,999 | 16 | 27.1% |
| $75,000 to $99,999 | 21 | 35.6% |
| $100,000 to $149,999 | 0 | 0.0% |
| $150,000 to $199,999 | 0 | 0.0% |
| $200,000+ | 0 | 0.0% |
Family Income by Famaliy Size in Delleker
| Income Bracket | # Families | Median Income |
| 2-Person Families | 17 (28.8%) | $0 |
| 3-Person Families | 13 (22.0%) | $0 |
| 4-Person Families | 0 (0.0%) | $0 |
| 5-Person Families | 25 (42.4%) | $0 |
| 6-Person Families | 4 (6.8%) | $0 |
| 7+ Person Families | 0 (0.0%) | $0 |
| Total | 59 (100.0%) | $63,482 |
Family Income by Number of Earners in Delleker
| Number of Earners | # Families | Median Income |
| No Earners | 28 (47.5%) | $0 |
| 1 Earner | 13 (22.0%) | $0 |
| 2 Earners | 18 (30.5%) | $0 |
| 3+ Earners | 0 (0.0%) | $0 |
| Total | 59 (100.0%) | $63,482 |
Household Income in Delleker
Household Income Brackets in Delleker
With 55 households falling in the category, the $50,000 to $74,999 income range is the most frequent in Delleker, accounting for 37.7% of all households.
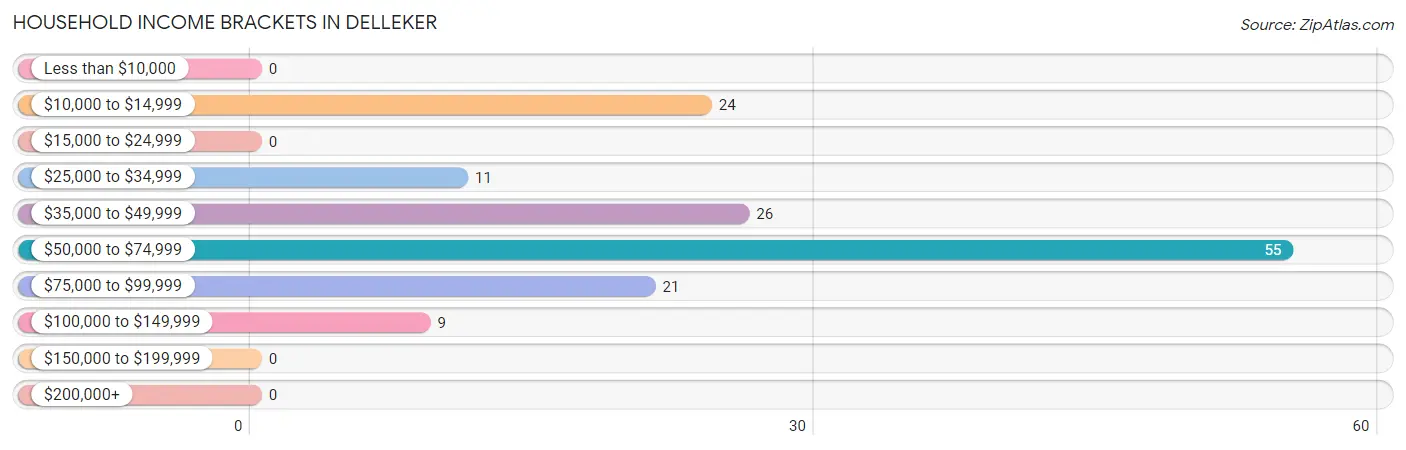
| Income Bracket | # Households | % Households |
| Less than $10,000 | 0 | 0.0% |
| $10,000 to $14,999 | 24 | 16.4% |
| $15,000 to $24,999 | 0 | 0.0% |
| $25,000 to $34,999 | 11 | 7.5% |
| $35,000 to $49,999 | 26 | 17.8% |
| $50,000 to $74,999 | 55 | 37.7% |
| $75,000 to $99,999 | 21 | 14.4% |
| $100,000 to $149,999 | 9 | 6.2% |
| $150,000 to $199,999 | 0 | 0.0% |
| $200,000+ | 0 | 0.0% |
Household Income by Householder Age in Delleker
The median household income in Delleker is $50,769, with the highest median household income of $63,125 found in the 25 to 44 years age bracket for the primary householder. A total of 29 households (19.9%) fall into this category.
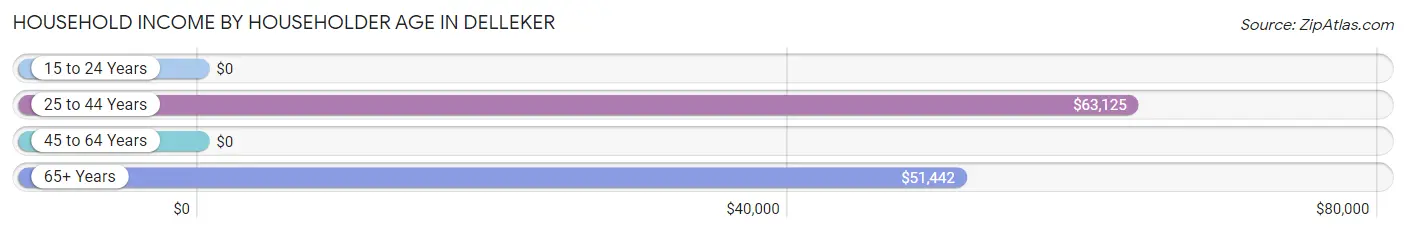
| Income Bracket | # Households | Median Income |
| 15 to 24 Years | 0 (0.0%) | $0 |
| 25 to 44 Years | 29 (19.9%) | $63,125 |
| 45 to 64 Years | 50 (34.3%) | $0 |
| 65+ Years | 67 (45.9%) | $51,442 |
| Total | 146 (100.0%) | $50,769 |
Poverty in Delleker
Income Below Poverty by Sex and Age in Delleker
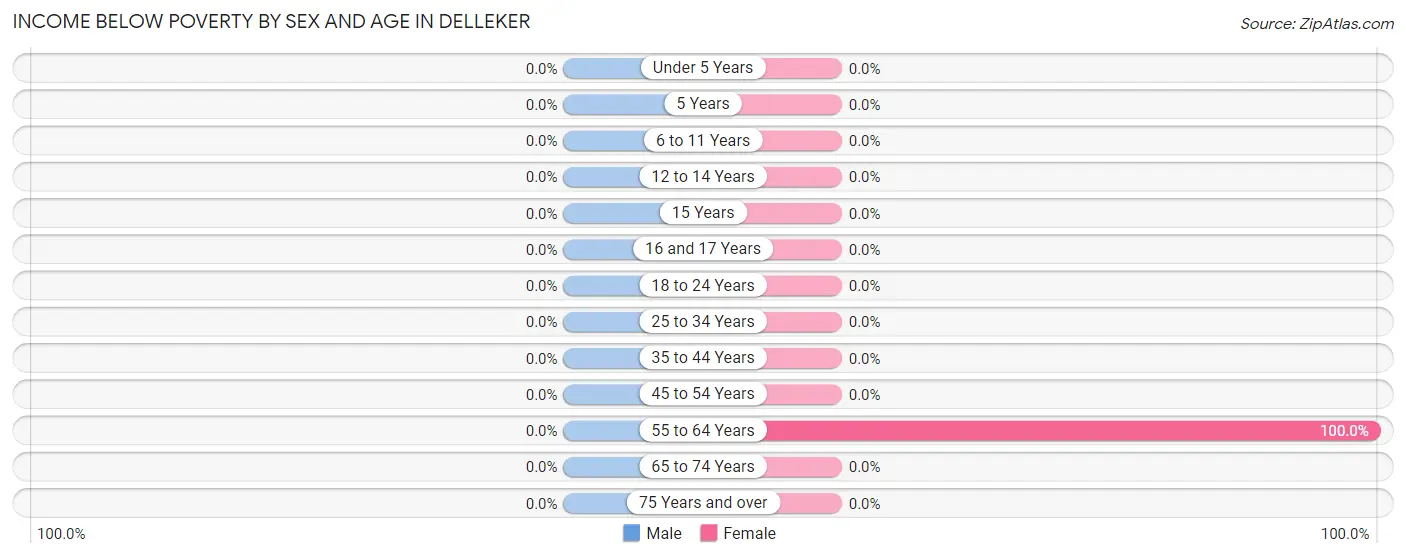
| Age Bracket | Male | Female |
| Under 5 Years | 0 (0.0%) | 0 (0.0%) |
| 5 Years | 0 (0.0%) | 0 (0.0%) |
| 6 to 11 Years | 0 (0.0%) | 0 (0.0%) |
| 12 to 14 Years | 0 (0.0%) | 0 (0.0%) |
| 15 Years | 0 (0.0%) | 0 (0.0%) |
| 16 and 17 Years | 0 (0.0%) | 0 (0.0%) |
| 18 to 24 Years | 0 (0.0%) | 0 (0.0%) |
| 25 to 34 Years | 0 (0.0%) | 0 (0.0%) |
| 35 to 44 Years | 0 (0.0%) | 0 (0.0%) |
| 45 to 54 Years | 0 (0.0%) | 0 (0.0%) |
| 55 to 64 Years | 0 (0.0%) | 24 (100.0%) |
| 65 to 74 Years | 0 (0.0%) | 0 (0.0%) |
| 75 Years and over | 0 (0.0%) | 0 (0.0%) |
| Total | 0 (0.0%) | 24 (16.8%) |
Income Above Poverty by Sex and Age in Delleker
According to the poverty statistics in Delleker, males aged under 5 years and females aged under 5 years are the age groups that are most secure financially, with 100.0% of males and 100.0% of females in these age groups living above the poverty line.
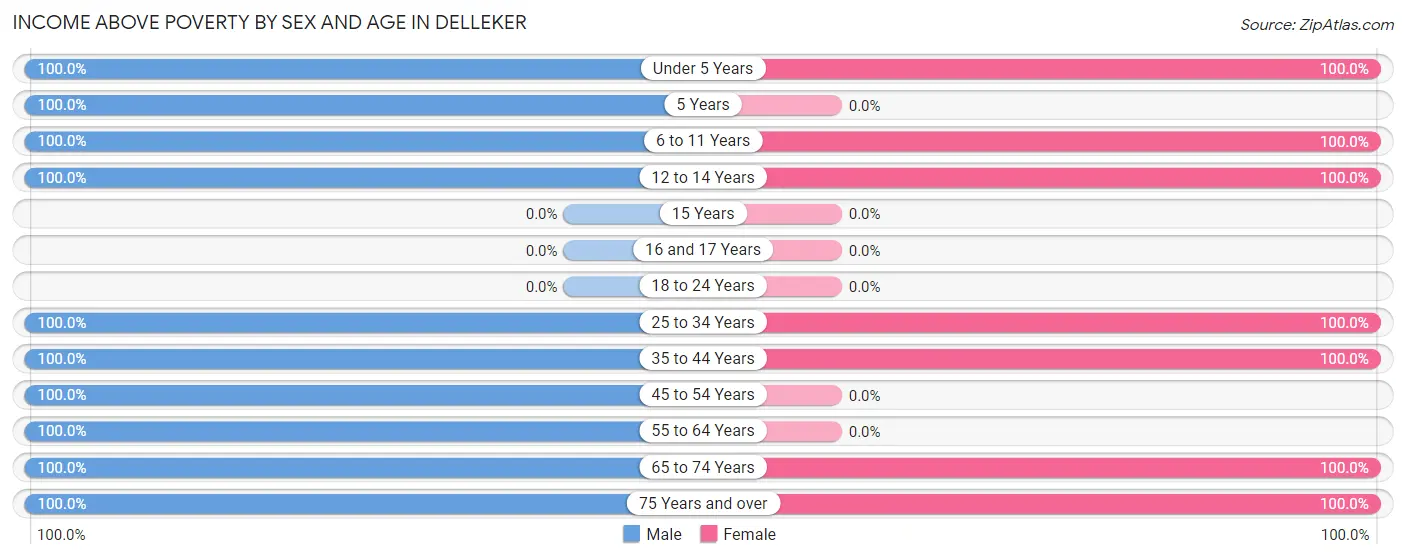
| Age Bracket | Male | Female |
| Under 5 Years | 12 (100.0%) | 10 (100.0%) |
| 5 Years | 2 (100.0%) | 0 (0.0%) |
| 6 to 11 Years | 77 (100.0%) | 2 (100.0%) |
| 12 to 14 Years | 2 (100.0%) | 13 (100.0%) |
| 15 Years | 0 (0.0%) | 0 (0.0%) |
| 16 and 17 Years | 0 (0.0%) | 0 (0.0%) |
| 18 to 24 Years | 0 (0.0%) | 0 (0.0%) |
| 25 to 34 Years | 9 (100.0%) | 46 (100.0%) |
| 35 to 44 Years | 22 (100.0%) | 4 (100.0%) |
| 45 to 54 Years | 49 (100.0%) | 0 (0.0%) |
| 55 to 64 Years | 11 (100.0%) | 0 (0.0%) |
| 65 to 74 Years | 17 (100.0%) | 16 (100.0%) |
| 75 Years and over | 39 (100.0%) | 28 (100.0%) |
| Total | 240 (100.0%) | 119 (83.2%) |
Income Below Poverty Among Married-Couple Families in Delleker
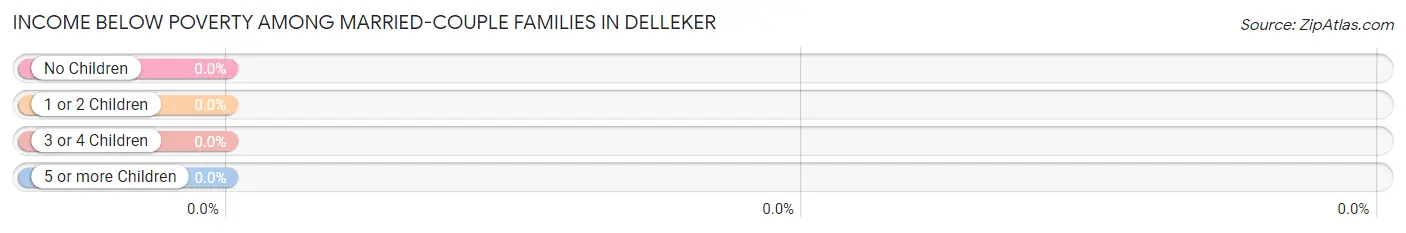
| Children | Above Poverty | Below Poverty |
| No Children | 17 (100.0%) | 0 (0.0%) |
| 1 or 2 Children | 0 (0.0%) | 0 (0.0%) |
| 3 or 4 Children | 29 (100.0%) | 0 (0.0%) |
| 5 or more Children | 0 (0.0%) | 0 (0.0%) |
| Total | 46 (100.0%) | 0 (0.0%) |
Income Below Poverty Among Single-Parent Households in Delleker
| Children | Single Father | Single Mother |
| No Children | 0 (0.0%) | 0 (0.0%) |
| 1 or 2 Children | 0 (0.0%) | 0 (0.0%) |
| 3 or 4 Children | 0 (0.0%) | 0 (0.0%) |
| 5 or more Children | 0 (0.0%) | 0 (0.0%) |
| Total | 0 (0.0%) | 0 (0.0%) |
Income Below Poverty Among Married-Couple vs Single-Parent Households in Delleker
| Children | Married-Couple Families | Single-Parent Households |
| No Children | 0 (0.0%) | 0 (0.0%) |
| 1 or 2 Children | 0 (0.0%) | 0 (0.0%) |
| 3 or 4 Children | 0 (0.0%) | 0 (0.0%) |
| 5 or more Children | 0 (0.0%) | 0 (0.0%) |
| Total | 0 (0.0%) | 0 (0.0%) |
Race in Delleker
The most populous races in Delleker are White / Caucasian (268 | 70.0%), Hispanic or Latino (115 | 30.0%), and Native / Alaskan (115 | 30.0%).
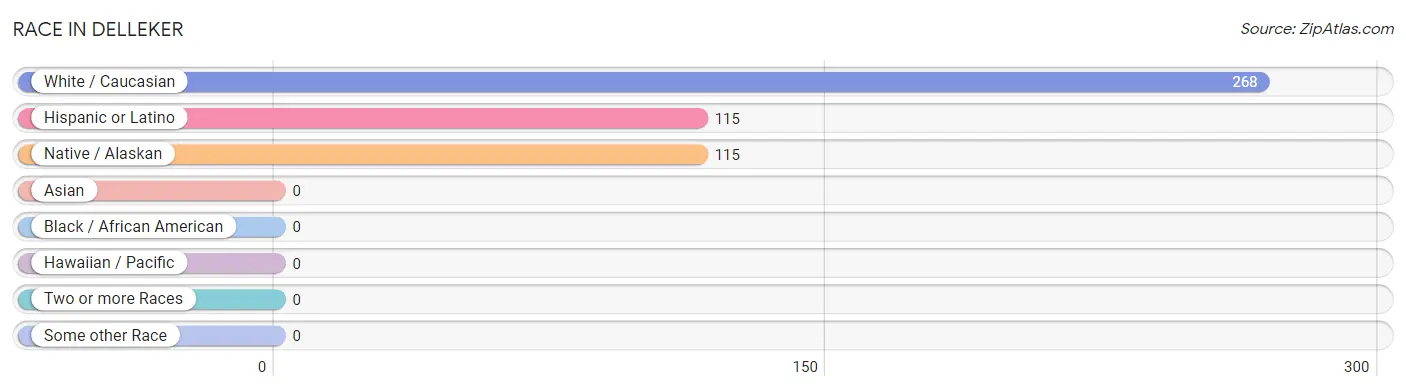
| Race | # Population | % Population |
| Asian | 0 | 0.0% |
| Black / African American | 0 | 0.0% |
| Hawaiian / Pacific | 0 | 0.0% |
| Hispanic or Latino | 115 | 30.0% |
| Native / Alaskan | 115 | 30.0% |
| White / Caucasian | 268 | 70.0% |
| Two or more Races | 0 | 0.0% |
| Some other Race | 0 | 0.0% |
| Total | 383 | 100.0% |
Ancestry in Delleker
The most populous ancestries reported in Delleker are Mexican (115 | 30.0%), Pima (115 | 30.0%), English (96 | 25.1%), European (53 | 13.8%), and Irish (39 | 10.2%), together accounting for 109.1% of all Delleker residents.
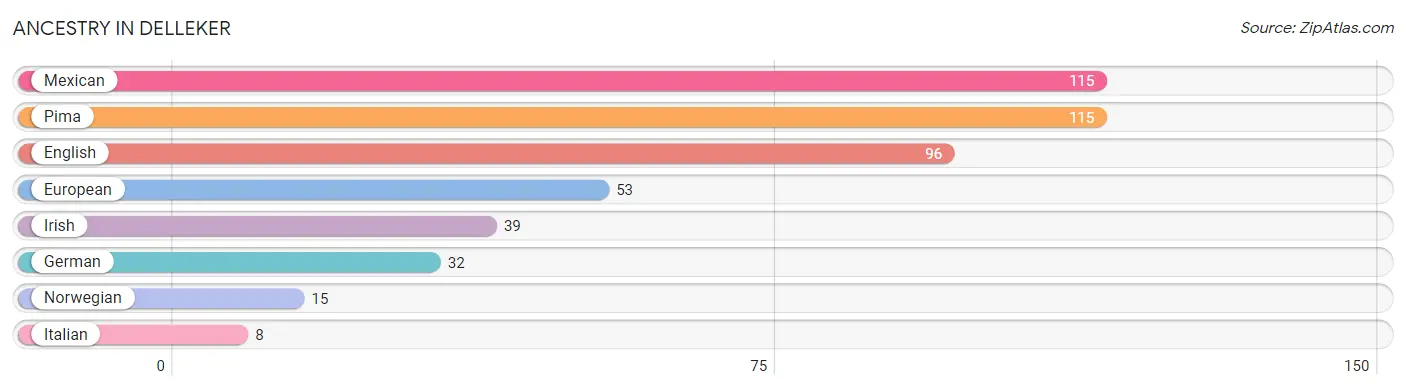
| Ancestry | # Population | % Population |
| English | 96 | 25.1% |
| European | 53 | 13.8% |
| German | 32 | 8.4% |
| Irish | 39 | 10.2% |
| Italian | 8 | 2.1% |
| Mexican | 115 | 30.0% |
| Norwegian | 15 | 3.9% |
| Pima | 115 | 30.0% | View All 8 Rows |
Immigrants in Delleker
The most numerous immigrant groups reported in Delleker came from Central America (43 | 11.2%), Latin America (43 | 11.2%), and Mexico (43 | 11.2%), together accounting for 33.7% of all Delleker residents.
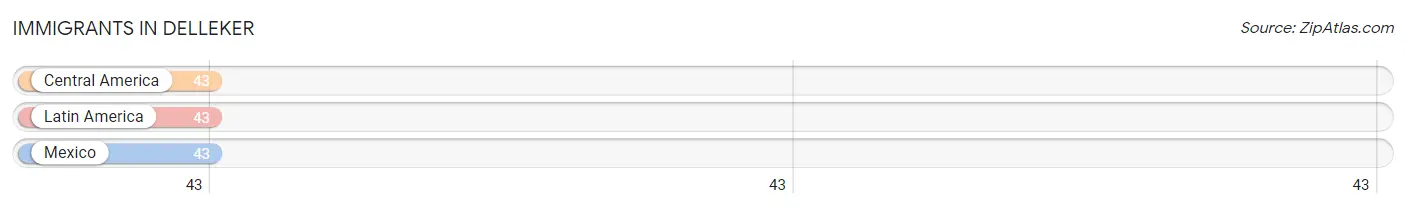
| Immigration Origin | # Population | % Population |
| Central America | 43 | 11.2% |
| Latin America | 43 | 11.2% |
| Mexico | 43 | 11.2% | View All 3 Rows |
Sex and Age in Delleker
Sex and Age in Delleker
The most populous age groups in Delleker are 50 to 54 Years (49 | 20.4%) for men and 30 to 34 Years (46 | 32.2%) for women.
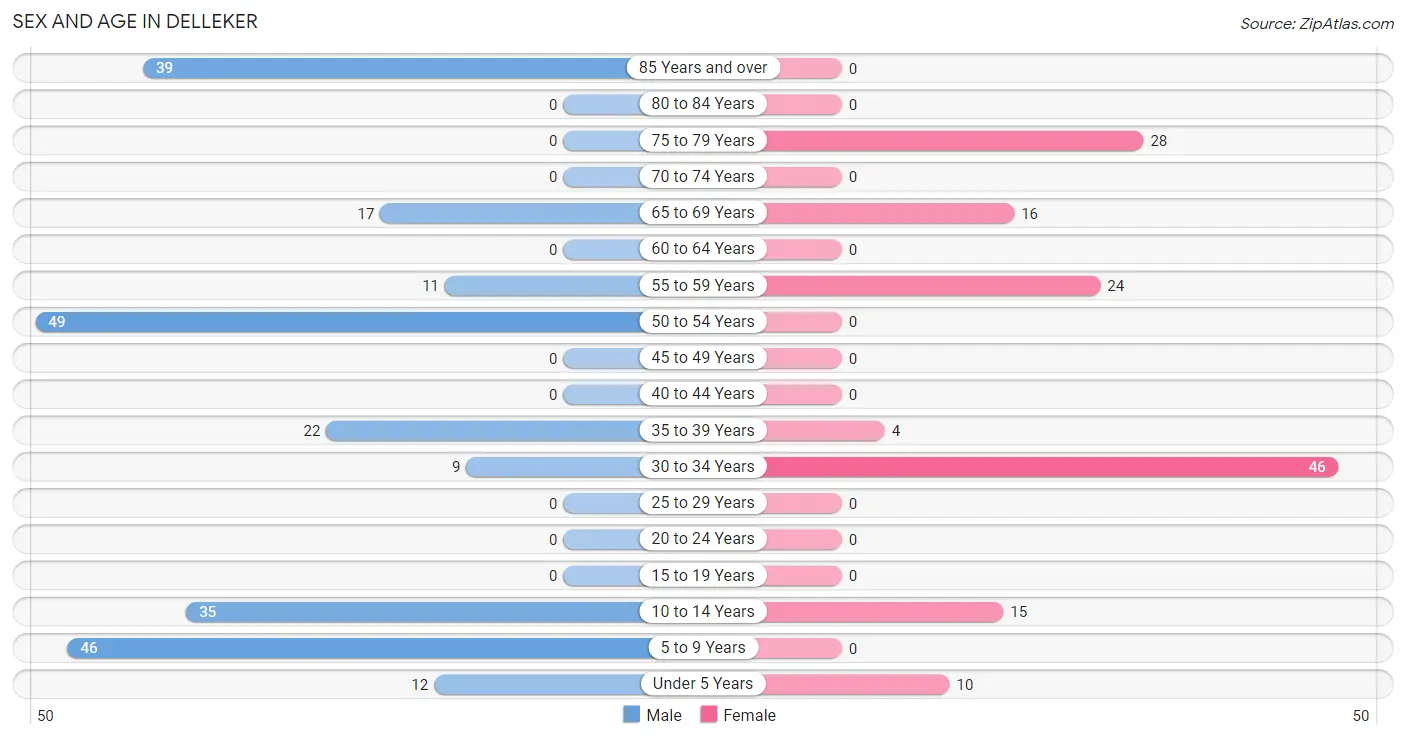
| Age Bracket | Male | Female |
| Under 5 Years | 12 (5.0%) | 10 (7.0%) |
| 5 to 9 Years | 46 (19.2%) | 0 (0.0%) |
| 10 to 14 Years | 35 (14.6%) | 15 (10.5%) |
| 15 to 19 Years | 0 (0.0%) | 0 (0.0%) |
| 20 to 24 Years | 0 (0.0%) | 0 (0.0%) |
| 25 to 29 Years | 0 (0.0%) | 0 (0.0%) |
| 30 to 34 Years | 9 (3.7%) | 46 (32.2%) |
| 35 to 39 Years | 22 (9.2%) | 4 (2.8%) |
| 40 to 44 Years | 0 (0.0%) | 0 (0.0%) |
| 45 to 49 Years | 0 (0.0%) | 0 (0.0%) |
| 50 to 54 Years | 49 (20.4%) | 0 (0.0%) |
| 55 to 59 Years | 11 (4.6%) | 24 (16.8%) |
| 60 to 64 Years | 0 (0.0%) | 0 (0.0%) |
| 65 to 69 Years | 17 (7.1%) | 16 (11.2%) |
| 70 to 74 Years | 0 (0.0%) | 0 (0.0%) |
| 75 to 79 Years | 0 (0.0%) | 28 (19.6%) |
| 80 to 84 Years | 0 (0.0%) | 0 (0.0%) |
| 85 Years and over | 39 (16.3%) | 0 (0.0%) |
| Total | 240 (100.0%) | 143 (100.0%) |
Families and Households in Delleker
Median Family Size in Delleker
The median family size in Delleker is 5.02 persons per family, with single female/mother families (11 | 18.6%) accounting for the largest median family size of 5.64 persons per family. On the other hand, married-couple families (46 | 78.0%) represent the smallest median family size with 4.85 persons per family.
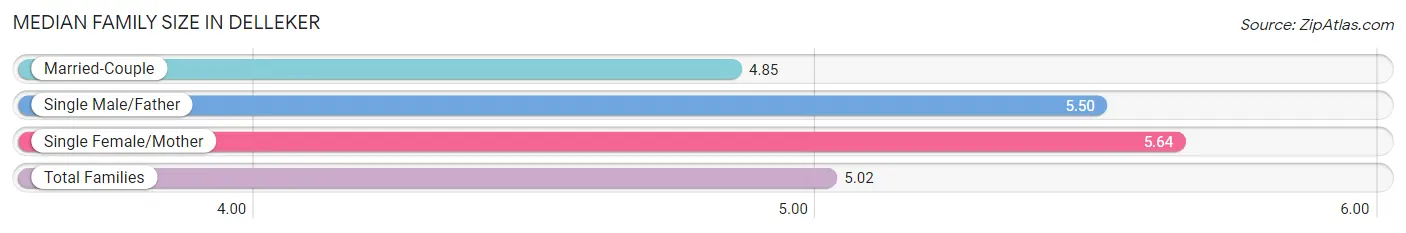
| Family Type | # Families | Family Size |
| Married-Couple | 46 (78.0%) | 4.85 |
| Single Male/Father | 2 (3.4%) | 5.50 |
| Single Female/Mother | 11 (18.6%) | 5.64 |
| Total Families | 59 (100.0%) | 5.02 |
Median Household Size in Delleker
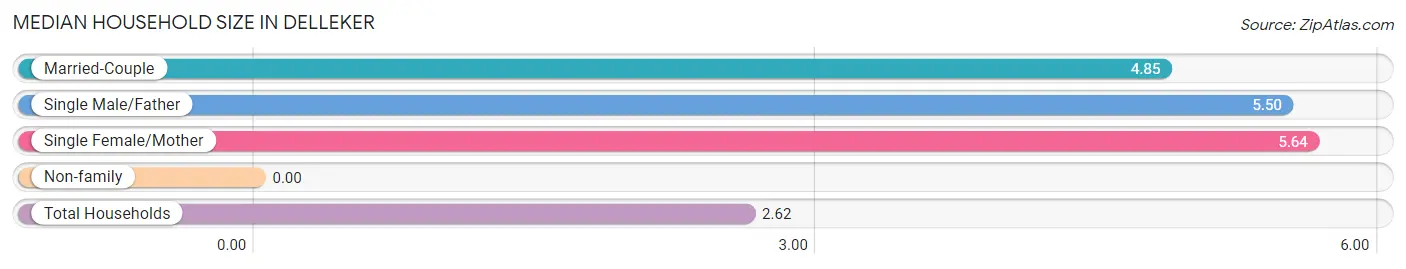
| Household Type | # Households | Household Size |
| Married-Couple | 46 (31.5%) | 4.85 |
| Single Male/Father | 2 (1.4%) | 5.50 |
| Single Female/Mother | 11 (7.5%) | 5.64 |
| Non-family | 87 (59.6%) | - |
| Total Households | 146 (100.0%) | 2.62 |
Household Size by Marriage Status in Delleker
Out of a total of 146 households in Delleker, 59 (40.4%) are family households, while 87 (59.6%) are nonfamily households. The most numerous type of family households are 5-person households, comprising 25, and the most common type of nonfamily households are 1-person households, comprising 87.
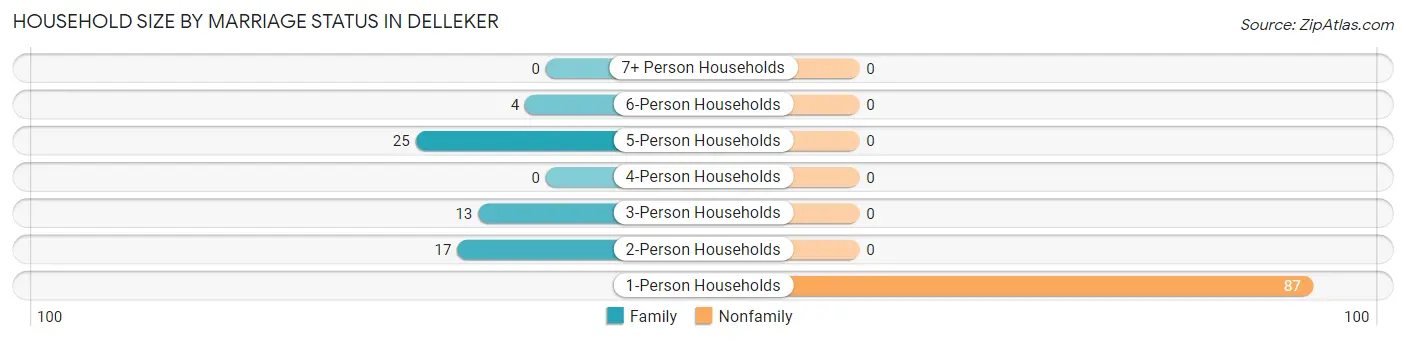
| Household Size | Family Households | Nonfamily Households |
| 1-Person Households | - | 87 (59.6%) |
| 2-Person Households | 17 (11.6%) | 0 (0.0%) |
| 3-Person Households | 13 (8.9%) | 0 (0.0%) |
| 4-Person Households | 0 (0.0%) | 0 (0.0%) |
| 5-Person Households | 25 (17.1%) | 0 (0.0%) |
| 6-Person Households | 4 (2.7%) | 0 (0.0%) |
| 7+ Person Households | 0 (0.0%) | 0 (0.0%) |
| Total | 59 (40.4%) | 87 (59.6%) |
Female Fertility in Delleker
Fertility by Age in Delleker
| Age Bracket | Women with Births | Births / 1,000 Women |
| 15 to 19 years | 0 (0.0%) | 0.0 |
| 20 to 34 years | 0 (0.0%) | 0.0 |
| 35 to 50 years | 0 (0.0%) | 0.0 |
| Total | 0 (0.0%) | 0.0 |
Fertility by Age by Marriage Status in Delleker
| Age Bracket | Married | Unmarried |
| 15 to 19 years | 0 (0.0%) | 0 (0.0%) |
| 20 to 34 years | 0 (0.0%) | 0 (0.0%) |
| 35 to 50 years | 0 (0.0%) | 0 (0.0%) |
| Total | 0 (0.0%) | 0 (0.0%) |
Fertility by Education in Delleker
| Educational Attainment | Women with Births | Births / 1,000 Women |
| Less than High School | 0 (0.0%) | 0.0 |
| High School Diploma | 0 (0.0%) | 0.0 |
| College or Associate's Degree | 0 (0.0%) | 0.0 |
| Bachelor's Degree | 0 (0.0%) | 0.0 |
| Graduate Degree | 0 (0.0%) | 0.0 |
| Total | 0 (0.0%) | 0.0 |
Fertility by Education by Marriage Status in Delleker
| Educational Attainment | Married | Unmarried |
| Less than High School | 0 (0.0%) | 0 (0.0%) |
| High School Diploma | 0 (0.0%) | 0 (0.0%) |
| College or Associate's Degree | 0 (0.0%) | 0 (0.0%) |
| Bachelor's Degree | 0 (0.0%) | 0 (0.0%) |
| Graduate Degree | 0 (0.0%) | 0 (0.0%) |
| Total | 0 (0.0%) | 0 (0.0%) |
Employment Characteristics in Delleker
Employment by Class of Employer in Delleker
Among the 69 employed individuals in Delleker, private company employees (36 | 52.2%), self-employed (not incorporated) (15 | 21.7%), and not-for-profit organizations (9 | 13.0%) make up the most common classes of employment.
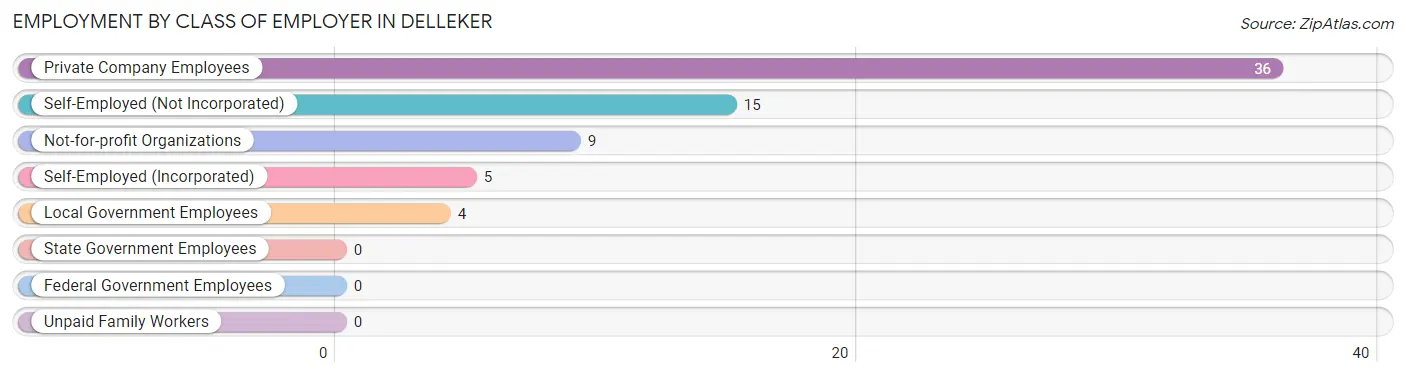
| Employer Class | # Employees | % Employees |
| Private Company Employees | 36 | 52.2% |
| Self-Employed (Incorporated) | 5 | 7.2% |
| Self-Employed (Not Incorporated) | 15 | 21.7% |
| Not-for-profit Organizations | 9 | 13.0% |
| Local Government Employees | 4 | 5.8% |
| State Government Employees | 0 | 0.0% |
| Federal Government Employees | 0 | 0.0% |
| Unpaid Family Workers | 0 | 0.0% |
| Total | 69 | 100.0% |
Employment Status by Age in Delleker
According to the labor force statistics for Delleker, out of the total population over 16 years of age (265), 38.9% or 103 individuals are in the labor force, with 33.0% or 34 of them unemployed. The age group with the highest labor force participation rate is 30 to 34 years, with 100.0% or 55 individuals in the labor force. Within the labor force, the 30 to 34 years age range has the highest percentage of unemployed individuals, with 58.2% or 32 of them being unemployed.
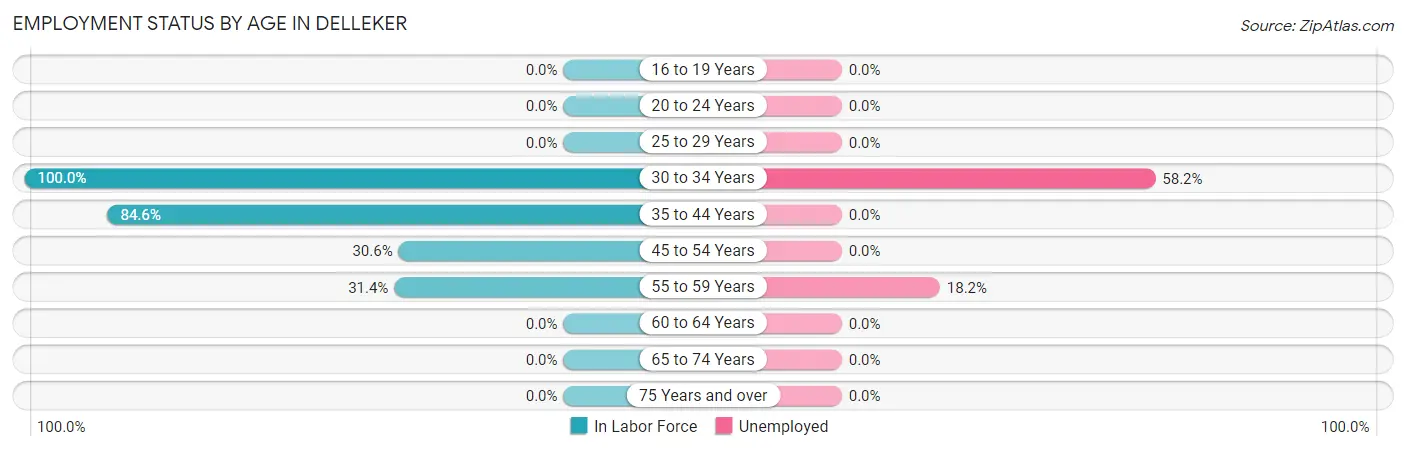
| Age Bracket | In Labor Force | Unemployed |
| 16 to 19 Years | 0 (0.0%) | 0 (0.0%) |
| 20 to 24 Years | 0 (0.0%) | 0 (0.0%) |
| 25 to 29 Years | 0 (0.0%) | 0 (0.0%) |
| 30 to 34 Years | 55 (100.0%) | 32 (58.2%) |
| 35 to 44 Years | 22 (84.6%) | 0 (0.0%) |
| 45 to 54 Years | 15 (30.6%) | 0 (0.0%) |
| 55 to 59 Years | 11 (31.4%) | 2 (18.2%) |
| 60 to 64 Years | 0 (0.0%) | 0 (0.0%) |
| 65 to 74 Years | 0 (0.0%) | 0 (0.0%) |
| 75 Years and over | 0 (0.0%) | 0 (0.0%) |
| Total | 103 (38.9%) | 34 (33.0%) |
Employment Status by Educational Attainment in Delleker
According to labor force statistics for Delleker, 62.4% of individuals (103) out of the total population between 25 and 64 years of age (165) are in the labor force, with 33.0% or 34 of them being unemployed. The group with the highest labor force participation rate are those with the educational attainment of less than high school, with 100.0% or 11 individuals in the labor force. Within the labor force, individuals with college / associate degree education have the highest percentage of unemployment, with 39.5% or 32 of them being unemployed.
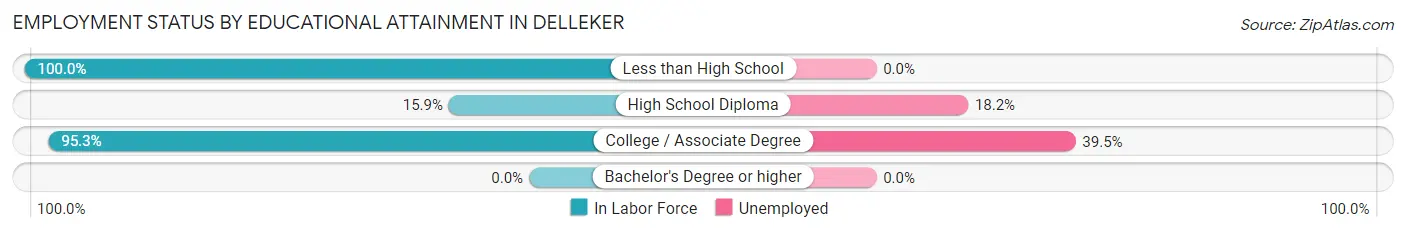
| Educational Attainment | In Labor Force | Unemployed |
| Less than High School | 11 (100.0%) | 0 (0.0%) |
| High School Diploma | 11 (15.9%) | 13 (18.2%) |
| College / Associate Degree | 81 (95.3%) | 34 (39.5%) |
| Bachelor's Degree or higher | 0 (0.0%) | 0 (0.0%) |
| Total | 103 (62.4%) | 54 (33.0%) |
Employment Occupations by Sex in Delleker
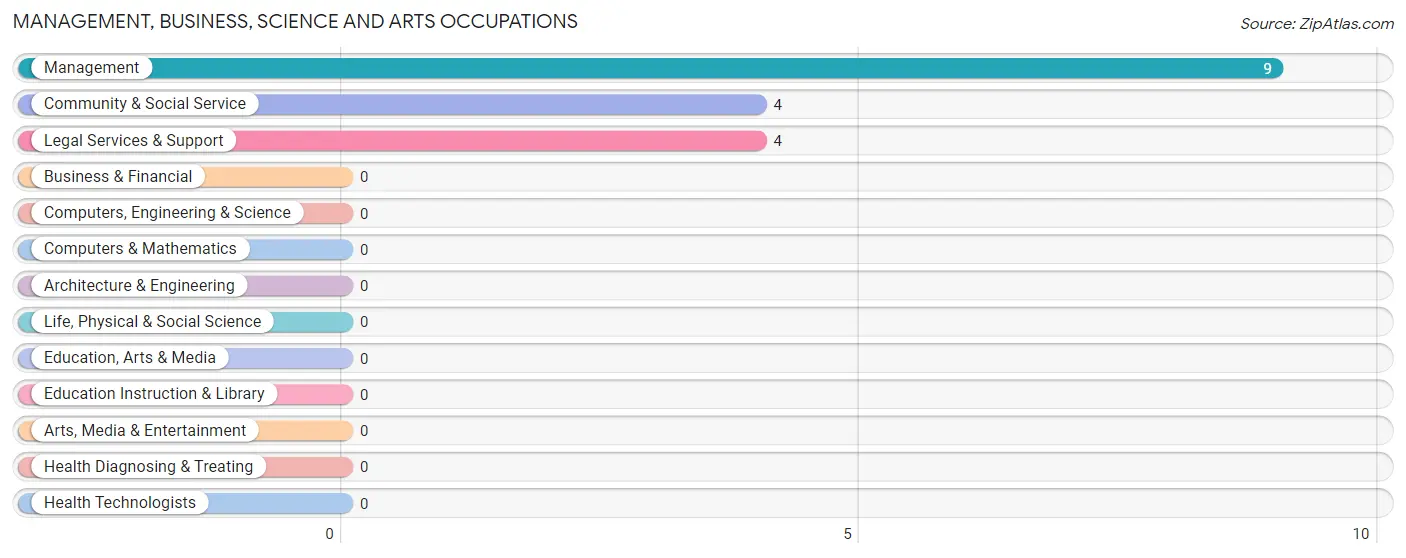
Management, Business, Science and Arts Occupations
The most common Management, Business, Science and Arts occupations in Delleker are Management (9 | 13.0%), Community & Social Service (4 | 5.8%), and Legal Services & Support (4 | 5.8%).
Management, Business, Science and Arts Occupations by Sex
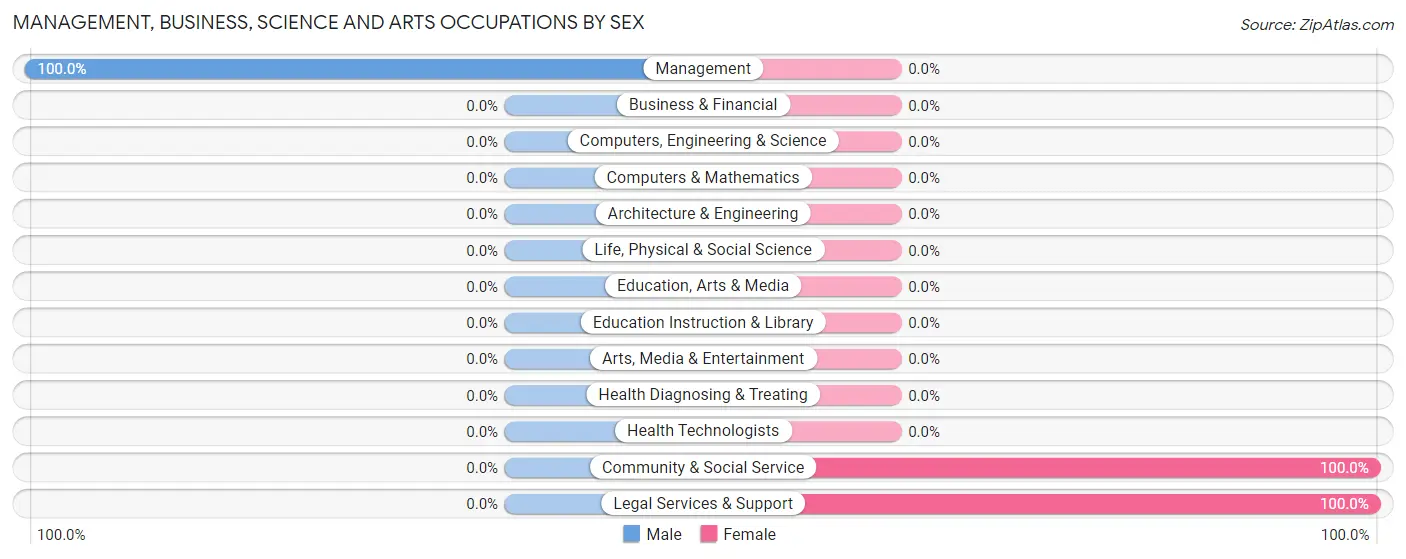
| Occupation | Male | Female |
| Management | 9 (100.0%) | 0 (0.0%) |
| Business & Financial | 0 (0.0%) | 0 (0.0%) |
| Computers, Engineering & Science | 0 (0.0%) | 0 (0.0%) |
| Computers & Mathematics | 0 (0.0%) | 0 (0.0%) |
| Architecture & Engineering | 0 (0.0%) | 0 (0.0%) |
| Life, Physical & Social Science | 0 (0.0%) | 0 (0.0%) |
| Community & Social Service | 0 (0.0%) | 4 (100.0%) |
| Education, Arts & Media | 0 (0.0%) | 0 (0.0%) |
| Legal Services & Support | 0 (0.0%) | 4 (100.0%) |
| Education Instruction & Library | 0 (0.0%) | 0 (0.0%) |
| Arts, Media & Entertainment | 0 (0.0%) | 0 (0.0%) |
| Health Diagnosing & Treating | 0 (0.0%) | 0 (0.0%) |
| Health Technologists | 0 (0.0%) | 0 (0.0%) |
| Total (Category) | 9 (69.2%) | 4 (30.8%) |
| Total (Overall) | 51 (73.9%) | 18 (26.1%) |
Services Occupations
The most common Services occupations in Delleker are Food Preparation & Serving (14 | 20.3%), and Cleaning & Maintenance (9 | 13.0%).
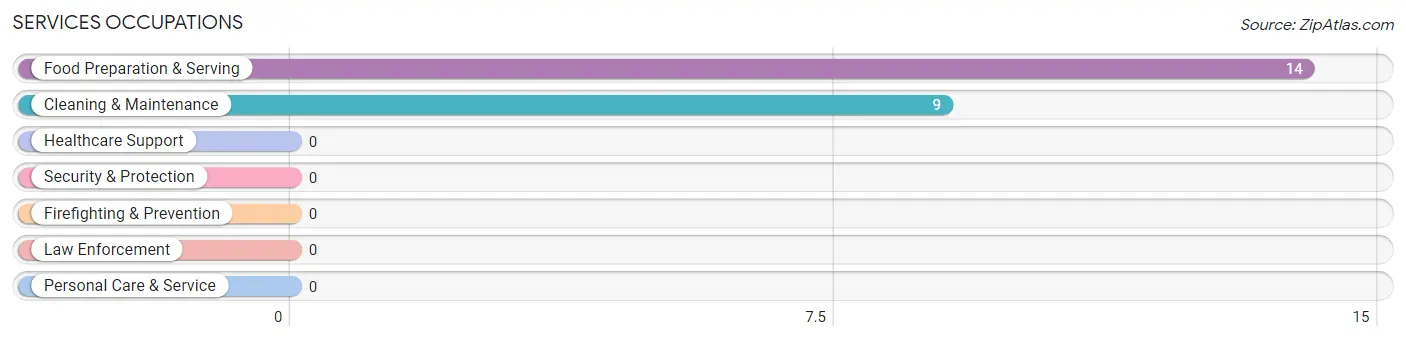
Services Occupations by Sex
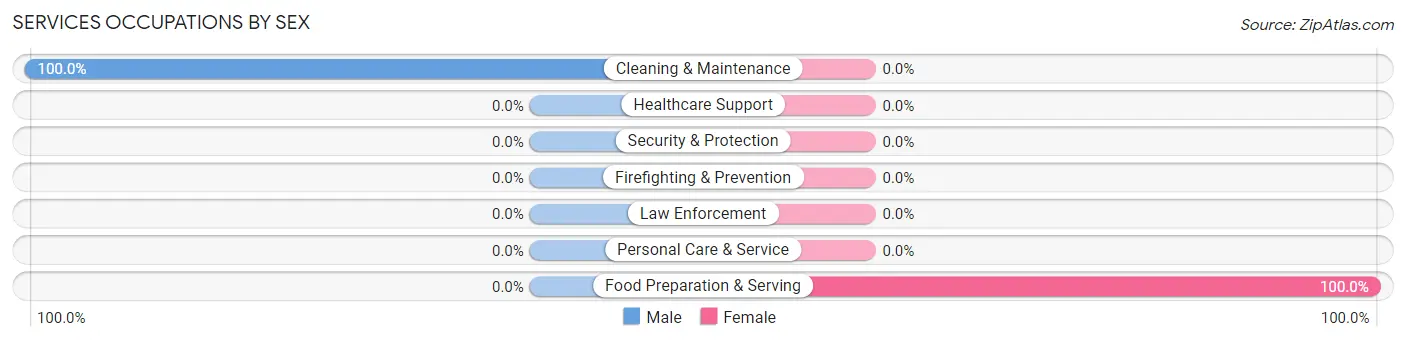
| Occupation | Male | Female |
| Healthcare Support | 0 (0.0%) | 0 (0.0%) |
| Security & Protection | 0 (0.0%) | 0 (0.0%) |
| Firefighting & Prevention | 0 (0.0%) | 0 (0.0%) |
| Law Enforcement | 0 (0.0%) | 0 (0.0%) |
| Food Preparation & Serving | 0 (0.0%) | 14 (100.0%) |
| Cleaning & Maintenance | 9 (100.0%) | 0 (0.0%) |
| Personal Care & Service | 0 (0.0%) | 0 (0.0%) |
| Total (Category) | 9 (39.1%) | 14 (60.9%) |
| Total (Overall) | 51 (73.9%) | 18 (26.1%) |
Sales and Office Occupations
The most common Sales and Office occupations in Delleker are , and Office & Administration (5 | 7.2%).
Sales and Office Occupations by Sex
| Occupation | Male | Female |
| Sales & Related | 0 (0.0%) | 0 (0.0%) |
| Office & Administration | 5 (100.0%) | 0 (0.0%) |
| Total (Category) | 5 (100.0%) | 0 (0.0%) |
| Total (Overall) | 51 (73.9%) | 18 (26.1%) |
Natural Resources, Construction and Maintenance Occupations
The most common Natural Resources, Construction and Maintenance occupations in Delleker are , and Construction & Extraction (28 | 40.6%).
Natural Resources, Construction and Maintenance Occupations by Sex
| Occupation | Male | Female |
| Farming, Fishing & Forestry | 0 (0.0%) | 0 (0.0%) |
| Construction & Extraction | 28 (100.0%) | 0 (0.0%) |
| Installation, Maintenance & Repair | 0 (0.0%) | 0 (0.0%) |
| Total (Category) | 28 (100.0%) | 0 (0.0%) |
| Total (Overall) | 51 (73.9%) | 18 (26.1%) |
Production, Transportation and Moving Occupations
Production, Transportation and Moving Occupations by Sex
| Occupation | Male | Female |
| Production | 0 (0.0%) | 0 (0.0%) |
| Transportation | 0 (0.0%) | 0 (0.0%) |
| Material Moving | 0 (0.0%) | 0 (0.0%) |
| Total (Category) | 0 (0.0%) | 0 (0.0%) |
| Total (Overall) | 51 (73.9%) | 18 (26.1%) |
Employment Industries by Sex in Delleker
Employment Industries in Delleker
The major employment industries in Delleker include Accommodation & Food Services (23 | 33.3%), Construction (17 | 24.6%), Agriculture, Fishing & Hunting (11 | 15.9%), Transportation & Warehousing (5 | 7.2%), and Professional & Scientific (4 | 5.8%).
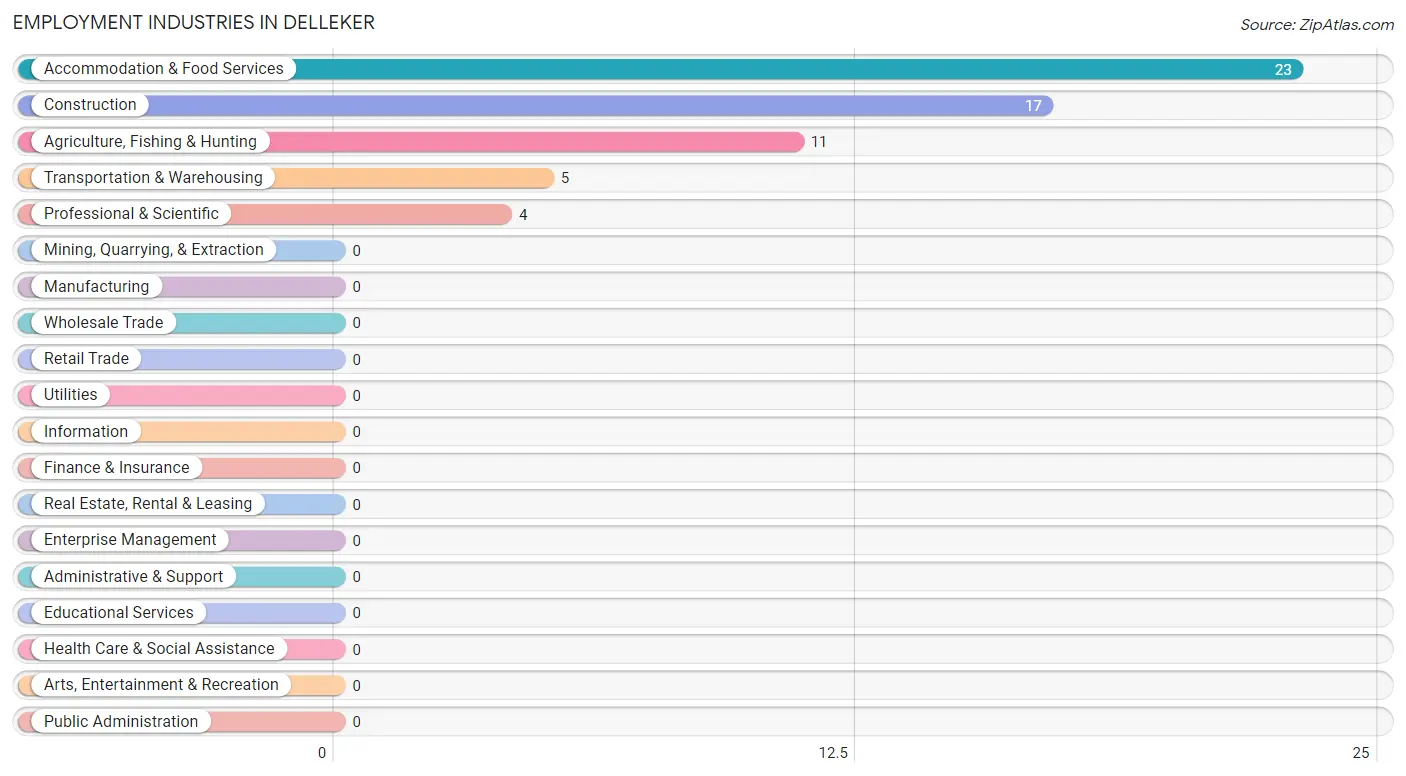
Employment Industries by Sex in Delleker
The Delleker industries that see more men than women are Agriculture, Fishing & Hunting (100.0%), Construction (100.0%), and Transportation & Warehousing (100.0%), whereas the industries that tend to have a higher number of women are Professional & Scientific (100.0%), and Accommodation & Food Services (60.9%).
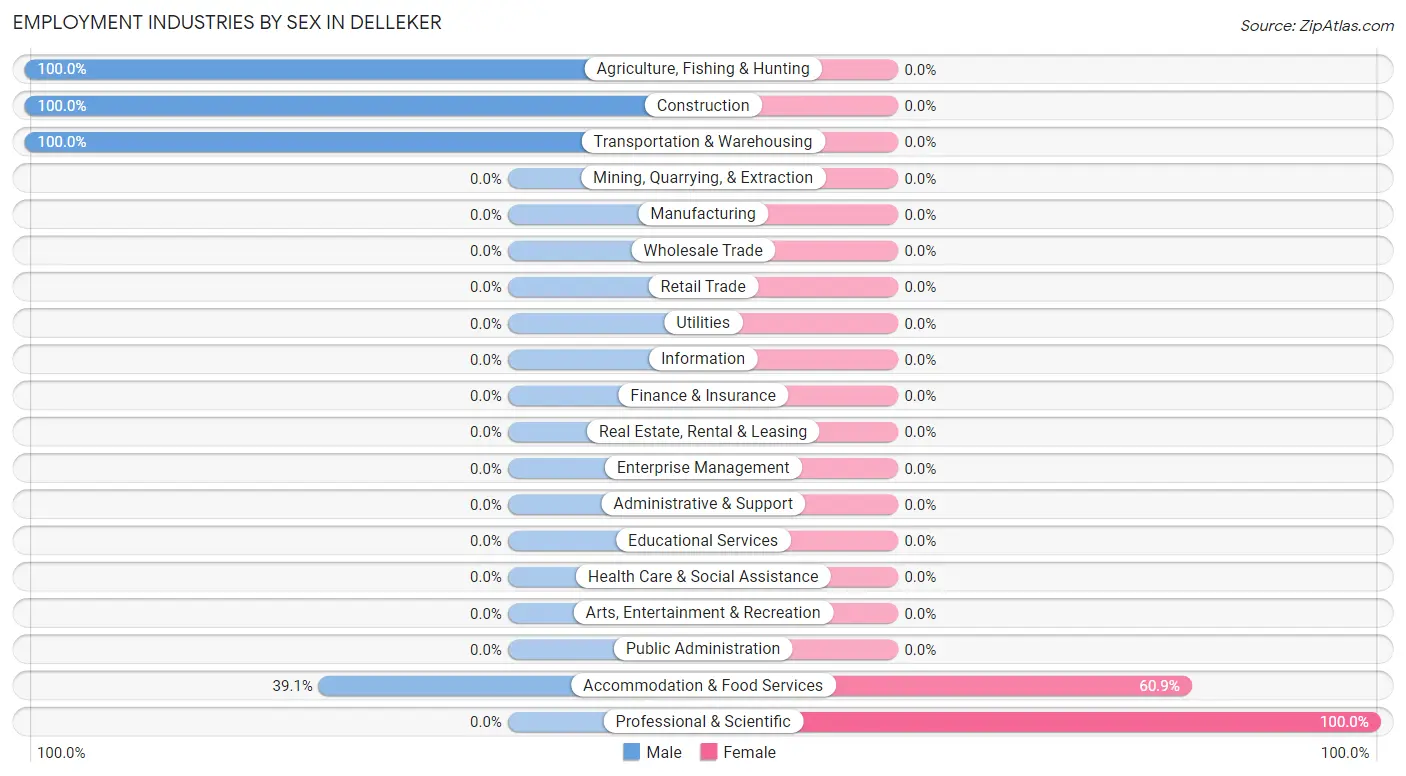
| Industry | Male | Female |
| Agriculture, Fishing & Hunting | 11 (100.0%) | 0 (0.0%) |
| Mining, Quarrying, & Extraction | 0 (0.0%) | 0 (0.0%) |
| Construction | 17 (100.0%) | 0 (0.0%) |
| Manufacturing | 0 (0.0%) | 0 (0.0%) |
| Wholesale Trade | 0 (0.0%) | 0 (0.0%) |
| Retail Trade | 0 (0.0%) | 0 (0.0%) |
| Transportation & Warehousing | 5 (100.0%) | 0 (0.0%) |
| Utilities | 0 (0.0%) | 0 (0.0%) |
| Information | 0 (0.0%) | 0 (0.0%) |
| Finance & Insurance | 0 (0.0%) | 0 (0.0%) |
| Real Estate, Rental & Leasing | 0 (0.0%) | 0 (0.0%) |
| Professional & Scientific | 0 (0.0%) | 4 (100.0%) |
| Enterprise Management | 0 (0.0%) | 0 (0.0%) |
| Administrative & Support | 0 (0.0%) | 0 (0.0%) |
| Educational Services | 0 (0.0%) | 0 (0.0%) |
| Health Care & Social Assistance | 0 (0.0%) | 0 (0.0%) |
| Arts, Entertainment & Recreation | 0 (0.0%) | 0 (0.0%) |
| Accommodation & Food Services | 9 (39.1%) | 14 (60.9%) |
| Public Administration | 0 (0.0%) | 0 (0.0%) |
| Total | 51 (73.9%) | 18 (26.1%) |
Education in Delleker
School Enrollment in Delleker
The most common levels of schooling among the 108 students in Delleker are middle school (50 | 46.3%), elementary school (44 | 40.7%), and nursery / preschool (12 | 11.1%).
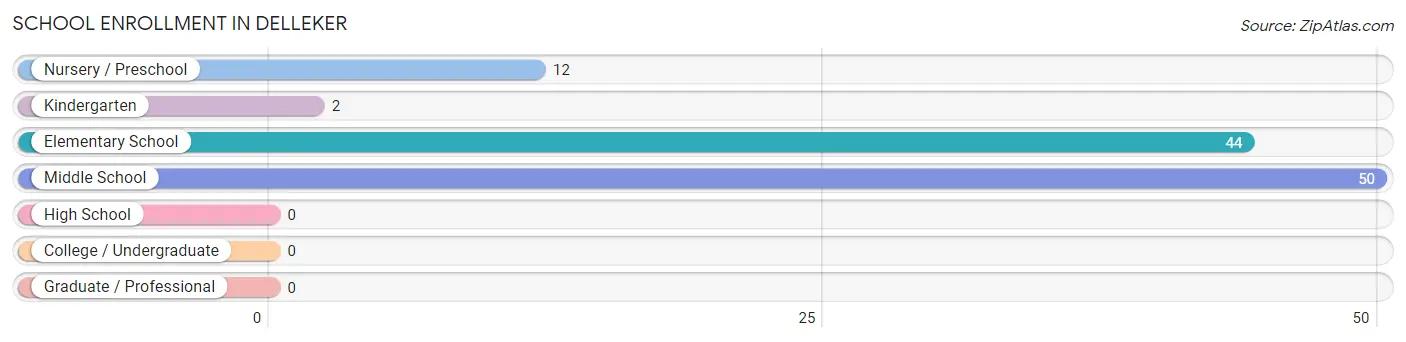
| School Level | # Students | % Students |
| Nursery / Preschool | 12 | 11.1% |
| Kindergarten | 2 | 1.8% |
| Elementary School | 44 | 40.7% |
| Middle School | 50 | 46.3% |
| High School | 0 | 0.0% |
| College / Undergraduate | 0 | 0.0% |
| Graduate / Professional | 0 | 0.0% |
| Total | 108 | 100.0% |
School Enrollment by Age by Funding Source in Delleker
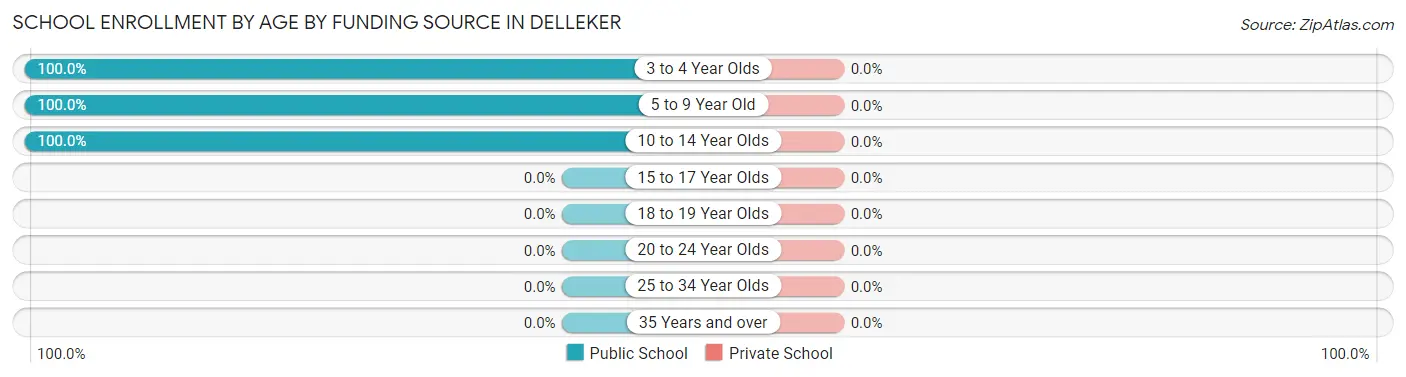
| Age Bracket | Public School | Private School |
| 3 to 4 Year Olds | 12 (100.0%) | 0 (0.0%) |
| 5 to 9 Year Old | 46 (100.0%) | 0 (0.0%) |
| 10 to 14 Year Olds | 50 (100.0%) | 0 (0.0%) |
| 15 to 17 Year Olds | 0 (0.0%) | 0 (0.0%) |
| 18 to 19 Year Olds | 0 (0.0%) | 0 (0.0%) |
| 20 to 24 Year Olds | 0 (0.0%) | 0 (0.0%) |
| 25 to 34 Year Olds | 0 (0.0%) | 0 (0.0%) |
| 35 Years and over | 0 (0.0%) | 0 (0.0%) |
| Total | 108 (100.0%) | 0 (0.0%) |
Educational Attainment by Field of Study in Delleker
| Field of Study | # Graduates | % Graduates |
| Computers & Mathematics | 0 | 0.0% |
| Bio, Nature & Agricultural | 0 | 0.0% |
| Physical & Health Sciences | 0 | 0.0% |
| Psychology | 0 | 0.0% |
| Social Sciences | 0 | 0.0% |
| Engineering | 0 | 0.0% |
| Multidisciplinary Studies | 0 | 0.0% |
| Science & Technology | 0 | 0.0% |
| Business | 0 | 0.0% |
| Education | 0 | 0.0% |
| Literature & Languages | 0 | 0.0% |
| Liberal Arts & History | 0 | 0.0% |
| Visual & Performing Arts | 0 | 0.0% |
| Communications | 0 | 0.0% |
| Arts & Humanities | 0 | 0.0% |
| Total | 0 | 0.0% |
Transportation & Commute in Delleker
Vehicle Availability by Sex in Delleker
The most prevalent vehicle ownership categories in Delleker are males with 2 vehicles (20, accounting for 39.2%) and females with 2 vehicles (14, making up 111.1%).
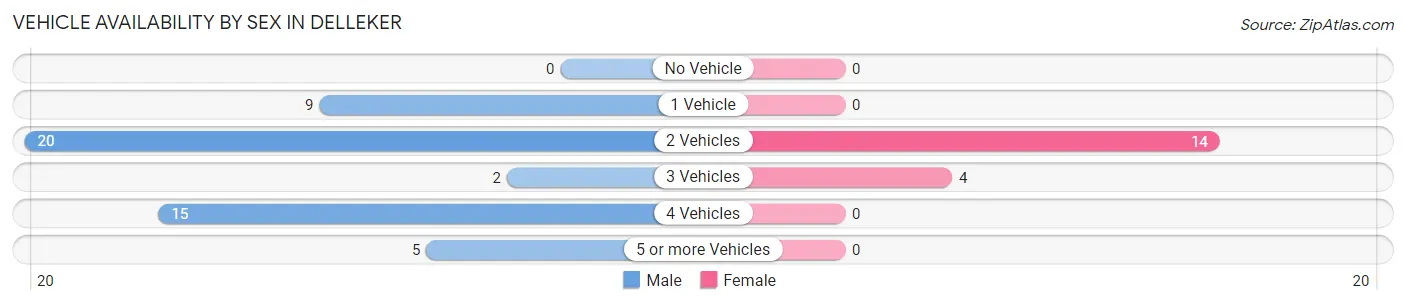
| Vehicles Available | Male | Female |
| No Vehicle | 0 (0.0%) | 0 (0.0%) |
| 1 Vehicle | 9 (17.6%) | 0 (0.0%) |
| 2 Vehicles | 20 (39.2%) | 14 (77.8%) |
| 3 Vehicles | 2 (3.9%) | 4 (22.2%) |
| 4 Vehicles | 15 (29.4%) | 0 (0.0%) |
| 5 or more Vehicles | 5 (9.8%) | 0 (0.0%) |
| Total | 51 (100.0%) | 18 (100.0%) |
Commute Time in Delleker
The most frequently occuring commute durations in Delleker are 60 to 89 minutes (28 commuters, 40.6%), 15 to 19 minutes (14 commuters, 20.3%), and less than 5 minutes (9 commuters, 13.0%).
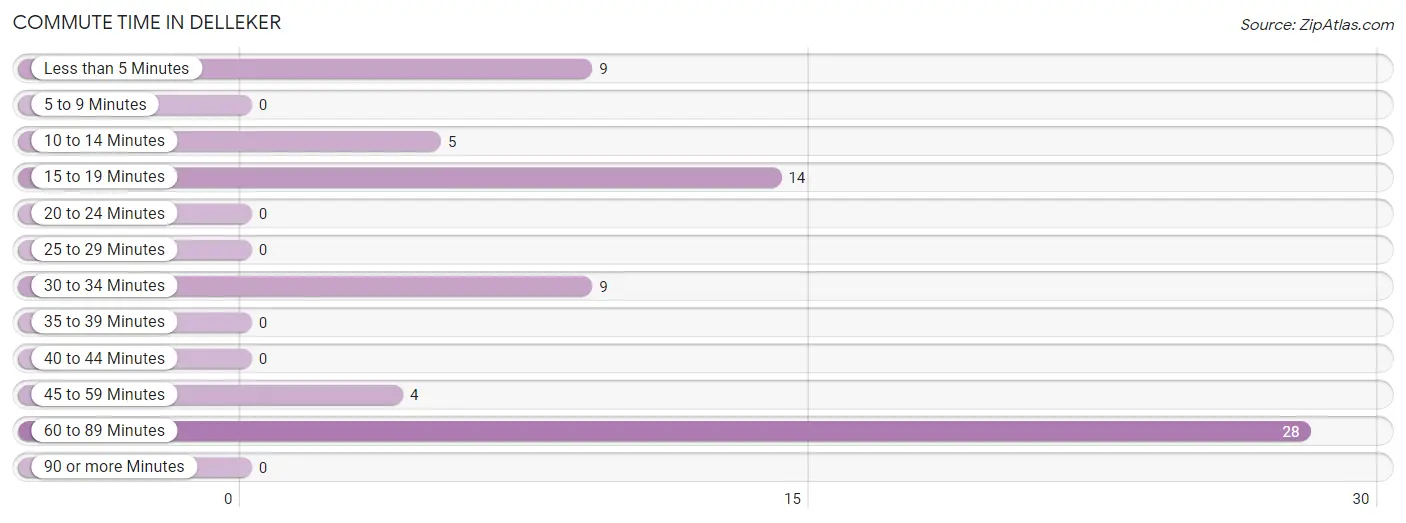
| Commute Time | # Commuters | % Commuters |
| Less than 5 Minutes | 9 | 13.0% |
| 5 to 9 Minutes | 0 | 0.0% |
| 10 to 14 Minutes | 5 | 7.2% |
| 15 to 19 Minutes | 14 | 20.3% |
| 20 to 24 Minutes | 0 | 0.0% |
| 25 to 29 Minutes | 0 | 0.0% |
| 30 to 34 Minutes | 9 | 13.0% |
| 35 to 39 Minutes | 0 | 0.0% |
| 40 to 44 Minutes | 0 | 0.0% |
| 45 to 59 Minutes | 4 | 5.8% |
| 60 to 89 Minutes | 28 | 40.6% |
| 90 or more Minutes | 0 | 0.0% |
Commute Time by Sex in Delleker
The most common commute times in Delleker are 60 to 89 minutes (28 commuters, 54.9%) for males and 15 to 19 minutes (14 commuters, 77.8%) for females.
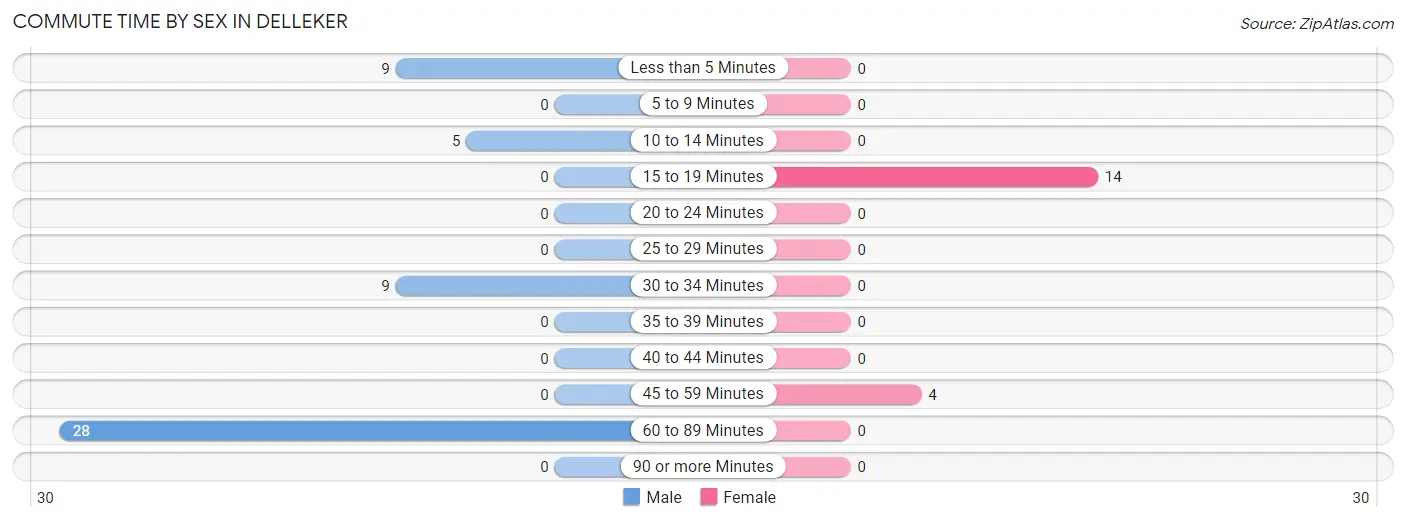
| Commute Time | Male | Female |
| Less than 5 Minutes | 9 (17.6%) | 0 (0.0%) |
| 5 to 9 Minutes | 0 (0.0%) | 0 (0.0%) |
| 10 to 14 Minutes | 5 (9.8%) | 0 (0.0%) |
| 15 to 19 Minutes | 0 (0.0%) | 14 (77.8%) |
| 20 to 24 Minutes | 0 (0.0%) | 0 (0.0%) |
| 25 to 29 Minutes | 0 (0.0%) | 0 (0.0%) |
| 30 to 34 Minutes | 9 (17.6%) | 0 (0.0%) |
| 35 to 39 Minutes | 0 (0.0%) | 0 (0.0%) |
| 40 to 44 Minutes | 0 (0.0%) | 0 (0.0%) |
| 45 to 59 Minutes | 0 (0.0%) | 4 (22.2%) |
| 60 to 89 Minutes | 28 (54.9%) | 0 (0.0%) |
| 90 or more Minutes | 0 (0.0%) | 0 (0.0%) |
Time of Departure to Work by Sex in Delleker
The most frequent times of departure to work in Delleker are 5:00 AM to 5:29 AM (17, 33.3%) for males and 8:30 AM to 8:59 AM (14, 77.8%) for females.
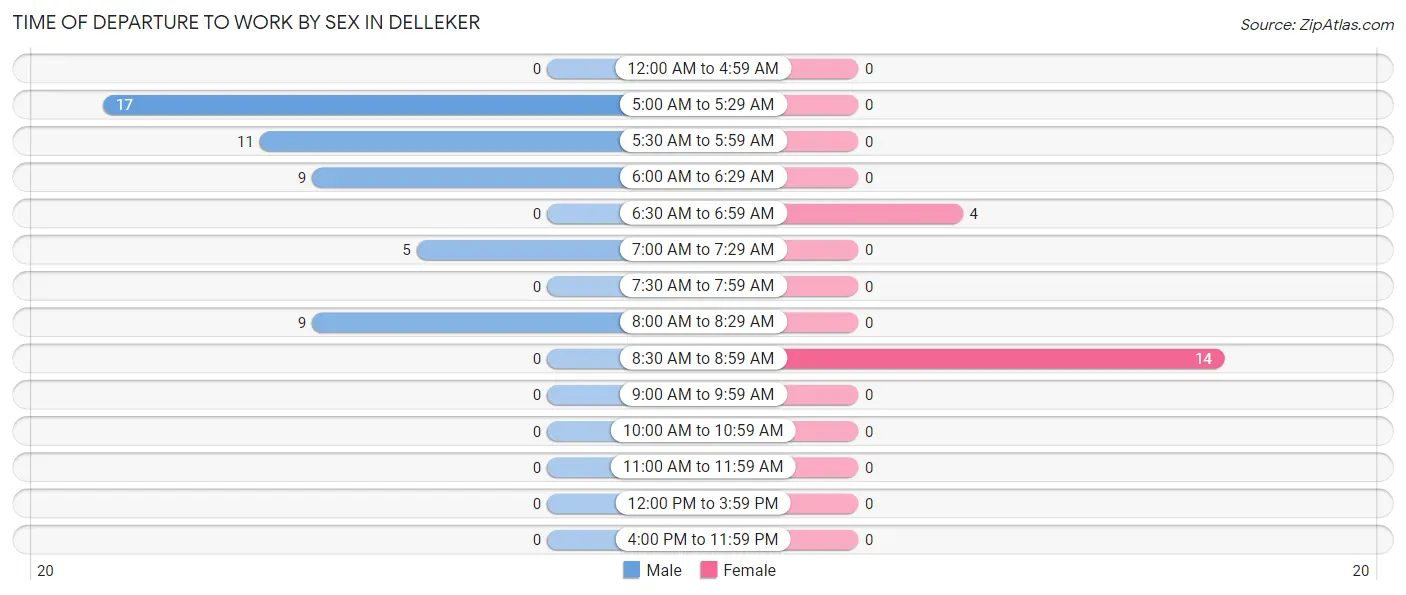
| Time of Departure | Male | Female |
| 12:00 AM to 4:59 AM | 0 (0.0%) | 0 (0.0%) |
| 5:00 AM to 5:29 AM | 17 (33.3%) | 0 (0.0%) |
| 5:30 AM to 5:59 AM | 11 (21.6%) | 0 (0.0%) |
| 6:00 AM to 6:29 AM | 9 (17.6%) | 0 (0.0%) |
| 6:30 AM to 6:59 AM | 0 (0.0%) | 4 (22.2%) |
| 7:00 AM to 7:29 AM | 5 (9.8%) | 0 (0.0%) |
| 7:30 AM to 7:59 AM | 0 (0.0%) | 0 (0.0%) |
| 8:00 AM to 8:29 AM | 9 (17.6%) | 0 (0.0%) |
| 8:30 AM to 8:59 AM | 0 (0.0%) | 14 (77.8%) |
| 9:00 AM to 9:59 AM | 0 (0.0%) | 0 (0.0%) |
| 10:00 AM to 10:59 AM | 0 (0.0%) | 0 (0.0%) |
| 11:00 AM to 11:59 AM | 0 (0.0%) | 0 (0.0%) |
| 12:00 PM to 3:59 PM | 0 (0.0%) | 0 (0.0%) |
| 4:00 PM to 11:59 PM | 0 (0.0%) | 0 (0.0%) |
| Total | 51 (100.0%) | 18 (100.0%) |
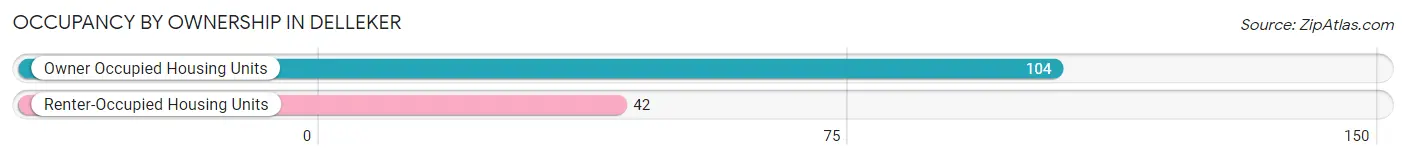
Housing Occupancy in Delleker
Occupancy by Ownership in Delleker
Of the total 146 dwellings in Delleker, owner-occupied units account for 104 (71.2%), while renter-occupied units make up 42 (28.8%).
| Occupancy | # Housing Units | % Housing Units |
| Owner Occupied Housing Units | 104 | 71.2% |
| Renter-Occupied Housing Units | 42 | 28.8% |
| Total Occupied Housing Units | 146 | 100.0% |
Occupancy by Household Size in Delleker
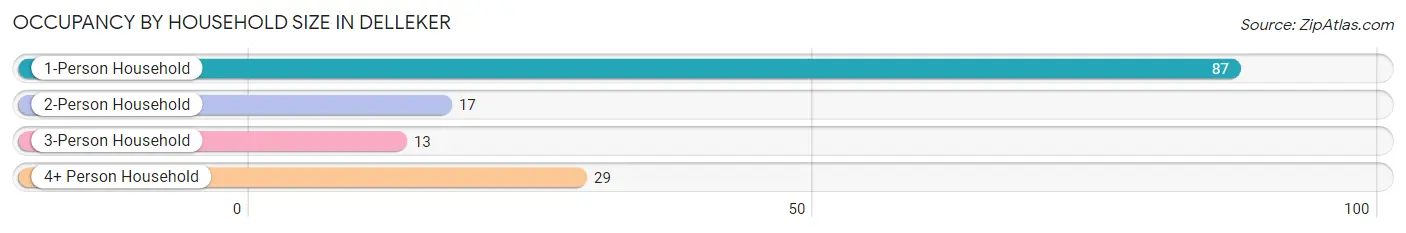
| Household Size | # Housing Units | % Housing Units |
| 1-Person Household | 87 | 59.6% |
| 2-Person Household | 17 | 11.6% |
| 3-Person Household | 13 | 8.9% |
| 4+ Person Household | 29 | 19.9% |
| Total Housing Units | 146 | 100.0% |
Occupancy by Ownership by Household Size in Delleker
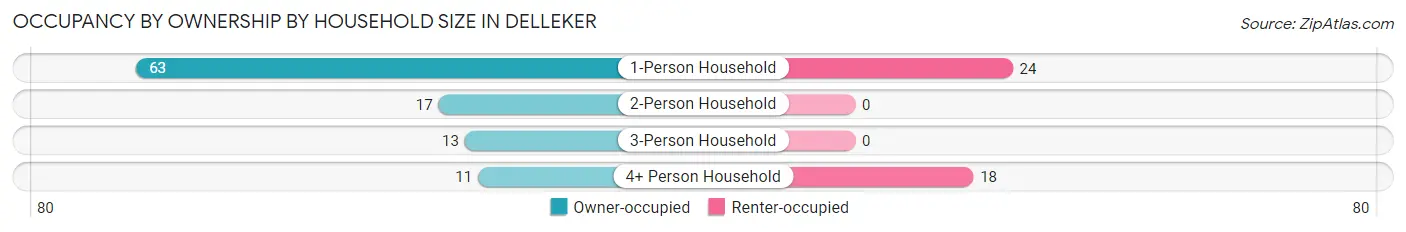
| Household Size | Owner-occupied | Renter-occupied |
| 1-Person Household | 63 (72.4%) | 24 (27.6%) |
| 2-Person Household | 17 (100.0%) | 0 (0.0%) |
| 3-Person Household | 13 (100.0%) | 0 (0.0%) |
| 4+ Person Household | 11 (37.9%) | 18 (62.1%) |
| Total Housing Units | 104 (71.2%) | 42 (28.8%) |
Occupancy by Educational Attainment in Delleker
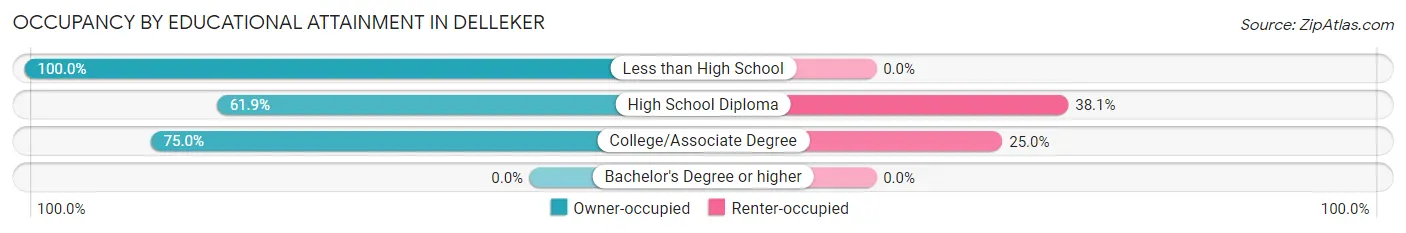
| Household Size | Owner-occupied | Renter-occupied |
| Less than High School | 11 (100.0%) | 0 (0.0%) |
| High School Diploma | 39 (61.9%) | 24 (38.1%) |
| College/Associate Degree | 54 (75.0%) | 18 (25.0%) |
| Bachelor's Degree or higher | 0 (0.0%) | 0 (0.0%) |
Occupancy by Age of Householder in Delleker
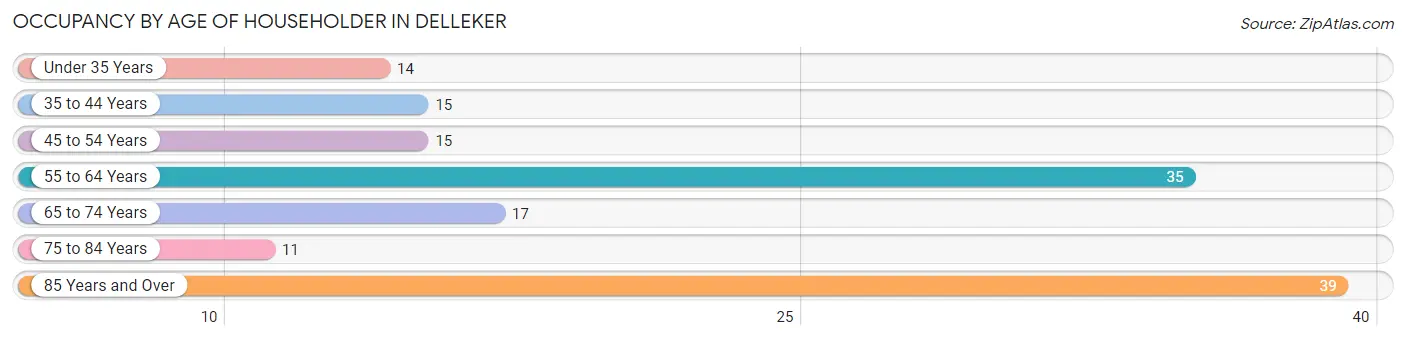
| Age Bracket | # Households | % Households |
| Under 35 Years | 14 | 9.6% |
| 35 to 44 Years | 15 | 10.3% |
| 45 to 54 Years | 15 | 10.3% |
| 55 to 64 Years | 35 | 24.0% |
| 65 to 74 Years | 17 | 11.6% |
| 75 to 84 Years | 11 | 7.5% |
| 85 Years and Over | 39 | 26.7% |
| Total | 146 | 100.0% |
Housing Finances in Delleker
Median Income by Occupancy in Delleker
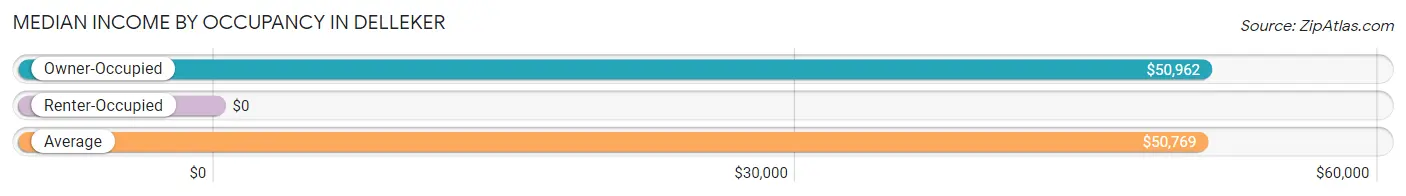
| Occupancy Type | # Households | Median Income |
| Owner-Occupied | 104 (71.2%) | $50,962 |
| Renter-Occupied | 42 (28.8%) | $0 |
| Average | 146 (100.0%) | $50,769 |
Occupancy by Householder Income Bracket in Delleker
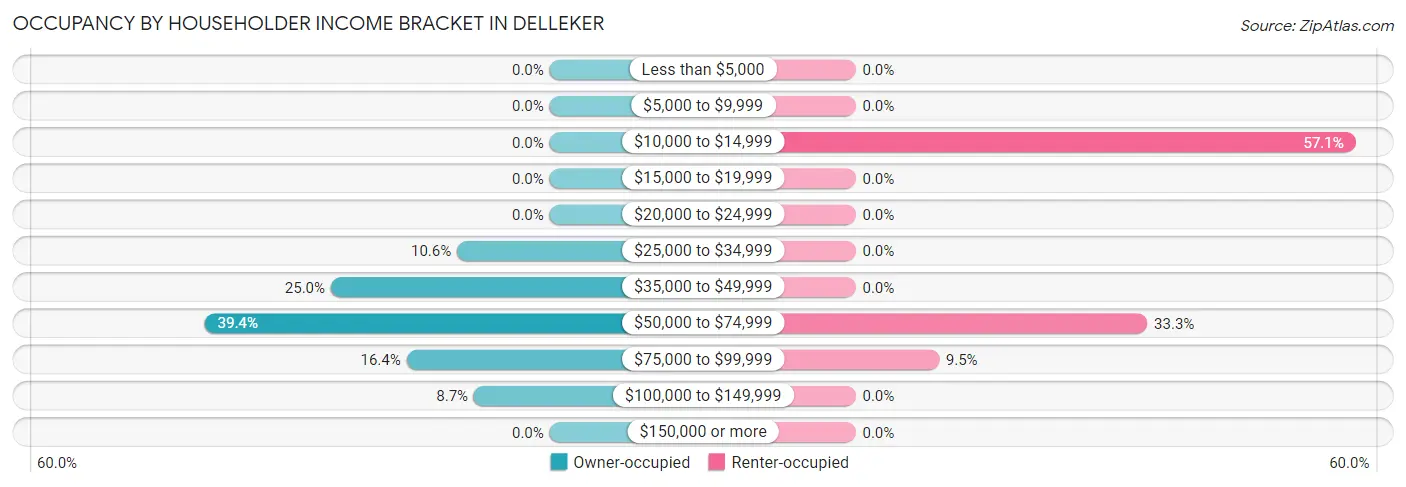
| Income Bracket | Owner-occupied | Renter-occupied |
| Less than $5,000 | 0 (0.0%) | 0 (0.0%) |
| $5,000 to $9,999 | 0 (0.0%) | 0 (0.0%) |
| $10,000 to $14,999 | 0 (0.0%) | 24 (57.1%) |
| $15,000 to $19,999 | 0 (0.0%) | 0 (0.0%) |
| $20,000 to $24,999 | 0 (0.0%) | 0 (0.0%) |
| $25,000 to $34,999 | 11 (10.6%) | 0 (0.0%) |
| $35,000 to $49,999 | 26 (25.0%) | 0 (0.0%) |
| $50,000 to $74,999 | 41 (39.4%) | 14 (33.3%) |
| $75,000 to $99,999 | 17 (16.4%) | 4 (9.5%) |
| $100,000 to $149,999 | 9 (8.6%) | 0 (0.0%) |
| $150,000 or more | 0 (0.0%) | 0 (0.0%) |
| Total | 104 (100.0%) | 42 (100.0%) |
Monthly Housing Cost Tiers in Delleker
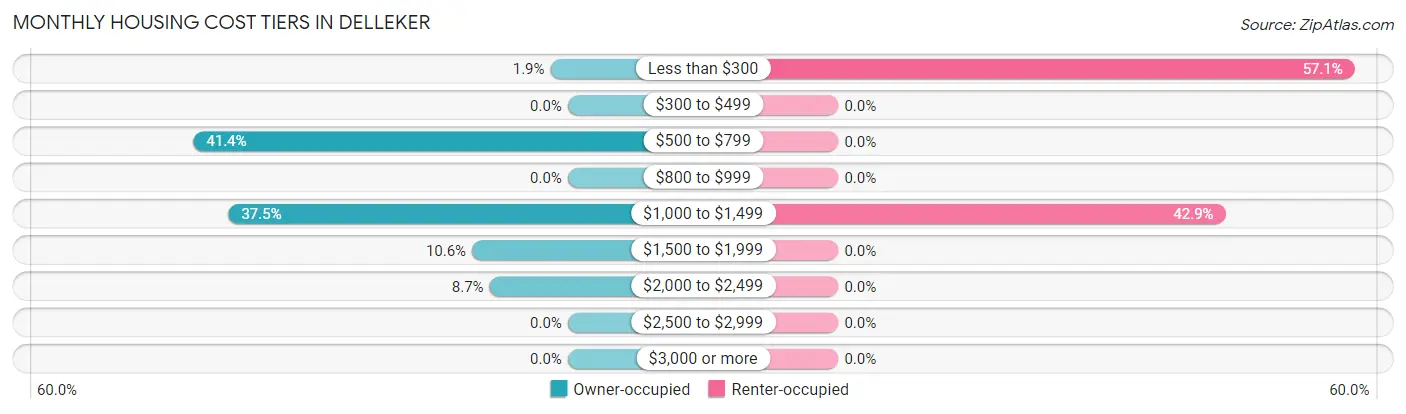
| Monthly Cost | Owner-occupied | Renter-occupied |
| Less than $300 | 2 (1.9%) | 24 (57.1%) |
| $300 to $499 | 0 (0.0%) | 0 (0.0%) |
| $500 to $799 | 43 (41.3%) | 0 (0.0%) |
| $800 to $999 | 0 (0.0%) | 0 (0.0%) |
| $1,000 to $1,499 | 39 (37.5%) | 18 (42.9%) |
| $1,500 to $1,999 | 11 (10.6%) | 0 (0.0%) |
| $2,000 to $2,499 | 9 (8.6%) | 0 (0.0%) |
| $2,500 to $2,999 | 0 (0.0%) | 0 (0.0%) |
| $3,000 or more | 0 (0.0%) | 0 (0.0%) |
| Total | 104 (100.0%) | 42 (100.0%) |
Physical Housing Characteristics in Delleker
Housing Structures in Delleker
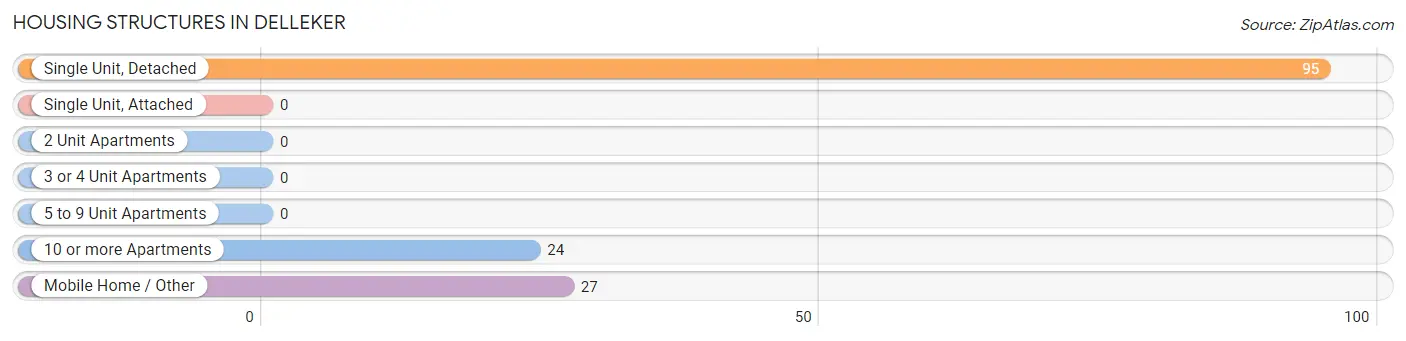
| Structure Type | # Housing Units | % Housing Units |
| Single Unit, Detached | 95 | 65.1% |
| Single Unit, Attached | 0 | 0.0% |
| 2 Unit Apartments | 0 | 0.0% |
| 3 or 4 Unit Apartments | 0 | 0.0% |
| 5 to 9 Unit Apartments | 0 | 0.0% |
| 10 or more Apartments | 24 | 16.4% |
| Mobile Home / Other | 27 | 18.5% |
| Total | 146 | 100.0% |
Housing Structures by Occupancy in Delleker
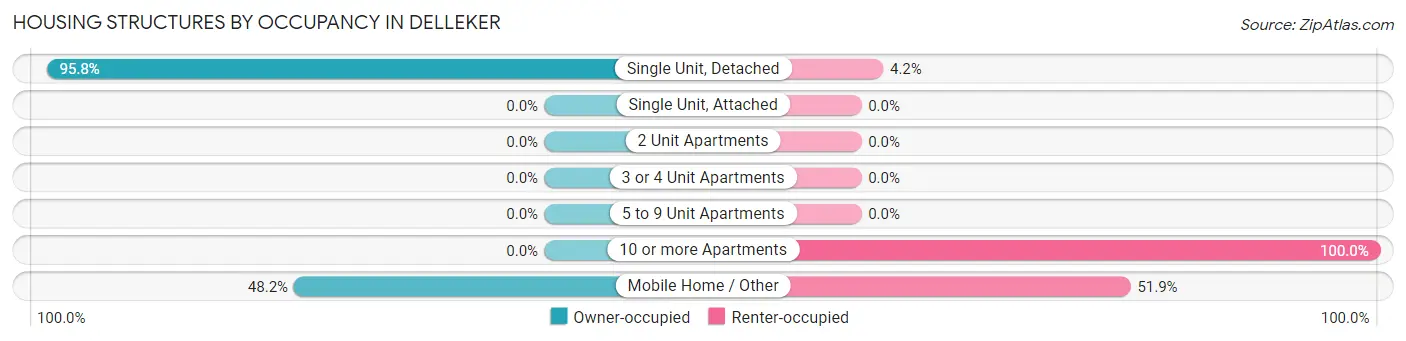
| Structure Type | Owner-occupied | Renter-occupied |
| Single Unit, Detached | 91 (95.8%) | 4 (4.2%) |
| Single Unit, Attached | 0 (0.0%) | 0 (0.0%) |
| 2 Unit Apartments | 0 (0.0%) | 0 (0.0%) |
| 3 or 4 Unit Apartments | 0 (0.0%) | 0 (0.0%) |
| 5 to 9 Unit Apartments | 0 (0.0%) | 0 (0.0%) |
| 10 or more Apartments | 0 (0.0%) | 24 (100.0%) |
| Mobile Home / Other | 13 (48.1%) | 14 (51.8%) |
| Total | 104 (71.2%) | 42 (28.8%) |
Housing Structures by Number of Rooms in Delleker
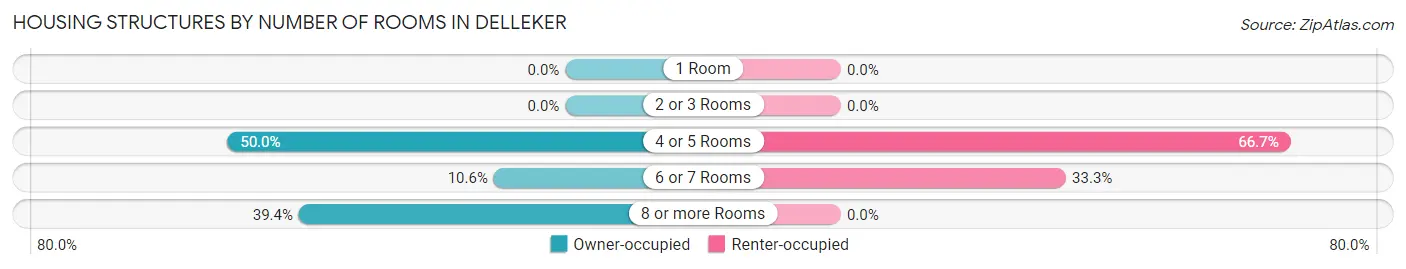
| Number of Rooms | Owner-occupied | Renter-occupied |
| 1 Room | 0 (0.0%) | 0 (0.0%) |
| 2 or 3 Rooms | 0 (0.0%) | 0 (0.0%) |
| 4 or 5 Rooms | 52 (50.0%) | 28 (66.7%) |
| 6 or 7 Rooms | 11 (10.6%) | 14 (33.3%) |
| 8 or more Rooms | 41 (39.4%) | 0 (0.0%) |
| Total | 104 (100.0%) | 42 (100.0%) |
Housing Structure by Heating Type in Delleker
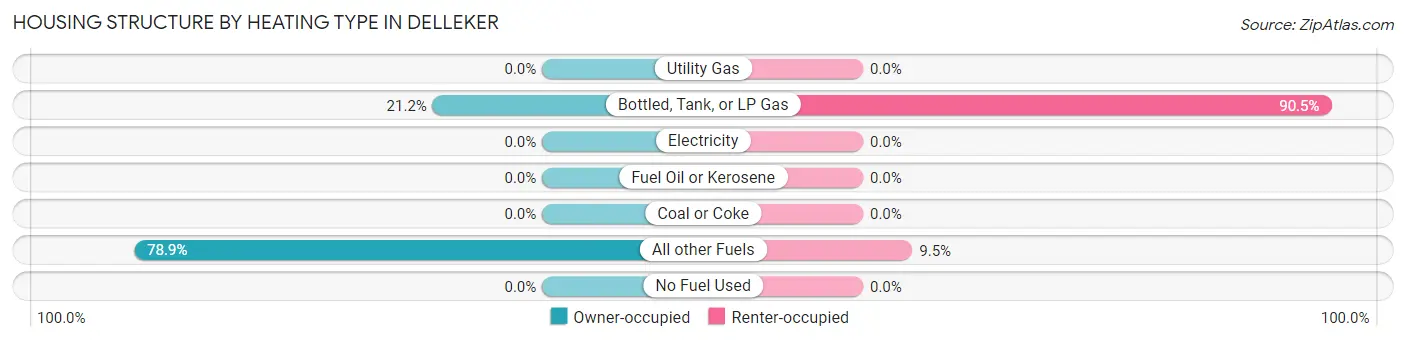
| Heating Type | Owner-occupied | Renter-occupied |
| Utility Gas | 0 (0.0%) | 0 (0.0%) |
| Bottled, Tank, or LP Gas | 22 (21.1%) | 38 (90.5%) |
| Electricity | 0 (0.0%) | 0 (0.0%) |
| Fuel Oil or Kerosene | 0 (0.0%) | 0 (0.0%) |
| Coal or Coke | 0 (0.0%) | 0 (0.0%) |
| All other Fuels | 82 (78.8%) | 4 (9.5%) |
| No Fuel Used | 0 (0.0%) | 0 (0.0%) |
| Total | 104 (100.0%) | 42 (100.0%) |
Household Vehicle Usage in Delleker
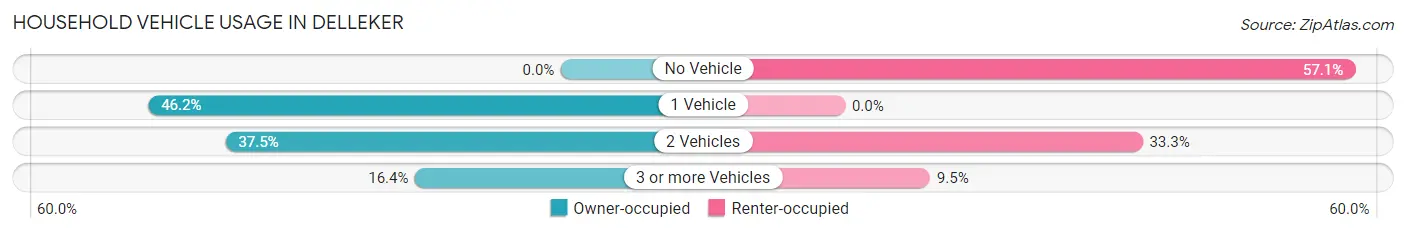
| Vehicles per Household | Owner-occupied | Renter-occupied |
| No Vehicle | 0 (0.0%) | 24 (57.1%) |
| 1 Vehicle | 48 (46.2%) | 0 (0.0%) |
| 2 Vehicles | 39 (37.5%) | 14 (33.3%) |
| 3 or more Vehicles | 17 (16.4%) | 4 (9.5%) |
| Total | 104 (100.0%) | 42 (100.0%) |
Real Estate & Mortgages in Delleker
Real Estate and Mortgage Overview in Delleker
| Characteristic | Without Mortgage | With Mortgage |
| Housing Units | 30 | 74 |
| Median Property Value | - | - |
| Median Household Income | $77,794 | $0 |
| Monthly Housing Costs | $712 | $0 |
| Real Estate Taxes | - | - |
Property Value by Mortgage Status in Delleker
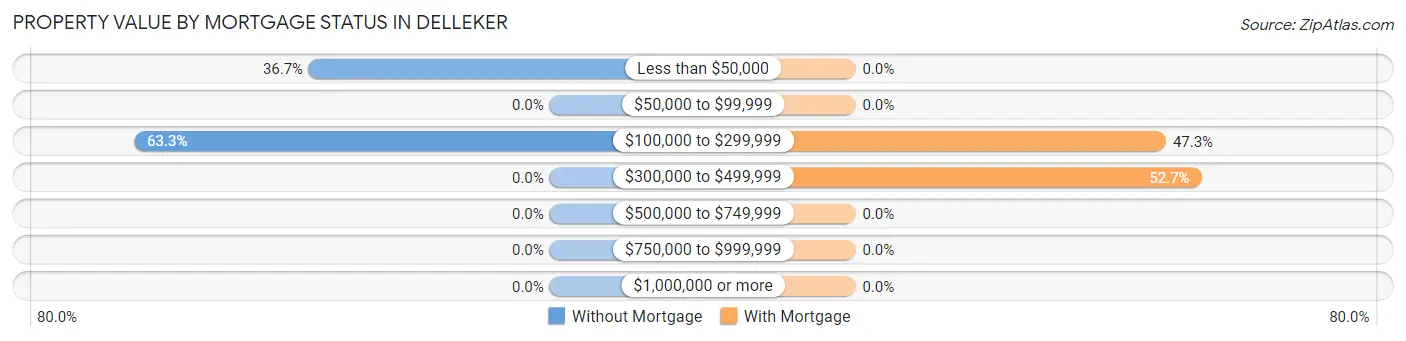
| Property Value | Without Mortgage | With Mortgage |
| Less than $50,000 | 11 (36.7%) | 0 (0.0%) |
| $50,000 to $99,999 | 0 (0.0%) | 0 (0.0%) |
| $100,000 to $299,999 | 19 (63.3%) | 35 (47.3%) |
| $300,000 to $499,999 | 0 (0.0%) | 39 (52.7%) |
| $500,000 to $749,999 | 0 (0.0%) | 0 (0.0%) |
| $750,000 to $999,999 | 0 (0.0%) | 0 (0.0%) |
| $1,000,000 or more | 0 (0.0%) | 0 (0.0%) |
| Total | 30 (100.0%) | 74 (100.0%) |
Household Income by Mortgage Status in Delleker
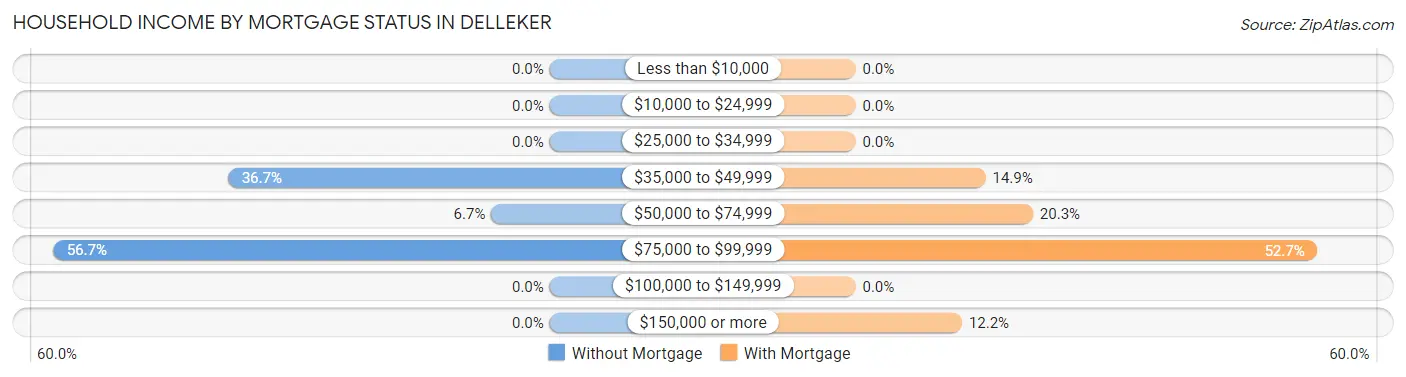
| Household Income | Without Mortgage | With Mortgage |
| Less than $10,000 | 0 (0.0%) | 0 (0.0%) |
| $10,000 to $24,999 | 0 (0.0%) | 0 (0.0%) |
| $25,000 to $34,999 | 0 (0.0%) | 0 (0.0%) |
| $35,000 to $49,999 | 11 (36.7%) | 11 (14.9%) |
| $50,000 to $74,999 | 2 (6.7%) | 15 (20.3%) |
| $75,000 to $99,999 | 17 (56.7%) | 39 (52.7%) |
| $100,000 to $149,999 | 0 (0.0%) | 0 (0.0%) |
| $150,000 or more | 0 (0.0%) | 9 (12.2%) |
| Total | 30 (100.0%) | 74 (100.0%) |
Property Value to Household Income Ratio in Delleker
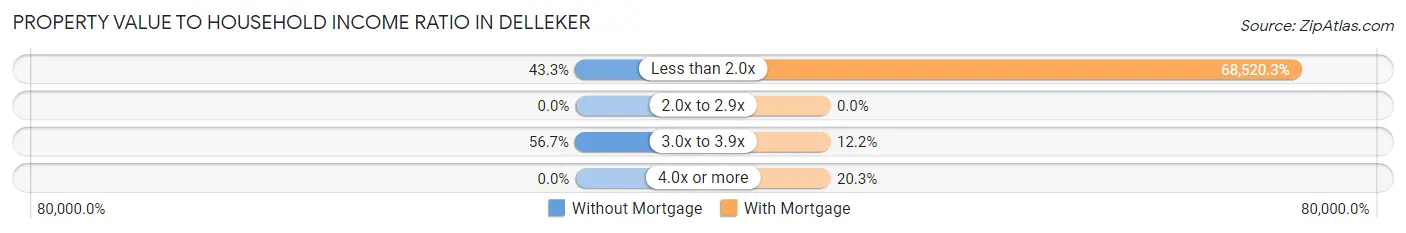
| Value-to-Income Ratio | Without Mortgage | With Mortgage |
| Less than 2.0x | 13 (43.3%) | 50,705 (68,520.3%) |
| 2.0x to 2.9x | 0 (0.0%) | 0 (0.0%) |
| 3.0x to 3.9x | 17 (56.7%) | 9 (12.2%) |
| 4.0x or more | 0 (0.0%) | 15 (20.3%) |
| Total | 30 (100.0%) | 74 (100.0%) |
Real Estate Taxes by Mortgage Status in Delleker
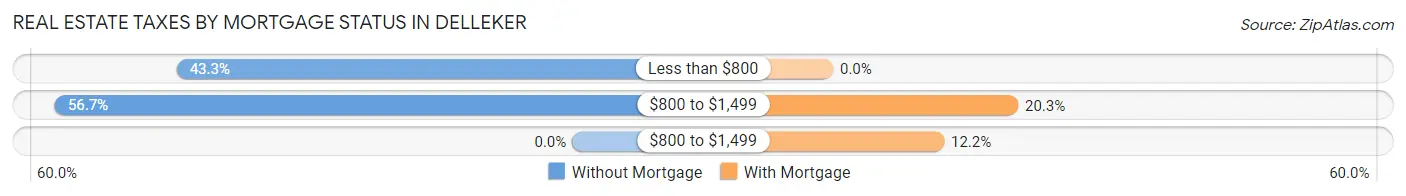
| Property Taxes | Without Mortgage | With Mortgage |
| Less than $800 | 13 (43.3%) | 0 (0.0%) |
| $800 to $1,499 | 17 (56.7%) | 15 (20.3%) |
| $800 to $1,499 | 0 (0.0%) | 9 (12.2%) |
| Total | 30 (100.0%) | 74 (100.0%) |
Health & Disability in Delleker
Health Insurance Coverage by Age in Delleker
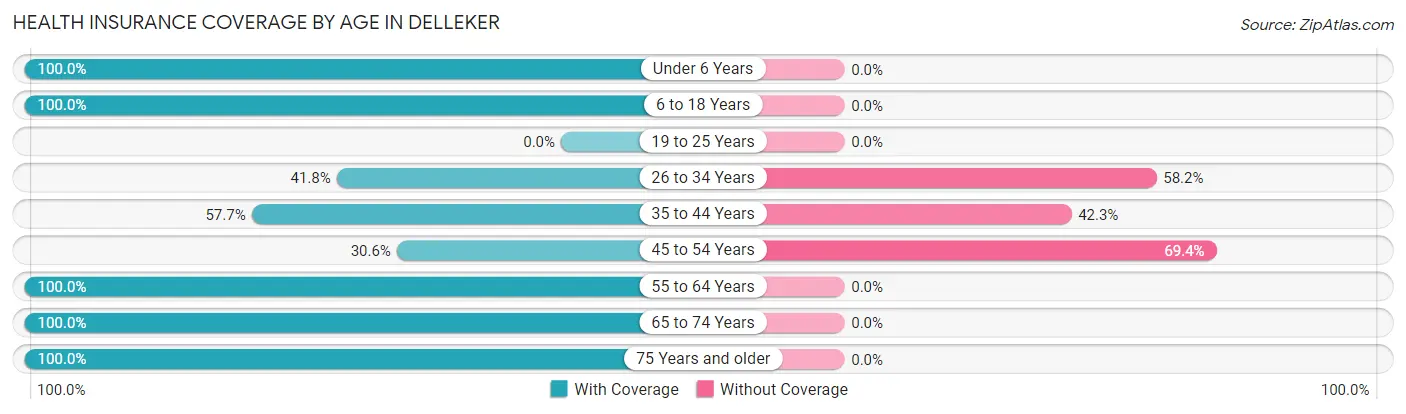
| Age Bracket | With Coverage | Without Coverage |
| Under 6 Years | 24 (100.0%) | 0 (0.0%) |
| 6 to 18 Years | 94 (100.0%) | 0 (0.0%) |
| 19 to 25 Years | 0 (0.0%) | 0 (0.0%) |
| 26 to 34 Years | 23 (41.8%) | 32 (58.2%) |
| 35 to 44 Years | 15 (57.7%) | 11 (42.3%) |
| 45 to 54 Years | 15 (30.6%) | 34 (69.4%) |
| 55 to 64 Years | 35 (100.0%) | 0 (0.0%) |
| 65 to 74 Years | 33 (100.0%) | 0 (0.0%) |
| 75 Years and older | 67 (100.0%) | 0 (0.0%) |
| Total | 306 (79.9%) | 77 (20.1%) |
Health Insurance Coverage by Citizenship Status in Delleker
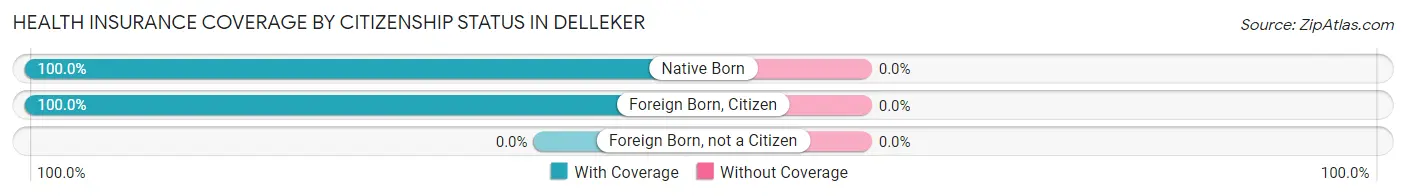
| Citizenship Status | With Coverage | Without Coverage |
| Native Born | 24 (100.0%) | 0 (0.0%) |
| Foreign Born, Citizen | 94 (100.0%) | 0 (0.0%) |
| Foreign Born, not a Citizen | 0 (0.0%) | 0 (0.0%) |
Health Insurance Coverage by Household Income in Delleker
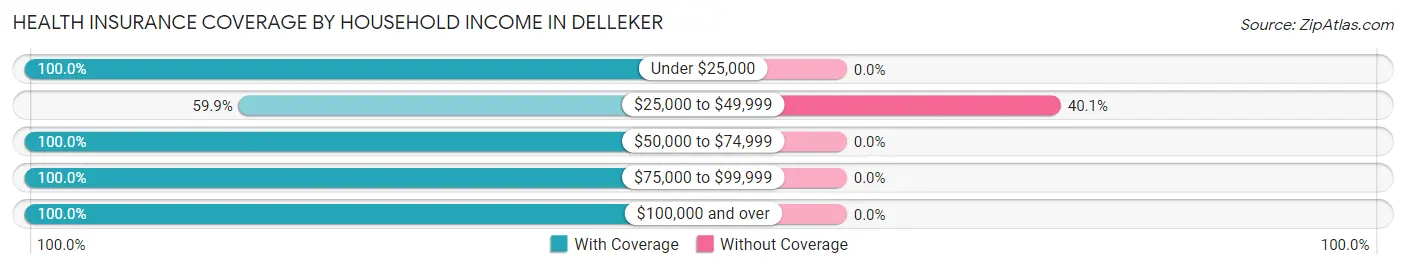
| Household Income | With Coverage | Without Coverage |
| Under $25,000 | 24 (100.0%) | 0 (0.0%) |
| $25,000 to $49,999 | 115 (59.9%) | 77 (40.1%) |
| $50,000 to $74,999 | 111 (100.0%) | 0 (0.0%) |
| $75,000 to $99,999 | 47 (100.0%) | 0 (0.0%) |
| $100,000 and over | 9 (100.0%) | 0 (0.0%) |
Public vs Private Health Insurance Coverage by Age in Delleker
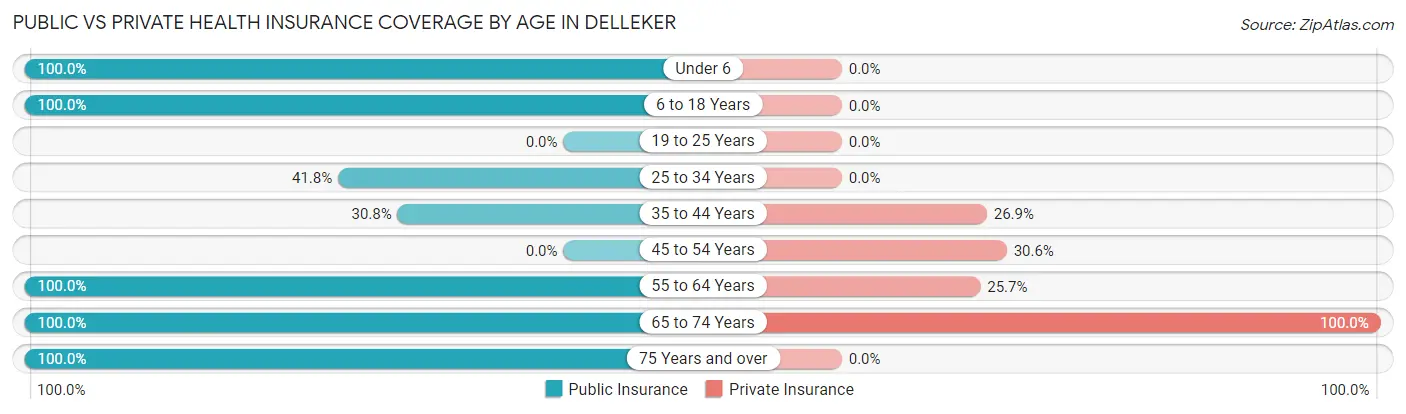
| Age Bracket | Public Insurance | Private Insurance |
| Under 6 | 24 (100.0%) | 0 (0.0%) |
| 6 to 18 Years | 94 (100.0%) | 0 (0.0%) |
| 19 to 25 Years | 0 (0.0%) | 0 (0.0%) |
| 25 to 34 Years | 23 (41.8%) | 0 (0.0%) |
| 35 to 44 Years | 8 (30.8%) | 7 (26.9%) |
| 45 to 54 Years | 0 (0.0%) | 15 (30.6%) |
| 55 to 64 Years | 35 (100.0%) | 9 (25.7%) |
| 65 to 74 Years | 33 (100.0%) | 33 (100.0%) |
| 75 Years and over | 67 (100.0%) | 0 (0.0%) |
| Total | 284 (74.2%) | 64 (16.7%) |
Disability Status by Sex by Age in Delleker
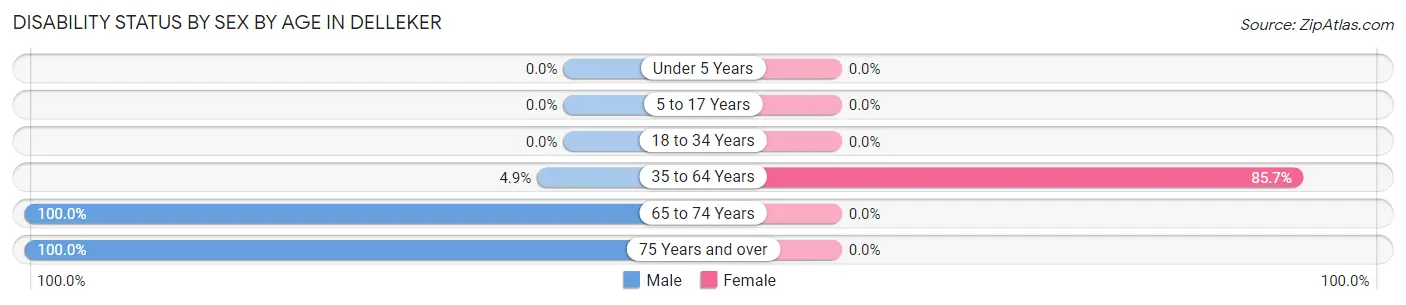
| Age Bracket | Male | Female |
| Under 5 Years | 0 (0.0%) | 0 (0.0%) |
| 5 to 17 Years | 0 (0.0%) | 0 (0.0%) |
| 18 to 34 Years | 0 (0.0%) | 0 (0.0%) |
| 35 to 64 Years | 4 (4.9%) | 24 (85.7%) |
| 65 to 74 Years | 17 (100.0%) | 0 (0.0%) |
| 75 Years and over | 39 (100.0%) | 0 (0.0%) |
Disability Class by Sex by Age in Delleker
Disability Class: Hearing Difficulty
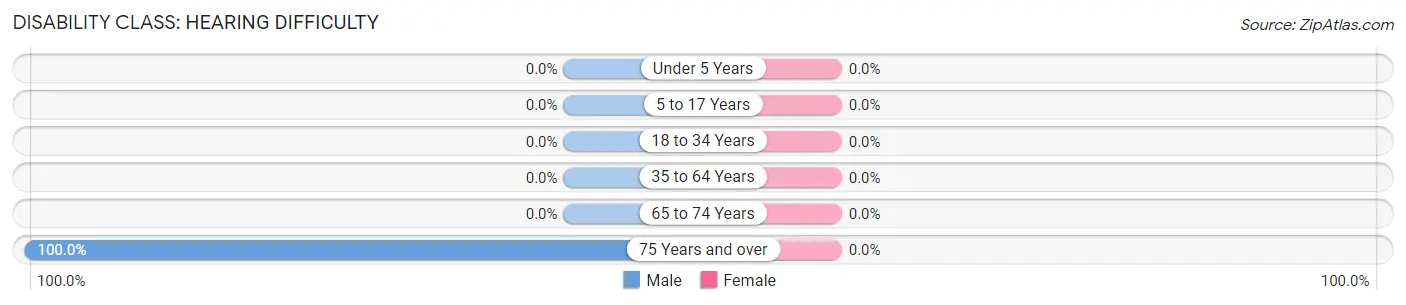
| Age Bracket | Male | Female |
| Under 5 Years | 0 (0.0%) | 0 (0.0%) |
| 5 to 17 Years | 0 (0.0%) | 0 (0.0%) |
| 18 to 34 Years | 0 (0.0%) | 0 (0.0%) |
| 35 to 64 Years | 0 (0.0%) | 0 (0.0%) |
| 65 to 74 Years | 0 (0.0%) | 0 (0.0%) |
| 75 Years and over | 39 (100.0%) | 0 (0.0%) |
Disability Class: Vision Difficulty
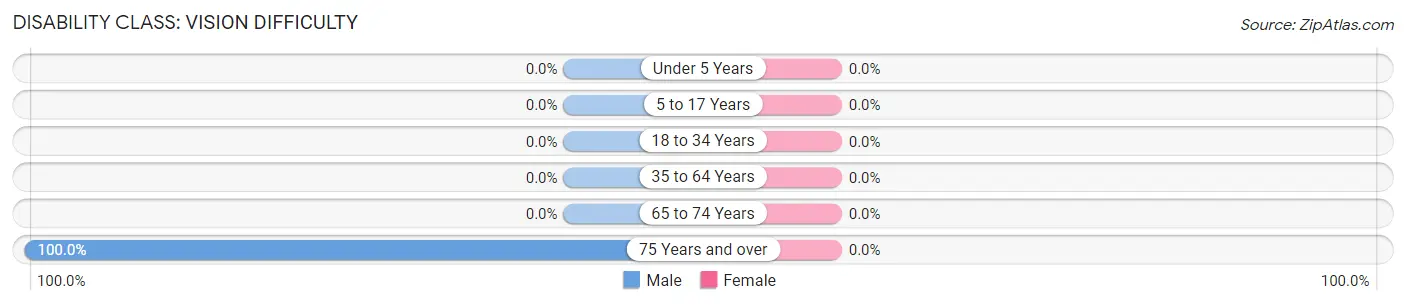
| Age Bracket | Male | Female |
| Under 5 Years | 0 (0.0%) | 0 (0.0%) |
| 5 to 17 Years | 0 (0.0%) | 0 (0.0%) |
| 18 to 34 Years | 0 (0.0%) | 0 (0.0%) |
| 35 to 64 Years | 0 (0.0%) | 0 (0.0%) |
| 65 to 74 Years | 0 (0.0%) | 0 (0.0%) |
| 75 Years and over | 39 (100.0%) | 0 (0.0%) |
Disability Class: Cognitive Difficulty
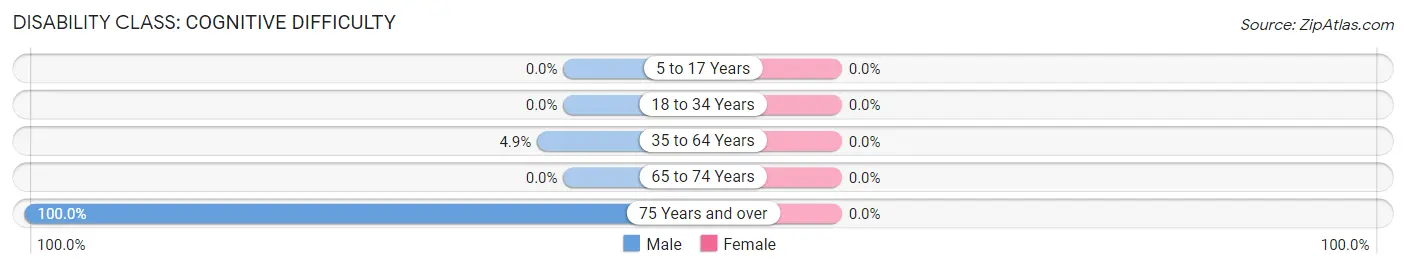
| Age Bracket | Male | Female |
| 5 to 17 Years | 0 (0.0%) | 0 (0.0%) |
| 18 to 34 Years | 0 (0.0%) | 0 (0.0%) |
| 35 to 64 Years | 4 (4.9%) | 0 (0.0%) |
| 65 to 74 Years | 0 (0.0%) | 0 (0.0%) |
| 75 Years and over | 39 (100.0%) | 0 (0.0%) |
Disability Class: Ambulatory Difficulty
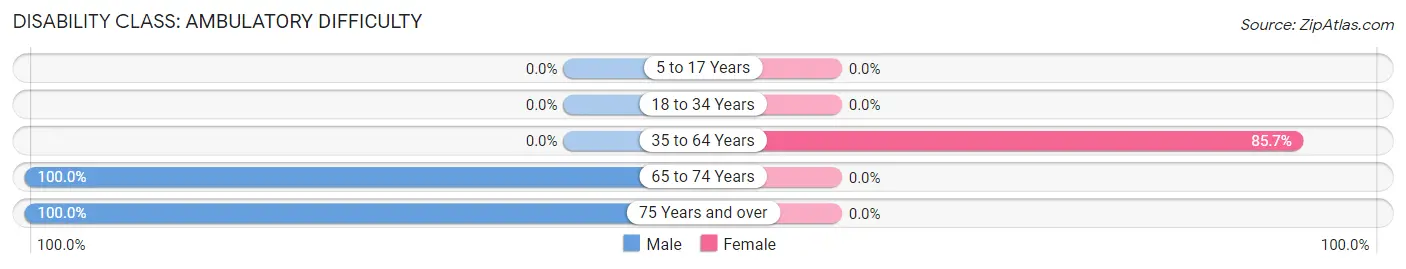
| Age Bracket | Male | Female |
| 5 to 17 Years | 0 (0.0%) | 0 (0.0%) |
| 18 to 34 Years | 0 (0.0%) | 0 (0.0%) |
| 35 to 64 Years | 0 (0.0%) | 24 (85.7%) |
| 65 to 74 Years | 17 (100.0%) | 0 (0.0%) |
| 75 Years and over | 39 (100.0%) | 0 (0.0%) |
Disability Class: Self-Care Difficulty
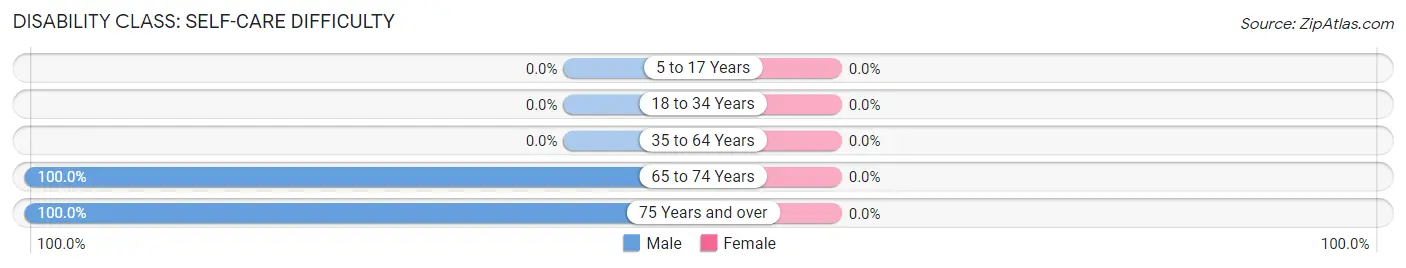
| Age Bracket | Male | Female |
| 5 to 17 Years | 0 (0.0%) | 0 (0.0%) |
| 18 to 34 Years | 0 (0.0%) | 0 (0.0%) |
| 35 to 64 Years | 0 (0.0%) | 0 (0.0%) |
| 65 to 74 Years | 17 (100.0%) | 0 (0.0%) |
| 75 Years and over | 39 (100.0%) | 0 (0.0%) |
Technology Access in Delleker
Computing Device Access in Delleker
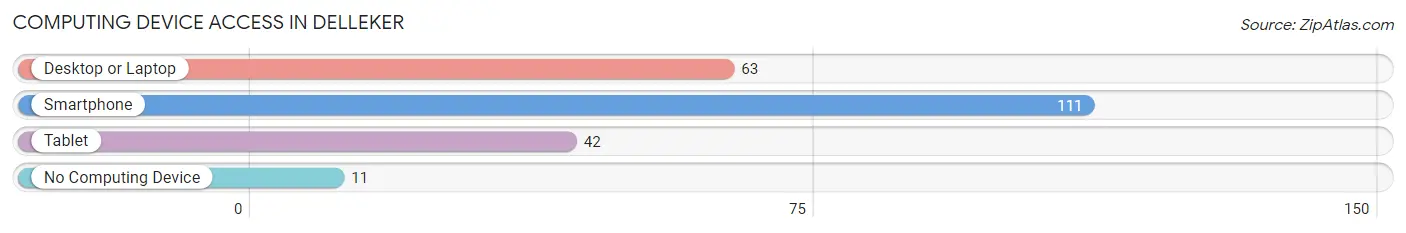
| Device Type | # Households | % Households |
| Desktop or Laptop | 63 | 43.1% |
| Smartphone | 111 | 76.0% |
| Tablet | 42 | 28.8% |
| No Computing Device | 11 | 7.5% |
| Total | 146 | 100.0% |
Internet Access in Delleker
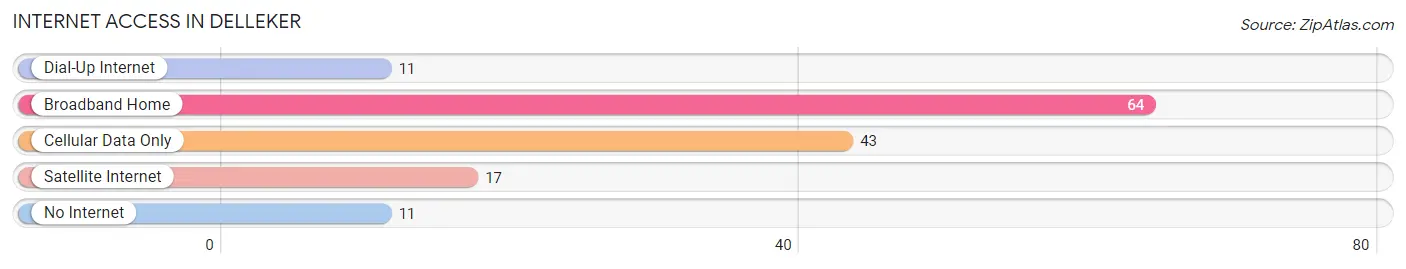
| Internet Type | # Households | % Households |
| Dial-Up Internet | 11 | 7.5% |
| Broadband Home | 64 | 43.8% |
| Cellular Data Only | 43 | 29.4% |
| Satellite Internet | 17 | 11.6% |
| No Internet | 11 | 7.5% |
| Total | 146 | 100.0% |
Delleker Summary
California is the most populous state in the United States and the third largest by area. It is located on the West Coast of the United States and is bordered by Oregon to the north, Nevada to the east, and Arizona to the southeast. California is known for its diverse geography, ranging from the Pacific Coast to the Sierra Nevada Mountains, and from the Redwood and Douglas-fir forests of the northwest to the Mojave Desert areas in the southeast.
Geography
California is divided into four distinct geographic regions: the Coast Ranges, the Central Valley, the Sierra Nevada Mountains, and the Mojave Desert. The Coast Ranges are a series of mountain ranges that run along the Pacific Coast from the Oregon border to the Mexican border. The Central Valley is a large agricultural region that runs through the center of the state. The Sierra Nevada Mountains are a range of mountains that run along the eastern side of the state, and the Mojave Desert is a large desert region in the southeastern corner of the state.
The climate of California is generally mild, with temperatures ranging from hot in the summer to cool in the winter. The coastal areas tend to be cooler than the inland areas, and the mountain regions tend to be cooler than the desert regions.
Economy
California has a diverse economy, with a variety of industries contributing to its overall economic output. The state is a major producer of agricultural products, including fruits, vegetables, nuts, and dairy products. It is also a major producer of technology products, including computers, software, and electronics. California is also a major producer of entertainment products, including movies, television shows, and music.
California is home to many of the world’s largest companies, including Apple, Google, Facebook, and Disney. The state is also home to many of the world’s leading universities, including Stanford, UC Berkeley, and UCLA.
Demographics
California is the most populous state in the United States, with an estimated population of 39.5 million in 2019. The state is home to a diverse population, with the largest ethnic groups being Hispanic (38.9%), White (36.6%), Asian (15.5%), and African American (5.8%).
California is also home to a large immigrant population, with an estimated 11.2 million immigrants living in the state in 2019. The largest immigrant groups are from Mexico (4.9 million), China (1.2 million), and India (1.1 million).
Conclusion
California is a diverse and vibrant state with a rich history, geography, economy, and demographics. It is home to a variety of industries, including agriculture, technology, entertainment, and education. It is also home to a diverse population, with the largest ethnic groups being Hispanic, White, Asian, and African American. California is also home to a large immigrant population, with the largest immigrant groups being from Mexico, China, and India.
Common Questions
What is Per Capita Income in Delleker?
Per Capita income in Delleker is $19,058.
What is the Median Family Income in Delleker?
Median Family Income in Delleker is $63,482.
What is the Median Household income in Delleker?
Median Household Income in Delleker is $50,769.
What is Inequality or Gini Index in Delleker?
Inequality or Gini Index in Delleker is 0.29.
What is the Total Population of Delleker?
Total Population of Delleker is 383.
What is the Total Male Population of Delleker?
Total Male Population of Delleker is 240.
What is the Total Female Population of Delleker?
Total Female Population of Delleker is 143.
What is the Ratio of Males per 100 Females in Delleker?
There are 167.83 Males per 100 Females in Delleker.
What is the Ratio of Females per 100 Males in Delleker?
There are 59.58 Females per 100 Males in Delleker.
What is the Median Population Age in Delleker?
Median Population Age in Delleker is 39.6 Years.
What is the Average Family Size in Delleker
Average Family Size in Delleker is 5.0 People.
What is the Average Household Size in Delleker
Average Household Size in Delleker is 2.6 People.
How Large is the Labor Force in Delleker?
There are 103 People in the Labor Forcein in Delleker.
What is the Percentage of People in the Labor Force in Delleker?
38.9% of People are in the Labor Force in Delleker.
What is the Unemployment Rate in Delleker?
Unemployment Rate in Delleker is 33.0%.