Cities with the Highest Percentage of Population Employed in Legal Services & Support in the United States
RELATED REPORTS & OPTIONS
Legal Services & Support
United States
Compare Cities
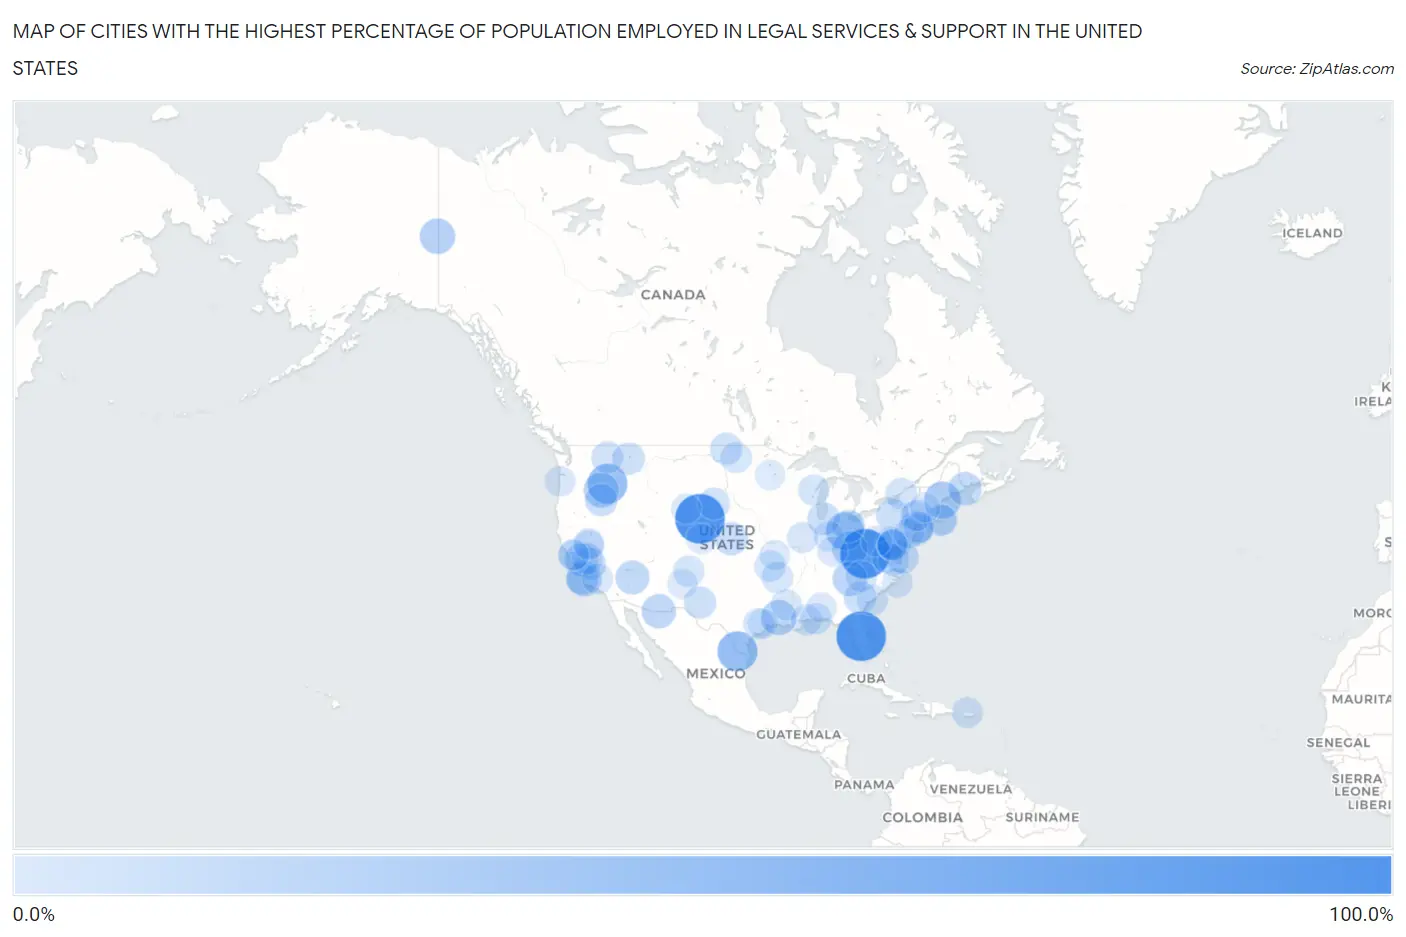
Map of Cities with the Highest Percentage of Population Employed in Legal Services & Support in the United States
0.0%
100.0%
Cities with the Highest Percentage of Population Employed in Legal Services & Support in the United States
| City | % Employed | vs State | vs National | |
| 1. | Hawk Springs | 100.0% | 0.82%(+99.2)#1 | 1.2%(+98.8)#1 |
| 2. | Seton | 100.0% | 1.3%(+98.7)#1 | 1.2%(+98.8)#2 |
| 3. | Deer Canyon | 100.0% | 1.3%(+98.7)#2 | 1.2%(+98.8)#3 |
| 4. | Lake Buena Vista | 100.0% | 1.3%(+98.7)#1 | 1.2%(+98.8)#4 |
| 5. | Thurmond | 100.0% | 1.1%(+98.9)#1 | 1.2%(+98.8)#5 |
| 6. | Garceno | 57.1% | 1.0%(+56.1)#1 | 1.2%(+56.0)#6 |
| 7. | Preble | 57.1% | 0.76%(+56.4)#1 | 1.2%(+56.0)#7 |
| 8. | Wallowa Lake | 56.6% | 1.1%(+55.5)#1 | 1.2%(+55.4)#8 |
| 9. | London | 50.0% | 0.76%(+49.2)#2 | 1.2%(+48.8)#9 |
| 10. | Lewistown | 48.0% | 0.92%(+47.1)#1 | 1.2%(+46.8)#10 |
| 11. | Caesars Head | 46.2% | 0.97%(+45.2)#1 | 1.2%(+45.0)#11 |
| 12. | Littlejohn Island | 43.1% | 0.95%(+42.2)#1 | 1.2%(+42.0)#12 |
| 13. | Grafton | 40.7% | 1.3%(+39.5)#1 | 1.2%(+39.6)#13 |
| 14. | Rumsey | 40.4% | 1.3%(+39.1)#1 | 1.2%(+39.2)#14 |
| 15. | Eagle Village | 37.5% | 0.97%(+36.5)#1 | 1.2%(+36.3)#15 |
| 16. | Edna | 37.1% | 1.3%(+35.8)#2 | 1.2%(+35.9)#16 |
| 17. | Garrison | 37.0% | 0.95%(+36.0)#1 | 1.2%(+35.8)#17 |
| 18. | Longville | 36.4% | 1.3%(+35.0)#1 | 1.2%(+35.2)#18 |
| 19. | Sumpter | 36.4% | 1.1%(+35.3)#2 | 1.2%(+35.2)#19 |
| 20. | Silverton | 35.8% | 0.88%(+34.9)#1 | 1.2%(+34.6)#20 |
| 21. | Glenville | 34.2% | 0.86%(+33.4)#1 | 1.2%(+33.1)#21 |
| 22. | Bridgeport | 33.3% | 1.5%(+31.8)#1 | 1.2%(+32.1)#22 |
| 23. | Palominas | 32.6% | 0.99%(+31.7)#1 | 1.2%(+31.5)#23 |
| 24. | Bluff Dale | 31.2% | 1.0%(+30.2)#2 | 1.2%(+30.1)#24 |
| 25. | Valentine | 30.8% | 0.99%(+29.8)#2 | 1.2%(+29.6)#25 |
| 26. | Lubec | 29.5% | 0.95%(+28.6)#2 | 1.2%(+28.4)#26 |
| 27. | Stevinson | 28.8% | 1.3%(+27.6)#3 | 1.2%(+27.7)#27 |
| 28. | Saddle Rock Estates | 28.2% | 1.9%(+26.3)#1 | 1.2%(+27.0)#28 |
| 29. | Edmond | 27.1% | 0.90%(+26.2)#1 | 1.2%(+26.0)#29 |
| 30. | Chevy Chase Village | 25.9% | 1.8%(+24.1)#1 | 1.2%(+24.7)#30 |
| 31. | Mccutchenville | 25.9% | 0.92%(+25.0)#2 | 1.2%(+24.7)#31 |
| 32. | Michiana | 25.8% | 0.89%(+24.9)#1 | 1.2%(+24.6)#32 |
| 33. | Chevy Chase Section Three | 25.5% | 1.8%(+23.7)#2 | 1.2%(+24.3)#33 |
| 34. | Coopers Plains | 25.2% | 1.9%(+23.3)#2 | 1.2%(+24.0)#34 |
| 35. | Juntura | 25.0% | 1.1%(+23.9)#3 | 1.2%(+23.8)#35 |
| 36. | Quinby | 24.8% | 1.6%(+23.1)#1 | 1.2%(+23.6)#36 |
| 37. | Lake Huntington | 24.5% | 1.9%(+22.6)#3 | 1.2%(+23.3)#37 |
| 38. | Sardis | 24.3% | 1.1%(+23.2)#1 | 1.2%(+23.1)#38 |
| 39. | Lindisfarne | 24.3% | 0.99%(+23.3)#1 | 1.2%(+23.1)#39 |
| 40. | Fort Washington | 23.7% | 1.3%(+22.5)#4 | 1.2%(+22.6)#40 |
| 41. | Livingston Wheeler | 23.6% | 1.3%(+22.3)#3 | 1.2%(+22.4)#41 |
| 42. | Westwood | 23.4% | 0.76%(+22.6)#3 | 1.2%(+22.2)#42 |
| 43. | Popponesset Island | 23.1% | 1.5%(+21.6)#1 | 1.2%(+21.9)#43 |
| 44. | Porcupine | 23.0% | 0.65%(+22.3)#1 | 1.2%(+21.8)#44 |
| 45. | Avila Beach | 22.9% | 1.3%(+21.6)#5 | 1.2%(+21.7)#45 |
| 46. | Green Bluff | 22.6% | 1.1%(+21.6)#1 | 1.2%(+21.5)#46 |
| 47. | Wever | 22.2% | 0.75%(+21.5)#1 | 1.2%(+21.0)#47 |
| 48. | Gardena | 22.2% | 0.59%(+21.6)#1 | 1.2%(+21.0)#48 |
| 49. | Thousand Island Park | 21.8% | 1.9%(+19.9)#4 | 1.2%(+20.6)#49 |
| 50. | Radley | 21.7% | 0.90%(+20.8)#2 | 1.2%(+20.5)#50 |
| 51. | Diablo | 21.6% | 1.3%(+20.4)#6 | 1.2%(+20.4)#51 |
| 52. | Barnesville | 21.6% | 1.8%(+19.8)#3 | 1.2%(+20.4)#52 |
| 53. | Charles City | 21.1% | 1.6%(+19.4)#2 | 1.2%(+19.9)#53 |
| 54. | Belwood | 20.3% | 0.86%(+19.5)#2 | 1.2%(+19.2)#54 |
| 55. | Hewlett Bay Park | 20.3% | 1.9%(+18.4)#5 | 1.2%(+19.1)#55 |
| 56. | Truchas | 20.3% | 1.3%(+19.0)#4 | 1.2%(+19.1)#56 |
| 57. | Oberon | 20.0% | 0.59%(+19.4)#2 | 1.2%(+18.8)#57 |
| 58. | New Blaine | 19.9% | 0.79%(+19.1)#1 | 1.2%(+18.7)#58 |
| 59. | Powhatan | 19.8% | 1.6%(+18.2)#3 | 1.2%(+18.6)#59 |
| 60. | Ginger Blue | 19.7% | 0.99%(+18.7)#1 | 1.2%(+18.6)#60 |
| 61. | Catheys Valley | 19.4% | 1.3%(+18.1)#7 | 1.2%(+18.2)#61 |
| 62. | Angelica | 19.2% | 0.72%(+18.5)#1 | 1.2%(+18.0)#62 |
| 63. | Folly Beach | 19.2% | 0.97%(+18.2)#2 | 1.2%(+18.0)#63 |
| 64. | Point Clear | 19.1% | 0.90%(+18.2)#1 | 1.2%(+17.9)#64 |
| 65. | Claverack Red Mills | 19.1% | 1.9%(+17.2)#6 | 1.2%(+17.9)#65 |
| 66. | Pattison | 19.0% | 1.0%(+18.0)#3 | 1.2%(+17.8)#66 |
| 67. | Columbia | 19.0% | 1.3%(+17.6)#2 | 1.2%(+17.8)#67 |
| 68. | Henderson Point | 18.8% | 0.75%(+18.0)#1 | 1.2%(+17.6)#68 |
| 69. | Eldorado | 18.7% | 1.1%(+17.6)#1 | 1.2%(+17.5)#69 |
| 70. | Conejo | 18.6% | 1.3%(+17.3)#5 | 1.2%(+17.5)#70 |
| 71. | Garrochales | 18.6% | 1.0%(+17.6)#1 | 1.2%(+17.5)#71 |
| 72. | Keene | 18.6% | 1.3%(+17.3)#8 | 1.2%(+17.4)#72 |
| 73. | Santa Fe Foothills | 18.5% | 1.3%(+17.2)#6 | 1.2%(+17.3)#73 |
| 74. | Somerset | 18.2% | 1.8%(+16.4)#4 | 1.2%(+17.0)#74 |
| 75. | Berlin | 18.2% | 1.3%(+16.8)#1 | 1.2%(+17.0)#75 |
| 76. | Mount Royal | 17.9% | 1.5%(+16.4)#2 | 1.2%(+16.7)#76 |
| 77. | Crellin | 17.7% | 1.8%(+15.9)#5 | 1.2%(+16.5)#77 |
| 78. | Glenbrook | 17.3% | 0.99%(+16.3)#1 | 1.2%(+16.1)#78 |
| 79. | Stonebridge | 17.3% | 1.5%(+15.7)#3 | 1.2%(+16.1)#79 |
| 80. | Crows Nest | 17.2% | 0.76%(+16.5)#4 | 1.2%(+16.1)#80 |
| 81. | Knappa | 17.1% | 1.1%(+16.0)#4 | 1.2%(+15.9)#81 |
| 82. | Davis | 16.9% | 0.86%(+16.0)#3 | 1.2%(+15.7)#82 |
| 83. | Woodside | 16.9% | 1.1%(+15.7)#2 | 1.2%(+15.7)#83 |
| 84. | Skyland | 16.8% | 0.99%(+15.8)#2 | 1.2%(+15.6)#84 |
| 85. | Cove Neck | 16.8% | 1.9%(+14.9)#7 | 1.2%(+15.6)#85 |
| 86. | Cape Meares | 16.7% | 1.1%(+15.6)#5 | 1.2%(+15.5)#86 |
| 87. | Malden On Hudson | 16.5% | 1.9%(+14.7)#8 | 1.2%(+15.3)#87 |
| 88. | Brookmont | 16.4% | 1.8%(+14.7)#6 | 1.2%(+15.2)#88 |
| 89. | Pueblitos | 16.2% | 1.3%(+14.9)#7 | 1.2%(+15.0)#89 |
| 90. | Strathmoor Manor | 16.2% | 0.95%(+15.2)#2 | 1.2%(+15.0)#90 |
| 91. | Prairiewood | 16.0% | 0.65%(+15.4)#2 | 1.2%(+14.8)#91 |
| 92. | Harwich Port | 15.9% | 1.5%(+14.4)#2 | 1.2%(+14.7)#92 |
| 93. | Beatrice | 15.8% | 0.90%(+14.9)#2 | 1.2%(+14.6)#93 |
| 94. | Meadow Acres | 15.8% | 0.82%(+15.0)#2 | 1.2%(+14.6)#94 |
| 95. | Collins | 15.8% | 0.99%(+14.8)#2 | 1.2%(+14.6)#95 |
| 96. | Putney | 15.7% | 1.3%(+14.5)#2 | 1.2%(+14.6)#96 |
| 97. | Acalanes Ridge | 15.7% | 1.3%(+14.4)#9 | 1.2%(+14.5)#97 |
| 98. | Fort Ripley | 15.6% | 1.0%(+14.6)#1 | 1.2%(+14.4)#98 |
| 99. | Peoria | 15.6% | 1.2%(+14.4)#1 | 1.2%(+14.4)#99 |
| 100. | Spring Valley Village | 15.5% | 1.0%(+14.5)#4 | 1.2%(+14.4)#100 |
Common Questions
What are the Top 10 Cities with the Highest Percentage of Population Employed in Legal Services & Support in the United States?
Top 10 Cities with the Highest Percentage of Population Employed in Legal Services & Support in the United States are:
#1
100.0%
#2
100.0%
#3
100.0%
#4
57.1%
#5
56.6%
#6
48.0%
#7
43.1%
#8
37.5%
#9
37.1%
#10
37.0%
What city has the Highest Percentage of Population Employed in Legal Services & Support in the United States?
Hawk Springs has the Highest Percentage of Population Employed in Legal Services & Support in the United States with 100.0%.
What is the Percentage of Population Employed in Legal Services & Support in the United States?
Percentage of Population Employed in Legal Services & Support in the United States is 1.2%.