Cities with the Highest Percentage of Population Employed in Legal Services & Support in Georgia
RELATED REPORTS & OPTIONS
Legal Services & Support
Georgia
Compare Cities
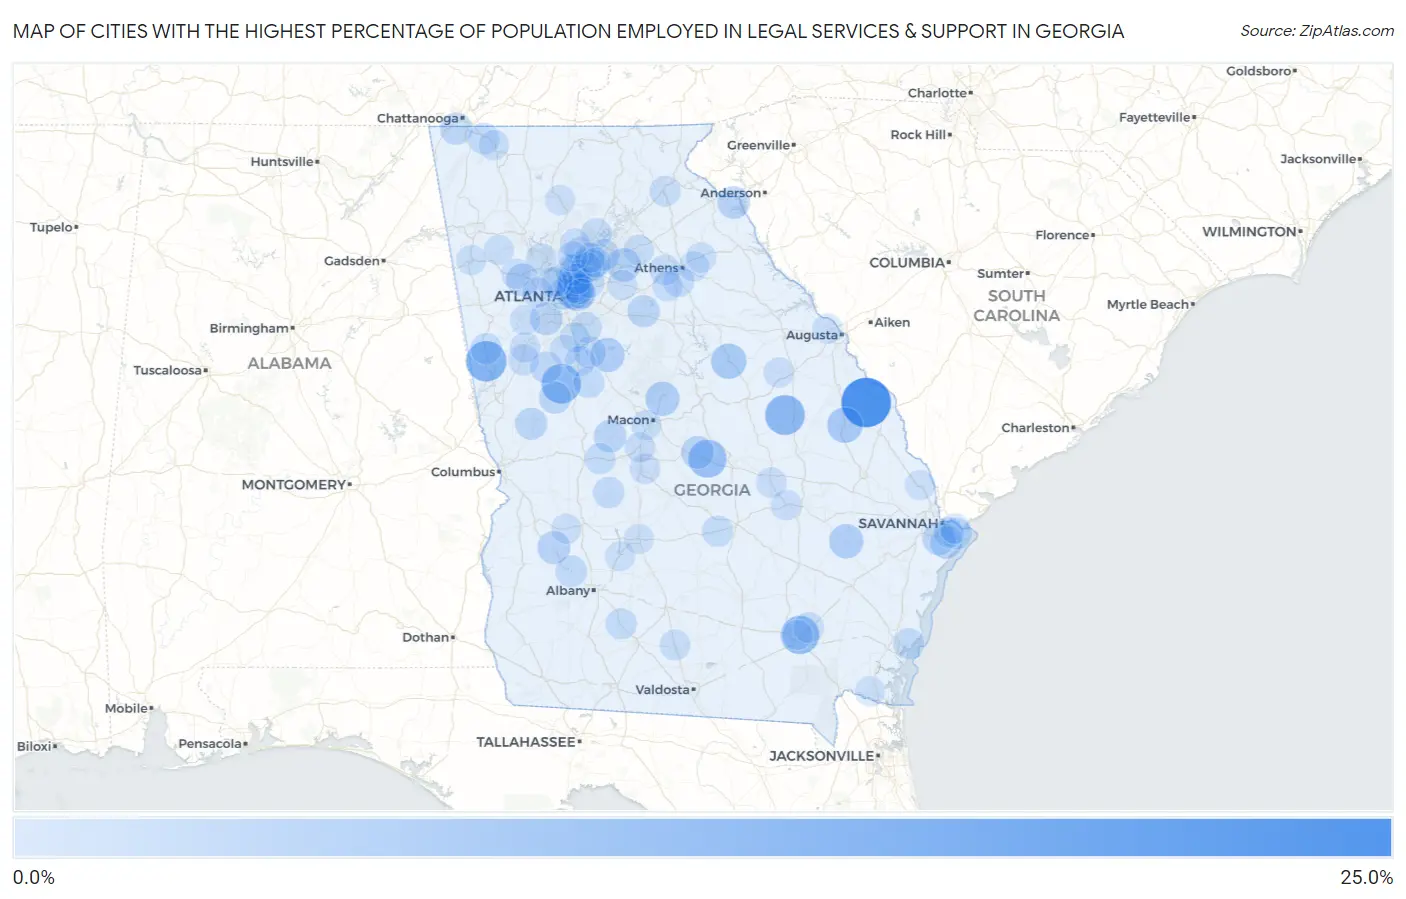
Map of Cities with the Highest Percentage of Population Employed in Legal Services & Support in Georgia
0.0%
25.0%
Cities with the Highest Percentage of Population Employed in Legal Services & Support in Georgia
| City | % Employed | vs State | vs National | |
| 1. | Sardis | 24.3% | 1.1%(+23.2)#1 | 1.2%(+23.1)#38 |
| 2. | Franklin | 13.5% | 1.1%(+12.4)#2 | 1.2%(+12.3)#130 |
| 3. | Bartow | 12.5% | 1.1%(+11.4)#3 | 1.2%(+11.3)#148 |
| 4. | Hilltop | 12.2% | 1.1%(+11.1)#4 | 1.2%(+11.1)#158 |
| 5. | Sunnyside | 10.8% | 1.1%(+9.73)#5 | 1.2%(+9.65)#189 |
| 6. | Montrose | 10.4% | 1.1%(+9.30)#6 | 1.2%(+9.22)#204 |
| 7. | Druid Hills | 7.7% | 1.1%(+6.58)#7 | 1.2%(+6.50)#360 |
| 8. | Millen | 7.7% | 1.1%(+6.56)#8 | 1.2%(+6.48)#363 |
| 9. | Sparta | 7.3% | 1.1%(+6.22)#9 | 1.2%(+6.14)#402 |
| 10. | Glennville | 6.2% | 1.1%(+5.07)#10 | 1.2%(+4.99)#569 |
| 11. | Jenkinsburg | 6.2% | 1.1%(+5.06)#11 | 1.2%(+4.98)#570 |
| 12. | Gray | 6.0% | 1.1%(+4.87)#12 | 1.2%(+4.79)#609 |
| 13. | Decatur | 5.9% | 1.1%(+4.82)#13 | 1.2%(+4.74)#620 |
| 14. | Berkeley Lake | 5.9% | 1.1%(+4.82)#14 | 1.2%(+4.74)#621 |
| 15. | Dacula | 5.4% | 1.1%(+4.26)#15 | 1.2%(+4.18)#743 |
| 16. | Antioch | 4.8% | 1.1%(+3.74)#16 | 1.2%(+3.66)#893 |
| 17. | North Druid Hills | 4.8% | 1.1%(+3.70)#17 | 1.2%(+3.62)#904 |
| 18. | Parrott | 4.5% | 1.1%(+3.44)#18 | 1.2%(+3.36)#1,005 |
| 19. | Union City | 4.5% | 1.1%(+3.37)#19 | 1.2%(+3.29)#1,020 |
| 20. | Hiram | 4.4% | 1.1%(+3.31)#20 | 1.2%(+3.23)#1,041 |
| 21. | Reed Creek | 4.3% | 1.1%(+3.24)#21 | 1.2%(+3.16)#1,068 |
| 22. | Danville | 4.3% | 1.1%(+3.24)#22 | 1.2%(+3.16)#1,070 |
| 23. | Brookhaven | 4.3% | 1.1%(+3.17)#23 | 1.2%(+3.09)#1,097 |
| 24. | Vernonburg | 4.3% | 1.1%(+3.15)#24 | 1.2%(+3.07)#1,107 |
| 25. | Roberta | 4.3% | 1.1%(+3.15)#25 | 1.2%(+3.07)#1,111 |
| 26. | Skidaway Island | 4.2% | 1.1%(+3.06)#26 | 1.2%(+2.98)#1,153 |
| 27. | Social Circle | 3.9% | 1.1%(+2.82)#27 | 1.2%(+2.74)#1,269 |
| 28. | Lookout Mountain | 3.9% | 1.1%(+2.81)#28 | 1.2%(+2.73)#1,276 |
| 29. | Molena | 3.8% | 1.1%(+2.72)#29 | 1.2%(+2.64)#1,316 |
| 30. | Dunwoody | 3.7% | 1.1%(+2.60)#30 | 1.2%(+2.52)#1,397 |
| 31. | Shiloh | 3.7% | 1.1%(+2.57)#31 | 1.2%(+2.49)#1,418 |
| 32. | Suwanee | 3.3% | 1.1%(+2.23)#32 | 1.2%(+2.15)#1,650 |
| 33. | Haralson | 3.3% | 1.1%(+2.23)#33 | 1.2%(+2.15)#1,653 |
| 34. | Atlanta | 3.2% | 1.1%(+2.10)#34 | 1.2%(+2.02)#1,753 |
| 35. | Heron Bay | 3.2% | 1.1%(+2.10)#35 | 1.2%(+2.02)#1,755 |
| 36. | Sasser | 3.2% | 1.1%(+2.08)#36 | 1.2%(+2.00)#1,768 |
| 37. | Montezuma | 3.0% | 1.1%(+1.90)#37 | 1.2%(+1.82)#1,928 |
| 38. | Wilmington Island | 3.0% | 1.1%(+1.86)#38 | 1.2%(+1.78)#1,969 |
| 39. | Ringgold | 2.9% | 1.1%(+1.77)#39 | 1.2%(+1.69)#2,048 |
| 40. | Milan | 2.8% | 1.1%(+1.67)#40 | 1.2%(+1.59)#2,152 |
| 41. | Centralhatchee | 2.7% | 1.1%(+1.58)#41 | 1.2%(+1.50)#2,250 |
| 42. | Watkinsville | 2.7% | 1.1%(+1.57)#42 | 1.2%(+1.49)#2,264 |
| 43. | St Simons | 2.7% | 1.1%(+1.56)#43 | 1.2%(+1.48)#2,275 |
| 44. | Doerun | 2.6% | 1.1%(+1.54)#44 | 1.2%(+1.46)#2,292 |
| 45. | Reynolds | 2.6% | 1.1%(+1.53)#45 | 1.2%(+1.45)#2,300 |
| 46. | Sandy Springs | 2.6% | 1.1%(+1.52)#46 | 1.2%(+1.44)#2,307 |
| 47. | Milner | 2.5% | 1.1%(+1.44)#47 | 1.2%(+1.36)#2,404 |
| 48. | Tucker | 2.5% | 1.1%(+1.37)#48 | 1.2%(+1.29)#2,479 |
| 49. | Stockbridge | 2.4% | 1.1%(+1.33)#49 | 1.2%(+1.25)#2,529 |
| 50. | Moreland | 2.4% | 1.1%(+1.29)#50 | 1.2%(+1.21)#2,597 |
| 51. | Cornelia | 2.4% | 1.1%(+1.25)#51 | 1.2%(+1.17)#2,645 |
| 52. | North Decatur | 2.3% | 1.1%(+1.24)#52 | 1.2%(+1.16)#2,668 |
| 53. | Bogart | 2.3% | 1.1%(+1.21)#53 | 1.2%(+1.13)#2,704 |
| 54. | Rock Spring | 2.3% | 1.1%(+1.20)#54 | 1.2%(+1.12)#2,714 |
| 55. | Alpharetta | 2.3% | 1.1%(+1.18)#55 | 1.2%(+1.10)#2,743 |
| 56. | Cumming | 2.3% | 1.1%(+1.15)#56 | 1.2%(+1.07)#2,780 |
| 57. | Kennesaw | 2.2% | 1.1%(+1.11)#57 | 1.2%(+1.03)#2,856 |
| 58. | Blackshear | 2.2% | 1.1%(+1.07)#58 | 1.2%(+0.995)#2,906 |
| 59. | Hoschton | 2.1% | 1.1%(+1.04)#59 | 1.2%(+0.958)#2,976 |
| 60. | Cataula | 2.1% | 1.1%(+0.995)#60 | 1.2%(+0.915)#3,040 |
| 61. | Sparks | 2.1% | 1.1%(+0.983)#61 | 1.2%(+0.902)#3,067 |
| 62. | Woolsey | 2.0% | 1.1%(+0.917)#62 | 1.2%(+0.836)#3,172 |
| 63. | Vinings | 2.0% | 1.1%(+0.910)#63 | 1.2%(+0.830)#3,188 |
| 64. | Experiment | 2.0% | 1.1%(+0.904)#64 | 1.2%(+0.824)#3,200 |
| 65. | Milton | 2.0% | 1.1%(+0.885)#65 | 1.2%(+0.805)#3,236 |
| 66. | North High Shoals | 2.0% | 1.1%(+0.885)#66 | 1.2%(+0.805)#3,237 |
| 67. | Soperton | 1.9% | 1.1%(+0.797)#67 | 1.2%(+0.717)#3,401 |
| 68. | Higgston | 1.9% | 1.1%(+0.795)#68 | 1.2%(+0.715)#3,408 |
| 69. | Lithia Springs | 1.9% | 1.1%(+0.789)#69 | 1.2%(+0.709)#3,421 |
| 70. | Newnan | 1.8% | 1.1%(+0.722)#70 | 1.2%(+0.642)#3,582 |
| 71. | Perry | 1.8% | 1.1%(+0.698)#71 | 1.2%(+0.618)#3,642 |
| 72. | Dutch Island | 1.8% | 1.1%(+0.671)#72 | 1.2%(+0.591)#3,699 |
| 73. | Tunnel Hill | 1.8% | 1.1%(+0.647)#73 | 1.2%(+0.567)#3,754 |
| 74. | Chamblee | 1.7% | 1.1%(+0.615)#74 | 1.2%(+0.535)#3,837 |
| 75. | Macon Bibb County | 1.7% | 1.1%(+0.612)#75 | 1.2%(+0.532)#3,843 |
| 76. | Peachtree Corners | 1.7% | 1.1%(+0.606)#76 | 1.2%(+0.526)#3,863 |
| 77. | Winterville | 1.7% | 1.1%(+0.601)#77 | 1.2%(+0.521)#3,876 |
| 78. | Byron | 1.7% | 1.1%(+0.597)#78 | 1.2%(+0.517)#3,884 |
| 79. | Taylorsville | 1.7% | 1.1%(+0.591)#79 | 1.2%(+0.511)#3,903 |
| 80. | Avera | 1.7% | 1.1%(+0.591)#80 | 1.2%(+0.511)#3,905 |
| 81. | Cedartown | 1.7% | 1.1%(+0.564)#81 | 1.2%(+0.484)#3,967 |
| 82. | Roswell | 1.7% | 1.1%(+0.561)#82 | 1.2%(+0.481)#3,974 |
| 83. | Dallas | 1.7% | 1.1%(+0.557)#83 | 1.2%(+0.477)#3,981 |
| 84. | Jasper | 1.7% | 1.1%(+0.547)#84 | 1.2%(+0.467)#4,001 |
| 85. | Chattahoochee Hills | 1.6% | 1.1%(+0.537)#85 | 1.2%(+0.457)#4,024 |
| 86. | Smyrna | 1.6% | 1.1%(+0.536)#86 | 1.2%(+0.456)#4,026 |
| 87. | Avondale Estates | 1.6% | 1.1%(+0.533)#87 | 1.2%(+0.453)#4,038 |
| 88. | Springfield | 1.6% | 1.1%(+0.508)#88 | 1.2%(+0.428)#4,087 |
| 89. | Martinez | 1.6% | 1.1%(+0.484)#89 | 1.2%(+0.404)#4,149 |
| 90. | Lovejoy | 1.6% | 1.1%(+0.484)#90 | 1.2%(+0.404)#4,150 |
| 91. | Colbert | 1.6% | 1.1%(+0.484)#91 | 1.2%(+0.403)#4,154 |
| 92. | Warwick | 1.6% | 1.1%(+0.477)#92 | 1.2%(+0.397)#4,163 |
| 93. | Talahi Island | 1.6% | 1.1%(+0.477)#93 | 1.2%(+0.397)#4,165 |
| 94. | Plains | 1.6% | 1.1%(+0.475)#94 | 1.2%(+0.395)#4,170 |
| 95. | Johns Creek | 1.6% | 1.1%(+0.469)#95 | 1.2%(+0.388)#4,189 |
| 96. | Duluth | 1.5% | 1.1%(+0.443)#96 | 1.2%(+0.363)#4,264 |
| 97. | Loganville | 1.5% | 1.1%(+0.441)#97 | 1.2%(+0.361)#4,273 |
| 98. | Cordele | 1.5% | 1.1%(+0.408)#98 | 1.2%(+0.328)#4,373 |
| 99. | Deenwood | 1.5% | 1.1%(+0.407)#99 | 1.2%(+0.327)#4,376 |
| 100. | Kingsland | 1.5% | 1.1%(+0.371)#100 | 1.2%(+0.291)#4,502 |
Common Questions
What are the Top 10 Cities with the Highest Percentage of Population Employed in Legal Services & Support in Georgia?
Top 10 Cities with the Highest Percentage of Population Employed in Legal Services & Support in Georgia are:
#1
24.3%
#2
13.5%
#3
12.5%
#4
12.2%
#5
10.8%
#6
10.4%
#7
7.7%
#8
7.7%
#9
7.3%
#10
6.2%
What city has the Highest Percentage of Population Employed in Legal Services & Support in Georgia?
Sardis has the Highest Percentage of Population Employed in Legal Services & Support in Georgia with 24.3%.
What is the Percentage of Population Employed in Legal Services & Support in the State of Georgia?
Percentage of Population Employed in Legal Services & Support in Georgia is 1.1%.
What is the Percentage of Population Employed in Legal Services & Support in the United States?
Percentage of Population Employed in Legal Services & Support in the United States is 1.2%.