Cities with the Highest Percentage of Population Employed in Legal Services & Support in West Virginia
RELATED REPORTS & OPTIONS
Legal Services & Support
West Virginia
Compare Cities
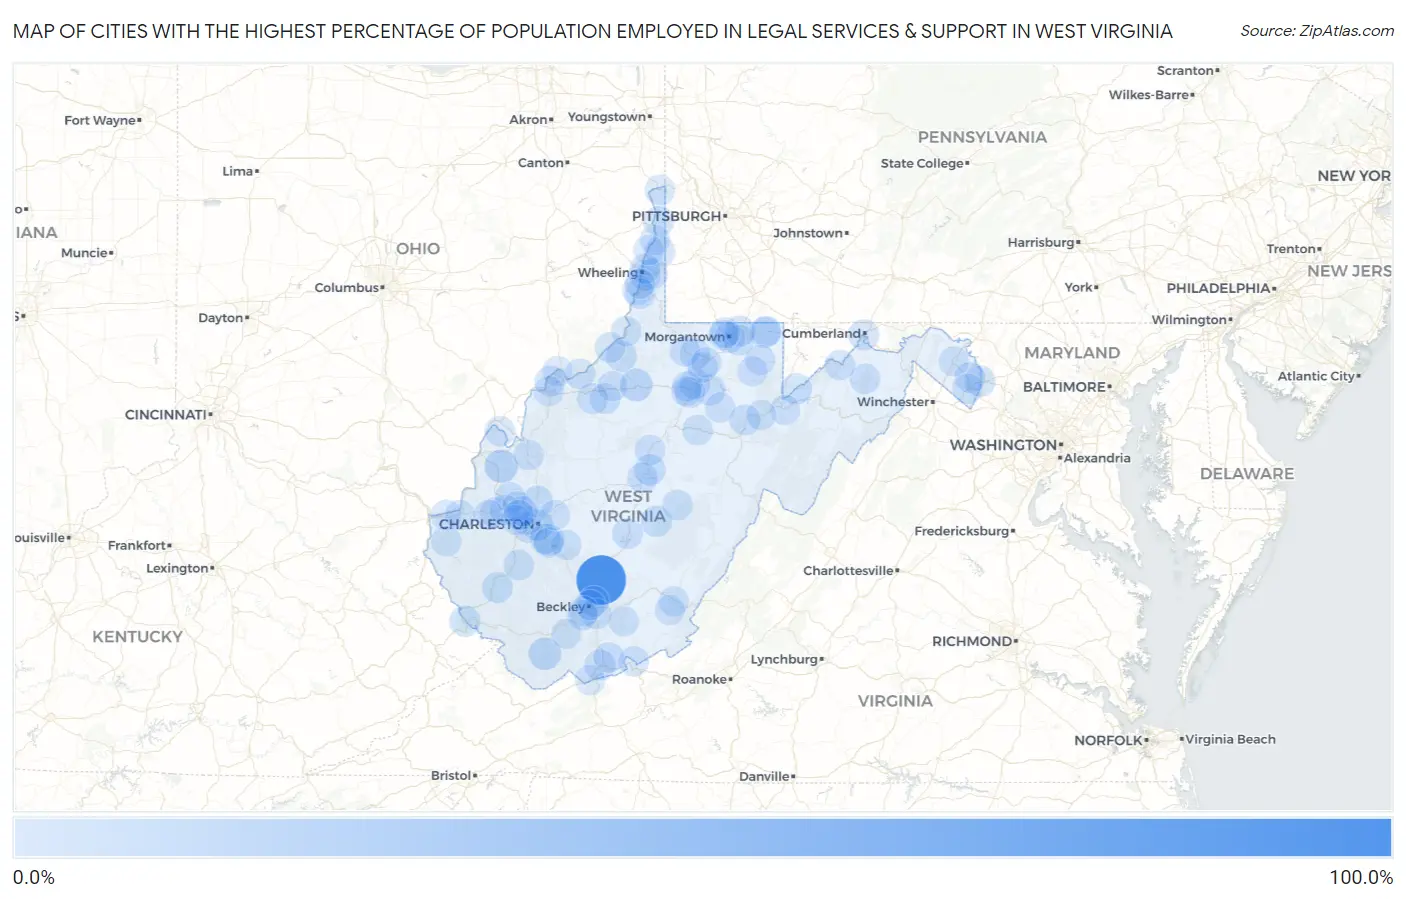
Map of Cities with the Highest Percentage of Population Employed in Legal Services & Support in West Virginia
0.0%
100.0%
Cities with the Highest Percentage of Population Employed in Legal Services & Support in West Virginia
| City | % Employed | vs State | vs National | |
| 1. | Thurmond | 100.0% | 1.1%(+98.9)#1 | 1.2%(+98.8)#5 |
| 2. | Leon | 14.9% | 1.1%(+13.8)#2 | 1.2%(+13.7)#104 |
| 3. | West Union | 12.2% | 1.1%(+11.2)#3 | 1.2%(+11.1)#156 |
| 4. | Welch | 11.6% | 1.1%(+10.5)#4 | 1.2%(+10.5)#166 |
| 5. | Belle | 6.0% | 1.1%(+4.91)#5 | 1.2%(+4.81)#604 |
| 6. | Bayard | 6.0% | 1.1%(+4.89)#6 | 1.2%(+4.80)#607 |
| 7. | Camden On Gauley | 5.7% | 1.1%(+4.57)#7 | 1.2%(+4.48)#670 |
| 8. | Charleston | 5.4% | 1.1%(+4.34)#8 | 1.2%(+4.24)#724 |
| 9. | Flatwoods | 5.3% | 1.1%(+4.24)#9 | 1.2%(+4.15)#750 |
| 10. | Sissonville | 5.1% | 1.1%(+4.06)#10 | 1.2%(+3.96)#807 |
| 11. | Mitchell Heights | 4.7% | 1.1%(+3.62)#11 | 1.2%(+3.53)#944 |
| 12. | Williamson | 4.5% | 1.1%(+3.39)#12 | 1.2%(+3.30)#1,017 |
| 13. | Bruceton Mills | 4.5% | 1.1%(+3.39)#13 | 1.2%(+3.29)#1,018 |
| 14. | Bolivar | 4.4% | 1.1%(+3.32)#14 | 1.2%(+3.23)#1,044 |
| 15. | Flemington | 4.3% | 1.1%(+3.21)#15 | 1.2%(+3.12)#1,088 |
| 16. | Ridgeley | 4.1% | 1.1%(+3.00)#16 | 1.2%(+2.91)#1,182 |
| 17. | Cairo | 4.0% | 1.1%(+2.91)#17 | 1.2%(+2.82)#1,231 |
| 18. | Middlebourne | 4.0% | 1.1%(+2.88)#18 | 1.2%(+2.79)#1,246 |
| 19. | Shenandoah Junction | 3.7% | 1.1%(+2.65)#19 | 1.2%(+2.56)#1,363 |
| 20. | Princeton | 3.7% | 1.1%(+2.60)#20 | 1.2%(+2.51)#1,405 |
| 21. | Bethlehem | 3.6% | 1.1%(+2.50)#21 | 1.2%(+2.40)#1,470 |
| 22. | Brookhaven | 3.4% | 1.1%(+2.30)#22 | 1.2%(+2.21)#1,616 |
| 23. | Montrose | 3.4% | 1.1%(+2.30)#23 | 1.2%(+2.21)#1,619 |
| 24. | Cheat Lake | 3.3% | 1.1%(+2.19)#24 | 1.2%(+2.10)#1,697 |
| 25. | Harrisville | 3.0% | 1.1%(+1.96)#25 | 1.2%(+1.86)#1,880 |
| 26. | Daniels | 2.9% | 1.1%(+1.84)#26 | 1.2%(+1.74)#2,009 |
| 27. | Triadelphia | 2.8% | 1.1%(+1.72)#27 | 1.2%(+1.63)#2,117 |
| 28. | Vienna | 2.7% | 1.1%(+1.61)#28 | 1.2%(+1.51)#2,238 |
| 29. | Bridgeport | 2.6% | 1.1%(+1.52)#29 | 1.2%(+1.43)#2,337 |
| 30. | Morgantown | 2.5% | 1.1%(+1.36)#30 | 1.2%(+1.27)#2,501 |
| 31. | Stanaford | 2.4% | 1.1%(+1.33)#31 | 1.2%(+1.24)#2,543 |
| 32. | Farmington | 2.4% | 1.1%(+1.32)#32 | 1.2%(+1.23)#2,564 |
| 33. | Hurricane | 2.4% | 1.1%(+1.30)#33 | 1.2%(+1.20)#2,603 |
| 34. | Summersville | 2.4% | 1.1%(+1.26)#34 | 1.2%(+1.17)#2,643 |
| 35. | Stonewood | 2.2% | 1.1%(+1.08)#35 | 1.2%(+0.986)#2,927 |
| 36. | New Haven | 2.1% | 1.1%(+1.03)#36 | 1.2%(+0.933)#3,004 |
| 37. | Madison | 2.1% | 1.1%(+0.989)#37 | 1.2%(+0.896)#3,077 |
| 38. | Buckhannon | 2.1% | 1.1%(+0.970)#38 | 1.2%(+0.878)#3,109 |
| 39. | Addison Webster Springs | 2.0% | 1.1%(+0.925)#39 | 1.2%(+0.832)#3,181 |
| 40. | Huntington | 2.0% | 1.1%(+0.914)#40 | 1.2%(+0.821)#3,209 |
| 41. | Brandonville | 2.0% | 1.1%(+0.889)#41 | 1.2%(+0.796)#3,258 |
| 42. | Athens | 2.0% | 1.1%(+0.884)#42 | 1.2%(+0.791)#3,265 |
| 43. | South Charleston | 2.0% | 1.1%(+0.876)#43 | 1.2%(+0.783)#3,275 |
| 44. | Dunbar | 1.8% | 1.1%(+0.733)#44 | 1.2%(+0.640)#3,588 |
| 45. | Crab Orchard | 1.8% | 1.1%(+0.711)#45 | 1.2%(+0.618)#3,636 |
| 46. | Teays Valley | 1.7% | 1.1%(+0.649)#46 | 1.2%(+0.556)#3,775 |
| 47. | Glen Dale | 1.7% | 1.1%(+0.616)#47 | 1.2%(+0.523)#3,870 |
| 48. | Belmont | 1.7% | 1.1%(+0.599)#48 | 1.2%(+0.506)#3,917 |
| 49. | Clarksburg | 1.7% | 1.1%(+0.592)#49 | 1.2%(+0.499)#3,929 |
| 50. | Sophia | 1.6% | 1.1%(+0.522)#50 | 1.2%(+0.429)#4,079 |
| 51. | Star City | 1.6% | 1.1%(+0.476)#51 | 1.2%(+0.383)#4,203 |
| 52. | White Hall | 1.6% | 1.1%(+0.463)#52 | 1.2%(+0.370)#4,243 |
| 53. | Burnsville | 1.5% | 1.1%(+0.448)#53 | 1.2%(+0.355)#4,291 |
| 54. | Peterstown | 1.5% | 1.1%(+0.424)#54 | 1.2%(+0.331)#4,364 |
| 55. | Romney | 1.5% | 1.1%(+0.416)#55 | 1.2%(+0.323)#4,389 |
| 56. | Ripley | 1.4% | 1.1%(+0.350)#56 | 1.2%(+0.257)#4,608 |
| 57. | Marmet | 1.4% | 1.1%(+0.323)#57 | 1.2%(+0.230)#4,699 |
| 58. | Keyser | 1.4% | 1.1%(+0.316)#58 | 1.2%(+0.223)#4,730 |
| 59. | Moundsville | 1.4% | 1.1%(+0.306)#59 | 1.2%(+0.213)#4,754 |
| 60. | Sutton | 1.4% | 1.1%(+0.264)#60 | 1.2%(+0.171)#4,884 |
| 61. | Winfield | 1.3% | 1.1%(+0.252)#61 | 1.2%(+0.159)#4,927 |
| 62. | Bethany | 1.3% | 1.1%(+0.240)#62 | 1.2%(+0.147)#4,970 |
| 63. | Weirton | 1.3% | 1.1%(+0.232)#63 | 1.2%(+0.139)#4,995 |
| 64. | Pratt | 1.3% | 1.1%(+0.199)#64 | 1.2%(+0.107)#5,097 |
| 65. | Sistersville | 1.3% | 1.1%(+0.188)#65 | 1.2%(+0.095)#5,131 |
| 66. | Wheeling | 1.2% | 1.1%(+0.138)#66 | 1.2%(+0.045)#5,336 |
| 67. | New Martinsville | 1.2% | 1.1%(+0.090)#67 | 1.2%(-0.003)#5,525 |
| 68. | Mannington | 1.1% | 1.1%(+0.020)#68 | 1.2%(-0.073)#5,818 |
| 69. | Kingwood | 1.1% | 1.1%(+0.016)#69 | 1.2%(-0.077)#5,842 |
| 70. | Lewisburg | 1.1% | 1.1%(+0.001)#70 | 1.2%(-0.092)#5,914 |
| 71. | Charles Town | 1.1% | 1.1%(-0.002)#71 | 1.2%(-0.095)#5,924 |
| 72. | Wellsburg | 1.1% | 1.1%(-0.027)#72 | 1.2%(-0.120)#6,041 |
| 73. | Hinton | 1.1% | 1.1%(-0.033)#73 | 1.2%(-0.126)#6,071 |
| 74. | Pea Ridge | 1.1% | 1.1%(-0.039)#74 | 1.2%(-0.132)#6,107 |
| 75. | Davis | 1.0% | 1.1%(-0.044)#75 | 1.2%(-0.137)#6,132 |
| 76. | Tunnelton | 1.0% | 1.1%(-0.055)#76 | 1.2%(-0.148)#6,184 |
| 77. | Pennsboro | 1.0% | 1.1%(-0.075)#77 | 1.2%(-0.168)#6,288 |
| 78. | Culloden | 0.95% | 1.1%(-0.145)#78 | 1.2%(-0.238)#6,641 |
| 79. | Poca | 0.90% | 1.1%(-0.192)#79 | 1.2%(-0.285)#6,881 |
| 80. | Chesapeake | 0.84% | 1.1%(-0.251)#80 | 1.2%(-0.343)#7,195 |
| 81. | Williamstown | 0.84% | 1.1%(-0.253)#81 | 1.2%(-0.346)#7,208 |
| 82. | Bluefield | 0.83% | 1.1%(-0.265)#82 | 1.2%(-0.358)#7,275 |
| 83. | St Albans | 0.82% | 1.1%(-0.266)#83 | 1.2%(-0.359)#7,278 |
| 84. | Pinch | 0.82% | 1.1%(-0.274)#84 | 1.2%(-0.367)#7,320 |
| 85. | Philippi | 0.80% | 1.1%(-0.296)#85 | 1.2%(-0.389)#7,450 |
| 86. | Wayne | 0.78% | 1.1%(-0.307)#86 | 1.2%(-0.400)#7,516 |
| 87. | Chester | 0.75% | 1.1%(-0.346)#87 | 1.2%(-0.438)#7,771 |
| 88. | Beckley | 0.72% | 1.1%(-0.373)#88 | 1.2%(-0.466)#7,945 |
| 89. | Parkersburg | 0.69% | 1.1%(-0.399)#89 | 1.2%(-0.492)#8,127 |
| 90. | Westover | 0.64% | 1.1%(-0.453)#90 | 1.2%(-0.546)#8,501 |
| 91. | Martinsburg | 0.64% | 1.1%(-0.454)#91 | 1.2%(-0.547)#8,510 |
| 92. | Nutter Fort | 0.60% | 1.1%(-0.488)#92 | 1.2%(-0.581)#8,755 |
| 93. | Cross Lanes | 0.55% | 1.1%(-0.537)#93 | 1.2%(-0.630)#9,132 |
| 94. | Parsons | 0.54% | 1.1%(-0.552)#94 | 1.2%(-0.645)#9,219 |
| 95. | Nitro | 0.51% | 1.1%(-0.584)#95 | 1.2%(-0.677)#9,452 |
| 96. | Mcmechen | 0.49% | 1.1%(-0.598)#96 | 1.2%(-0.691)#9,545 |
| 97. | Pleasant Valley | 0.39% | 1.1%(-0.696)#97 | 1.2%(-0.789)#10,271 |
| 98. | Mullens | 0.37% | 1.1%(-0.723)#98 | 1.2%(-0.816)#10,456 |
| 99. | Beech Bottom | 0.34% | 1.1%(-0.748)#99 | 1.2%(-0.841)#10,649 |
| 100. | Ronceverte | 0.26% | 1.1%(-0.830)#100 | 1.2%(-0.923)#11,157 |
Common Questions
What are the Top 10 Cities with the Highest Percentage of Population Employed in Legal Services & Support in West Virginia?
Top 10 Cities with the Highest Percentage of Population Employed in Legal Services & Support in West Virginia are:
#1
100.0%
#2
14.9%
#3
12.2%
#4
11.6%
#5
6.0%
#6
6.0%
#7
5.7%
#8
5.4%
#9
5.3%
#10
5.1%
What city has the Highest Percentage of Population Employed in Legal Services & Support in West Virginia?
Thurmond has the Highest Percentage of Population Employed in Legal Services & Support in West Virginia with 100.0%.
What is the Percentage of Population Employed in Legal Services & Support in the State of West Virginia?
Percentage of Population Employed in Legal Services & Support in West Virginia is 1.1%.
What is the Percentage of Population Employed in Legal Services & Support in the United States?
Percentage of Population Employed in Legal Services & Support in the United States is 1.2%.