Santa Monica, CA Map & Demographics
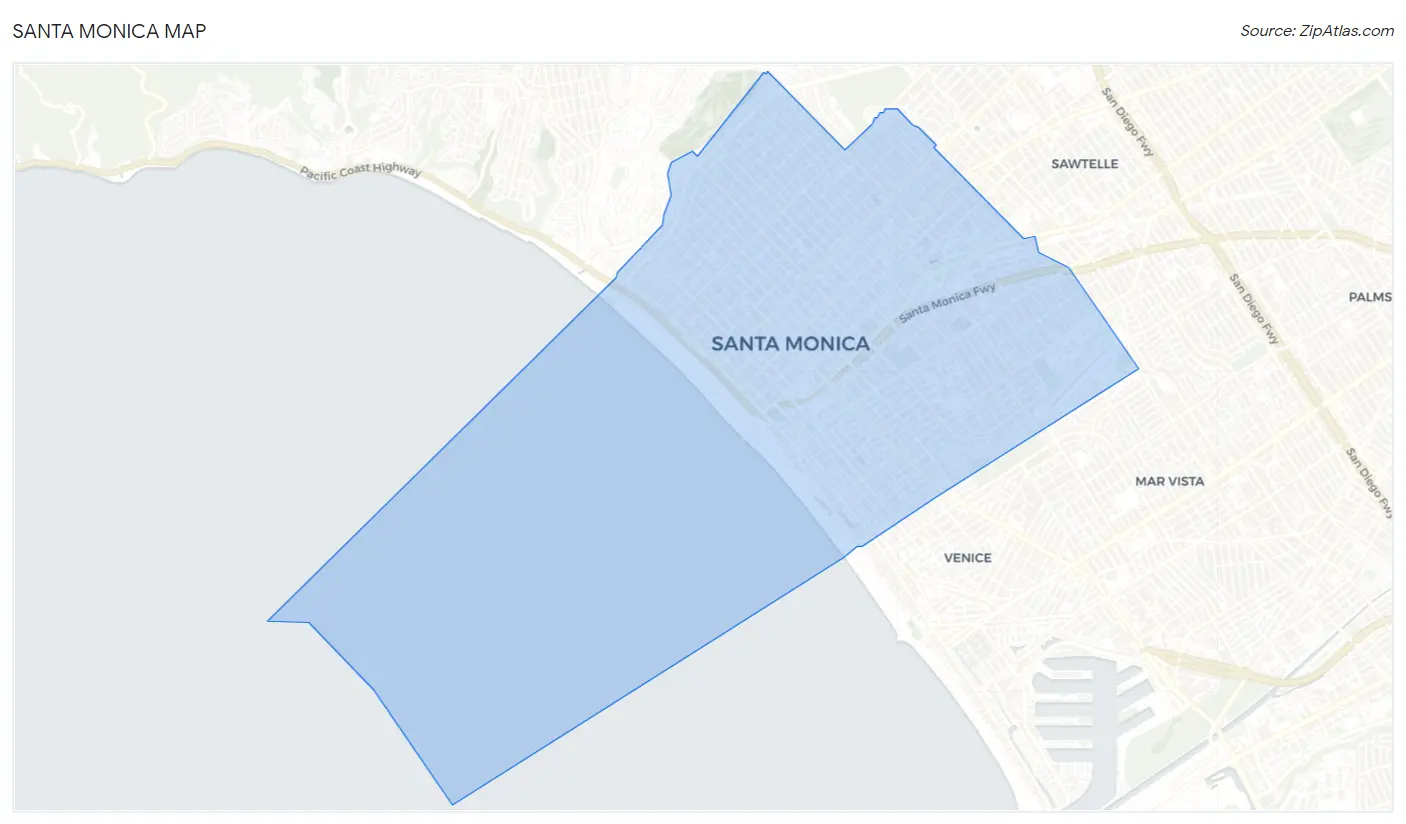
Santa Monica Map
Santa Monica Overview
$86,888
PER CAPITA INCOME
$149,046
AVG FAMILY INCOME
$106,797
AVG HOUSEHOLD INCOME
22.4%
WAGE / INCOME GAP [ % ]
77.6¢/ $1
WAGE / INCOME GAP [ $ ]
$10,388
FAMILY INCOME DEFICIT
0.56
INEQUALITY / GINI INDEX
92,168
TOTAL POPULATION
45,563
MALE POPULATION
46,605
FEMALE POPULATION
97.76
MALES / 100 FEMALES
102.29
FEMALES / 100 MALES
42.1
MEDIAN AGE
2.9
AVG FAMILY SIZE
1.9
AVG HOUSEHOLD SIZE
53,658
LABOR FORCE [ PEOPLE ]
67.4%
PERCENT IN LABOR FORCE
6.2%
UNEMPLOYMENT RATE
Income in Santa Monica
Income Overview in Santa Monica
Per Capita Income in Santa Monica is $86,888, while median incomes of families and households are $149,046 and $106,797 respectively.
| Characteristic | Number | Measure |
| Per Capita Income | 92,168 | $86,888 |
| Median Family Income | 19,372 | $149,046 |
| Mean Family Income | 19,372 | $233,042 |
| Median Household Income | 46,207 | $106,797 |
| Mean Household Income | 46,207 | $170,644 |
| Income Deficit | 19,372 | $10,388 |
| Wage / Income Gap (%) | 92,168 | 22.39% |
| Wage / Income Gap ($) | 92,168 | 77.61¢ per $1 |
| Gini / Inequality Index | 92,168 | 0.56 |
Earnings by Sex in Santa Monica
Average Earnings in Santa Monica are $78,515, $89,623 for men and $69,559 for women, a difference of 22.4%.
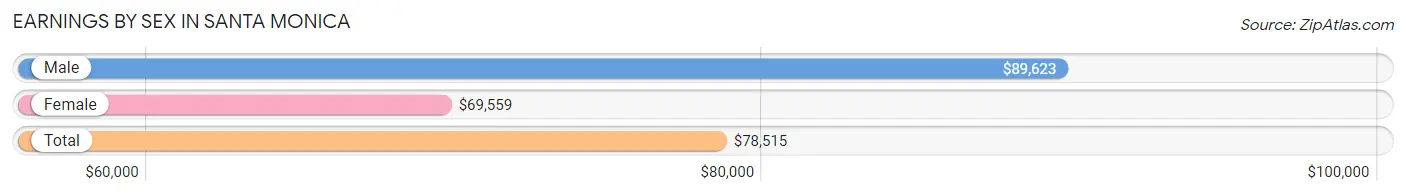
| Sex | Number | Average Earnings |
| Male | 27,634 (50.6%) | $89,623 |
| Female | 27,013 (49.4%) | $69,559 |
| Total | 54,647 (100.0%) | $78,515 |
Earnings by Sex by Income Bracket in Santa Monica
The most common earnings brackets in Santa Monica are $100,000+ for men (12,692 | 45.9%) and $100,000+ for women (8,742 | 32.4%).
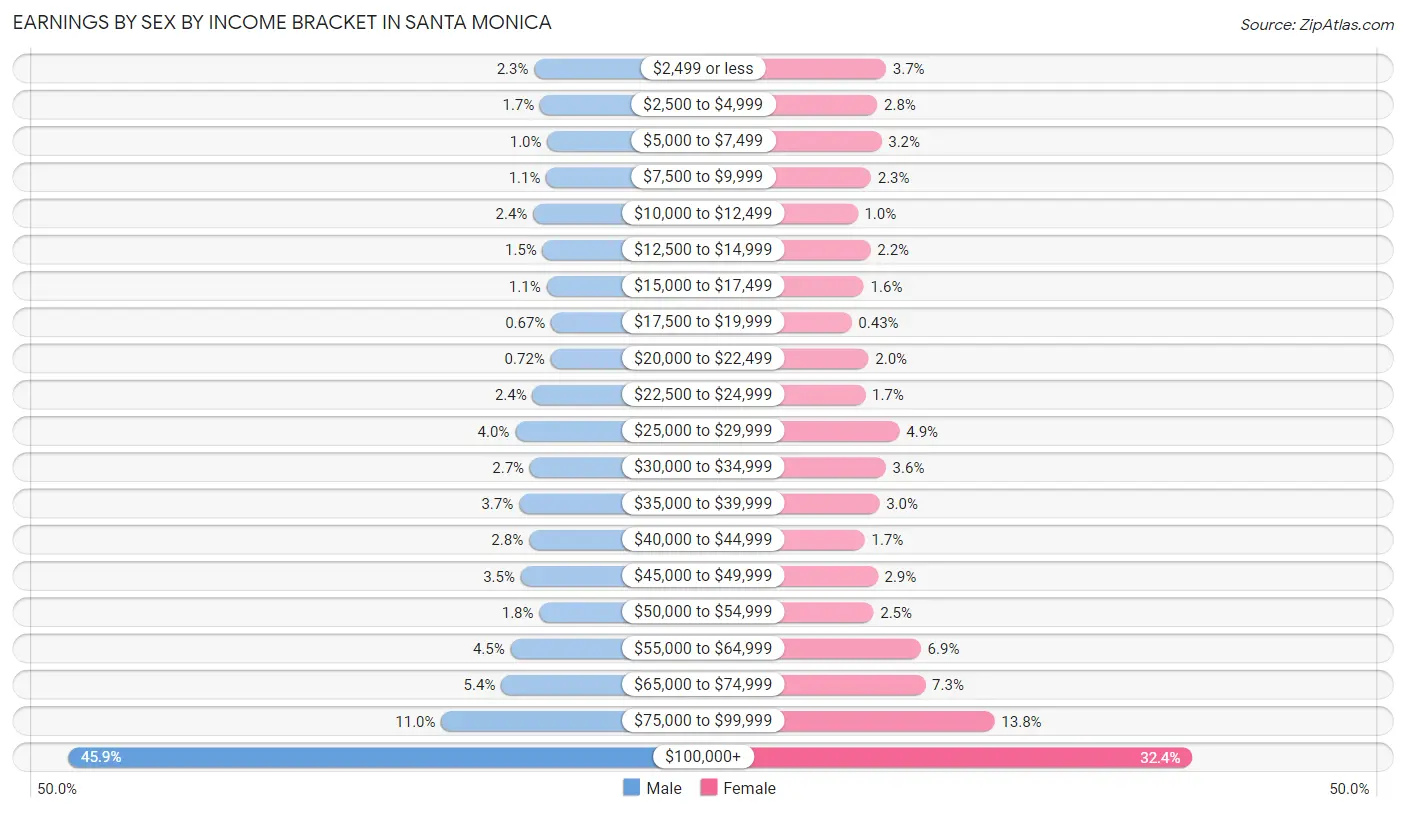
| Income | Male | Female |
| $2,499 or less | 621 (2.2%) | 990 (3.7%) |
| $2,500 to $4,999 | 472 (1.7%) | 766 (2.8%) |
| $5,000 to $7,499 | 286 (1.0%) | 872 (3.2%) |
| $7,500 to $9,999 | 312 (1.1%) | 608 (2.2%) |
| $10,000 to $12,499 | 652 (2.4%) | 271 (1.0%) |
| $12,500 to $14,999 | 405 (1.5%) | 596 (2.2%) |
| $15,000 to $17,499 | 306 (1.1%) | 426 (1.6%) |
| $17,500 to $19,999 | 185 (0.7%) | 116 (0.4%) |
| $20,000 to $22,499 | 198 (0.7%) | 546 (2.0%) |
| $22,500 to $24,999 | 668 (2.4%) | 463 (1.7%) |
| $25,000 to $29,999 | 1,116 (4.0%) | 1,328 (4.9%) |
| $30,000 to $34,999 | 734 (2.7%) | 983 (3.6%) |
| $35,000 to $39,999 | 1,016 (3.7%) | 822 (3.0%) |
| $40,000 to $44,999 | 761 (2.8%) | 448 (1.7%) |
| $45,000 to $49,999 | 974 (3.5%) | 778 (2.9%) |
| $50,000 to $54,999 | 491 (1.8%) | 671 (2.5%) |
| $55,000 to $64,999 | 1,237 (4.5%) | 1,868 (6.9%) |
| $65,000 to $74,999 | 1,479 (5.3%) | 1,983 (7.3%) |
| $75,000 to $99,999 | 3,029 (11.0%) | 3,736 (13.8%) |
| $100,000+ | 12,692 (45.9%) | 8,742 (32.4%) |
| Total | 27,634 (100.0%) | 27,013 (100.0%) |
Earnings by Sex by Educational Attainment in Santa Monica
Average earnings in Santa Monica are $94,583 for men and $72,315 for women, a difference of 23.5%. Men with an educational attainment of graduate degree enjoy the highest average annual earnings of $143,265, while those with college or associate's degree education earn the least with $39,179. Women with an educational attainment of graduate degree earn the most with the average annual earnings of $91,378, while those with less than high school education have the smallest earnings of $29,114.
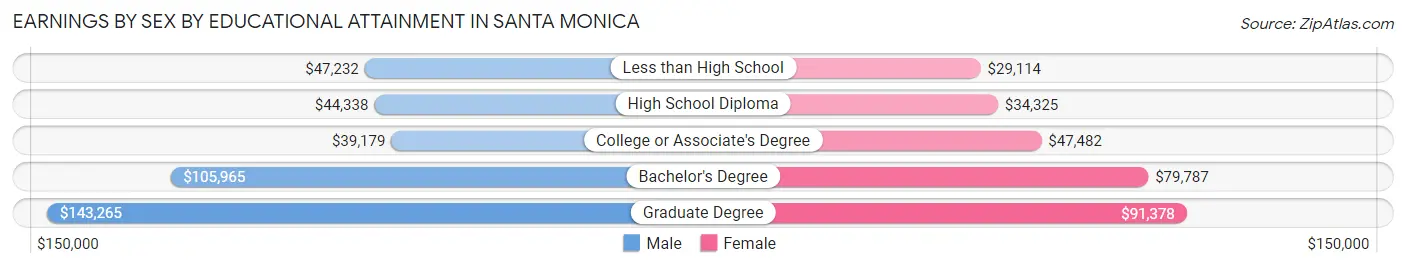
| Educational Attainment | Male Income | Female Income |
| Less than High School | $47,232 | $29,114 |
| High School Diploma | $44,338 | $34,325 |
| College or Associate's Degree | $39,179 | $47,482 |
| Bachelor's Degree | $105,965 | $79,787 |
| Graduate Degree | $143,265 | $91,378 |
| Total | $94,583 | $72,315 |
Family Income in Santa Monica
Family Income Brackets in Santa Monica
According to the Santa Monica family income data, there are 7,361 families falling into the $200,000+ income range, which is the most common income bracket and makes up 38.0% of all families. Conversely, the $10,000 to $14,999 income bracket is the least frequent group with only 368 families (1.9%) belonging to this category.
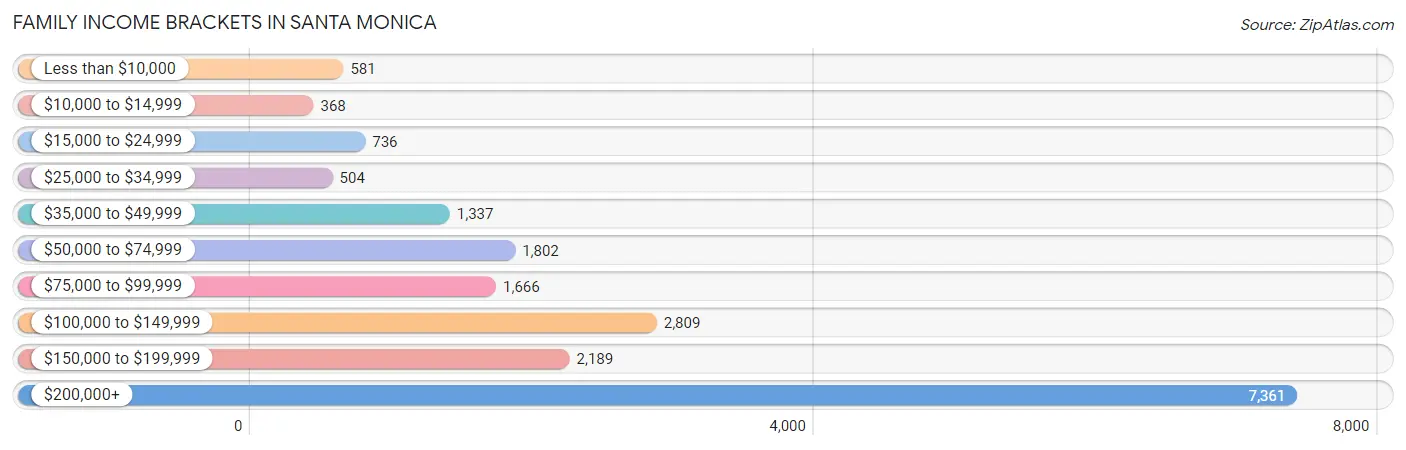
| Income Bracket | # Families | % Families |
| Less than $10,000 | 581 | 3.0% |
| $10,000 to $14,999 | 368 | 1.9% |
| $15,000 to $24,999 | 736 | 3.8% |
| $25,000 to $34,999 | 504 | 2.6% |
| $35,000 to $49,999 | 1,337 | 6.9% |
| $50,000 to $74,999 | 1,802 | 9.3% |
| $75,000 to $99,999 | 1,666 | 8.6% |
| $100,000 to $149,999 | 2,809 | 14.5% |
| $150,000 to $199,999 | 2,189 | 11.3% |
| $200,000+ | 7,361 | 38.0% |
Family Income by Famaliy Size in Santa Monica
4-person families (2,743 | 14.2%) account for the highest median family income in Santa Monica with $228,063 per family, while 2-person families (10,787 | 55.7%) have the highest median income of $73,844 per family member.
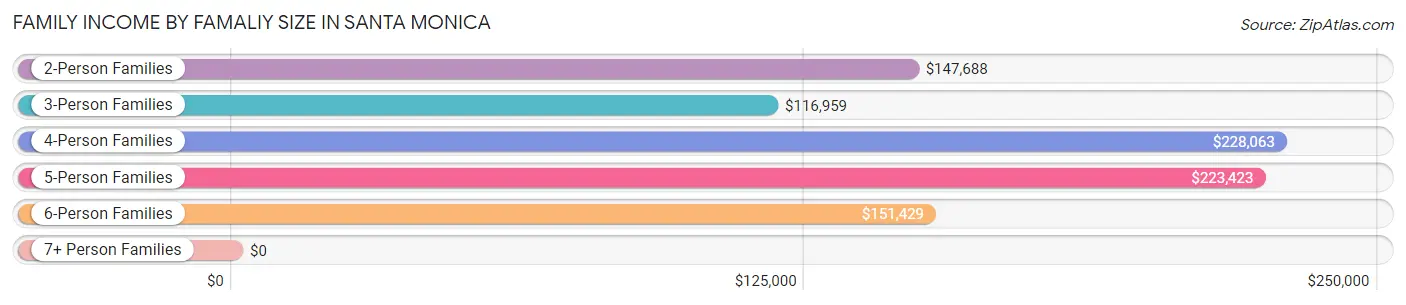
| Income Bracket | # Families | Median Income |
| 2-Person Families | 10,787 (55.7%) | $147,688 |
| 3-Person Families | 4,550 (23.5%) | $116,959 |
| 4-Person Families | 2,743 (14.2%) | $228,063 |
| 5-Person Families | 1,052 (5.4%) | $223,423 |
| 6-Person Families | 178 (0.9%) | $151,429 |
| 7+ Person Families | 62 (0.3%) | $0 |
| Total | 19,372 (100.0%) | $149,046 |
Family Income by Number of Earners in Santa Monica
The median family income in Santa Monica is $149,046, with families comprising 2 earners (9,246) having the highest median family income of $202,132, while families with no earners (2,424) have the lowest median family income of $50,870, accounting for 47.7% and 12.5% of families, respectively.
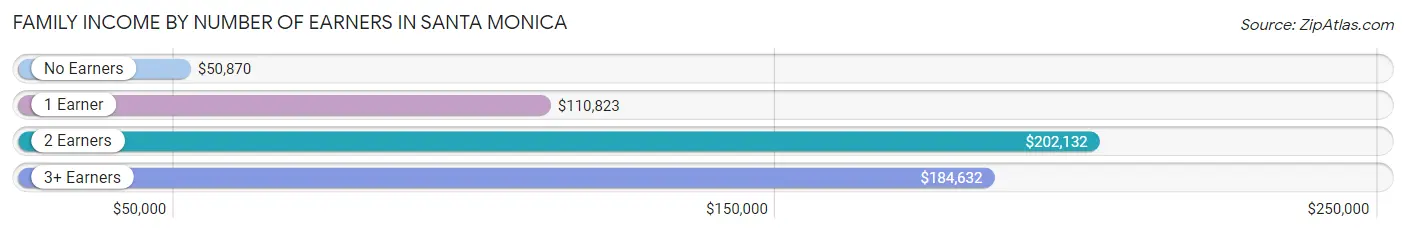
| Number of Earners | # Families | Median Income |
| No Earners | 2,424 (12.5%) | $50,870 |
| 1 Earner | 6,477 (33.4%) | $110,823 |
| 2 Earners | 9,246 (47.7%) | $202,132 |
| 3+ Earners | 1,225 (6.3%) | $184,632 |
| Total | 19,372 (100.0%) | $149,046 |
Household Income in Santa Monica
Household Income Brackets in Santa Monica
With 12,291 households falling in the category, the $200,000+ income range is the most frequent in Santa Monica, accounting for 26.6% of all households. In contrast, only 1,571 households (3.4%) fall into the $10,000 to $14,999 income bracket, making it the least populous group.
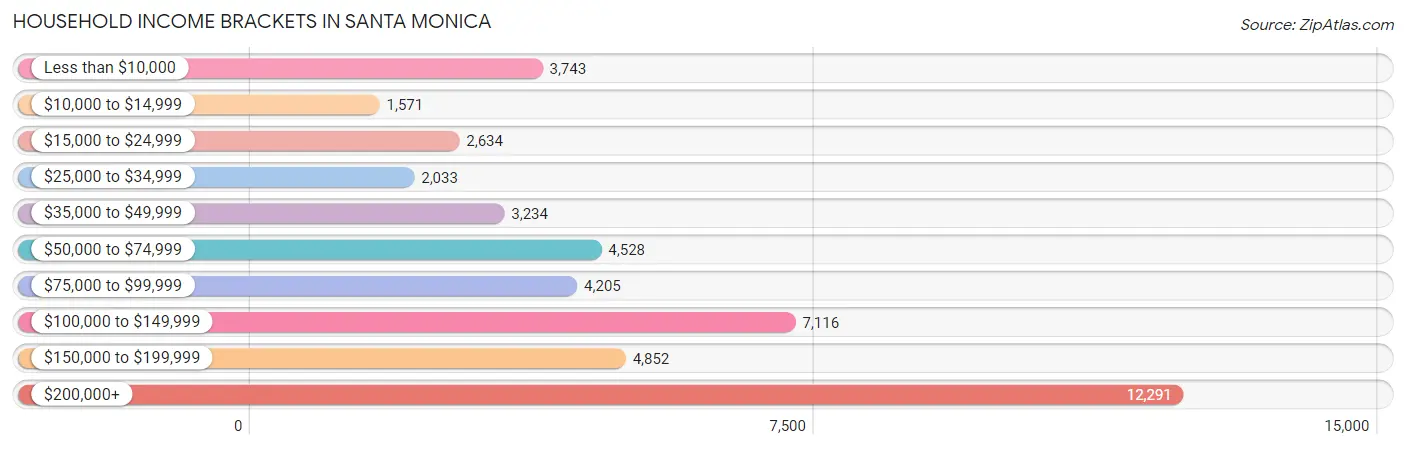
| Income Bracket | # Households | % Households |
| Less than $10,000 | 3,743 | 8.1% |
| $10,000 to $14,999 | 1,571 | 3.4% |
| $15,000 to $24,999 | 2,634 | 5.7% |
| $25,000 to $34,999 | 2,033 | 4.4% |
| $35,000 to $49,999 | 3,234 | 7.0% |
| $50,000 to $74,999 | 4,528 | 9.8% |
| $75,000 to $99,999 | 4,205 | 9.1% |
| $100,000 to $149,999 | 7,116 | 15.4% |
| $150,000 to $199,999 | 4,852 | 10.5% |
| $200,000+ | 12,291 | 26.6% |
Household Income by Householder Age in Santa Monica
The median household income in Santa Monica is $106,797, with the highest median household income of $145,766 found in the 25 to 44 years age bracket for the primary householder. A total of 17,072 households (36.9%) fall into this category. Meanwhile, the 15 to 24 years age bracket for the primary householder has the lowest median household income of $50,694, with 1,093 households (2.4%) in this group.
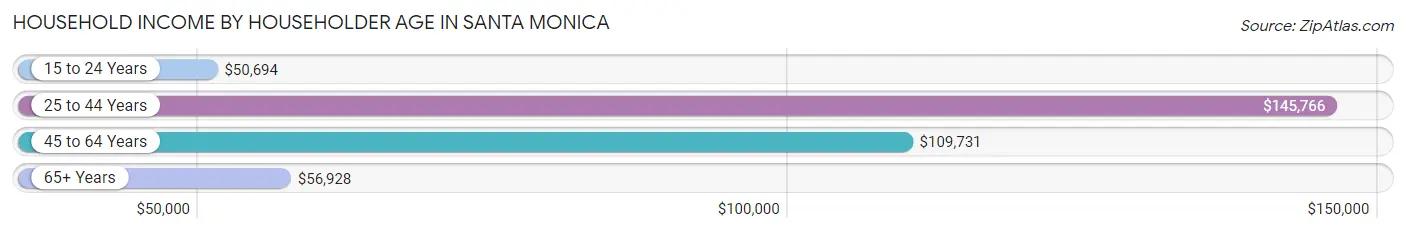
| Income Bracket | # Households | Median Income |
| 15 to 24 Years | 1,093 (2.4%) | $50,694 |
| 25 to 44 Years | 17,072 (36.9%) | $145,766 |
| 45 to 64 Years | 16,041 (34.7%) | $109,731 |
| 65+ Years | 12,001 (26.0%) | $56,928 |
| Total | 46,207 (100.0%) | $106,797 |
Poverty in Santa Monica
Income Below Poverty by Sex and Age in Santa Monica
With 11.6% poverty level for males and 11.7% for females among the residents of Santa Monica, 65 to 74 year old males and 75 year old and over females are the most vulnerable to poverty, with 918 males (20.9%) and 978 females (21.2%) in their respective age groups living below the poverty level.
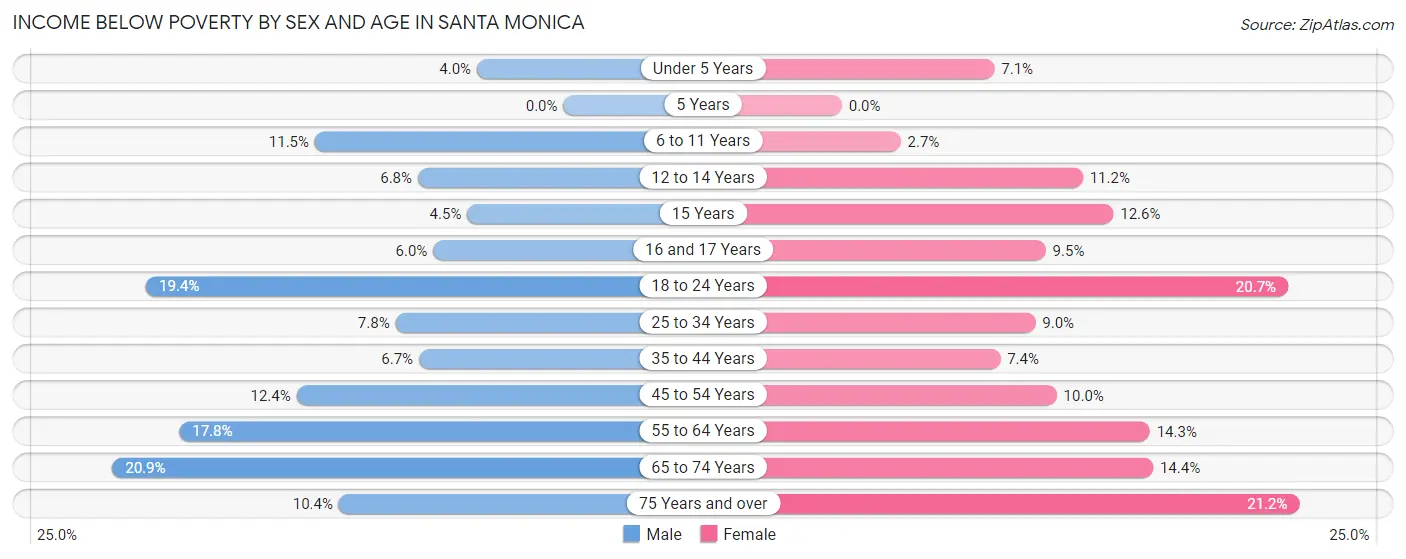
| Age Bracket | Male | Female |
| Under 5 Years | 90 (4.0%) | 144 (7.1%) |
| 5 Years | 0 (0.0%) | 0 (0.0%) |
| 6 to 11 Years | 288 (11.5%) | 47 (2.7%) |
| 12 to 14 Years | 92 (6.8%) | 107 (11.2%) |
| 15 Years | 28 (4.5%) | 31 (12.6%) |
| 16 and 17 Years | 32 (6.0%) | 66 (9.5%) |
| 18 to 24 Years | 471 (19.4%) | 503 (20.7%) |
| 25 to 34 Years | 638 (7.8%) | 803 (9.0%) |
| 35 to 44 Years | 471 (6.7%) | 502 (7.3%) |
| 45 to 54 Years | 783 (12.4%) | 595 (10.0%) |
| 55 to 64 Years | 1,072 (17.8%) | 936 (14.3%) |
| 65 to 74 Years | 918 (20.9%) | 668 (14.4%) |
| 75 Years and over | 323 (10.4%) | 978 (21.2%) |
| Total | 5,206 (11.6%) | 5,380 (11.7%) |
Income Above Poverty by Sex and Age in Santa Monica
According to the poverty statistics in Santa Monica, males aged 5 years and females aged 5 years are the age groups that are most secure financially, with 100.0% of males and 100.0% of females in these age groups living above the poverty line.
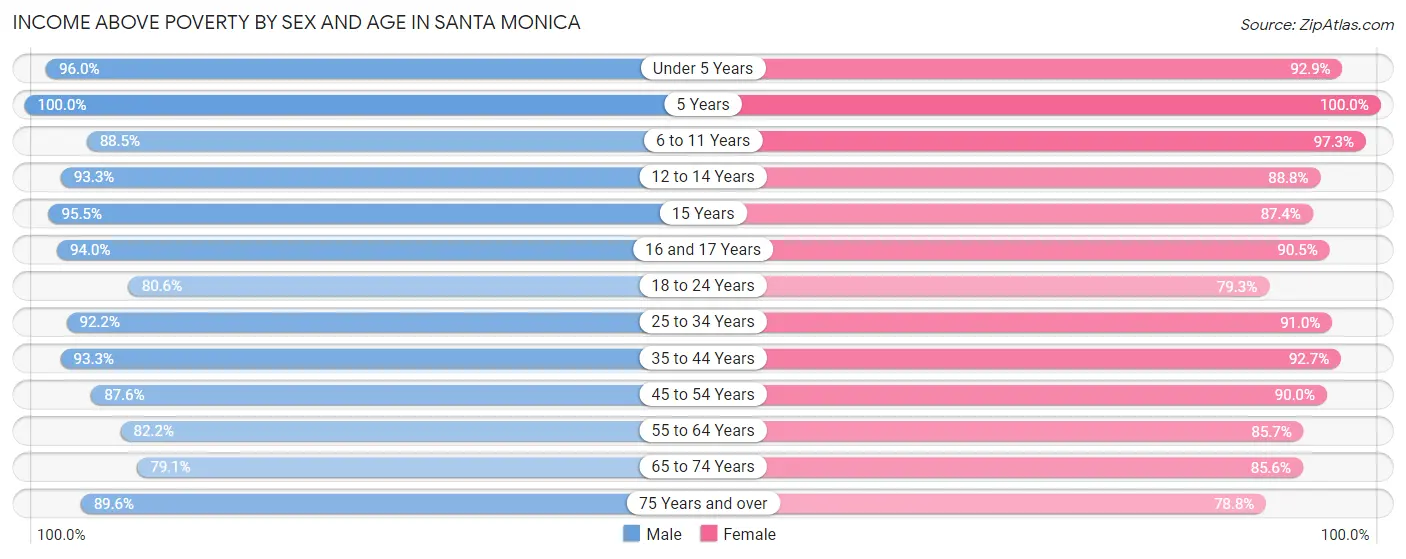
| Age Bracket | Male | Female |
| Under 5 Years | 2,156 (96.0%) | 1,891 (92.9%) |
| 5 Years | 317 (100.0%) | 454 (100.0%) |
| 6 to 11 Years | 2,209 (88.5%) | 1,676 (97.3%) |
| 12 to 14 Years | 1,270 (93.2%) | 850 (88.8%) |
| 15 Years | 600 (95.5%) | 215 (87.4%) |
| 16 and 17 Years | 498 (94.0%) | 632 (90.5%) |
| 18 to 24 Years | 1,962 (80.6%) | 1,927 (79.3%) |
| 25 to 34 Years | 7,553 (92.2%) | 8,143 (91.0%) |
| 35 to 44 Years | 6,560 (93.3%) | 6,328 (92.6%) |
| 45 to 54 Years | 5,541 (87.6%) | 5,370 (90.0%) |
| 55 to 64 Years | 4,945 (82.2%) | 5,612 (85.7%) |
| 65 to 74 Years | 3,469 (79.1%) | 3,959 (85.6%) |
| 75 Years and over | 2,778 (89.6%) | 3,628 (78.8%) |
| Total | 39,858 (88.4%) | 40,685 (88.3%) |
Income Below Poverty Among Married-Couple Families in Santa Monica
The poverty statistics for married-couple families in Santa Monica show that 5.1% or 735 of the total 14,543 families live below the poverty line. Families with no children have the highest poverty rate of 5.3%, comprising of 496 families. On the other hand, families with 1 or 2 children have the lowest poverty rate of 4.5%, which includes 201 families.
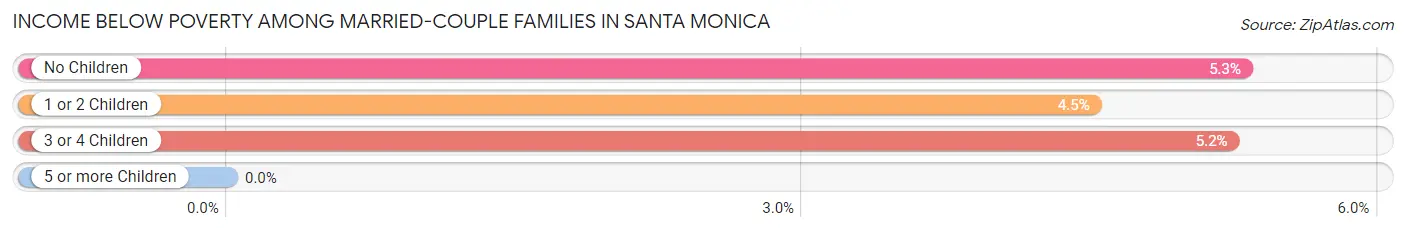
| Children | Above Poverty | Below Poverty |
| No Children | 8,867 (94.7%) | 496 (5.3%) |
| 1 or 2 Children | 4,253 (95.5%) | 201 (4.5%) |
| 3 or 4 Children | 688 (94.8%) | 38 (5.2%) |
| 5 or more Children | 0 (0.0%) | 0 (0.0%) |
| Total | 13,808 (95.0%) | 735 (5.1%) |
Income Below Poverty Among Single-Parent Households in Santa Monica
According to the poverty data in Santa Monica, 9.2% or 150 single-father households and 12.9% or 414 single-mother households are living below the poverty line. Among single-father households, those with 1 or 2 children have the highest poverty rate, with 91 households (13.2%) experiencing poverty. Likewise, among single-mother households, those with 3 or 4 children have the highest poverty rate, with 32 households (41.0%) falling below the poverty line.
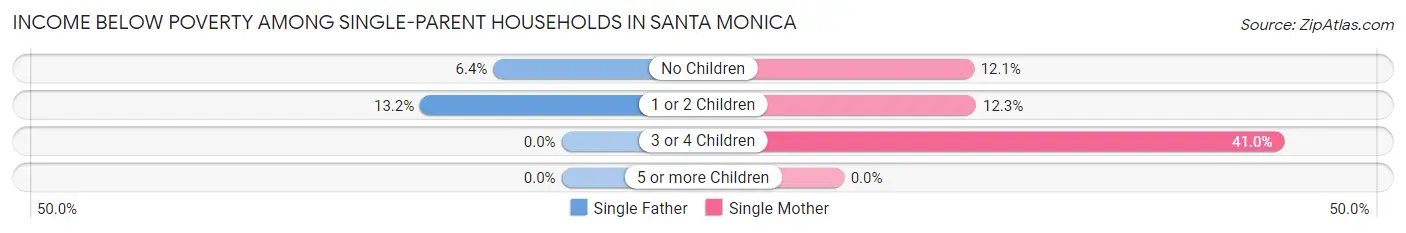
| Children | Single Father | Single Mother |
| No Children | 59 (6.4%) | 168 (12.1%) |
| 1 or 2 Children | 91 (13.2%) | 214 (12.3%) |
| 3 or 4 Children | 0 (0.0%) | 32 (41.0%) |
| 5 or more Children | 0 (0.0%) | 0 (0.0%) |
| Total | 150 (9.2%) | 414 (12.9%) |
Income Below Poverty Among Married-Couple vs Single-Parent Households in Santa Monica
The poverty data for Santa Monica shows that 735 of the married-couple family households (5.1%) and 564 of the single-parent households (11.7%) are living below the poverty level. Within the married-couple family households, those with no children have the highest poverty rate, with 496 households (5.3%) falling below the poverty line. Among the single-parent households, those with 3 or 4 children have the highest poverty rate, with 32 household (36.8%) living below poverty.
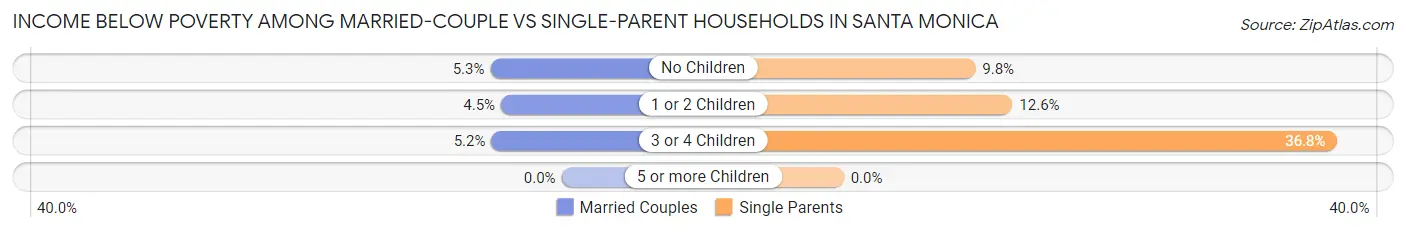
| Children | Married-Couple Families | Single-Parent Households |
| No Children | 496 (5.3%) | 227 (9.8%) |
| 1 or 2 Children | 201 (4.5%) | 305 (12.6%) |
| 3 or 4 Children | 38 (5.2%) | 32 (36.8%) |
| 5 or more Children | 0 (0.0%) | 0 (0.0%) |
| Total | 735 (5.1%) | 564 (11.7%) |
Race in Santa Monica
The most populous races in Santa Monica are White / Caucasian (63,638 | 69.1%), Hispanic or Latino (15,831 | 17.2%), and Two or more Races (11,124 | 12.1%).
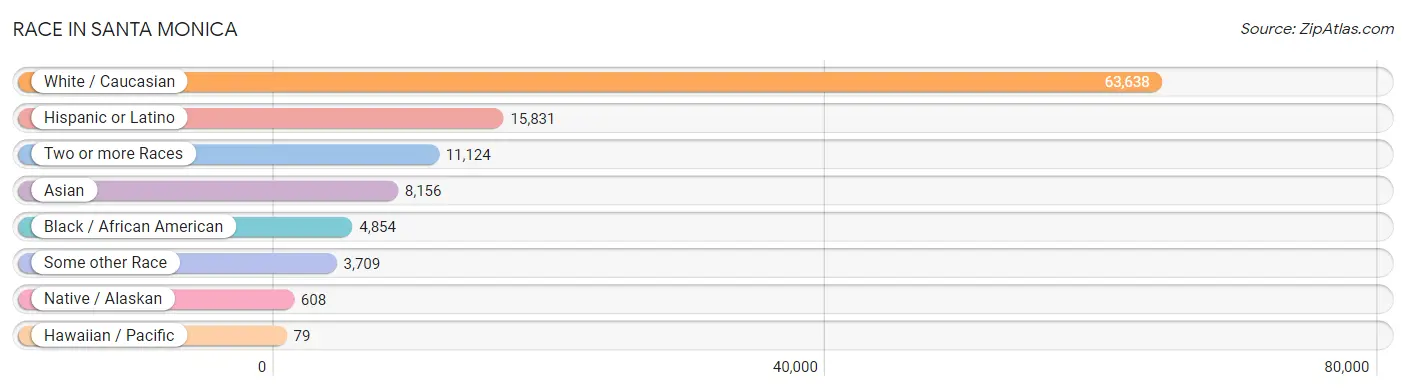
| Race | # Population | % Population |
| Asian | 8,156 | 8.8% |
| Black / African American | 4,854 | 5.3% |
| Hawaiian / Pacific | 79 | 0.1% |
| Hispanic or Latino | 15,831 | 17.2% |
| Native / Alaskan | 608 | 0.7% |
| White / Caucasian | 63,638 | 69.1% |
| Two or more Races | 11,124 | 12.1% |
| Some other Race | 3,709 | 4.0% |
| Total | 92,168 | 100.0% |
Ancestry in Santa Monica
The most populous ancestries reported in Santa Monica are Mexican (10,057 | 10.9%), Irish (9,469 | 10.3%), German (8,824 | 9.6%), English (8,442 | 9.2%), and Italian (5,592 | 6.1%), together accounting for 46.0% of all Santa Monica residents.
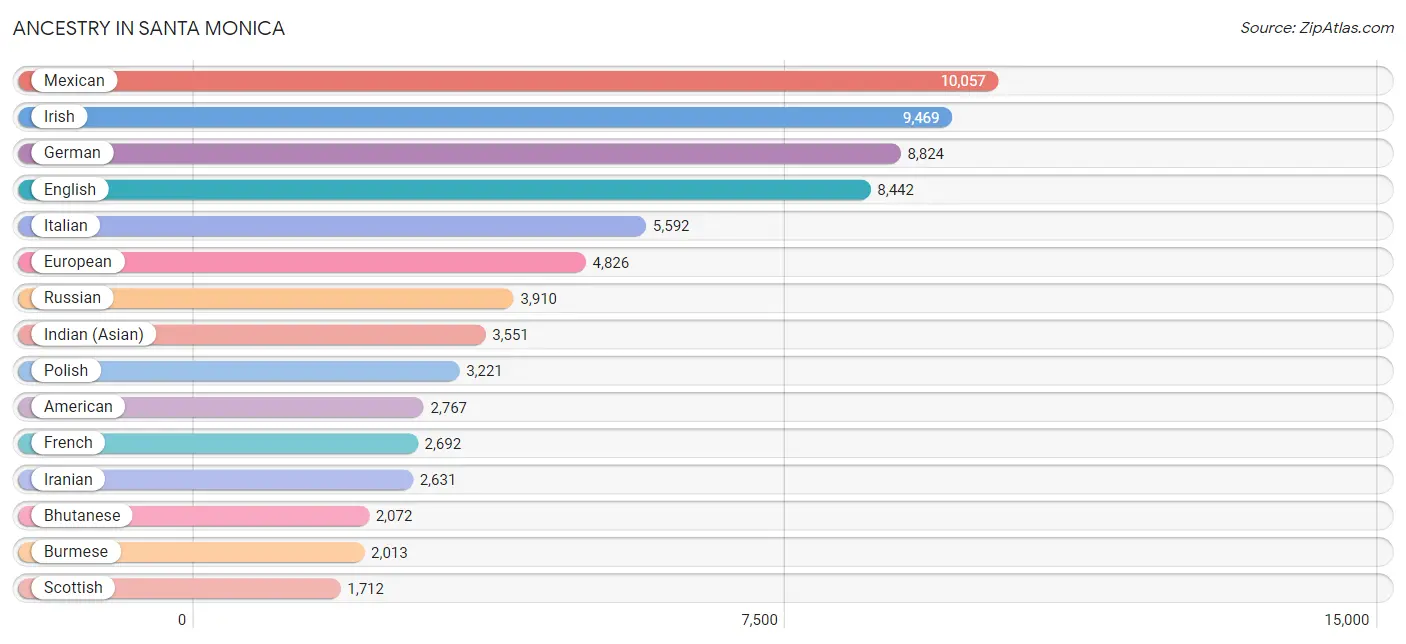
| Ancestry | # Population | % Population |
| African | 450 | 0.5% |
| Alaska Native | 5 | 0.0% |
| Albanian | 28 | 0.0% |
| American | 2,767 | 3.0% |
| Apache | 25 | 0.0% |
| Arab | 1,201 | 1.3% |
| Argentinean | 398 | 0.4% |
| Armenian | 688 | 0.7% |
| Assyrian / Chaldean / Syriac | 6 | 0.0% |
| Australian | 361 | 0.4% |
| Austrian | 798 | 0.9% |
| Barbadian | 23 | 0.0% |
| Belgian | 64 | 0.1% |
| Belizean | 153 | 0.2% |
| Bhutanese | 2,072 | 2.2% |
| Bolivian | 31 | 0.0% |
| Brazilian | 209 | 0.2% |
| British | 1,458 | 1.6% |
| British West Indian | 23 | 0.0% |
| Bulgarian | 121 | 0.1% |
| Burmese | 2,013 | 2.2% |
| Cambodian | 12 | 0.0% |
| Canadian | 352 | 0.4% |
| Central American | 1,439 | 1.6% |
| Central American Indian | 249 | 0.3% |
| Cherokee | 109 | 0.1% |
| Chilean | 92 | 0.1% |
| Colombian | 467 | 0.5% |
| Comanche | 5 | 0.0% |
| Costa Rican | 18 | 0.0% |
| Croatian | 217 | 0.2% |
| Cuban | 399 | 0.4% |
| Czech | 638 | 0.7% |
| Czechoslovakian | 47 | 0.1% |
| Danish | 535 | 0.6% |
| Dutch | 898 | 1.0% |
| Eastern European | 1,627 | 1.8% |
| Ecuadorian | 76 | 0.1% |
| Egyptian | 433 | 0.5% |
| English | 8,442 | 9.2% |
| Estonian | 23 | 0.0% |
| Ethiopian | 563 | 0.6% |
| European | 4,826 | 5.2% |
| Filipino | 653 | 0.7% |
| Finnish | 324 | 0.4% |
| French | 2,692 | 2.9% |
| French Canadian | 365 | 0.4% |
| German | 8,824 | 9.6% |
| Greek | 640 | 0.7% |
| Guamanian / Chamorro | 7 | 0.0% |
| Guatemalan | 610 | 0.7% |
| Guyanese | 67 | 0.1% |
| Haitian | 47 | 0.1% |
| Honduran | 22 | 0.0% |
| Houma | 1 | 0.0% |
| Hungarian | 815 | 0.9% |
| Indian (Asian) | 3,551 | 3.8% |
| Indonesian | 12 | 0.0% |
| Iranian | 2,631 | 2.9% |
| Iraqi | 47 | 0.1% |
| Irish | 9,469 | 10.3% |
| Iroquois | 13 | 0.0% |
| Israeli | 355 | 0.4% |
| Italian | 5,592 | 6.1% |
| Jamaican | 286 | 0.3% |
| Japanese | 3 | 0.0% |
| Korean | 1,309 | 1.4% |
| Laotian | 173 | 0.2% |
| Latvian | 66 | 0.1% |
| Lebanese | 405 | 0.4% |
| Lithuanian | 487 | 0.5% |
| Malaysian | 24 | 0.0% |
| Maltese | 34 | 0.0% |
| Mexican | 10,057 | 10.9% |
| Mexican American Indian | 477 | 0.5% |
| Mongolian | 33 | 0.0% |
| Moroccan | 20 | 0.0% |
| Native Hawaiian | 72 | 0.1% |
| Navajo | 32 | 0.0% |
| New Zealander | 29 | 0.0% |
| Nicaraguan | 42 | 0.1% |
| Nigerian | 73 | 0.1% |
| Northern European | 146 | 0.2% |
| Norwegian | 1,106 | 1.2% |
| Osage | 5 | 0.0% |
| Paiute | 62 | 0.1% |
| Pakistani | 188 | 0.2% |
| Palestinian | 43 | 0.1% |
| Panamanian | 122 | 0.1% |
| Peruvian | 331 | 0.4% |
| Polish | 3,221 | 3.5% |
| Portuguese | 233 | 0.3% |
| Puerto Rican | 534 | 0.6% |
| Romanian | 776 | 0.8% |
| Russian | 3,910 | 4.2% |
| Salvadoran | 625 | 0.7% |
| Samoan | 16 | 0.0% |
| Scandinavian | 237 | 0.3% |
| Scotch-Irish | 496 | 0.5% |
| Scottish | 1,712 | 1.9% |
| Seminole | 9 | 0.0% |
| Serbian | 220 | 0.2% |
| Shoshone | 19 | 0.0% |
| Sioux | 135 | 0.2% |
| Slavic | 90 | 0.1% |
| Slovak | 175 | 0.2% |
| Slovene | 56 | 0.1% |
| South African | 85 | 0.1% |
| South American | 1,427 | 1.5% |
| Soviet Union | 8 | 0.0% |
| Spaniard | 658 | 0.7% |
| Spanish | 516 | 0.6% |
| Spanish American | 27 | 0.0% |
| Sri Lankan | 683 | 0.7% |
| Subsaharan African | 1,209 | 1.3% |
| Swedish | 1,102 | 1.2% |
| Swiss | 388 | 0.4% |
| Thai | 1,486 | 1.6% |
| Tlingit-Haida | 5 | 0.0% |
| Tongan | 16 | 0.0% |
| Trinidadian and Tobagonian | 37 | 0.0% |
| Turkish | 194 | 0.2% |
| Ukrainian | 752 | 0.8% |
| Uruguayan | 3 | 0.0% |
| Ute | 33 | 0.0% |
| Venezuelan | 29 | 0.0% |
| Welsh | 366 | 0.4% |
| Yaqui | 46 | 0.1% |
| Yugoslavian | 76 | 0.1% | View All 129 Rows |
Immigrants in Santa Monica
The most numerous immigrant groups reported in Santa Monica came from Asia (7,464 | 8.1%), Europe (5,558 | 6.0%), Latin America (5,028 | 5.5%), Central America (3,731 | 4.1%), and Eastern Asia (3,130 | 3.4%), together accounting for 27.0% of all Santa Monica residents.
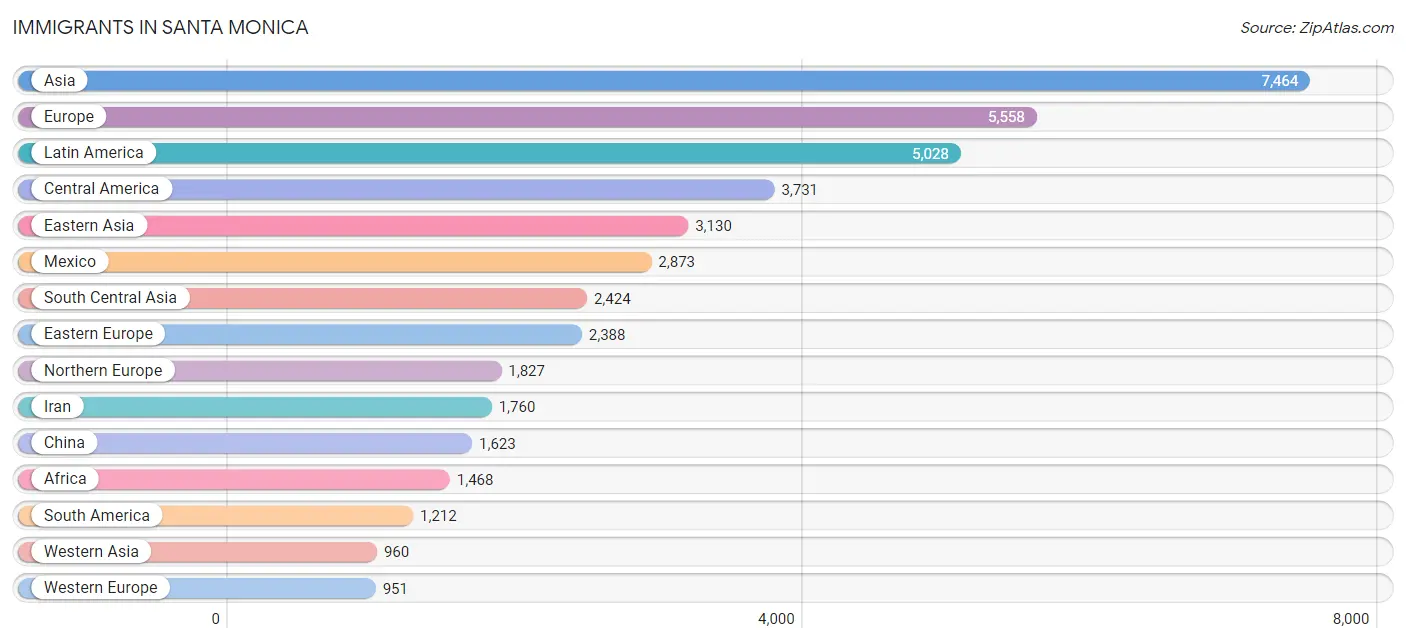
| Immigration Origin | # Population | % Population |
| Africa | 1,468 | 1.6% |
| Argentina | 401 | 0.4% |
| Armenia | 24 | 0.0% |
| Asia | 7,464 | 8.1% |
| Australia | 437 | 0.5% |
| Austria | 61 | 0.1% |
| Azores | 9 | 0.0% |
| Belarus | 109 | 0.1% |
| Belize | 136 | 0.2% |
| Bolivia | 11 | 0.0% |
| Brazil | 218 | 0.2% |
| Bulgaria | 63 | 0.1% |
| Cambodia | 3 | 0.0% |
| Canada | 745 | 0.8% |
| Caribbean | 85 | 0.1% |
| Central America | 3,731 | 4.1% |
| Chile | 29 | 0.0% |
| China | 1,623 | 1.8% |
| Colombia | 179 | 0.2% |
| Croatia | 17 | 0.0% |
| Cuba | 13 | 0.0% |
| Czechoslovakia | 156 | 0.2% |
| Denmark | 31 | 0.0% |
| Eastern Africa | 566 | 0.6% |
| Eastern Asia | 3,130 | 3.4% |
| Eastern Europe | 2,388 | 2.6% |
| Ecuador | 35 | 0.0% |
| Egypt | 364 | 0.4% |
| El Salvador | 360 | 0.4% |
| England | 651 | 0.7% |
| Ethiopia | 431 | 0.5% |
| Europe | 5,558 | 6.0% |
| France | 392 | 0.4% |
| Germany | 429 | 0.5% |
| Greece | 19 | 0.0% |
| Guatemala | 293 | 0.3% |
| Guyana | 67 | 0.1% |
| Honduras | 22 | 0.0% |
| Hong Kong | 145 | 0.2% |
| Hungary | 104 | 0.1% |
| India | 504 | 0.5% |
| Indonesia | 109 | 0.1% |
| Iran | 1,760 | 1.9% |
| Iraq | 15 | 0.0% |
| Ireland | 197 | 0.2% |
| Israel | 330 | 0.4% |
| Italy | 213 | 0.2% |
| Jamaica | 72 | 0.1% |
| Japan | 732 | 0.8% |
| Kazakhstan | 12 | 0.0% |
| Kenya | 48 | 0.1% |
| Korea | 775 | 0.8% |
| Latin America | 5,028 | 5.5% |
| Latvia | 19 | 0.0% |
| Lebanon | 180 | 0.2% |
| Lithuania | 231 | 0.3% |
| Mexico | 2,873 | 3.1% |
| Moldova | 43 | 0.1% |
| Morocco | 4 | 0.0% |
| Netherlands | 32 | 0.0% |
| Nicaragua | 33 | 0.0% |
| Nigeria | 104 | 0.1% |
| Northern Africa | 449 | 0.5% |
| Northern Europe | 1,827 | 2.0% |
| Norway | 31 | 0.0% |
| Oceania | 462 | 0.5% |
| Pakistan | 101 | 0.1% |
| Panama | 14 | 0.0% |
| Peru | 213 | 0.2% |
| Philippines | 458 | 0.5% |
| Poland | 375 | 0.4% |
| Portugal | 26 | 0.0% |
| Romania | 51 | 0.1% |
| Russia | 646 | 0.7% |
| Saudi Arabia | 126 | 0.1% |
| Scotland | 26 | 0.0% |
| Senegal | 24 | 0.0% |
| Serbia | 78 | 0.1% |
| Singapore | 33 | 0.0% |
| South Africa | 268 | 0.3% |
| South America | 1,212 | 1.3% |
| South Central Asia | 2,424 | 2.6% |
| South Eastern Asia | 946 | 1.0% |
| Southern Europe | 370 | 0.4% |
| Spain | 112 | 0.1% |
| Sudan | 52 | 0.1% |
| Sweden | 87 | 0.1% |
| Switzerland | 37 | 0.0% |
| Taiwan | 317 | 0.3% |
| Thailand | 158 | 0.2% |
| Turkey | 153 | 0.2% |
| Ukraine | 381 | 0.4% |
| Uruguay | 3 | 0.0% |
| Uzbekistan | 18 | 0.0% |
| Venezuela | 54 | 0.1% |
| Vietnam | 185 | 0.2% |
| Western Africa | 146 | 0.2% |
| Western Asia | 960 | 1.0% |
| Western Europe | 951 | 1.0% |
| Zimbabwe | 42 | 0.1% | View All 100 Rows |
Sex and Age in Santa Monica
Sex and Age in Santa Monica
The most populous age groups in Santa Monica are 30 to 34 Years (4,650 | 10.2%) for men and 30 to 34 Years (4,909 | 10.5%) for women.
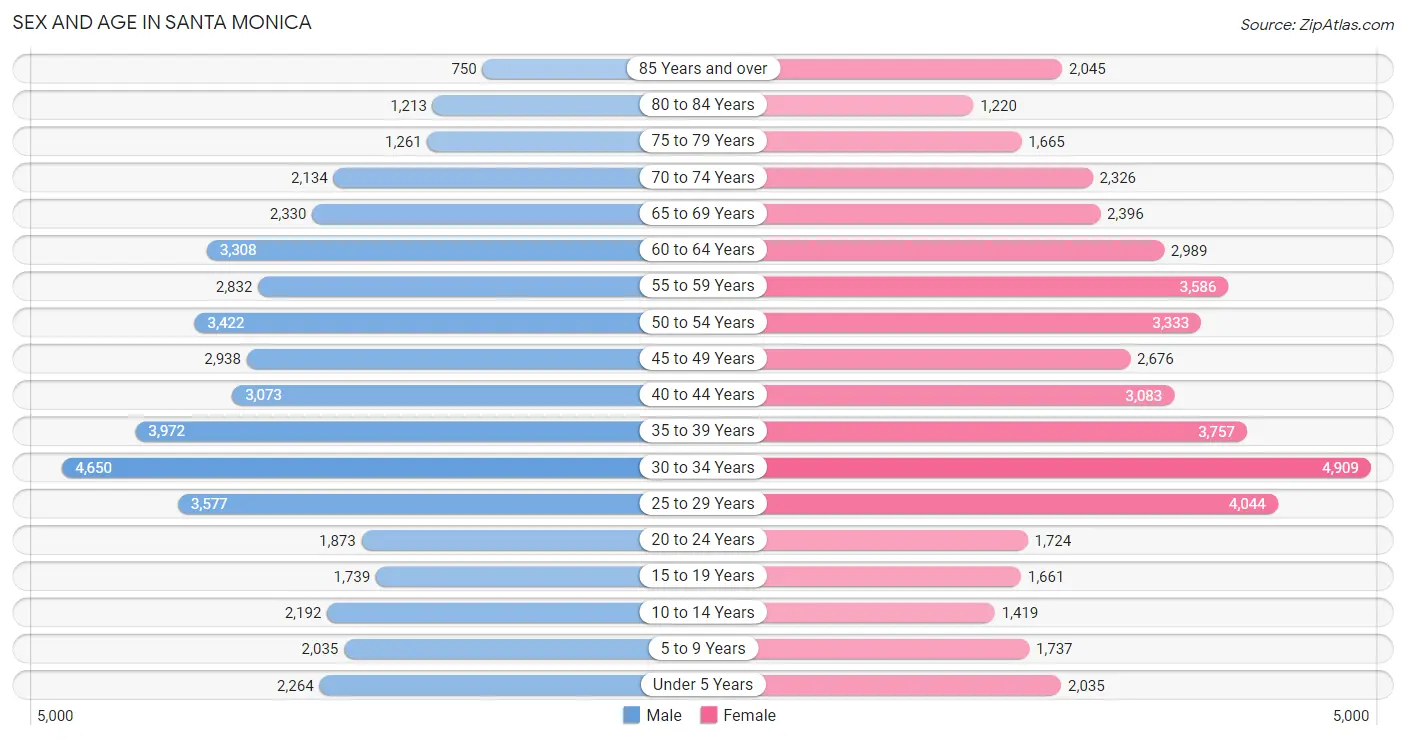
| Age Bracket | Male | Female |
| Under 5 Years | 2,264 (5.0%) | 2,035 (4.4%) |
| 5 to 9 Years | 2,035 (4.5%) | 1,737 (3.7%) |
| 10 to 14 Years | 2,192 (4.8%) | 1,419 (3.0%) |
| 15 to 19 Years | 1,739 (3.8%) | 1,661 (3.6%) |
| 20 to 24 Years | 1,873 (4.1%) | 1,724 (3.7%) |
| 25 to 29 Years | 3,577 (7.9%) | 4,044 (8.7%) |
| 30 to 34 Years | 4,650 (10.2%) | 4,909 (10.5%) |
| 35 to 39 Years | 3,972 (8.7%) | 3,757 (8.1%) |
| 40 to 44 Years | 3,073 (6.7%) | 3,083 (6.6%) |
| 45 to 49 Years | 2,938 (6.5%) | 2,676 (5.7%) |
| 50 to 54 Years | 3,422 (7.5%) | 3,333 (7.1%) |
| 55 to 59 Years | 2,832 (6.2%) | 3,586 (7.7%) |
| 60 to 64 Years | 3,308 (7.3%) | 2,989 (6.4%) |
| 65 to 69 Years | 2,330 (5.1%) | 2,396 (5.1%) |
| 70 to 74 Years | 2,134 (4.7%) | 2,326 (5.0%) |
| 75 to 79 Years | 1,261 (2.8%) | 1,665 (3.6%) |
| 80 to 84 Years | 1,213 (2.7%) | 1,220 (2.6%) |
| 85 Years and over | 750 (1.7%) | 2,045 (4.4%) |
| Total | 45,563 (100.0%) | 46,605 (100.0%) |
Families and Households in Santa Monica
Median Family Size in Santa Monica
The median family size in Santa Monica is 2.87 persons per family, with married-couple families (14,543 | 75.1%) accounting for the largest median family size of 2.92 persons per family. On the other hand, single male/father families (1,628 | 8.4%) represent the smallest median family size with 2.55 persons per family.
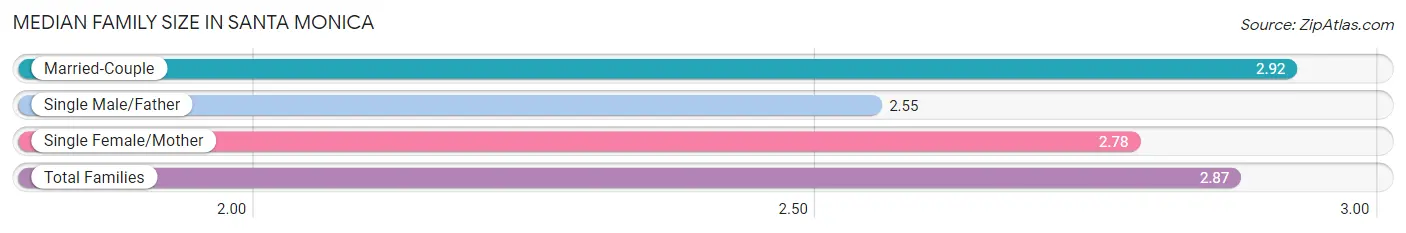
| Family Type | # Families | Family Size |
| Married-Couple | 14,543 (75.1%) | 2.92 |
| Single Male/Father | 1,628 (8.4%) | 2.55 |
| Single Female/Mother | 3,201 (16.5%) | 2.78 |
| Total Families | 19,372 (100.0%) | 2.87 |
Median Household Size in Santa Monica
The median household size in Santa Monica is 1.95 persons per household, with married-couple households (14,543 | 31.5%) accounting for the largest median household size of 2.94 persons per household. non-family households (26,835 | 58.1%) represent the smallest median household size with 1.25 persons per household.
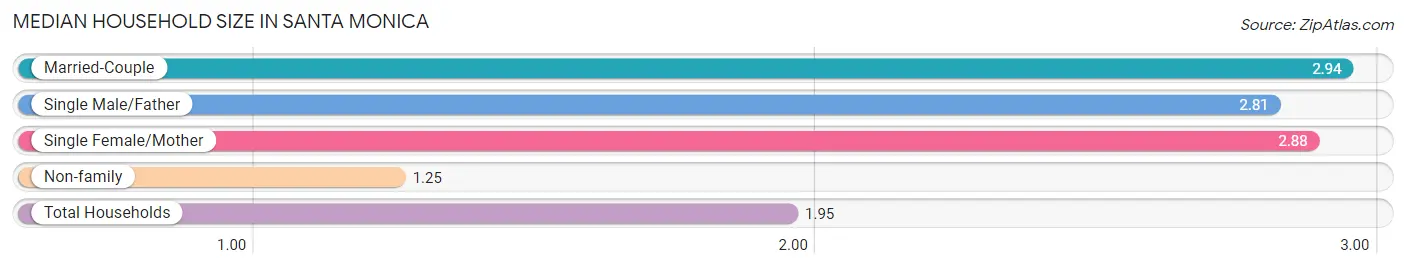
| Household Type | # Households | Household Size |
| Married-Couple | 14,543 (31.5%) | 2.94 |
| Single Male/Father | 1,628 (3.5%) | 2.81 |
| Single Female/Mother | 3,201 (6.9%) | 2.88 |
| Non-family | 26,835 (58.1%) | 1.25 |
| Total Households | 46,207 (100.0%) | 1.95 |
Household Size by Marriage Status in Santa Monica
Out of a total of 46,207 households in Santa Monica, 19,372 (41.9%) are family households, while 26,835 (58.1%) are nonfamily households. The most numerous type of family households are 2-person households, comprising 10,301, and the most common type of nonfamily households are 1-person households, comprising 21,440.
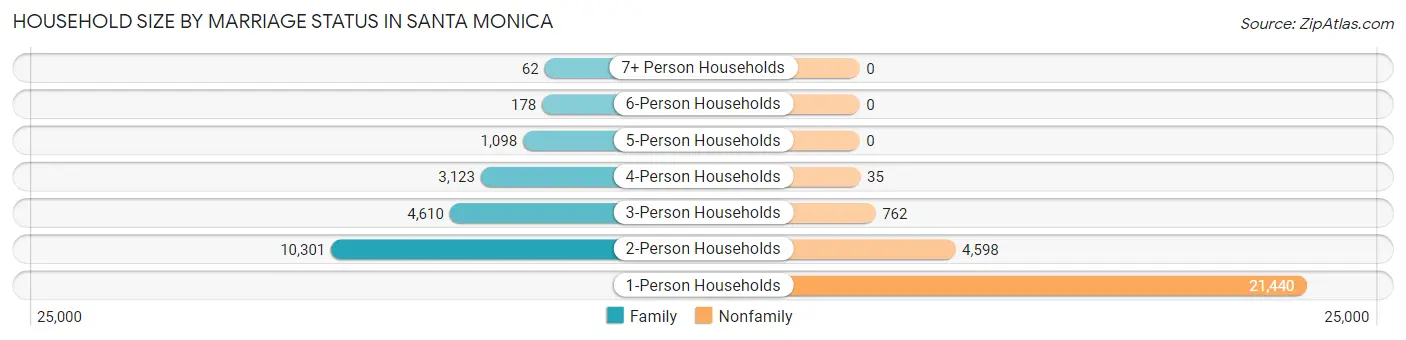
| Household Size | Family Households | Nonfamily Households |
| 1-Person Households | - | 21,440 (46.4%) |
| 2-Person Households | 10,301 (22.3%) | 4,598 (10.0%) |
| 3-Person Households | 4,610 (10.0%) | 762 (1.7%) |
| 4-Person Households | 3,123 (6.8%) | 35 (0.1%) |
| 5-Person Households | 1,098 (2.4%) | 0 (0.0%) |
| 6-Person Households | 178 (0.4%) | 0 (0.0%) |
| 7+ Person Households | 62 (0.1%) | 0 (0.0%) |
| Total | 19,372 (41.9%) | 26,835 (58.1%) |
Female Fertility in Santa Monica
Fertility by Age in Santa Monica
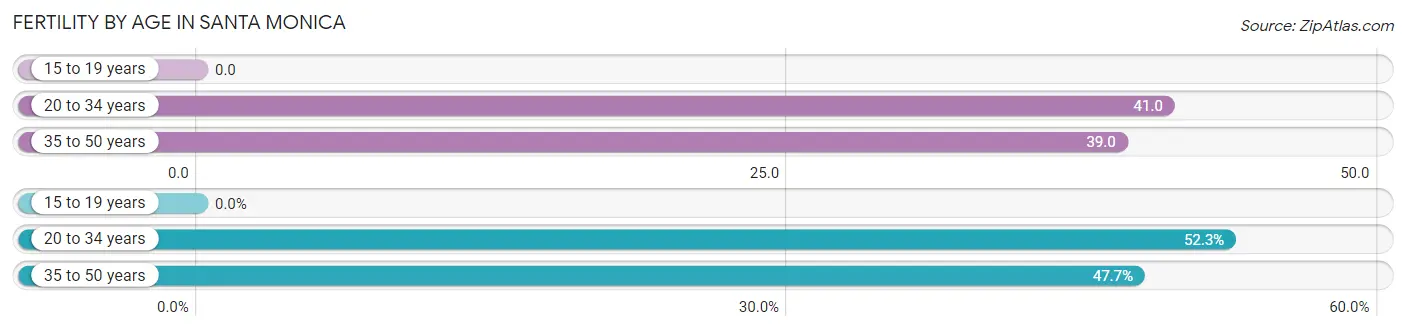
Average fertility rate in Santa Monica is 37.0 births per 1,000 women. Women in the age bracket of 20 to 34 years have the highest fertility rate with 41.0 births per 1,000 women. Women in the age bracket of 20 to 34 years acount for 52.3% of all women with births.
| Age Bracket | Women with Births | Births / 1,000 Women |
| 15 to 19 years | 0 (0.0%) | 0.0 |
| 20 to 34 years | 439 (52.3%) | 41.0 |
| 35 to 50 years | 400 (47.7%) | 39.0 |
| Total | 839 (100.0%) | 37.0 |
Fertility by Age by Marriage Status in Santa Monica
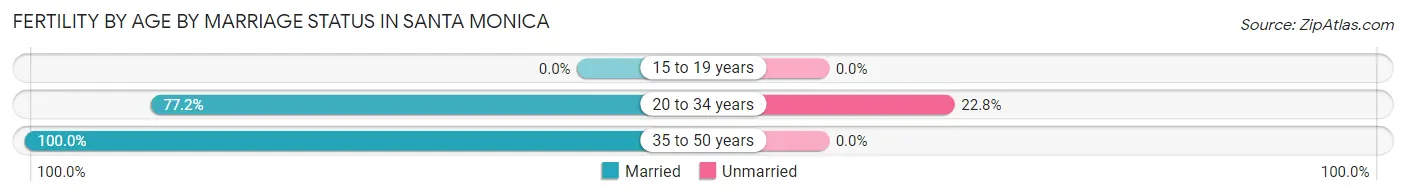
88.1% of women with births (839) in Santa Monica are married. The highest percentage of unmarried women with births falls into 20 to 34 years age bracket with 22.8% of them unmarried at the time of birth, while the lowest percentage of unmarried women with births belong to 35 to 50 years age bracket with 0.0% of them unmarried.
| Age Bracket | Married | Unmarried |
| 15 to 19 years | 0 (0.0%) | 0 (0.0%) |
| 20 to 34 years | 339 (77.2%) | 100 (22.8%) |
| 35 to 50 years | 400 (100.0%) | 0 (0.0%) |
| Total | 739 (88.1%) | 100 (11.9%) |
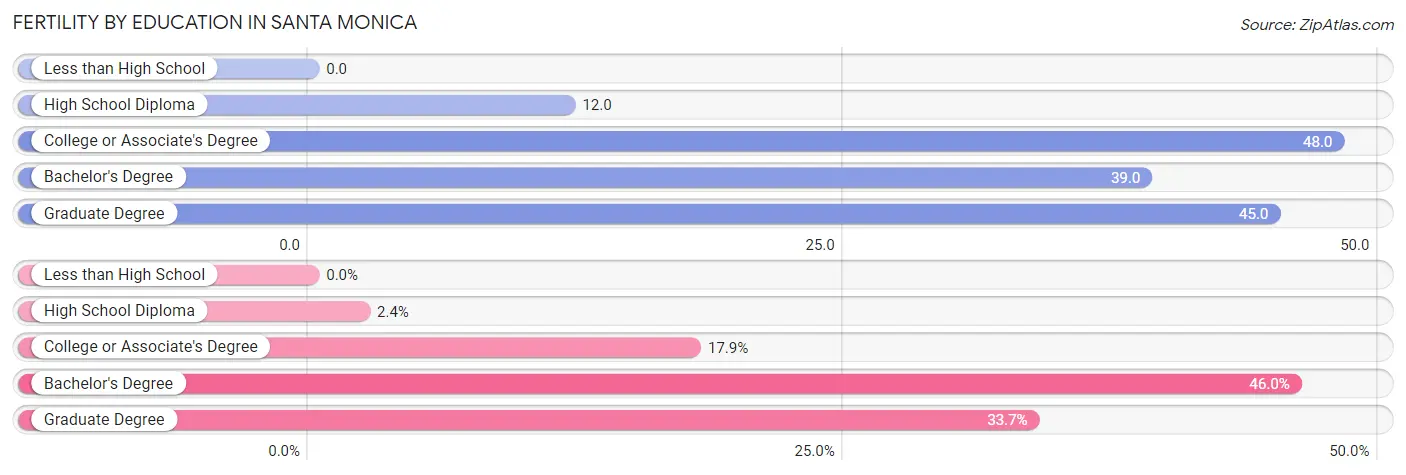
Fertility by Education in Santa Monica
| Educational Attainment | Women with Births | Births / 1,000 Women |
| Less than High School | 0 (0.0%) | 0.0 |
| High School Diploma | 20 (2.4%) | 12.0 |
| College or Associate's Degree | 150 (17.9%) | 48.0 |
| Bachelor's Degree | 386 (46.0%) | 39.0 |
| Graduate Degree | 283 (33.7%) | 45.0 |
| Total | 839 (100.0%) | 37.0 |
Fertility by Education by Marriage Status in Santa Monica
11.9% of women with births in Santa Monica are unmarried. Women with the educational attainment of high school diploma are most likely to be married with 100.0% of them married at childbirth, while women with the educational attainment of college or associate's degree are least likely to be married with 24.0% of them unmarried at childbirth.
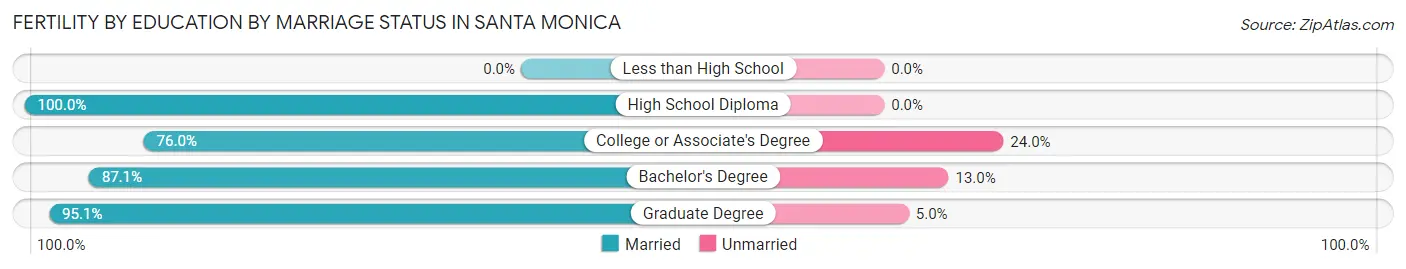
| Educational Attainment | Married | Unmarried |
| Less than High School | 0 (0.0%) | 0 (0.0%) |
| High School Diploma | 20 (100.0%) | 0 (0.0%) |
| College or Associate's Degree | 114 (76.0%) | 36 (24.0%) |
| Bachelor's Degree | 336 (87.1%) | 50 (13.0%) |
| Graduate Degree | 269 (95.1%) | 14 (5.0%) |
| Total | 739 (88.1%) | 100 (11.9%) |
Employment Characteristics in Santa Monica
Employment by Class of Employer in Santa Monica
Among the 49,196 employed individuals in Santa Monica, private company employees (30,801 | 62.6%), self-employed (not incorporated) (5,600 | 11.4%), and not-for-profit organizations (4,092 | 8.3%) make up the most common classes of employment.
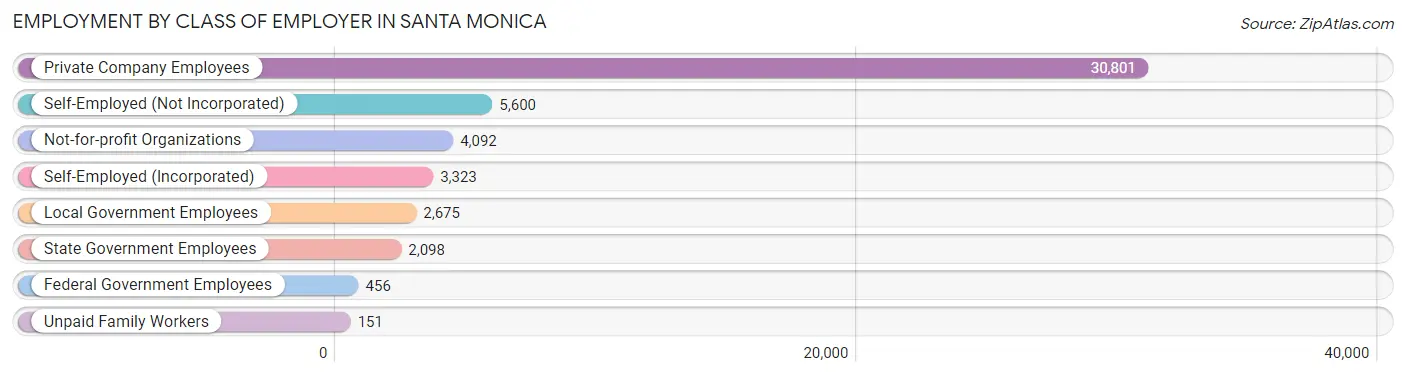
| Employer Class | # Employees | % Employees |
| Private Company Employees | 30,801 | 62.6% |
| Self-Employed (Incorporated) | 3,323 | 6.8% |
| Self-Employed (Not Incorporated) | 5,600 | 11.4% |
| Not-for-profit Organizations | 4,092 | 8.3% |
| Local Government Employees | 2,675 | 5.4% |
| State Government Employees | 2,098 | 4.3% |
| Federal Government Employees | 456 | 0.9% |
| Unpaid Family Workers | 151 | 0.3% |
| Total | 49,196 | 100.0% |
Employment Status by Age in Santa Monica
According to the labor force statistics for Santa Monica, out of the total population over 16 years of age (79,612), 67.4% or 53,658 individuals are in the labor force, with 6.2% or 3,327 of them unemployed. The age group with the highest labor force participation rate is 25 to 29 years, with 89.8% or 6,844 individuals in the labor force. Within the labor force, the 16 to 19 years age range has the highest percentage of unemployed individuals, with 12.8% or 42 of them being unemployed.
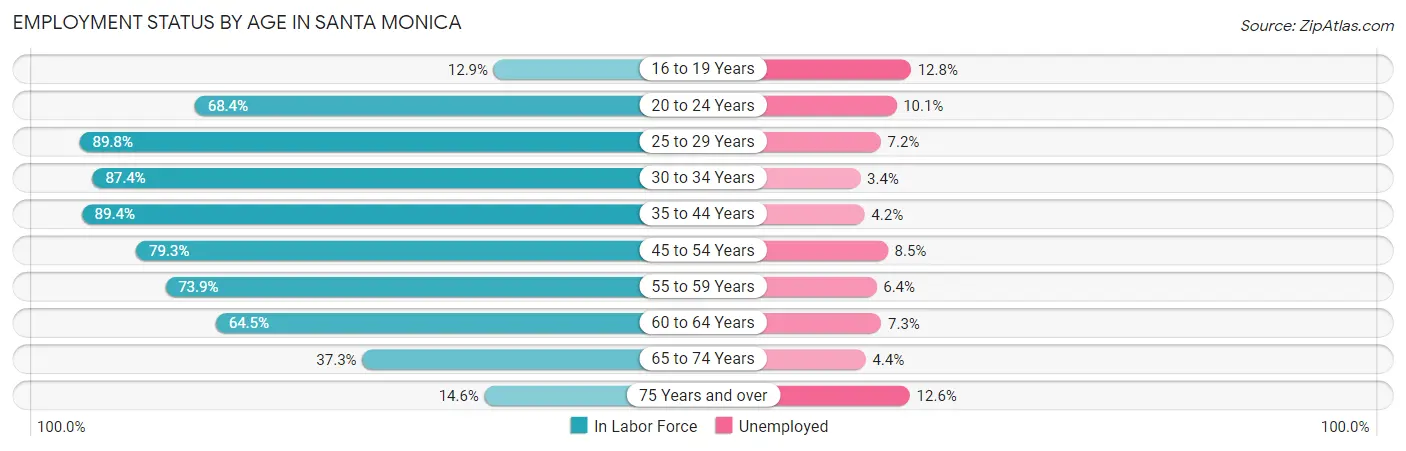
| Age Bracket | In Labor Force | Unemployed |
| 16 to 19 Years | 326 (12.9%) | 42 (12.8%) |
| 20 to 24 Years | 2,460 (68.4%) | 248 (10.1%) |
| 25 to 29 Years | 6,844 (89.8%) | 493 (7.2%) |
| 30 to 34 Years | 8,355 (87.4%) | 284 (3.4%) |
| 35 to 44 Years | 12,413 (89.4%) | 521 (4.2%) |
| 45 to 54 Years | 9,809 (79.3%) | 834 (8.5%) |
| 55 to 59 Years | 4,743 (73.9%) | 304 (6.4%) |
| 60 to 64 Years | 4,062 (64.5%) | 297 (7.3%) |
| 65 to 74 Years | 3,426 (37.3%) | 151 (4.4%) |
| 75 Years and over | 1,190 (14.6%) | 150 (12.6%) |
| Total | 53,658 (67.4%) | 3,327 (6.2%) |
Employment Status by Educational Attainment in Santa Monica
According to labor force statistics for Santa Monica, 82.3% of individuals (46,211) out of the total population between 25 and 64 years of age (56,149) are in the labor force, with 5.9% or 2,726 of them being unemployed. The group with the highest labor force participation rate are those with the educational attainment of bachelor's degree or higher, with 87.2% or 34,929 individuals in the labor force. Within the labor force, individuals with college / associate degree education have the highest percentage of unemployment, with 10.7% or 805 of them being unemployed.
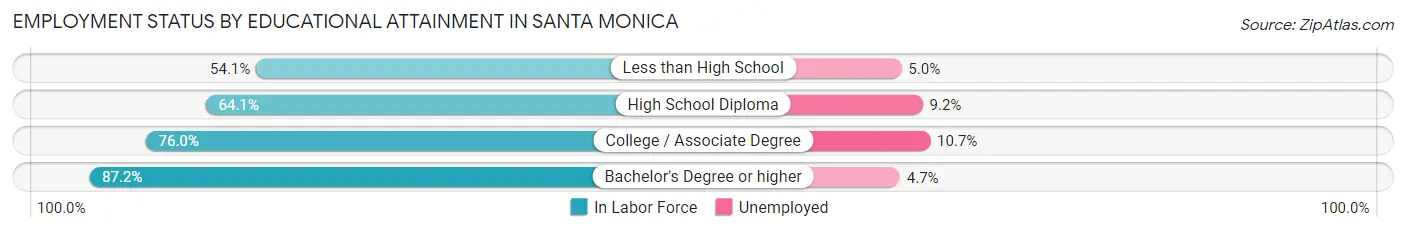
| Educational Attainment | In Labor Force | Unemployed |
| Less than High School | 1,170 (54.1%) | 108 (5.0%) |
| High School Diploma | 2,585 (64.1%) | 371 (9.2%) |
| College / Associate Degree | 7,522 (76.0%) | 1,059 (10.7%) |
| Bachelor's Degree or higher | 34,929 (87.2%) | 1,883 (4.7%) |
| Total | 46,211 (82.3%) | 3,313 (5.9%) |
Employment Occupations by Sex in Santa Monica
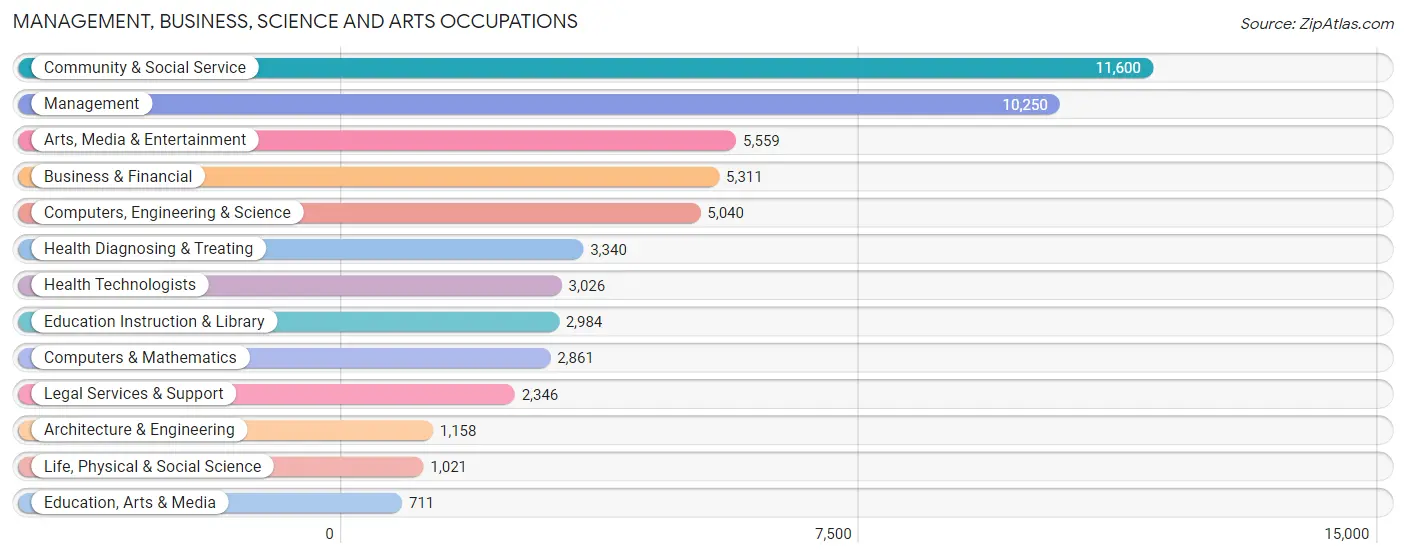
Management, Business, Science and Arts Occupations
The most common Management, Business, Science and Arts occupations in Santa Monica are Community & Social Service (11,600 | 23.1%), Management (10,250 | 20.4%), Arts, Media & Entertainment (5,559 | 11.1%), Business & Financial (5,311 | 10.6%), and Computers, Engineering & Science (5,040 | 10.0%).
Management, Business, Science and Arts Occupations by Sex
Within the Management, Business, Science and Arts occupations in Santa Monica, the most male-oriented occupations are Computers & Mathematics (81.1%), Computers, Engineering & Science (66.8%), and Architecture & Engineering (64.0%), while the most female-oriented occupations are Life, Physical & Social Science (70.2%), Health Technologists (65.4%), and Education, Arts & Media (65.1%).
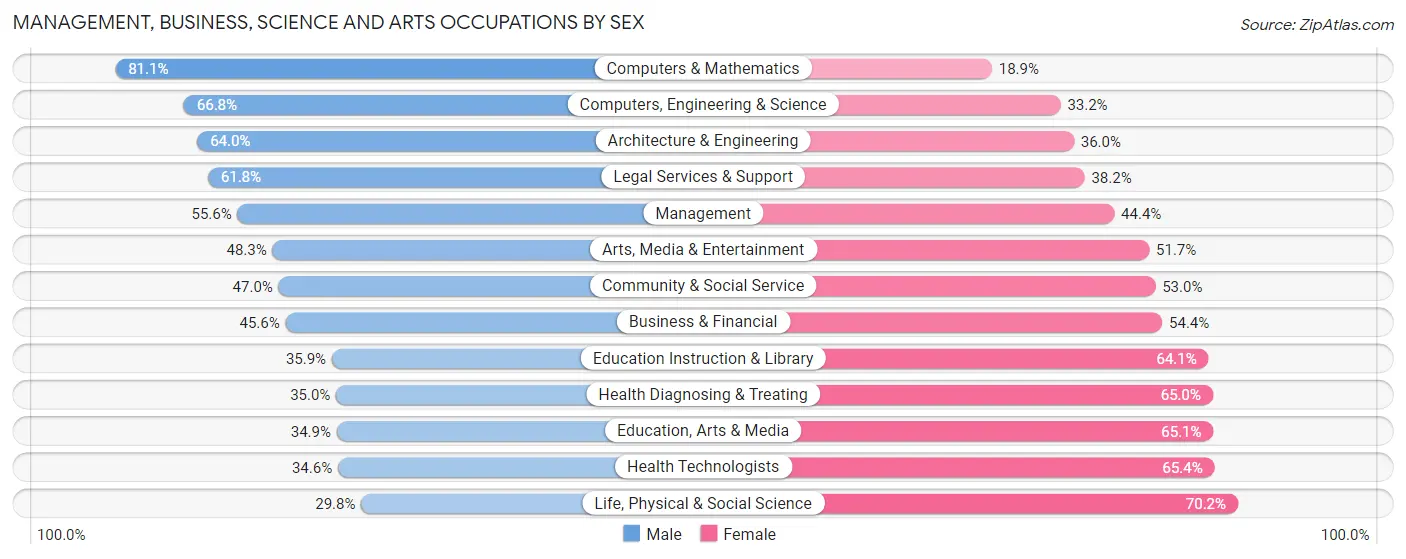
| Occupation | Male | Female |
| Management | 5,696 (55.6%) | 4,554 (44.4%) |
| Business & Financial | 2,420 (45.6%) | 2,891 (54.4%) |
| Computers, Engineering & Science | 3,365 (66.8%) | 1,675 (33.2%) |
| Computers & Mathematics | 2,320 (81.1%) | 541 (18.9%) |
| Architecture & Engineering | 741 (64.0%) | 417 (36.0%) |
| Life, Physical & Social Science | 304 (29.8%) | 717 (70.2%) |
| Community & Social Service | 5,452 (47.0%) | 6,148 (53.0%) |
| Education, Arts & Media | 248 (34.9%) | 463 (65.1%) |
| Legal Services & Support | 1,449 (61.8%) | 897 (38.2%) |
| Education Instruction & Library | 1,071 (35.9%) | 1,913 (64.1%) |
| Arts, Media & Entertainment | 2,684 (48.3%) | 2,875 (51.7%) |
| Health Diagnosing & Treating | 1,169 (35.0%) | 2,171 (65.0%) |
| Health Technologists | 1,048 (34.6%) | 1,978 (65.4%) |
| Total (Category) | 18,102 (50.9%) | 17,439 (49.1%) |
| Total (Overall) | 25,257 (50.3%) | 24,996 (49.7%) |
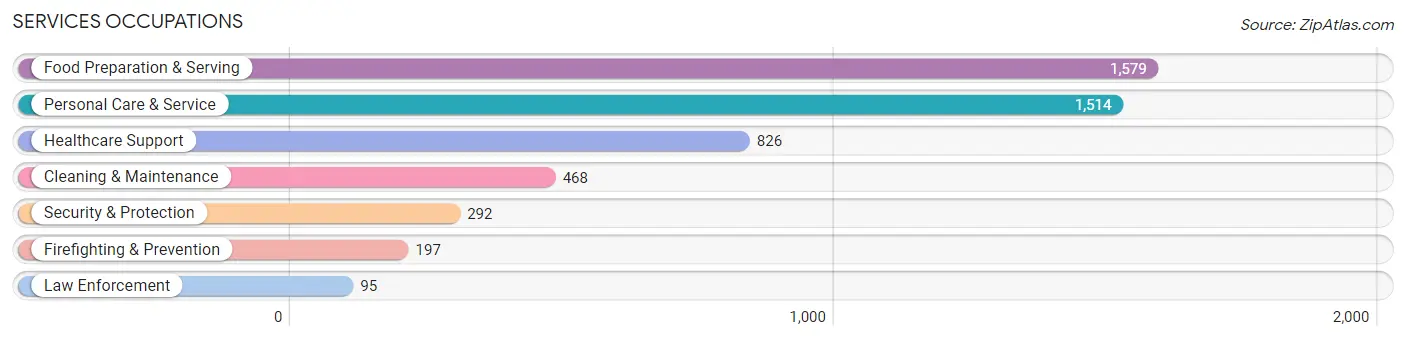
Services Occupations
The most common Services occupations in Santa Monica are Food Preparation & Serving (1,579 | 3.1%), Personal Care & Service (1,514 | 3.0%), Healthcare Support (826 | 1.6%), Cleaning & Maintenance (468 | 0.9%), and Security & Protection (292 | 0.6%).
Services Occupations by Sex
Within the Services occupations in Santa Monica, the most male-oriented occupations are Firefighting & Prevention (72.6%), Security & Protection (69.2%), and Law Enforcement (62.1%), while the most female-oriented occupations are Healthcare Support (73.1%), Personal Care & Service (67.9%), and Cleaning & Maintenance (60.3%).
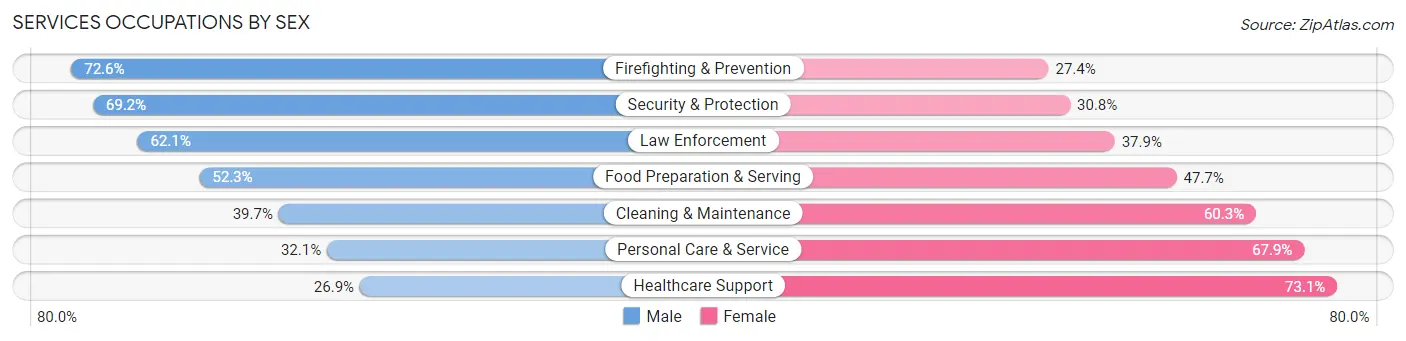
| Occupation | Male | Female |
| Healthcare Support | 222 (26.9%) | 604 (73.1%) |
| Security & Protection | 202 (69.2%) | 90 (30.8%) |
| Firefighting & Prevention | 143 (72.6%) | 54 (27.4%) |
| Law Enforcement | 59 (62.1%) | 36 (37.9%) |
| Food Preparation & Serving | 826 (52.3%) | 753 (47.7%) |
| Cleaning & Maintenance | 186 (39.7%) | 282 (60.3%) |
| Personal Care & Service | 486 (32.1%) | 1,028 (67.9%) |
| Total (Category) | 1,922 (41.1%) | 2,757 (58.9%) |
| Total (Overall) | 25,257 (50.3%) | 24,996 (49.7%) |
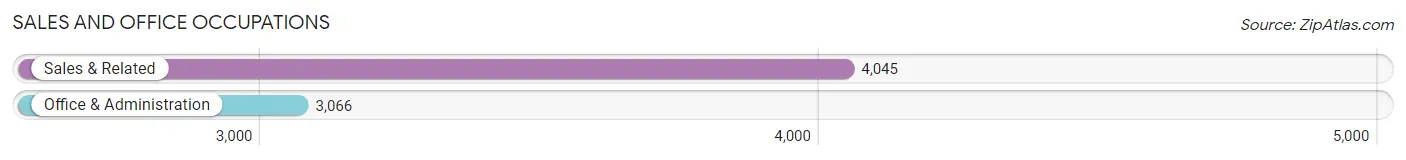
Sales and Office Occupations
The most common Sales and Office occupations in Santa Monica are Sales & Related (4,045 | 8.1%), and Office & Administration (3,066 | 6.1%).
Sales and Office Occupations by Sex
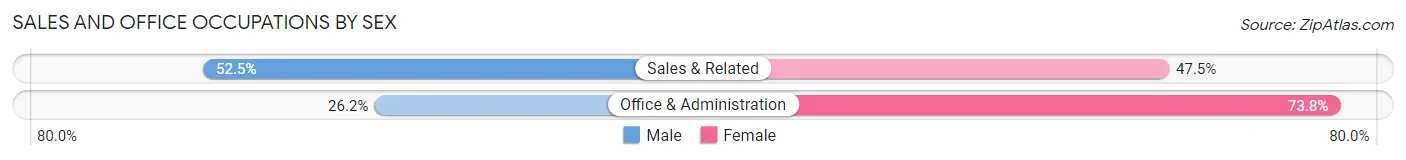
| Occupation | Male | Female |
| Sales & Related | 2,125 (52.5%) | 1,920 (47.5%) |
| Office & Administration | 804 (26.2%) | 2,262 (73.8%) |
| Total (Category) | 2,929 (41.2%) | 4,182 (58.8%) |
| Total (Overall) | 25,257 (50.3%) | 24,996 (49.7%) |
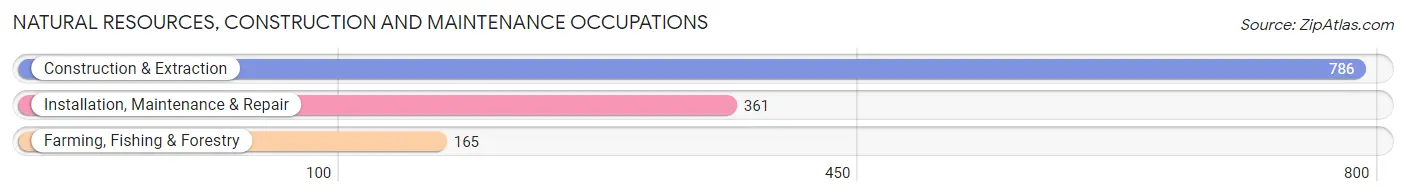
Natural Resources, Construction and Maintenance Occupations
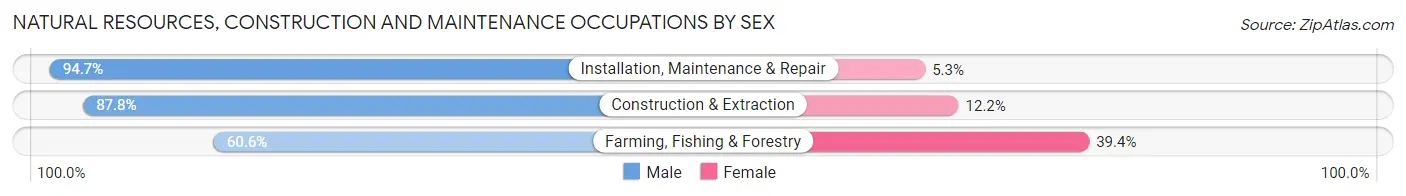
The most common Natural Resources, Construction and Maintenance occupations in Santa Monica are Construction & Extraction (786 | 1.6%), Installation, Maintenance & Repair (361 | 0.7%), and Farming, Fishing & Forestry (165 | 0.3%).
Natural Resources, Construction and Maintenance Occupations by Sex
| Occupation | Male | Female |
| Farming, Fishing & Forestry | 100 (60.6%) | 65 (39.4%) |
| Construction & Extraction | 690 (87.8%) | 96 (12.2%) |
| Installation, Maintenance & Repair | 342 (94.7%) | 19 (5.3%) |
| Total (Category) | 1,132 (86.3%) | 180 (13.7%) |
| Total (Overall) | 25,257 (50.3%) | 24,996 (49.7%) |
Production, Transportation and Moving Occupations
The most common Production, Transportation and Moving occupations in Santa Monica are Production (731 | 1.5%), Transportation (605 | 1.2%), and Material Moving (274 | 0.5%).
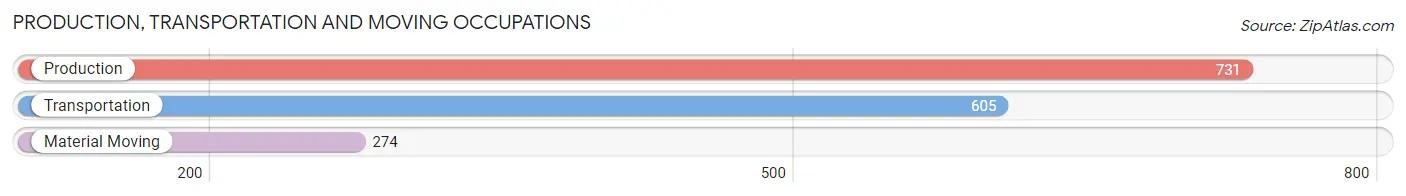
Production, Transportation and Moving Occupations by Sex
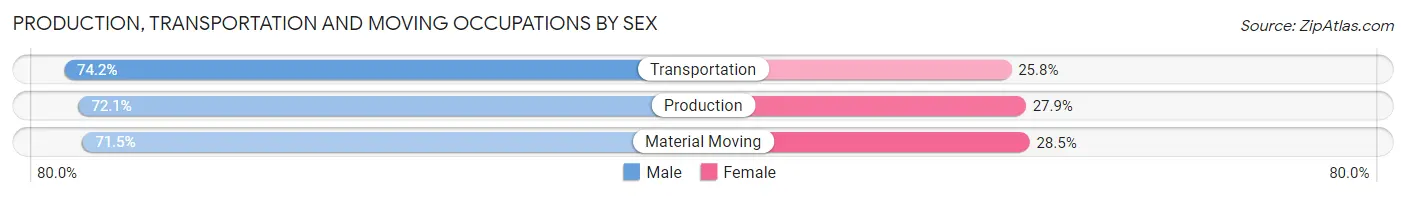
| Occupation | Male | Female |
| Production | 527 (72.1%) | 204 (27.9%) |
| Transportation | 449 (74.2%) | 156 (25.8%) |
| Material Moving | 196 (71.5%) | 78 (28.5%) |
| Total (Category) | 1,172 (72.8%) | 438 (27.2%) |
| Total (Overall) | 25,257 (50.3%) | 24,996 (49.7%) |
Employment Industries by Sex in Santa Monica
Employment Industries in Santa Monica
The major employment industries in Santa Monica include Professional & Scientific (10,658 | 21.2%), Information (5,355 | 10.7%), Health Care & Social Assistance (5,253 | 10.4%), Educational Services (4,922 | 9.8%), and Retail Trade (3,593 | 7.1%).
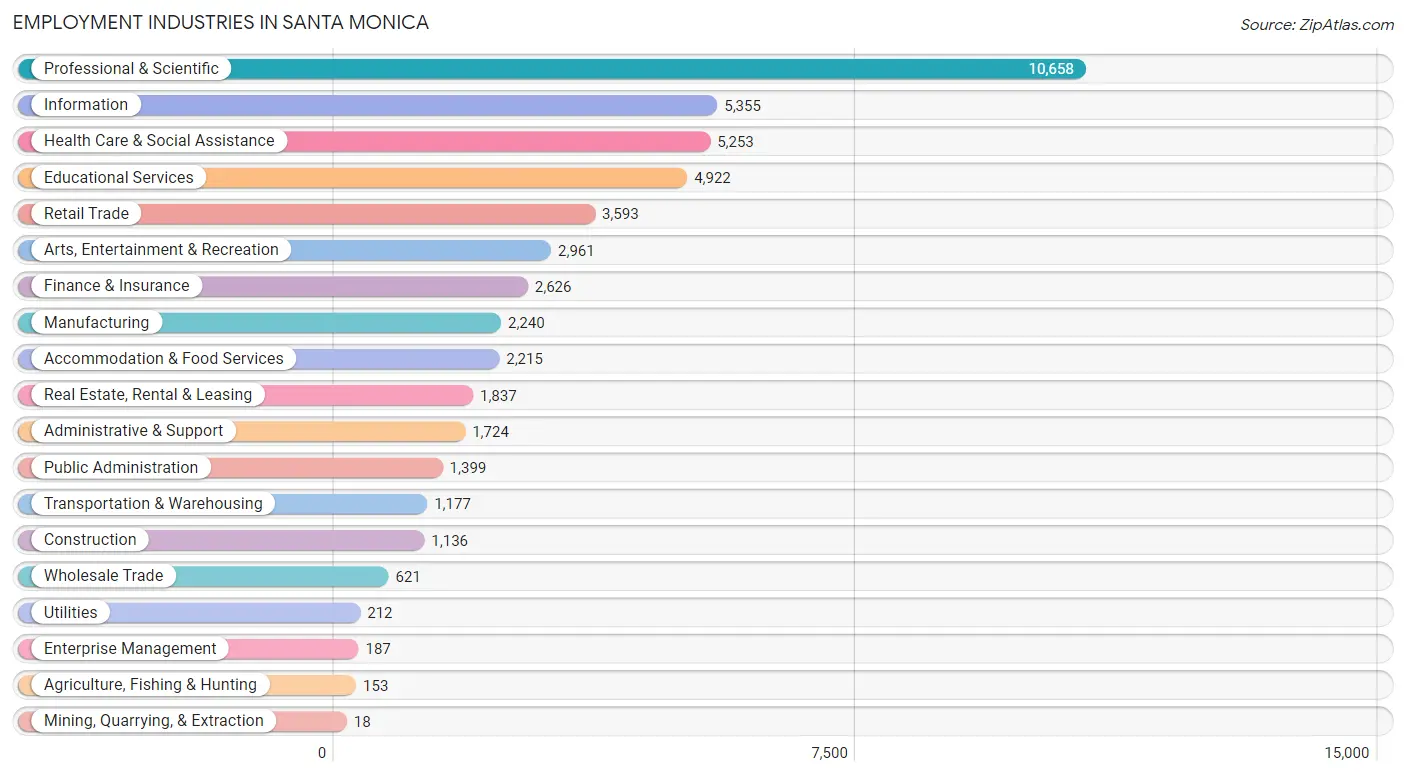
Employment Industries by Sex in Santa Monica
The Santa Monica industries that see more men than women are Construction (96.2%), Utilities (72.2%), and Finance & Insurance (70.5%), whereas the industries that tend to have a higher number of women are Mining, Quarrying, & Extraction (100.0%), Enterprise Management (88.2%), and Agriculture, Fishing & Hunting (71.9%).
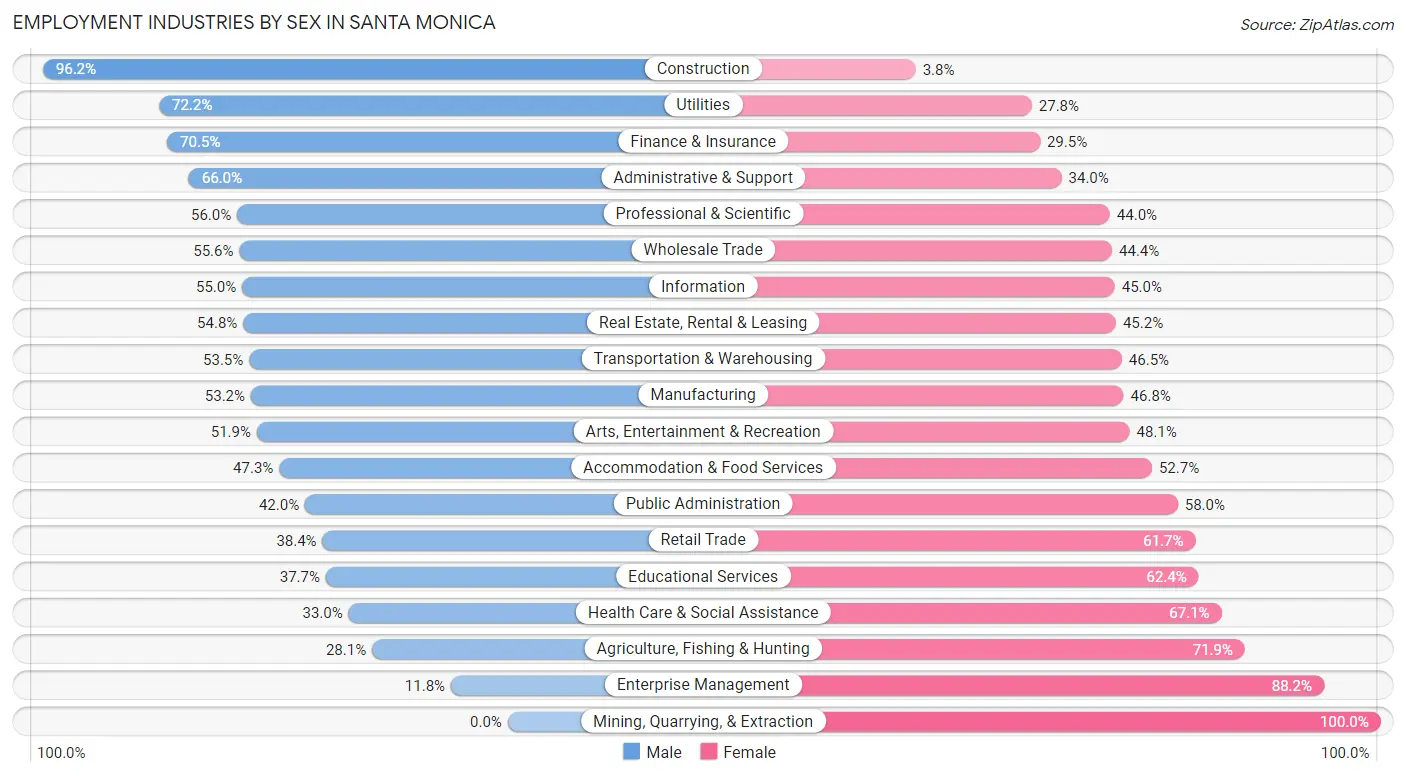
| Industry | Male | Female |
| Agriculture, Fishing & Hunting | 43 (28.1%) | 110 (71.9%) |
| Mining, Quarrying, & Extraction | 0 (0.0%) | 18 (100.0%) |
| Construction | 1,093 (96.2%) | 43 (3.8%) |
| Manufacturing | 1,191 (53.2%) | 1,049 (46.8%) |
| Wholesale Trade | 345 (55.6%) | 276 (44.4%) |
| Retail Trade | 1,378 (38.4%) | 2,215 (61.7%) |
| Transportation & Warehousing | 630 (53.5%) | 547 (46.5%) |
| Utilities | 153 (72.2%) | 59 (27.8%) |
| Information | 2,945 (55.0%) | 2,410 (45.0%) |
| Finance & Insurance | 1,851 (70.5%) | 775 (29.5%) |
| Real Estate, Rental & Leasing | 1,006 (54.8%) | 831 (45.2%) |
| Professional & Scientific | 5,971 (56.0%) | 4,687 (44.0%) |
| Enterprise Management | 22 (11.8%) | 165 (88.2%) |
| Administrative & Support | 1,138 (66.0%) | 586 (34.0%) |
| Educational Services | 1,853 (37.7%) | 3,069 (62.4%) |
| Health Care & Social Assistance | 1,731 (33.0%) | 3,522 (67.0%) |
| Arts, Entertainment & Recreation | 1,538 (51.9%) | 1,423 (48.1%) |
| Accommodation & Food Services | 1,048 (47.3%) | 1,167 (52.7%) |
| Public Administration | 587 (42.0%) | 812 (58.0%) |
| Total | 25,257 (50.3%) | 24,996 (49.7%) |
Education in Santa Monica
School Enrollment in Santa Monica
The most common levels of schooling among the 16,848 students in Santa Monica are college / undergraduate (3,699 | 22.0%), high school (2,992 | 17.8%), and elementary school (2,719 | 16.1%).
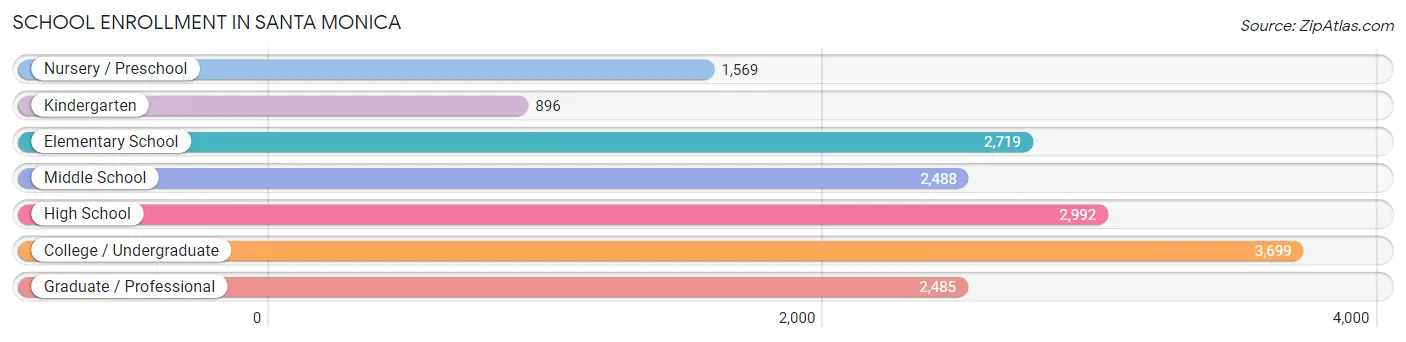
| School Level | # Students | % Students |
| Nursery / Preschool | 1,569 | 9.3% |
| Kindergarten | 896 | 5.3% |
| Elementary School | 2,719 | 16.1% |
| Middle School | 2,488 | 14.8% |
| High School | 2,992 | 17.8% |
| College / Undergraduate | 3,699 | 22.0% |
| Graduate / Professional | 2,485 | 14.7% |
| Total | 16,848 | 100.0% |
School Enrollment by Age by Funding Source in Santa Monica
Out of a total of 16,848 students who are enrolled in schools in Santa Monica, 4,717 (28.0%) attend a private institution, while the remaining 12,131 (72.0%) are enrolled in public schools. The age group of 3 to 4 year olds has the highest likelihood of being enrolled in private schools, with 945 (73.2% in the age bracket) enrolled. Conversely, the age group of 18 to 19 year olds has the lowest likelihood of being enrolled in a private school, with 1,004 (91.9% in the age bracket) attending a public institution.
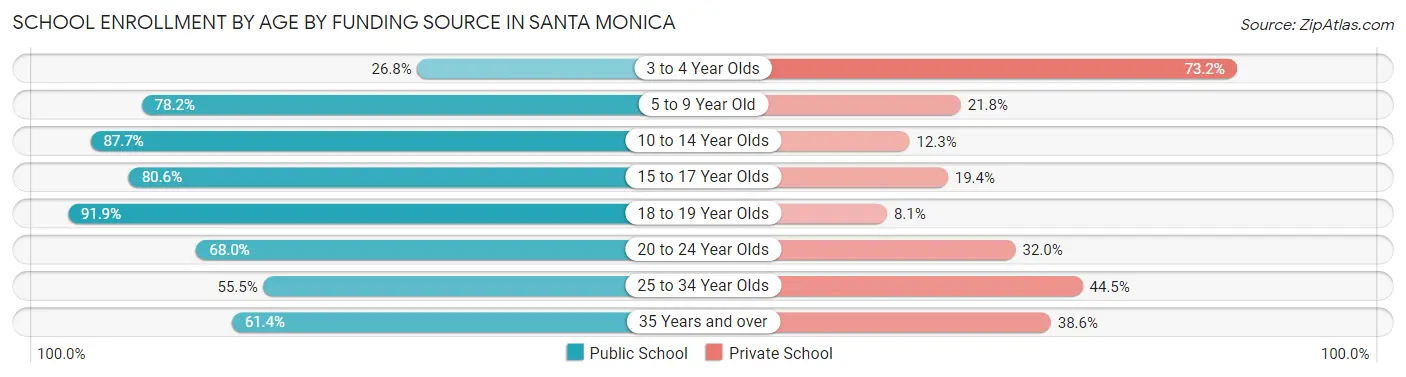
| Age Bracket | Public School | Private School |
| 3 to 4 Year Olds | 346 (26.8%) | 945 (73.2%) |
| 5 to 9 Year Old | 2,822 (78.2%) | 787 (21.8%) |
| 10 to 14 Year Olds | 3,047 (87.7%) | 426 (12.3%) |
| 15 to 17 Year Olds | 1,649 (80.6%) | 397 (19.4%) |
| 18 to 19 Year Olds | 1,004 (91.9%) | 88 (8.1%) |
| 20 to 24 Year Olds | 1,079 (68.0%) | 508 (32.0%) |
| 25 to 34 Year Olds | 1,126 (55.5%) | 903 (44.5%) |
| 35 Years and over | 1,057 (61.4%) | 664 (38.6%) |
| Total | 12,131 (72.0%) | 4,717 (28.0%) |
Educational Attainment by Field of Study in Santa Monica
Business (8,459 | 15.5%), social sciences (7,552 | 13.9%), visual & performing arts (5,781 | 10.6%), communications (4,307 | 7.9%), and literature & languages (4,082 | 7.5%) are the most common fields of study among 54,478 individuals in Santa Monica who have obtained a bachelor's degree or higher.
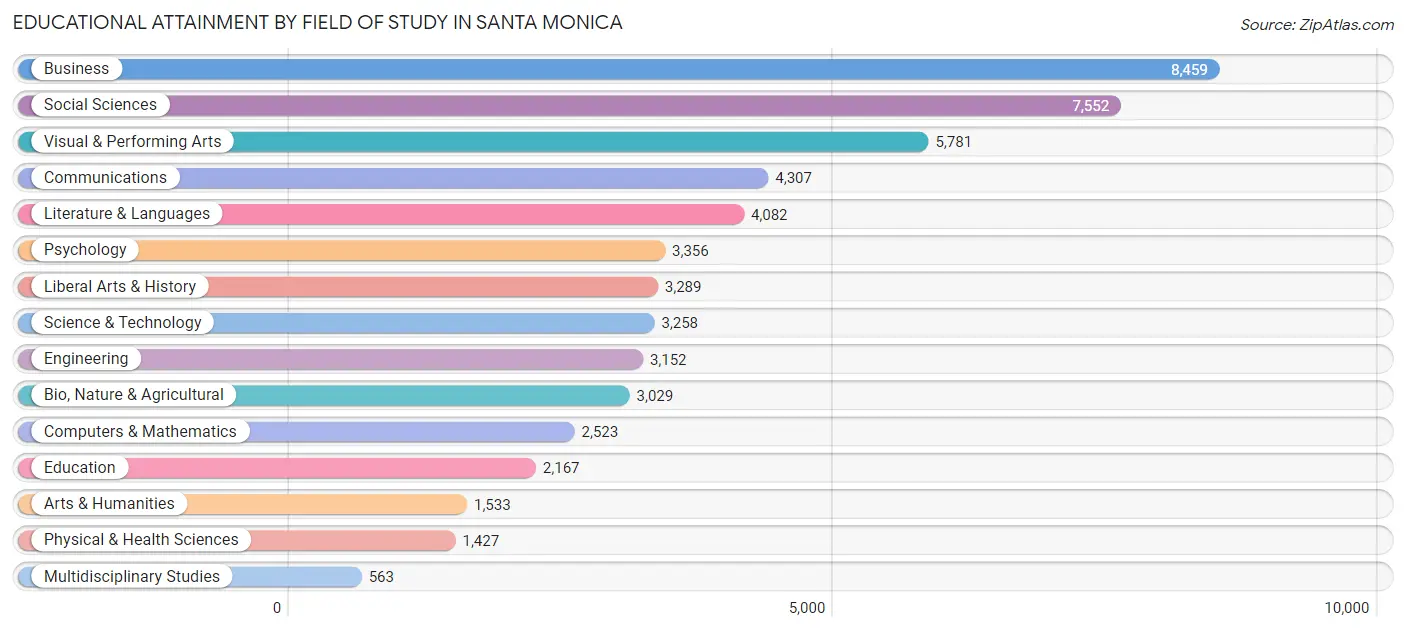
| Field of Study | # Graduates | % Graduates |
| Computers & Mathematics | 2,523 | 4.6% |
| Bio, Nature & Agricultural | 3,029 | 5.6% |
| Physical & Health Sciences | 1,427 | 2.6% |
| Psychology | 3,356 | 6.2% |
| Social Sciences | 7,552 | 13.9% |
| Engineering | 3,152 | 5.8% |
| Multidisciplinary Studies | 563 | 1.0% |
| Science & Technology | 3,258 | 6.0% |
| Business | 8,459 | 15.5% |
| Education | 2,167 | 4.0% |
| Literature & Languages | 4,082 | 7.5% |
| Liberal Arts & History | 3,289 | 6.0% |
| Visual & Performing Arts | 5,781 | 10.6% |
| Communications | 4,307 | 7.9% |
| Arts & Humanities | 1,533 | 2.8% |
| Total | 54,478 | 100.0% |
Transportation & Commute in Santa Monica
Vehicle Availability by Sex in Santa Monica
The most prevalent vehicle ownership categories in Santa Monica are males with 2 vehicles (10,554, accounting for 42.6%) and females with 2 vehicles (9,691, making up 43.3%).
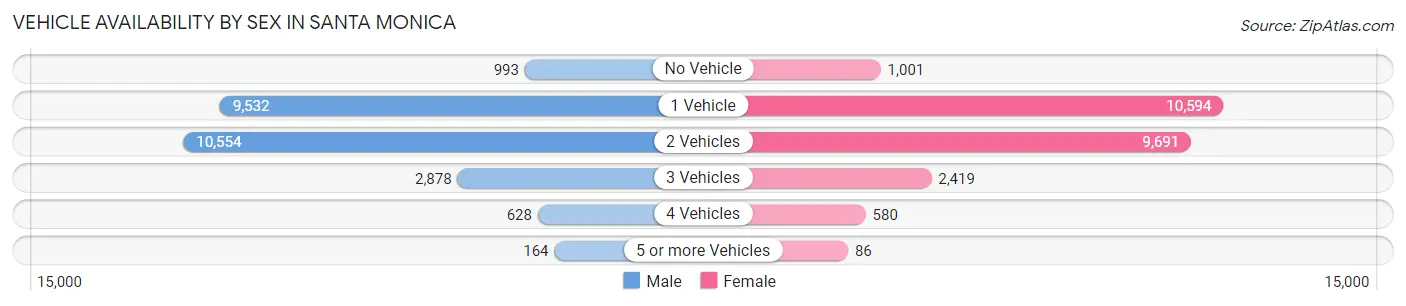
| Vehicles Available | Male | Female |
| No Vehicle | 993 (4.0%) | 1,001 (4.1%) |
| 1 Vehicle | 9,532 (38.5%) | 10,594 (43.5%) |
| 2 Vehicles | 10,554 (42.6%) | 9,691 (39.8%) |
| 3 Vehicles | 2,878 (11.6%) | 2,419 (9.9%) |
| 4 Vehicles | 628 (2.5%) | 580 (2.4%) |
| 5 or more Vehicles | 164 (0.7%) | 86 (0.4%) |
| Total | 24,749 (100.0%) | 24,371 (100.0%) |
Commute Time in Santa Monica
The most frequently occuring commute durations in Santa Monica are 15 to 19 minutes (5,529 commuters, 15.6%), 10 to 14 minutes (5,392 commuters, 15.2%), and 30 to 34 minutes (5,381 commuters, 15.2%).
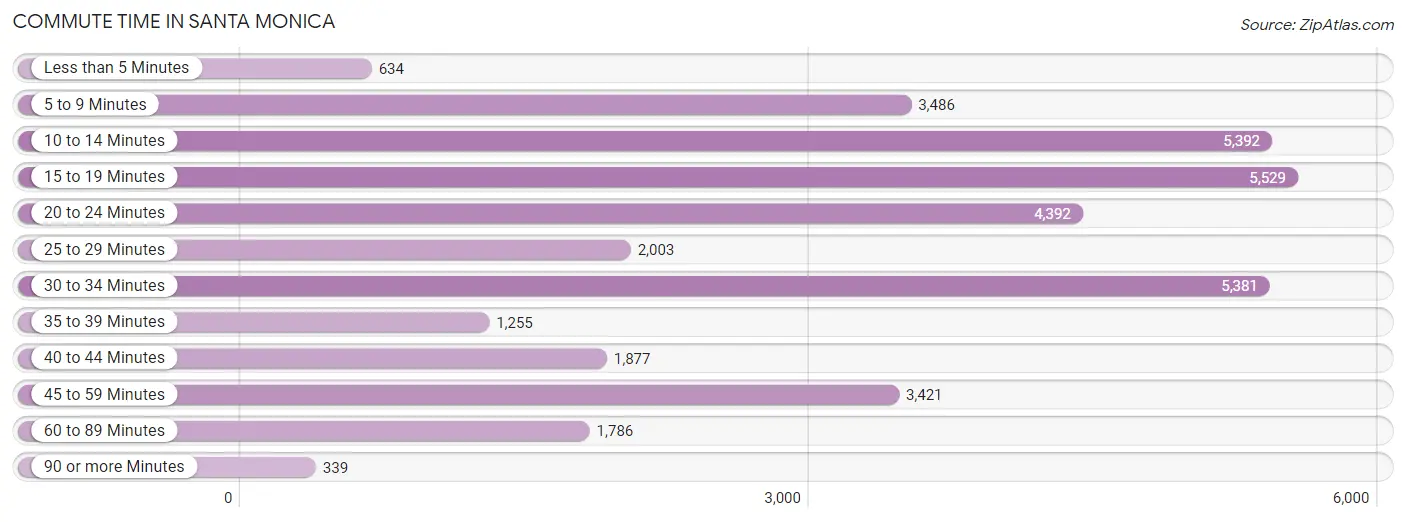
| Commute Time | # Commuters | % Commuters |
| Less than 5 Minutes | 634 | 1.8% |
| 5 to 9 Minutes | 3,486 | 9.8% |
| 10 to 14 Minutes | 5,392 | 15.2% |
| 15 to 19 Minutes | 5,529 | 15.6% |
| 20 to 24 Minutes | 4,392 | 12.4% |
| 25 to 29 Minutes | 2,003 | 5.6% |
| 30 to 34 Minutes | 5,381 | 15.2% |
| 35 to 39 Minutes | 1,255 | 3.5% |
| 40 to 44 Minutes | 1,877 | 5.3% |
| 45 to 59 Minutes | 3,421 | 9.6% |
| 60 to 89 Minutes | 1,786 | 5.0% |
| 90 or more Minutes | 339 | 1.0% |
Commute Time by Sex in Santa Monica
The most common commute times in Santa Monica are 30 to 34 minutes (3,028 commuters, 16.8%) for males and 10 to 14 minutes (3,047 commuters, 17.4%) for females.
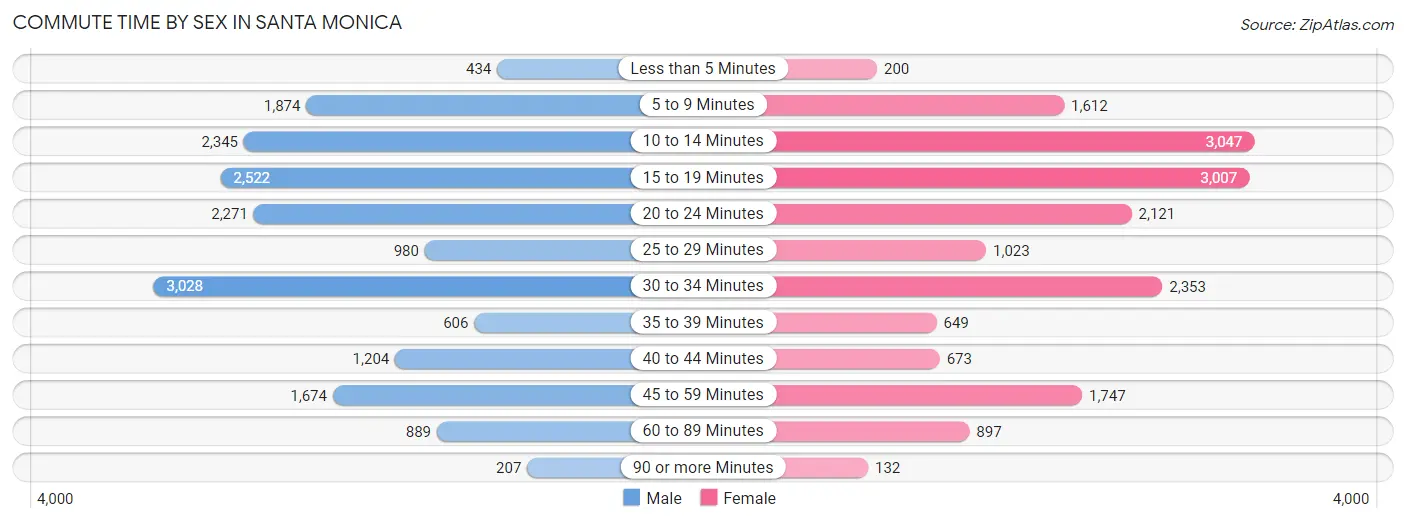
| Commute Time | Male | Female |
| Less than 5 Minutes | 434 (2.4%) | 200 (1.1%) |
| 5 to 9 Minutes | 1,874 (10.4%) | 1,612 (9.2%) |
| 10 to 14 Minutes | 2,345 (13.0%) | 3,047 (17.4%) |
| 15 to 19 Minutes | 2,522 (14.0%) | 3,007 (17.2%) |
| 20 to 24 Minutes | 2,271 (12.6%) | 2,121 (12.1%) |
| 25 to 29 Minutes | 980 (5.4%) | 1,023 (5.9%) |
| 30 to 34 Minutes | 3,028 (16.8%) | 2,353 (13.5%) |
| 35 to 39 Minutes | 606 (3.4%) | 649 (3.7%) |
| 40 to 44 Minutes | 1,204 (6.7%) | 673 (3.8%) |
| 45 to 59 Minutes | 1,674 (9.3%) | 1,747 (10.0%) |
| 60 to 89 Minutes | 889 (4.9%) | 897 (5.1%) |
| 90 or more Minutes | 207 (1.1%) | 132 (0.8%) |
Time of Departure to Work by Sex in Santa Monica
The most frequent times of departure to work in Santa Monica are 8:00 AM to 8:29 AM (3,359, 18.6%) for males and 8:30 AM to 8:59 AM (2,751, 15.8%) for females.
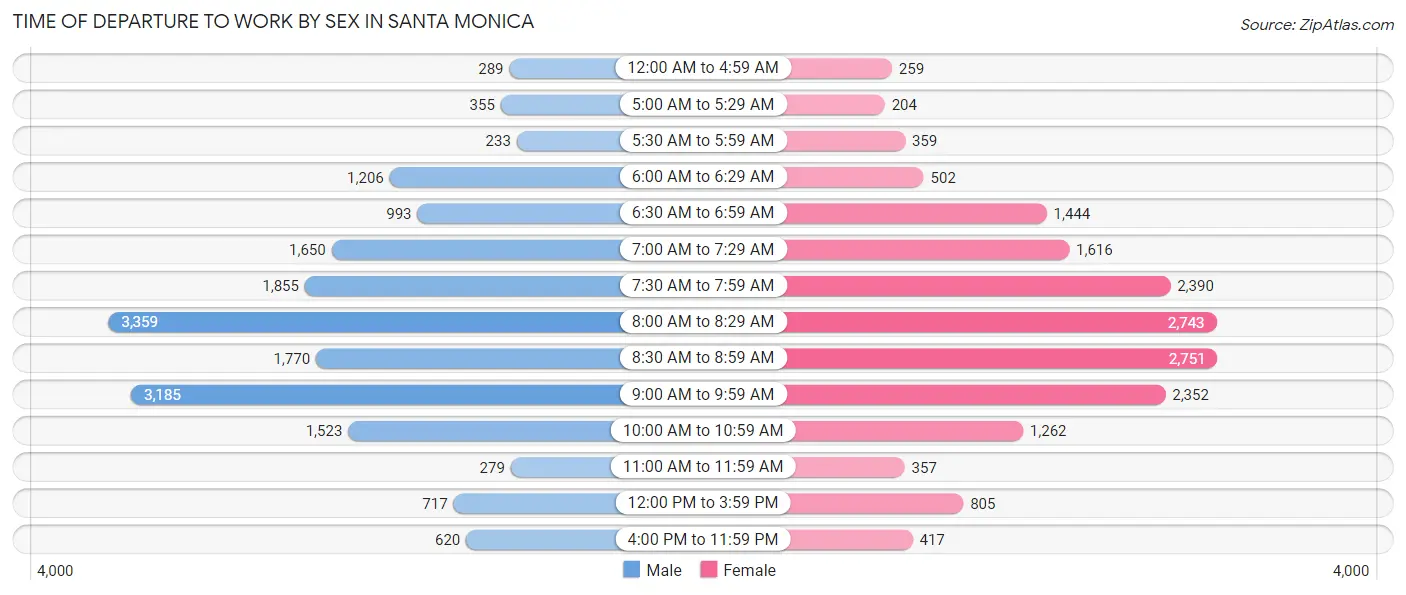
| Time of Departure | Male | Female |
| 12:00 AM to 4:59 AM | 289 (1.6%) | 259 (1.5%) |
| 5:00 AM to 5:29 AM | 355 (2.0%) | 204 (1.2%) |
| 5:30 AM to 5:59 AM | 233 (1.3%) | 359 (2.1%) |
| 6:00 AM to 6:29 AM | 1,206 (6.7%) | 502 (2.9%) |
| 6:30 AM to 6:59 AM | 993 (5.5%) | 1,444 (8.3%) |
| 7:00 AM to 7:29 AM | 1,650 (9.1%) | 1,616 (9.2%) |
| 7:30 AM to 7:59 AM | 1,855 (10.3%) | 2,390 (13.7%) |
| 8:00 AM to 8:29 AM | 3,359 (18.6%) | 2,743 (15.7%) |
| 8:30 AM to 8:59 AM | 1,770 (9.8%) | 2,751 (15.8%) |
| 9:00 AM to 9:59 AM | 3,185 (17.7%) | 2,352 (13.5%) |
| 10:00 AM to 10:59 AM | 1,523 (8.5%) | 1,262 (7.2%) |
| 11:00 AM to 11:59 AM | 279 (1.5%) | 357 (2.0%) |
| 12:00 PM to 3:59 PM | 717 (4.0%) | 805 (4.6%) |
| 4:00 PM to 11:59 PM | 620 (3.4%) | 417 (2.4%) |
| Total | 18,034 (100.0%) | 17,461 (100.0%) |
Housing Occupancy in Santa Monica
Occupancy by Ownership in Santa Monica
Of the total 46,207 dwellings in Santa Monica, owner-occupied units account for 13,367 (28.9%), while renter-occupied units make up 32,840 (71.1%).
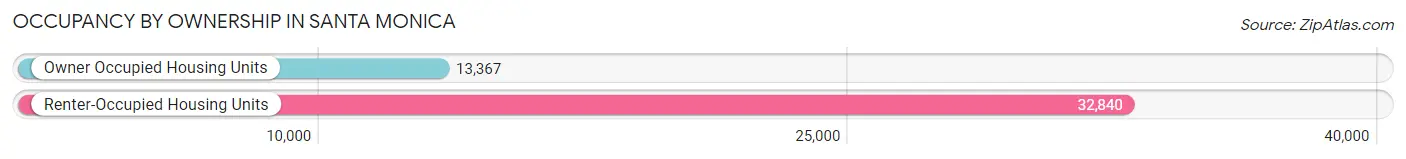
| Occupancy | # Housing Units | % Housing Units |
| Owner Occupied Housing Units | 13,367 | 28.9% |
| Renter-Occupied Housing Units | 32,840 | 71.1% |
| Total Occupied Housing Units | 46,207 | 100.0% |
Occupancy by Household Size in Santa Monica
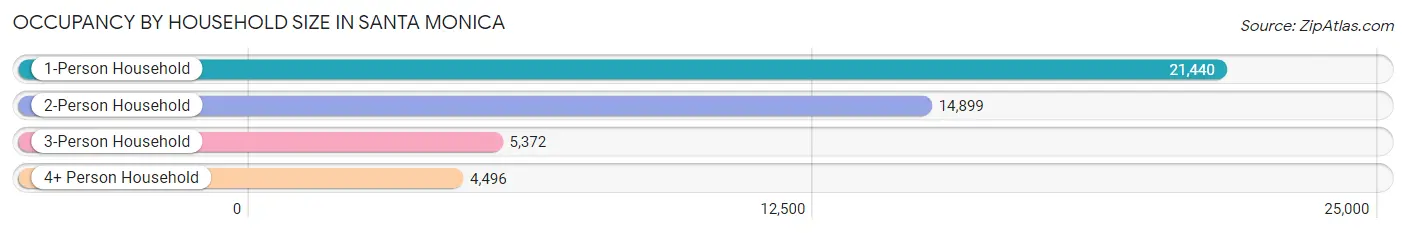
| Household Size | # Housing Units | % Housing Units |
| 1-Person Household | 21,440 | 46.4% |
| 2-Person Household | 14,899 | 32.2% |
| 3-Person Household | 5,372 | 11.6% |
| 4+ Person Household | 4,496 | 9.7% |
| Total Housing Units | 46,207 | 100.0% |
Occupancy by Ownership by Household Size in Santa Monica
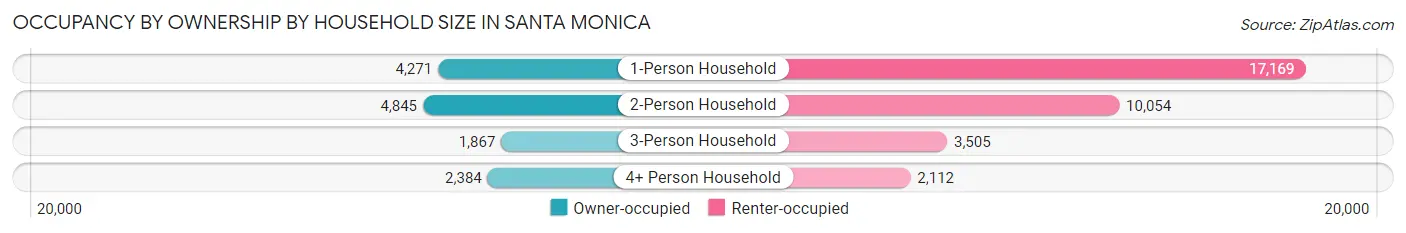
| Household Size | Owner-occupied | Renter-occupied |
| 1-Person Household | 4,271 (19.9%) | 17,169 (80.1%) |
| 2-Person Household | 4,845 (32.5%) | 10,054 (67.5%) |
| 3-Person Household | 1,867 (34.7%) | 3,505 (65.2%) |
| 4+ Person Household | 2,384 (53.0%) | 2,112 (47.0%) |
| Total Housing Units | 13,367 (28.9%) | 32,840 (71.1%) |
Occupancy by Educational Attainment in Santa Monica
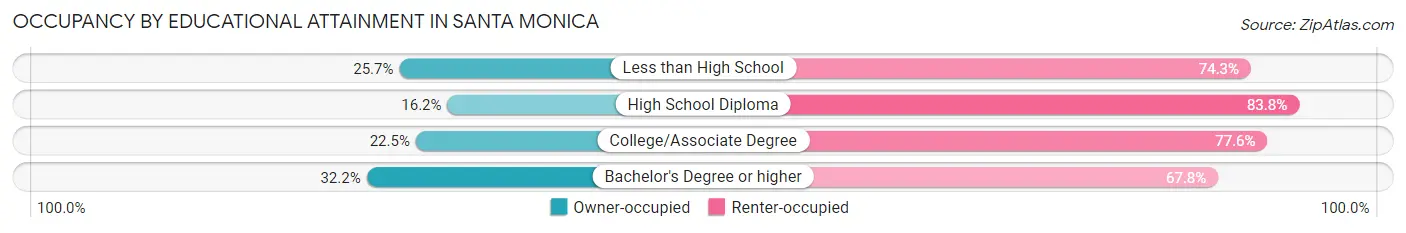
| Household Size | Owner-occupied | Renter-occupied |
| Less than High School | 430 (25.7%) | 1,242 (74.3%) |
| High School Diploma | 540 (16.2%) | 2,797 (83.8%) |
| College/Associate Degree | 2,017 (22.5%) | 6,969 (77.5%) |
| Bachelor's Degree or higher | 10,380 (32.2%) | 21,832 (67.8%) |
Occupancy by Age of Householder in Santa Monica
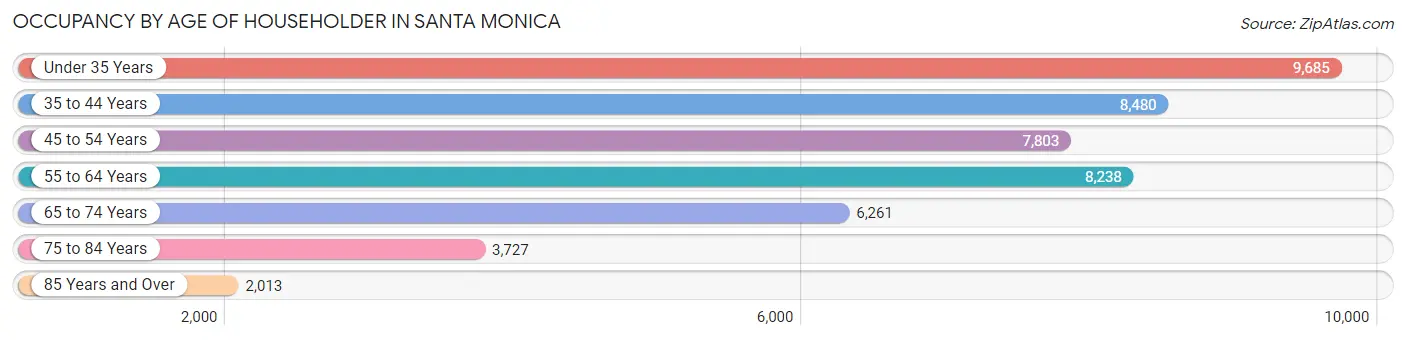
| Age Bracket | # Households | % Households |
| Under 35 Years | 9,685 | 21.0% |
| 35 to 44 Years | 8,480 | 18.3% |
| 45 to 54 Years | 7,803 | 16.9% |
| 55 to 64 Years | 8,238 | 17.8% |
| 65 to 74 Years | 6,261 | 13.6% |
| 75 to 84 Years | 3,727 | 8.1% |
| 85 Years and Over | 2,013 | 4.4% |
| Total | 46,207 | 100.0% |
Housing Finances in Santa Monica
Median Income by Occupancy in Santa Monica
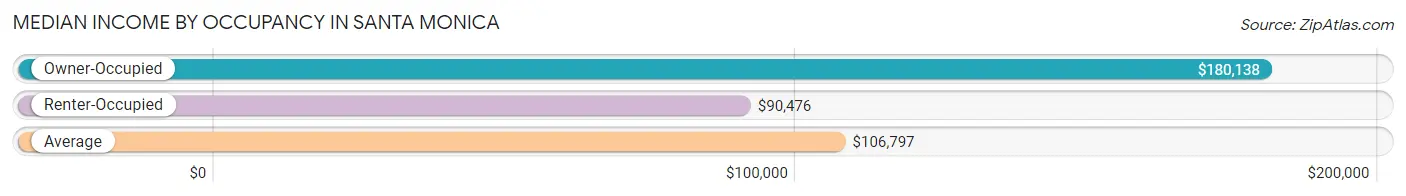
| Occupancy Type | # Households | Median Income |
| Owner-Occupied | 13,367 (28.9%) | $180,138 |
| Renter-Occupied | 32,840 (71.1%) | $90,476 |
| Average | 46,207 (100.0%) | $106,797 |
Occupancy by Householder Income Bracket in Santa Monica
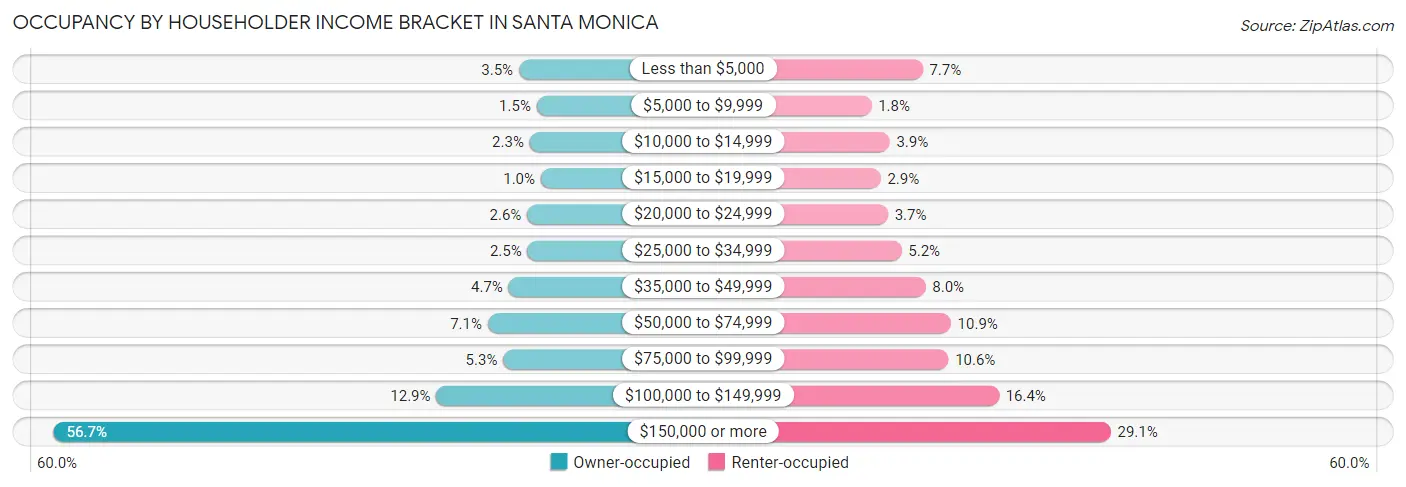
| Income Bracket | Owner-occupied | Renter-occupied |
| Less than $5,000 | 468 (3.5%) | 2,513 (7.6%) |
| $5,000 to $9,999 | 197 (1.5%) | 587 (1.8%) |
| $10,000 to $14,999 | 303 (2.3%) | 1,273 (3.9%) |
| $15,000 to $19,999 | 134 (1.0%) | 935 (2.9%) |
| $20,000 to $24,999 | 342 (2.6%) | 1,207 (3.7%) |
| $25,000 to $34,999 | 337 (2.5%) | 1,717 (5.2%) |
| $35,000 to $49,999 | 626 (4.7%) | 2,620 (8.0%) |
| $50,000 to $74,999 | 944 (7.1%) | 3,569 (10.9%) |
| $75,000 to $99,999 | 708 (5.3%) | 3,478 (10.6%) |
| $100,000 to $149,999 | 1,730 (12.9%) | 5,371 (16.4%) |
| $150,000 or more | 7,578 (56.7%) | 9,570 (29.1%) |
| Total | 13,367 (100.0%) | 32,840 (100.0%) |
Monthly Housing Cost Tiers in Santa Monica
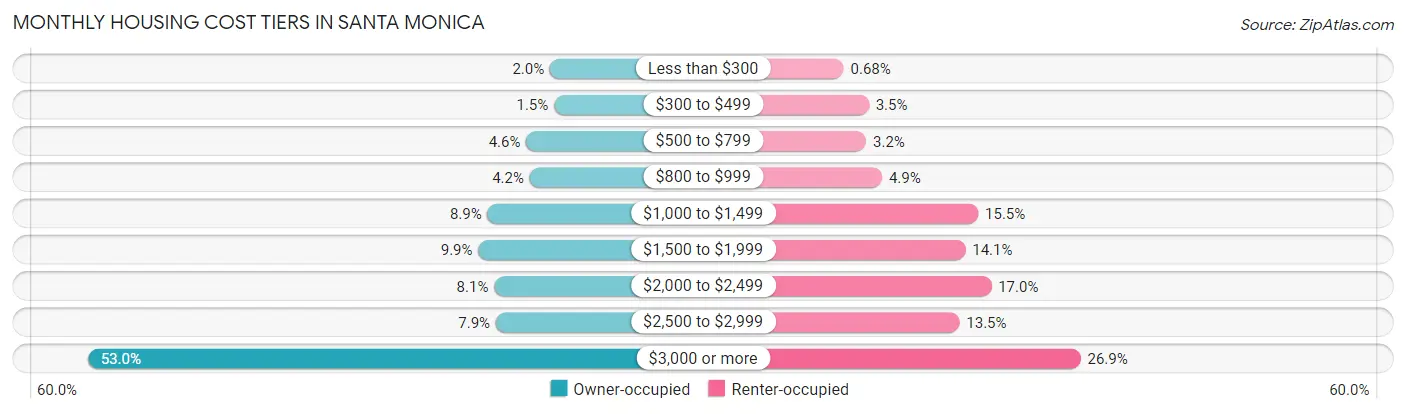
| Monthly Cost | Owner-occupied | Renter-occupied |
| Less than $300 | 260 (1.9%) | 223 (0.7%) |
| $300 to $499 | 200 (1.5%) | 1,137 (3.5%) |
| $500 to $799 | 612 (4.6%) | 1,042 (3.2%) |
| $800 to $999 | 560 (4.2%) | 1,616 (4.9%) |
| $1,000 to $1,499 | 1,184 (8.9%) | 5,103 (15.5%) |
| $1,500 to $1,999 | 1,319 (9.9%) | 4,641 (14.1%) |
| $2,000 to $2,499 | 1,085 (8.1%) | 5,581 (17.0%) |
| $2,500 to $2,999 | 1,060 (7.9%) | 4,422 (13.5%) |
| $3,000 or more | 7,087 (53.0%) | 8,822 (26.9%) |
| Total | 13,367 (100.0%) | 32,840 (100.0%) |
Physical Housing Characteristics in Santa Monica
Housing Structures in Santa Monica
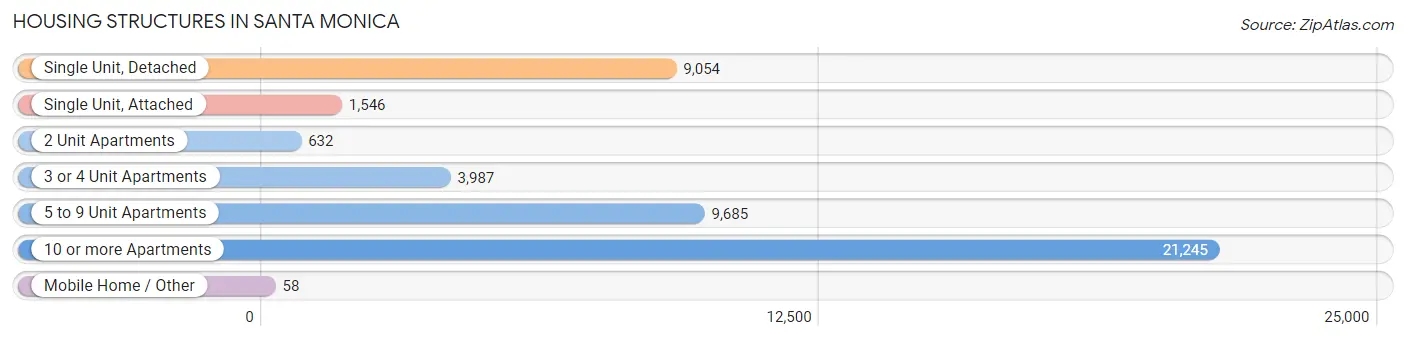
| Structure Type | # Housing Units | % Housing Units |
| Single Unit, Detached | 9,054 | 19.6% |
| Single Unit, Attached | 1,546 | 3.4% |
| 2 Unit Apartments | 632 | 1.4% |
| 3 or 4 Unit Apartments | 3,987 | 8.6% |
| 5 to 9 Unit Apartments | 9,685 | 21.0% |
| 10 or more Apartments | 21,245 | 46.0% |
| Mobile Home / Other | 58 | 0.1% |
| Total | 46,207 | 100.0% |
Housing Structures by Occupancy in Santa Monica
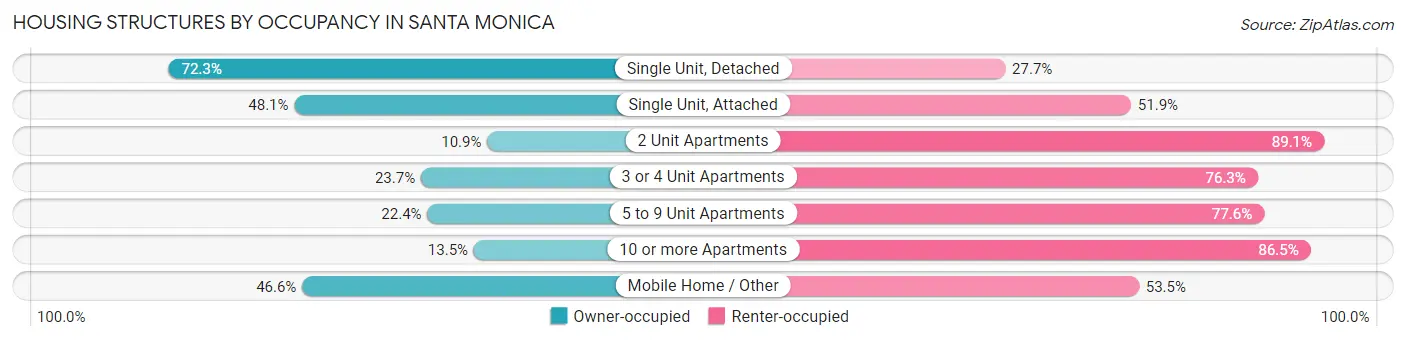
| Structure Type | Owner-occupied | Renter-occupied |
| Single Unit, Detached | 6,544 (72.3%) | 2,510 (27.7%) |
| Single Unit, Attached | 743 (48.1%) | 803 (51.9%) |
| 2 Unit Apartments | 69 (10.9%) | 563 (89.1%) |
| 3 or 4 Unit Apartments | 944 (23.7%) | 3,043 (76.3%) |
| 5 to 9 Unit Apartments | 2,173 (22.4%) | 7,512 (77.6%) |
| 10 or more Apartments | 2,867 (13.5%) | 18,378 (86.5%) |
| Mobile Home / Other | 27 (46.6%) | 31 (53.4%) |
| Total | 13,367 (28.9%) | 32,840 (71.1%) |
Housing Structures by Number of Rooms in Santa Monica
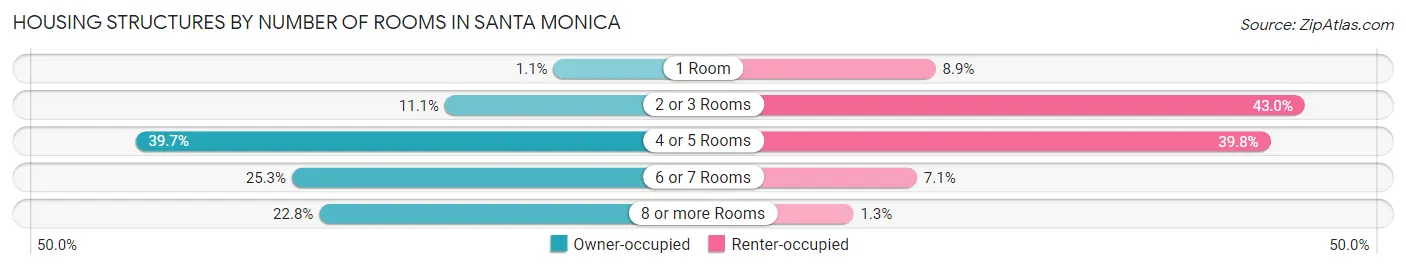
| Number of Rooms | Owner-occupied | Renter-occupied |
| 1 Room | 146 (1.1%) | 2,905 (8.8%) |
| 2 or 3 Rooms | 1,488 (11.1%) | 14,117 (43.0%) |
| 4 or 5 Rooms | 5,312 (39.7%) | 13,072 (39.8%) |
| 6 or 7 Rooms | 3,379 (25.3%) | 2,337 (7.1%) |
| 8 or more Rooms | 3,042 (22.8%) | 409 (1.3%) |
| Total | 13,367 (100.0%) | 32,840 (100.0%) |
Housing Structure by Heating Type in Santa Monica
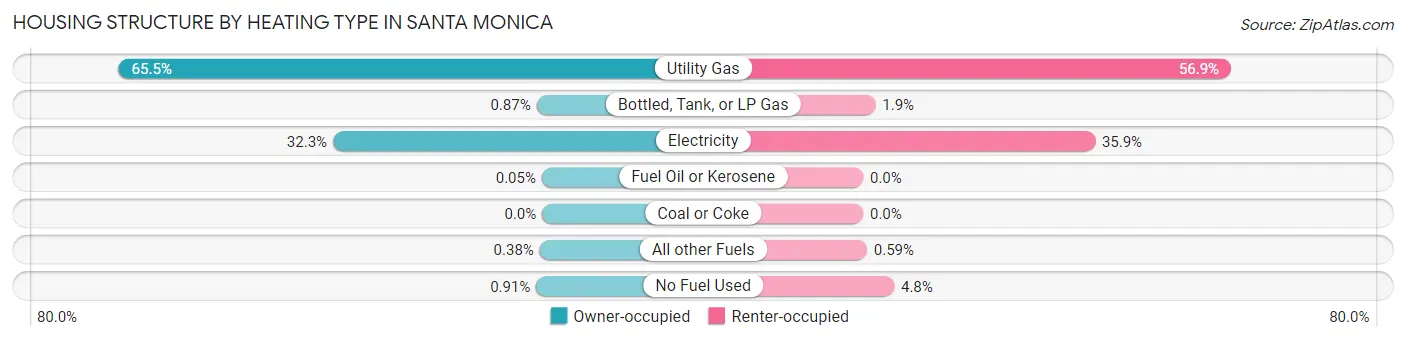
| Heating Type | Owner-occupied | Renter-occupied |
| Utility Gas | 8,749 (65.4%) | 18,676 (56.9%) |
| Bottled, Tank, or LP Gas | 116 (0.9%) | 623 (1.9%) |
| Electricity | 4,323 (32.3%) | 11,774 (35.8%) |
| Fuel Oil or Kerosene | 7 (0.1%) | 0 (0.0%) |
| Coal or Coke | 0 (0.0%) | 0 (0.0%) |
| All other Fuels | 51 (0.4%) | 193 (0.6%) |
| No Fuel Used | 121 (0.9%) | 1,574 (4.8%) |
| Total | 13,367 (100.0%) | 32,840 (100.0%) |
Household Vehicle Usage in Santa Monica
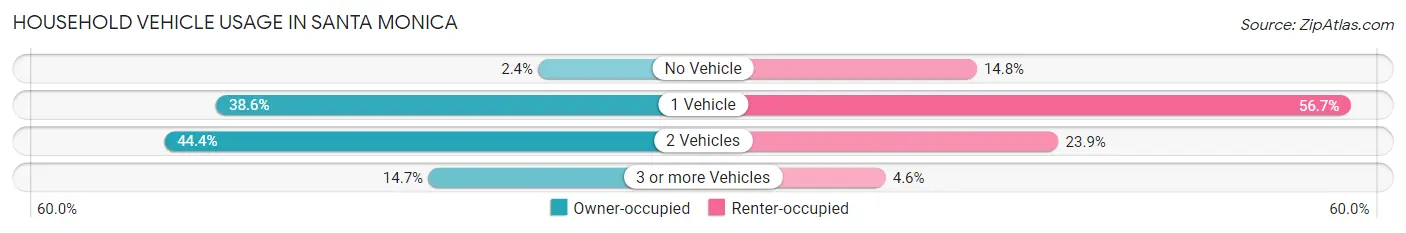
| Vehicles per Household | Owner-occupied | Renter-occupied |
| No Vehicle | 319 (2.4%) | 4,858 (14.8%) |
| 1 Vehicle | 5,153 (38.6%) | 18,617 (56.7%) |
| 2 Vehicles | 5,929 (44.4%) | 7,861 (23.9%) |
| 3 or more Vehicles | 1,966 (14.7%) | 1,504 (4.6%) |
| Total | 13,367 (100.0%) | 32,840 (100.0%) |
Real Estate & Mortgages in Santa Monica
Real Estate and Mortgage Overview in Santa Monica
| Characteristic | Without Mortgage | With Mortgage |
| Housing Units | 4,944 | 8,423 |
| Median Property Value | $1,576,000 | $1,710,900 |
| Median Household Income | $114,224 | $5,464 |
| Monthly Housing Costs | $1,419 | $6,562 |
| Real Estate Taxes | $8,818 | $126 |
Property Value by Mortgage Status in Santa Monica
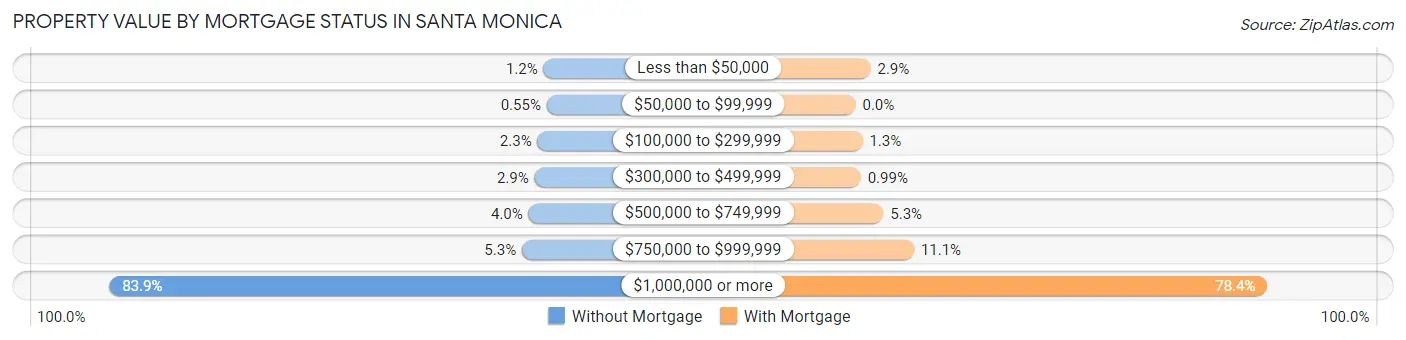
| Property Value | Without Mortgage | With Mortgage |
| Less than $50,000 | 57 (1.1%) | 240 (2.9%) |
| $50,000 to $99,999 | 27 (0.5%) | 0 (0.0%) |
| $100,000 to $299,999 | 114 (2.3%) | 110 (1.3%) |
| $300,000 to $499,999 | 141 (2.9%) | 83 (1.0%) |
| $500,000 to $749,999 | 198 (4.0%) | 446 (5.3%) |
| $750,000 to $999,999 | 260 (5.3%) | 937 (11.1%) |
| $1,000,000 or more | 4,147 (83.9%) | 6,607 (78.4%) |
| Total | 4,944 (100.0%) | 8,423 (100.0%) |
Household Income by Mortgage Status in Santa Monica
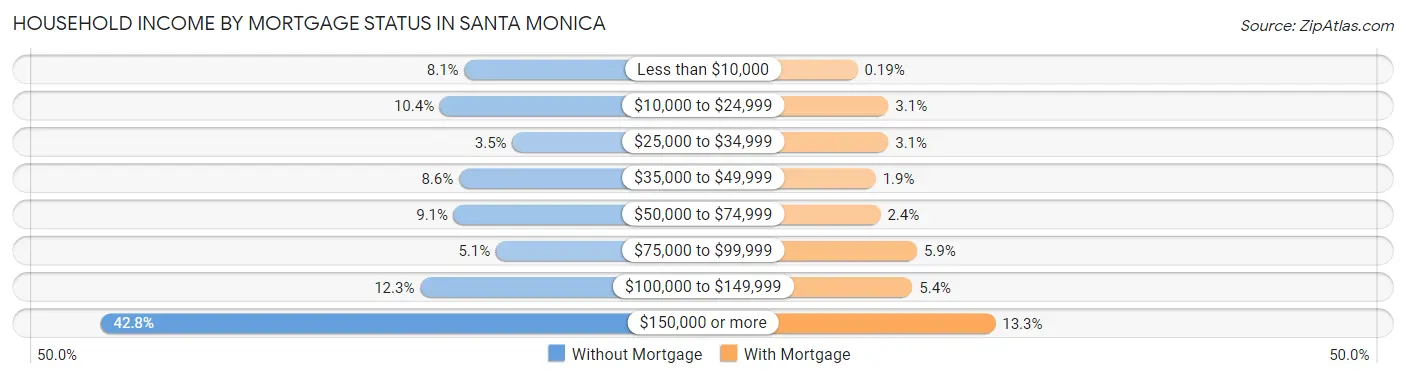
| Household Income | Without Mortgage | With Mortgage |
| Less than $10,000 | 401 (8.1%) | 16 (0.2%) |
| $10,000 to $24,999 | 516 (10.4%) | 264 (3.1%) |
| $25,000 to $34,999 | 175 (3.5%) | 263 (3.1%) |
| $35,000 to $49,999 | 426 (8.6%) | 162 (1.9%) |
| $50,000 to $74,999 | 451 (9.1%) | 200 (2.4%) |
| $75,000 to $99,999 | 252 (5.1%) | 493 (5.9%) |
| $100,000 to $149,999 | 609 (12.3%) | 456 (5.4%) |
| $150,000 or more | 2,114 (42.8%) | 1,121 (13.3%) |
| Total | 4,944 (100.0%) | 8,423 (100.0%) |
Property Value to Household Income Ratio in Santa Monica
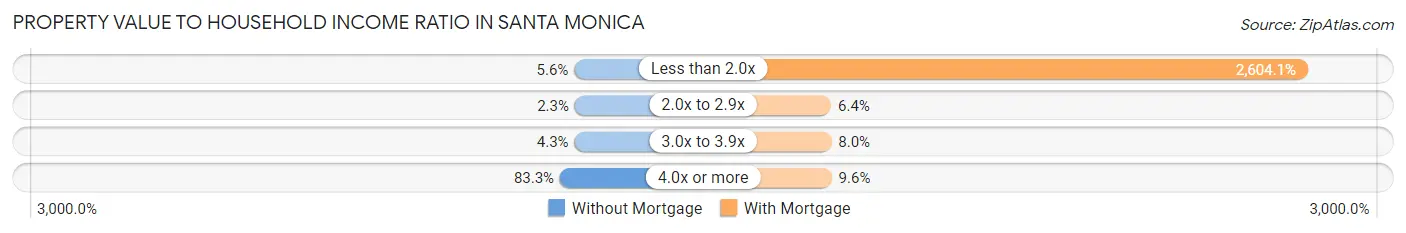
| Value-to-Income Ratio | Without Mortgage | With Mortgage |
| Less than 2.0x | 278 (5.6%) | 219,340 (2,604.1%) |
| 2.0x to 2.9x | 114 (2.3%) | 536 (6.4%) |
| 3.0x to 3.9x | 210 (4.3%) | 670 (8.0%) |
| 4.0x or more | 4,119 (83.3%) | 806 (9.6%) |
| Total | 4,944 (100.0%) | 8,423 (100.0%) |
Real Estate Taxes by Mortgage Status in Santa Monica
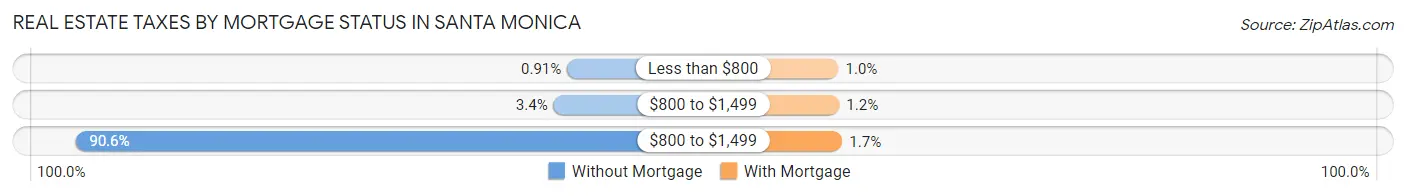
| Property Taxes | Without Mortgage | With Mortgage |
| Less than $800 | 45 (0.9%) | 85 (1.0%) |
| $800 to $1,499 | 168 (3.4%) | 98 (1.2%) |
| $800 to $1,499 | 4,477 (90.5%) | 144 (1.7%) |
| Total | 4,944 (100.0%) | 8,423 (100.0%) |
Health & Disability in Santa Monica
Health Insurance Coverage by Age in Santa Monica
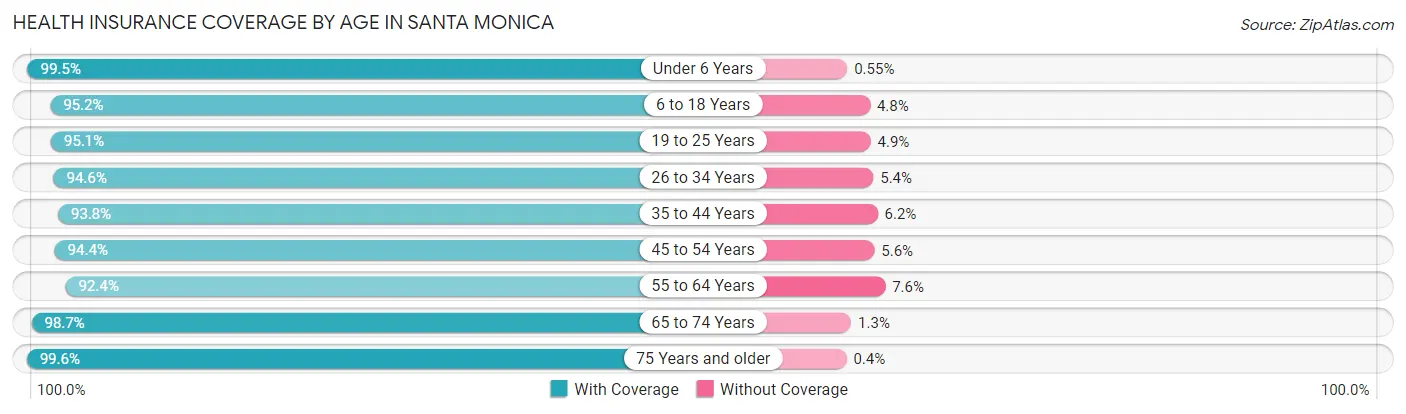
| Age Bracket | With Coverage | Without Coverage |
| Under 6 Years | 5,042 (99.5%) | 28 (0.5%) |
| 6 to 18 Years | 8,908 (95.2%) | 447 (4.8%) |
| 19 to 25 Years | 5,198 (95.1%) | 268 (4.9%) |
| 26 to 34 Years | 15,011 (94.6%) | 858 (5.4%) |
| 35 to 44 Years | 13,000 (93.8%) | 861 (6.2%) |
| 45 to 54 Years | 11,600 (94.4%) | 689 (5.6%) |
| 55 to 64 Years | 11,606 (92.4%) | 959 (7.6%) |
| 65 to 74 Years | 8,899 (98.7%) | 115 (1.3%) |
| 75 Years and older | 7,676 (99.6%) | 31 (0.4%) |
| Total | 86,940 (95.3%) | 4,256 (4.7%) |
Health Insurance Coverage by Citizenship Status in Santa Monica
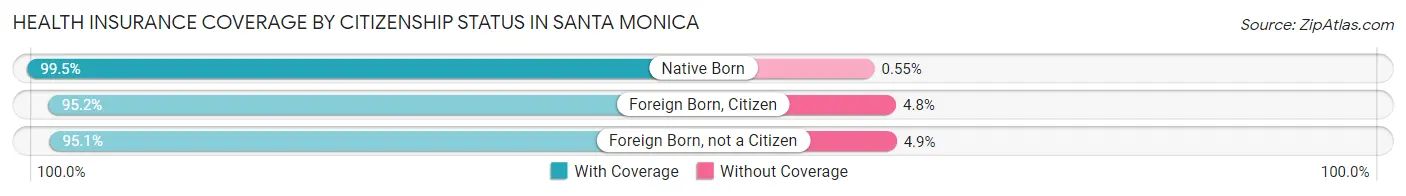
| Citizenship Status | With Coverage | Without Coverage |
| Native Born | 5,042 (99.5%) | 28 (0.5%) |
| Foreign Born, Citizen | 8,908 (95.2%) | 447 (4.8%) |
| Foreign Born, not a Citizen | 5,198 (95.1%) | 268 (4.9%) |
Health Insurance Coverage by Household Income in Santa Monica
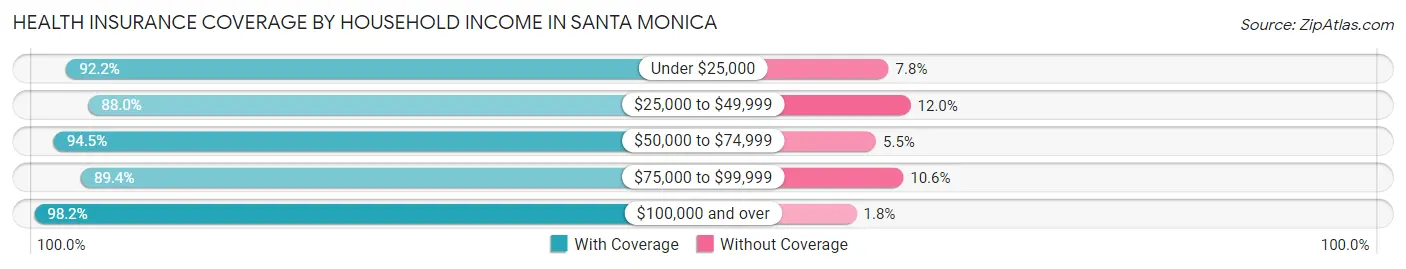
| Household Income | With Coverage | Without Coverage |
| Under $25,000 | 9,671 (92.2%) | 823 (7.8%) |
| $25,000 to $49,999 | 7,959 (88.0%) | 1,081 (12.0%) |
| $50,000 to $74,999 | 8,278 (94.5%) | 481 (5.5%) |
| $75,000 to $99,999 | 7,114 (89.4%) | 842 (10.6%) |
| $100,000 and over | 52,797 (98.2%) | 986 (1.8%) |
Public vs Private Health Insurance Coverage by Age in Santa Monica
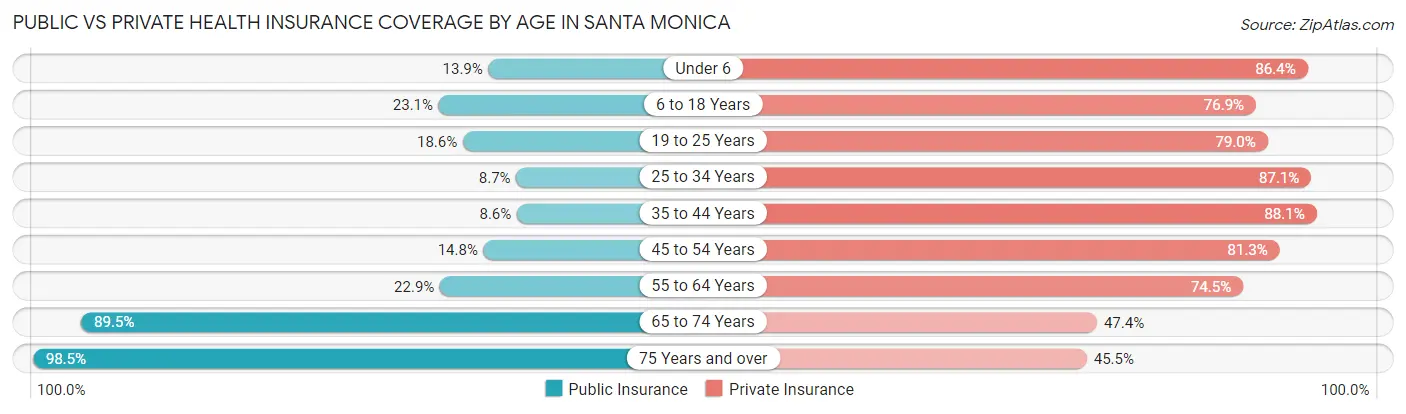
| Age Bracket | Public Insurance | Private Insurance |
| Under 6 | 703 (13.9%) | 4,382 (86.4%) |
| 6 to 18 Years | 2,162 (23.1%) | 7,190 (76.9%) |
| 19 to 25 Years | 1,018 (18.6%) | 4,320 (79.0%) |
| 25 to 34 Years | 1,382 (8.7%) | 13,824 (87.1%) |
| 35 to 44 Years | 1,189 (8.6%) | 12,212 (88.1%) |
| 45 to 54 Years | 1,816 (14.8%) | 9,986 (81.3%) |
| 55 to 64 Years | 2,873 (22.9%) | 9,357 (74.5%) |
| 65 to 74 Years | 8,069 (89.5%) | 4,270 (47.4%) |
| 75 Years and over | 7,589 (98.5%) | 3,505 (45.5%) |
| Total | 26,801 (29.4%) | 69,046 (75.7%) |
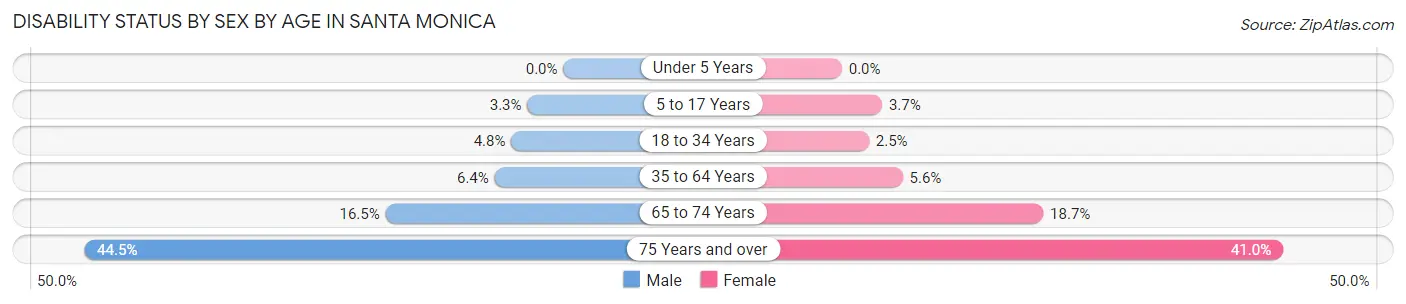
Disability Status by Sex by Age in Santa Monica
| Age Bracket | Male | Female |
| Under 5 Years | 0 (0.0%) | 0 (0.0%) |
| 5 to 17 Years | 180 (3.3%) | 153 (3.7%) |
| 18 to 34 Years | 512 (4.8%) | 285 (2.5%) |
| 35 to 64 Years | 1,236 (6.4%) | 1,090 (5.6%) |
| 65 to 74 Years | 724 (16.5%) | 865 (18.7%) |
| 75 Years and over | 1,379 (44.5%) | 1,886 (40.9%) |
Disability Class by Sex by Age in Santa Monica
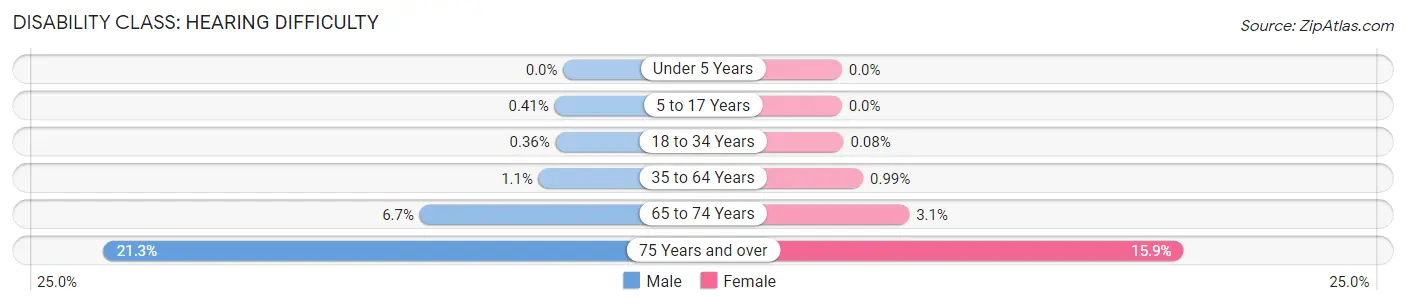
Disability Class: Hearing Difficulty
| Age Bracket | Male | Female |
| Under 5 Years | 0 (0.0%) | 0 (0.0%) |
| 5 to 17 Years | 22 (0.4%) | 0 (0.0%) |
| 18 to 34 Years | 38 (0.4%) | 9 (0.1%) |
| 35 to 64 Years | 221 (1.1%) | 191 (1.0%) |
| 65 to 74 Years | 292 (6.7%) | 145 (3.1%) |
| 75 Years and over | 661 (21.3%) | 730 (15.9%) |
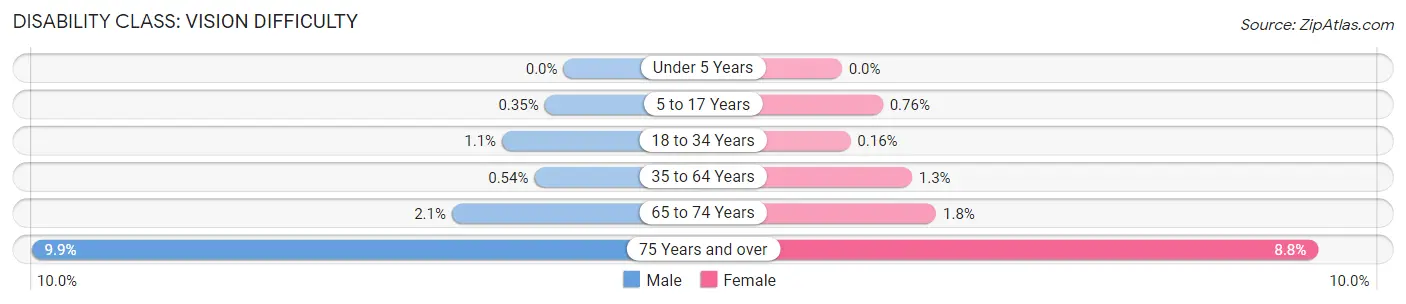
Disability Class: Vision Difficulty
| Age Bracket | Male | Female |
| Under 5 Years | 0 (0.0%) | 0 (0.0%) |
| 5 to 17 Years | 19 (0.4%) | 31 (0.8%) |
| 18 to 34 Years | 121 (1.1%) | 18 (0.2%) |
| 35 to 64 Years | 104 (0.5%) | 251 (1.3%) |
| 65 to 74 Years | 91 (2.1%) | 81 (1.8%) |
| 75 Years and over | 306 (9.9%) | 407 (8.8%) |
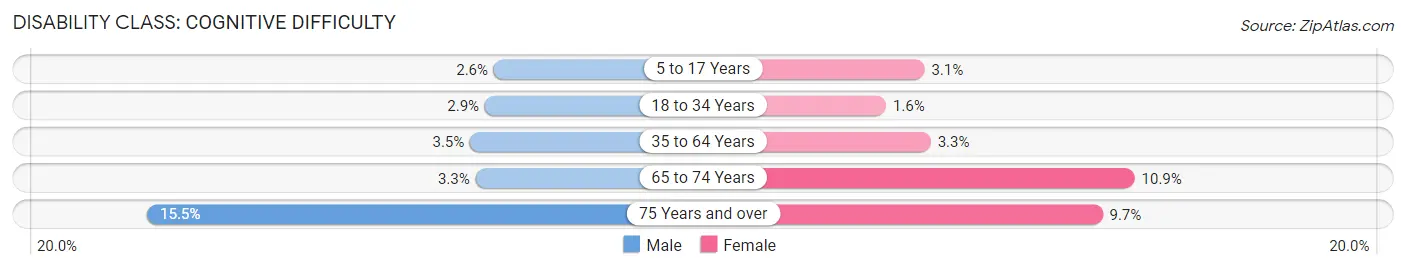
Disability Class: Cognitive Difficulty
| Age Bracket | Male | Female |
| 5 to 17 Years | 139 (2.6%) | 126 (3.1%) |
| 18 to 34 Years | 308 (2.9%) | 187 (1.6%) |
| 35 to 64 Years | 670 (3.5%) | 638 (3.3%) |
| 65 to 74 Years | 143 (3.3%) | 503 (10.9%) |
| 75 Years and over | 479 (15.4%) | 446 (9.7%) |
Disability Class: Ambulatory Difficulty
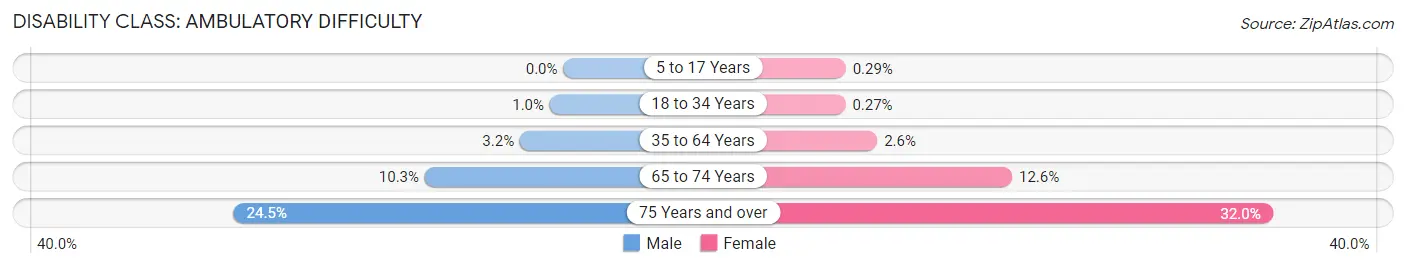
| Age Bracket | Male | Female |
| 5 to 17 Years | 0 (0.0%) | 12 (0.3%) |
| 18 to 34 Years | 106 (1.0%) | 31 (0.3%) |
| 35 to 64 Years | 623 (3.2%) | 508 (2.6%) |
| 65 to 74 Years | 451 (10.3%) | 585 (12.6%) |
| 75 Years and over | 759 (24.5%) | 1,473 (32.0%) |
Disability Class: Self-Care Difficulty
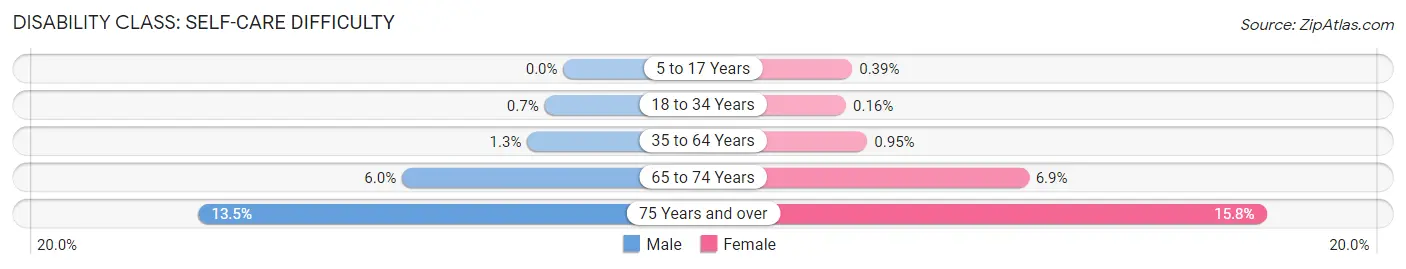
| Age Bracket | Male | Female |
| 5 to 17 Years | 0 (0.0%) | 16 (0.4%) |
| 18 to 34 Years | 74 (0.7%) | 18 (0.2%) |
| 35 to 64 Years | 259 (1.3%) | 183 (0.9%) |
| 65 to 74 Years | 263 (6.0%) | 321 (6.9%) |
| 75 Years and over | 420 (13.5%) | 726 (15.8%) |
Technology Access in Santa Monica
Computing Device Access in Santa Monica
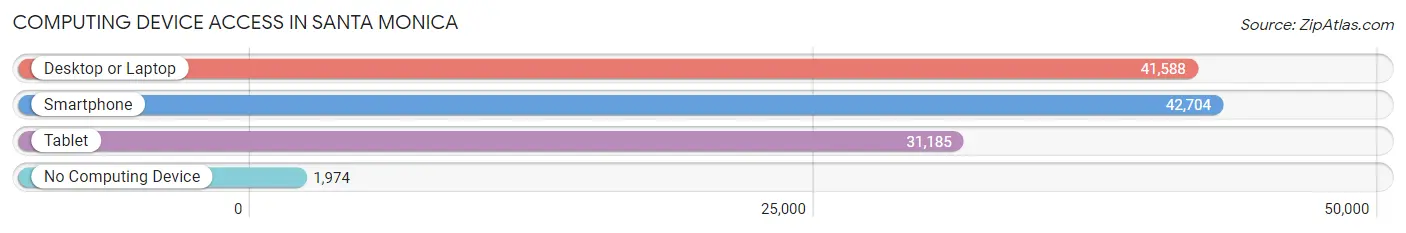
| Device Type | # Households | % Households |
| Desktop or Laptop | 41,588 | 90.0% |
| Smartphone | 42,704 | 92.4% |
| Tablet | 31,185 | 67.5% |
| No Computing Device | 1,974 | 4.3% |
| Total | 46,207 | 100.0% |
Internet Access in Santa Monica
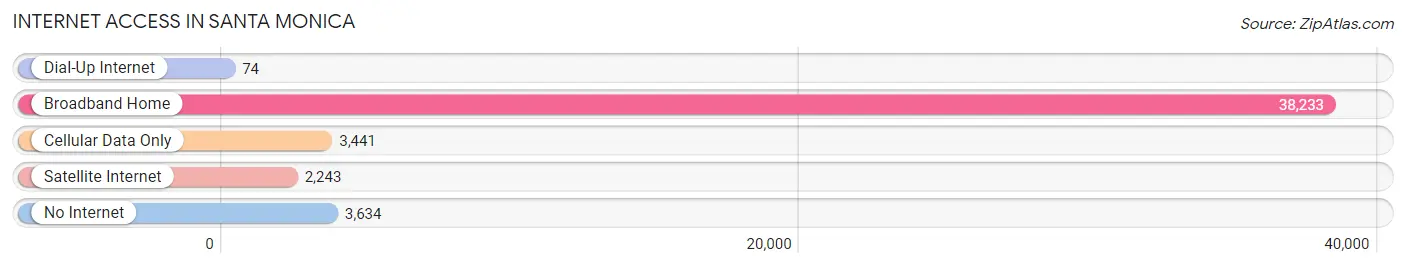
| Internet Type | # Households | % Households |
| Dial-Up Internet | 74 | 0.2% |
| Broadband Home | 38,233 | 82.7% |
| Cellular Data Only | 3,441 | 7.4% |
| Satellite Internet | 2,243 | 4.9% |
| No Internet | 3,634 | 7.9% |
| Total | 46,207 | 100.0% |
Santa Monica Summary
Introduction
Santa Monica is a coastal city located in western Los Angeles County, California. It is bordered by the Pacific Ocean to the south, Pacific Palisades to the north, Brentwood to the northeast, West Los Angeles to the east, Mar Vista to the southeast, and Venice to the northwest. Santa Monica is known for its beautiful beaches, its iconic pier, and its vibrant downtown. It is also home to a diverse population, with a mix of cultures and lifestyles.
History
Santa Monica was originally inhabited by the Tongva people, who were the original inhabitants of the Los Angeles Basin. The area was first explored by Spanish explorer Gaspar de Portola in 1769. In 1875, the area was incorporated as the City of Santa Monica. The city was named after the Catholic Saint Monica, the mother of Saint Augustine.
In the late 19th century, Santa Monica became a popular beach destination for wealthy Angelenos. The city was also home to a number of prominent figures, including the Wright Brothers, who built their first airplane in Santa Monica in 1909.
In the early 20th century, Santa Monica became a popular tourist destination, with the opening of the Santa Monica Pier in 1909. The pier was a popular spot for fishing, swimming, and other activities. In the 1920s, the city was home to a number of movie studios, including Metro-Goldwyn-Mayer and Paramount Pictures.
Geography
Santa Monica is located on the Pacific Coast of California, about 20 miles west of downtown Los Angeles. The city is bordered by the Pacific Ocean to the south, Pacific Palisades to the north, Brentwood to the northeast, West Los Angeles to the east, Mar Vista to the southeast, and Venice to the northwest.
The city has a total area of 8.3 square miles, with 6.2 square miles of land and 2.1 square miles of water. The city is located on a flat coastal plain, with the Santa Monica Mountains to the north and the Pacific Ocean to the south.
Economy
Santa Monica is a major economic center in the Los Angeles area. The city is home to a number of major companies, including Google, Yahoo, and Microsoft. The city is also home to a number of media companies, including Lionsgate Films, Universal Music Group, and Sony Pictures Entertainment.
The city is also home to a number of educational institutions, including Santa Monica College, the University of California, Los Angeles, and the University of Southern California.
Demographics
As of the 2010 census, Santa Monica had a population of 89,736. The racial makeup of the city was 68.2% White, 11.2% African American, 0.7% Native American, 11.2% Asian, 0.2% Pacific Islander, 4.7% from other races, and 4.0% from two or more races. Hispanic or Latino of any race were 18.2% of the population.
The median income for a household in the city was $62,837, and the median income for a family was $77,898. The per capita income for the city was $41,945.
Conclusion
Santa Monica is a vibrant coastal city located in western Los Angeles County, California. It is known for its beautiful beaches, its iconic pier, and its vibrant downtown. The city has a diverse population, with a mix of cultures and lifestyles. Santa Monica is a major economic center in the Los Angeles area, with a number of major companies and educational institutions. The city has a population of 89,736, with a median income of $62,837 for a household and $77,898 for a family.
Common Questions
What is Per Capita Income in Santa Monica?
Per Capita income in Santa Monica is $86,888.
What is the Median Family Income in Santa Monica?
Median Family Income in Santa Monica is $149,046.
What is the Median Household income in Santa Monica?
Median Household Income in Santa Monica is $106,797.
What is Income or Wage Gap in Santa Monica?
Income or Wage Gap in Santa Monica is 22.4%.
Women in Santa Monica earn 77.6 cents for every dollar earned by a man.
What is Family Income Deficit in Santa Monica?
Family Income Deficit in Santa Monica is $10,388.
Families that are below poverty line in Santa Monica earn $10,388 less on average than the poverty threshold level.
What is Inequality or Gini Index in Santa Monica?
Inequality or Gini Index in Santa Monica is 0.56.
What is the Total Population of Santa Monica?
Total Population of Santa Monica is 92,168.
What is the Total Male Population of Santa Monica?
Total Male Population of Santa Monica is 45,563.
What is the Total Female Population of Santa Monica?
Total Female Population of Santa Monica is 46,605.
What is the Ratio of Males per 100 Females in Santa Monica?
There are 97.76 Males per 100 Females in Santa Monica.
What is the Ratio of Females per 100 Males in Santa Monica?
There are 102.29 Females per 100 Males in Santa Monica.
What is the Median Population Age in Santa Monica?
Median Population Age in Santa Monica is 42.1 Years.
What is the Average Family Size in Santa Monica
Average Family Size in Santa Monica is 2.9 People.
What is the Average Household Size in Santa Monica
Average Household Size in Santa Monica is 1.9 People.
How Large is the Labor Force in Santa Monica?
There are 53,658 People in the Labor Forcein in Santa Monica.
What is the Percentage of People in the Labor Force in Santa Monica?
67.4% of People are in the Labor Force in Santa Monica.
What is the Unemployment Rate in Santa Monica?
Unemployment Rate in Santa Monica is 6.2%.