Cities with the Highest Percentage of Population Employed in Legal Services & Support in South Dakota
RELATED REPORTS & OPTIONS
Legal Services & Support
South Dakota
Compare Cities
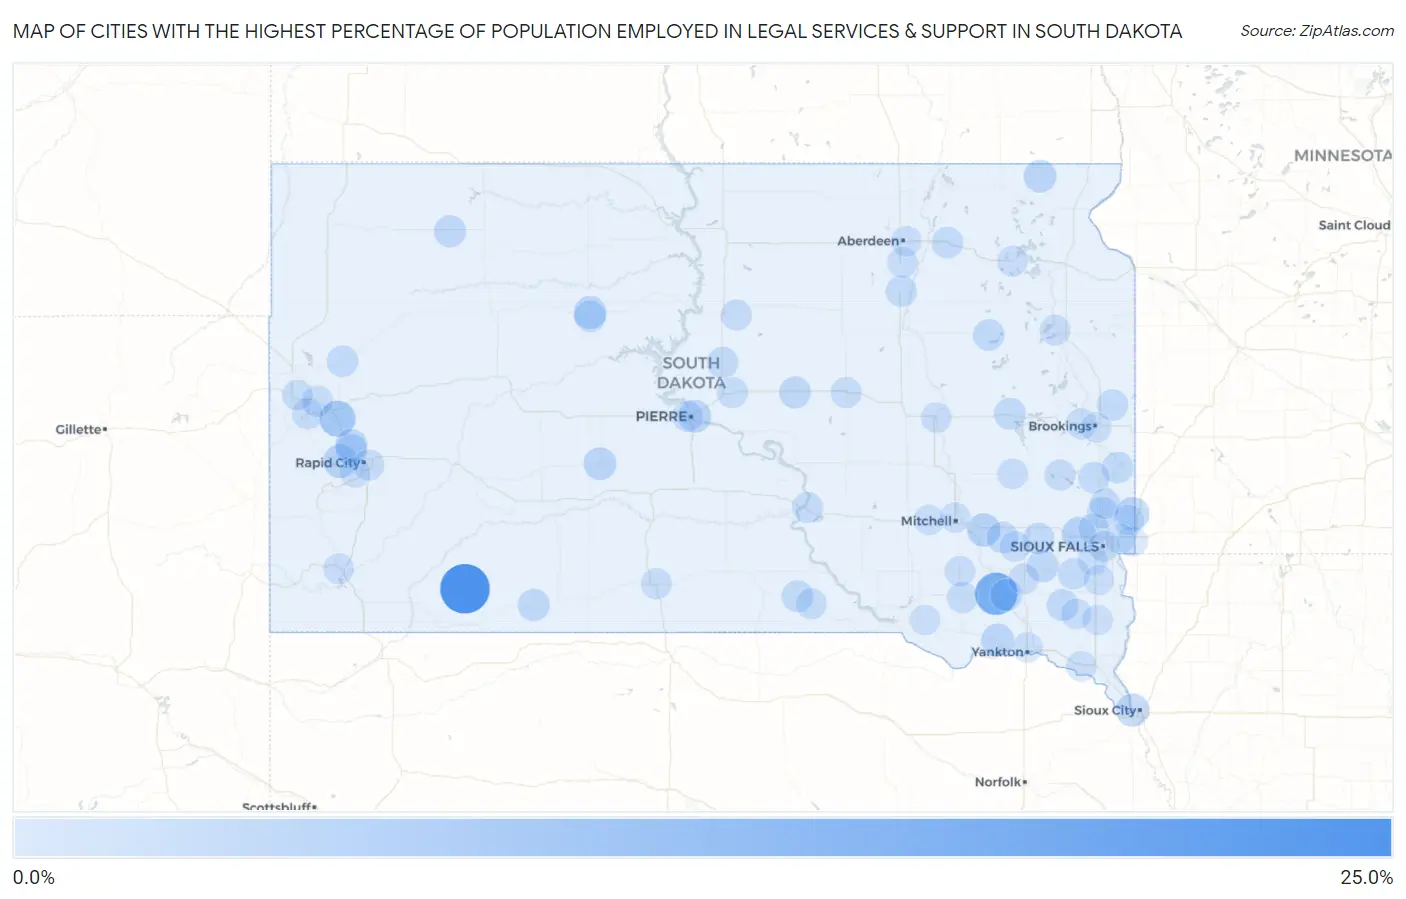
Map of Cities with the Highest Percentage of Population Employed in Legal Services & Support in South Dakota
0.0%
25.0%
Cities with the Highest Percentage of Population Employed in Legal Services & Support in South Dakota
| City | % Employed | vs State | vs National | |
| 1. | Porcupine | 23.0% | 0.65%(+22.3)#1 | 1.2%(+21.8)#44 |
| 2. | Prairiewood | 16.0% | 0.65%(+15.4)#2 | 1.2%(+14.8)#91 |
| 3. | Olivet | 14.3% | 0.65%(+13.6)#3 | 1.2%(+13.1)#116 |
| 4. | Blucksberg Mountain | 6.7% | 0.65%(+6.04)#4 | 1.2%(+5.50)#476 |
| 5. | Johnson Siding | 3.7% | 0.65%(+3.10)#5 | 1.2%(+2.57)#1,353 |
| 6. | Alexandria | 3.7% | 0.65%(+3.02)#6 | 1.2%(+2.49)#1,421 |
| 7. | Hartford | 3.7% | 0.65%(+3.00)#7 | 1.2%(+2.47)#1,430 |
| 8. | Sherman | 3.6% | 0.65%(+2.92)#8 | 1.2%(+2.39)#1,484 |
| 9. | Dakota Dunes | 3.3% | 0.65%(+2.66)#9 | 1.2%(+2.13)#1,676 |
| 10. | North Eagle Butte | 3.1% | 0.65%(+2.41)#10 | 1.2%(+1.88)#1,864 |
| 11. | Veblen | 2.9% | 0.65%(+2.28)#11 | 1.2%(+1.74)#2,012 |
| 12. | Tabor | 2.9% | 0.65%(+2.22)#12 | 1.2%(+1.69)#2,050 |
| 13. | Midland | 2.8% | 0.65%(+2.17)#13 | 1.2%(+1.63)#2,111 |
| 14. | Pierre | 2.8% | 0.65%(+2.14)#14 | 1.2%(+1.61)#2,136 |
| 15. | Bison | 2.2% | 0.65%(+1.60)#15 | 1.2%(+1.06)#2,807 |
| 16. | Menno | 2.2% | 0.65%(+1.58)#16 | 1.2%(+1.04)#2,831 |
| 17. | Martin | 2.2% | 0.65%(+1.55)#17 | 1.2%(+1.02)#2,868 |
| 18. | Marion | 2.2% | 0.65%(+1.51)#18 | 1.2%(+0.971)#2,951 |
| 19. | Blackhawk | 2.0% | 0.65%(+1.36)#19 | 1.2%(+0.821)#3,207 |
| 20. | Highmore | 2.0% | 0.65%(+1.36)#20 | 1.2%(+0.821)#3,208 |
| 21. | Summerset | 2.0% | 0.65%(+1.34)#21 | 1.2%(+0.806)#3,233 |
| 22. | Eagle Butte | 1.9% | 0.65%(+1.21)#22 | 1.2%(+0.677)#3,494 |
| 23. | Emery | 1.8% | 0.65%(+1.17)#23 | 1.2%(+0.634)#3,600 |
| 24. | Gregory | 1.8% | 0.65%(+1.16)#24 | 1.2%(+0.622)#3,626 |
| 25. | De Smet | 1.8% | 0.65%(+1.11)#25 | 1.2%(+0.571)#3,743 |
| 26. | Canistota | 1.7% | 0.65%(+1.07)#26 | 1.2%(+0.535)#3,836 |
| 27. | Flandreau | 1.6% | 0.65%(+0.996)#27 | 1.2%(+0.459)#4,021 |
| 28. | Viborg | 1.6% | 0.65%(+0.988)#28 | 1.2%(+0.451)#4,040 |
| 29. | Clark | 1.6% | 0.65%(+0.987)#29 | 1.2%(+0.450)#4,045 |
| 30. | Onida | 1.5% | 0.65%(+0.882)#30 | 1.2%(+0.345)#4,324 |
| 31. | Newell | 1.5% | 0.65%(+0.818)#31 | 1.2%(+0.281)#4,531 |
| 32. | Groton | 1.5% | 0.65%(+0.806)#32 | 1.2%(+0.269)#4,567 |
| 33. | Baltic | 1.4% | 0.65%(+0.776)#33 | 1.2%(+0.239)#4,667 |
| 34. | Chancellor | 1.4% | 0.65%(+0.733)#34 | 1.2%(+0.195)#4,809 |
| 35. | White | 1.4% | 0.65%(+0.709)#35 | 1.2%(+0.172)#4,878 |
| 36. | Mellette | 1.3% | 0.65%(+0.619)#36 | 1.2%(+0.082)#5,191 |
| 37. | Colman | 1.2% | 0.65%(+0.582)#37 | 1.2%(+0.045)#5,338 |
| 38. | Rapid City | 1.2% | 0.65%(+0.529)#38 | 1.2%(-0.008)#5,538 |
| 39. | Whitewood | 1.1% | 0.65%(+0.496)#39 | 1.2%(-0.041)#5,673 |
| 40. | Burke | 1.1% | 0.65%(+0.460)#40 | 1.2%(-0.077)#5,844 |
| 41. | Volga | 1.0% | 0.65%(+0.389)#41 | 1.2%(-0.148)#6,187 |
| 42. | Tripp | 1.0% | 0.65%(+0.363)#42 | 1.2%(-0.174)#6,321 |
| 43. | Fort Pierre | 1.0% | 0.65%(+0.361)#43 | 1.2%(-0.176)#6,338 |
| 44. | Chamberlain | 1.0% | 0.65%(+0.359)#44 | 1.2%(-0.178)#6,344 |
| 45. | Crooks | 0.94% | 0.65%(+0.297)#45 | 1.2%(-0.240)#6,651 |
| 46. | Miller | 0.93% | 0.65%(+0.281)#46 | 1.2%(-0.256)#6,743 |
| 47. | Blunt | 0.85% | 0.65%(+0.208)#47 | 1.2%(-0.329)#7,127 |
| 48. | Mission | 0.85% | 0.65%(+0.206)#48 | 1.2%(-0.332)#7,140 |
| 49. | Madison | 0.84% | 0.65%(+0.196)#49 | 1.2%(-0.341)#7,187 |
| 50. | Dell Rapids | 0.84% | 0.65%(+0.192)#50 | 1.2%(-0.346)#7,201 |
| 51. | Sioux Falls | 0.82% | 0.65%(+0.174)#51 | 1.2%(-0.363)#7,301 |
| 52. | Deadwood | 0.82% | 0.65%(+0.171)#52 | 1.2%(-0.366)#7,314 |
| 53. | Gettysburg | 0.81% | 0.65%(+0.164)#53 | 1.2%(-0.373)#7,352 |
| 54. | Webster | 0.79% | 0.65%(+0.142)#54 | 1.2%(-0.396)#7,492 |
| 55. | Spearfish | 0.76% | 0.65%(+0.113)#55 | 1.2%(-0.424)#7,680 |
| 56. | Warner | 0.75% | 0.65%(+0.102)#56 | 1.2%(-0.435)#7,751 |
| 57. | Parkston | 0.69% | 0.65%(+0.044)#57 | 1.2%(-0.493)#8,135 |
| 58. | Aberdeen | 0.65% | 0.65%(-0.001)#58 | 1.2%(-0.538)#8,443 |
| 59. | Watertown | 0.58% | 0.65%(-0.066)#59 | 1.2%(-0.603)#8,939 |
| 60. | Bridgewater | 0.54% | 0.65%(-0.109)#60 | 1.2%(-0.646)#9,226 |
| 61. | Hot Springs | 0.53% | 0.65%(-0.114)#61 | 1.2%(-0.652)#9,263 |
| 62. | Centerville | 0.52% | 0.65%(-0.129)#62 | 1.2%(-0.666)#9,352 |
| 63. | Huron | 0.47% | 0.65%(-0.178)#63 | 1.2%(-0.715)#9,755 |
| 64. | Howard | 0.47% | 0.65%(-0.179)#64 | 1.2%(-0.717)#9,760 |
| 65. | Freeman | 0.44% | 0.65%(-0.203)#65 | 1.2%(-0.740)#9,935 |
| 66. | Tea | 0.41% | 0.65%(-0.236)#66 | 1.2%(-0.773)#10,172 |
| 67. | Beresford | 0.40% | 0.65%(-0.246)#67 | 1.2%(-0.783)#10,236 |
| 68. | Worthing | 0.39% | 0.65%(-0.254)#68 | 1.2%(-0.791)#10,279 |
| 69. | Yankton | 0.36% | 0.65%(-0.286)#69 | 1.2%(-0.823)#10,518 |
| 70. | Mount Vernon | 0.34% | 0.65%(-0.304)#70 | 1.2%(-0.841)#10,650 |
| 71. | Vermillion | 0.34% | 0.65%(-0.305)#71 | 1.2%(-0.842)#10,652 |
| 72. | Colonial Pine Hills | 0.34% | 0.65%(-0.308)#72 | 1.2%(-0.845)#10,677 |
| 73. | Valley Springs | 0.32% | 0.65%(-0.324)#73 | 1.2%(-0.861)#10,788 |
| 74. | Garretson | 0.32% | 0.65%(-0.325)#74 | 1.2%(-0.862)#10,791 |
| 75. | Wagner | 0.32% | 0.65%(-0.326)#75 | 1.2%(-0.863)#10,797 |
| 76. | Brookings | 0.31% | 0.65%(-0.335)#76 | 1.2%(-0.872)#10,852 |
| 77. | Mitchell | 0.30% | 0.65%(-0.343)#77 | 1.2%(-0.880)#10,906 |
| 78. | Brandon | 0.24% | 0.65%(-0.409)#78 | 1.2%(-0.946)#11,264 |
Common Questions
What are the Top 10 Cities with the Highest Percentage of Population Employed in Legal Services & Support in South Dakota?
Top 10 Cities with the Highest Percentage of Population Employed in Legal Services & Support in South Dakota are:
#1
23.0%
#2
14.3%
#3
6.7%
#4
3.7%
#5
3.7%
#6
3.7%
#7
3.6%
#8
3.3%
#9
3.1%
#10
2.9%
What city has the Highest Percentage of Population Employed in Legal Services & Support in South Dakota?
Porcupine has the Highest Percentage of Population Employed in Legal Services & Support in South Dakota with 23.0%.
What is the Percentage of Population Employed in Legal Services & Support in the State of South Dakota?
Percentage of Population Employed in Legal Services & Support in South Dakota is 0.65%.
What is the Percentage of Population Employed in Legal Services & Support in the United States?
Percentage of Population Employed in Legal Services & Support in the United States is 1.2%.