Belvedere, CA Map & Demographics
Belvedere Map
Belvedere Overview
$165,410
PER CAPITA INCOME
$250,001
AVG FAMILY INCOME
$250,001
AVG HOUSEHOLD INCOME
76.1%
WAGE / INCOME GAP [ % ]
23.9¢/ $1
WAGE / INCOME GAP [ $ ]
0.52
INEQUALITY / GINI INDEX
2,327
TOTAL POPULATION
1,057
MALE POPULATION
1,270
FEMALE POPULATION
83.23
MALES / 100 FEMALES
120.15
FEMALES / 100 MALES
50.3
MEDIAN AGE
3.0
AVG FAMILY SIZE
2.6
AVG HOUSEHOLD SIZE
932
LABOR FORCE [ PEOPLE ]
50.0%
PERCENT IN LABOR FORCE
1.4%
UNEMPLOYMENT RATE
Belvedere Area Codes
Income in Belvedere
Income Overview in Belvedere
Per Capita Income in Belvedere is $165,410, while median incomes of families and households are $250,001 and $250,001 respectively.
| Characteristic | Number | Measure |
| Per Capita Income | 2,327 | $165,410 |
| Median Family Income | 658 | $250,001 |
| Mean Family Income | 658 | $508,847 |
| Median Household Income | 886 | $250,001 |
| Mean Household Income | 886 | $437,620 |
| Income Deficit | 658 | $0 |
| Wage / Income Gap (%) | 2,327 | 76.08% |
| Wage / Income Gap ($) | 2,327 | 23.92¢ per $1 |
| Gini / Inequality Index | 2,327 | 0.52 |
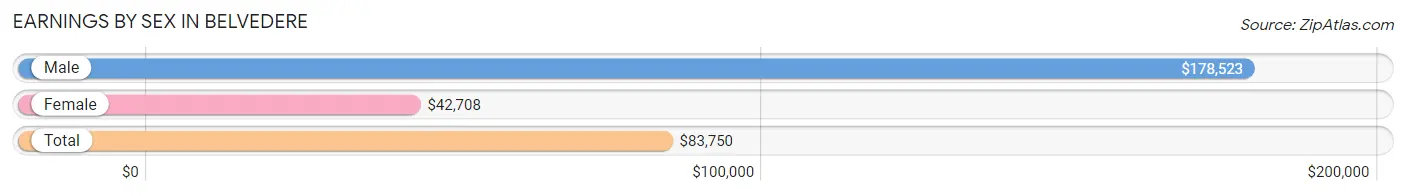
Earnings by Sex in Belvedere
Average Earnings in Belvedere are $83,750, $178,523 for men and $42,708 for women, a difference of 76.1%.
| Sex | Number | Average Earnings |
| Male | 591 (55.9%) | $178,523 |
| Female | 467 (44.1%) | $42,708 |
| Total | 1,058 (100.0%) | $83,750 |
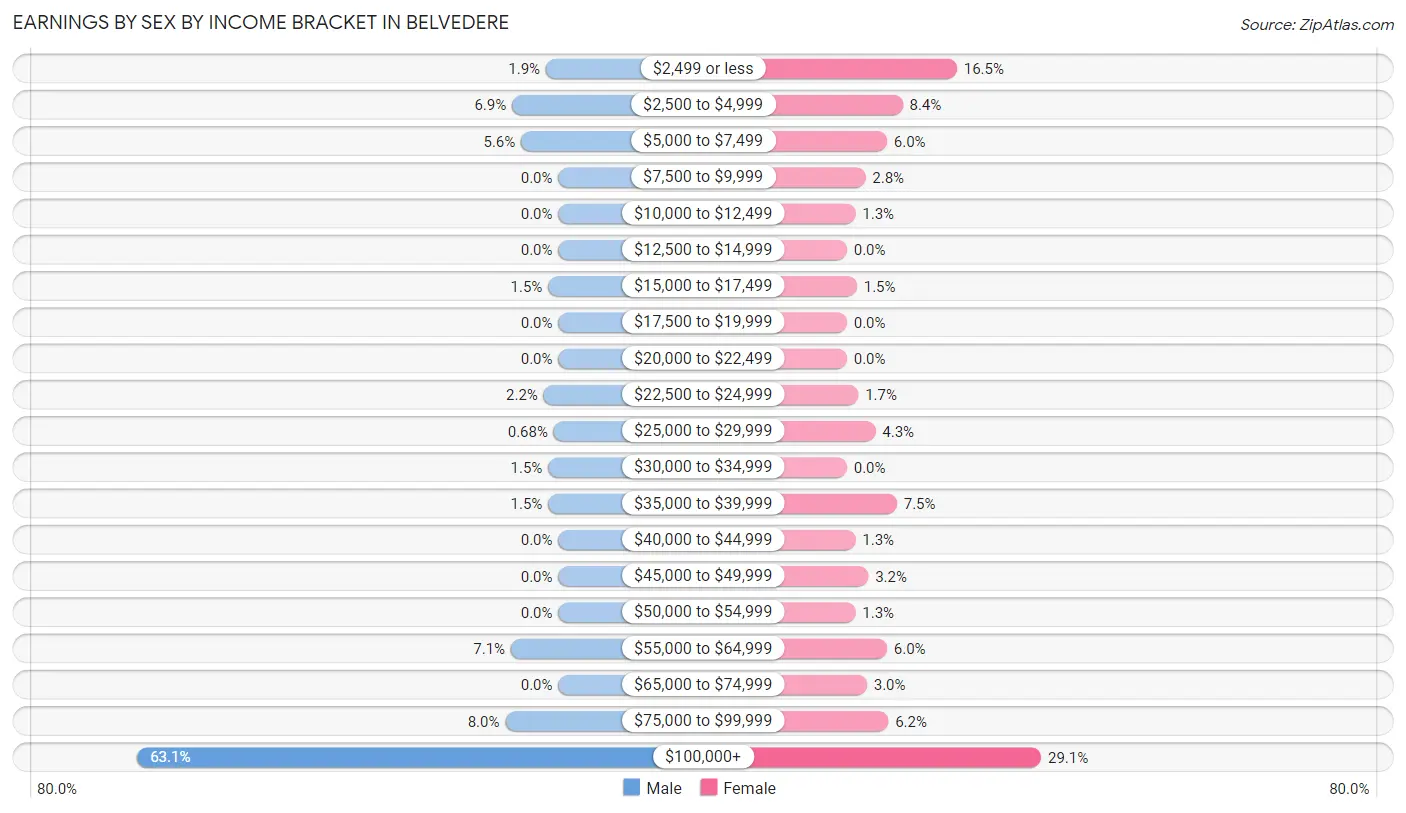
Earnings by Sex by Income Bracket in Belvedere
The most common earnings brackets in Belvedere are $100,000+ for men (373 | 63.1%) and $100,000+ for women (136 | 29.1%).
| Income | Male | Female |
| $2,499 or less | 11 (1.9%) | 77 (16.5%) |
| $2,500 to $4,999 | 41 (6.9%) | 39 (8.4%) |
| $5,000 to $7,499 | 33 (5.6%) | 28 (6.0%) |
| $7,500 to $9,999 | 0 (0.0%) | 13 (2.8%) |
| $10,000 to $12,499 | 0 (0.0%) | 6 (1.3%) |
| $12,500 to $14,999 | 0 (0.0%) | 0 (0.0%) |
| $15,000 to $17,499 | 9 (1.5%) | 7 (1.5%) |
| $17,500 to $19,999 | 0 (0.0%) | 0 (0.0%) |
| $20,000 to $22,499 | 0 (0.0%) | 0 (0.0%) |
| $22,500 to $24,999 | 13 (2.2%) | 8 (1.7%) |
| $25,000 to $29,999 | 4 (0.7%) | 20 (4.3%) |
| $30,000 to $34,999 | 9 (1.5%) | 0 (0.0%) |
| $35,000 to $39,999 | 9 (1.5%) | 35 (7.5%) |
| $40,000 to $44,999 | 0 (0.0%) | 6 (1.3%) |
| $45,000 to $49,999 | 0 (0.0%) | 15 (3.2%) |
| $50,000 to $54,999 | 0 (0.0%) | 6 (1.3%) |
| $55,000 to $64,999 | 42 (7.1%) | 28 (6.0%) |
| $65,000 to $74,999 | 0 (0.0%) | 14 (3.0%) |
| $75,000 to $99,999 | 47 (8.0%) | 29 (6.2%) |
| $100,000+ | 373 (63.1%) | 136 (29.1%) |
| Total | 591 (100.0%) | 467 (100.0%) |
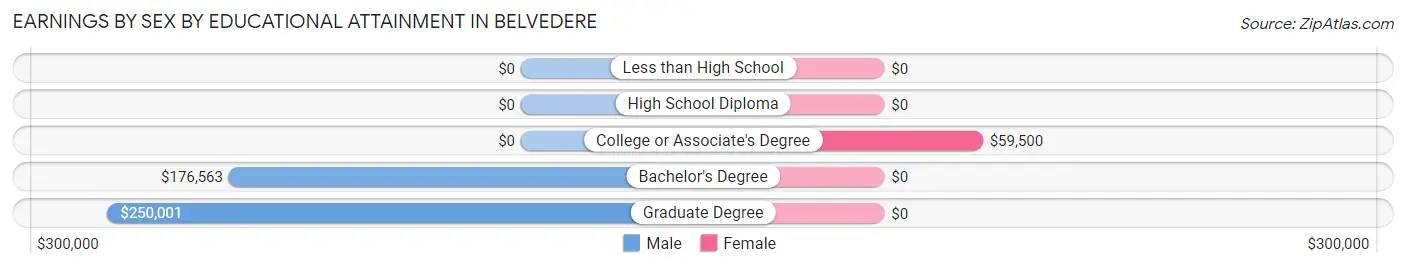
Earnings by Sex by Educational Attainment in Belvedere
Average earnings in Belvedere are $181,691 for men and $58,438 for women, a difference of 67.8%. Men with an educational attainment of graduate degree enjoy the highest average annual earnings of $250,001, while those with bachelor's degree education earn the least with $176,563. Women with an educational attainment of college or associate's degree earn the most with the average annual earnings of $59,500, while those with college or associate's degree education have the smallest earnings of $59,500.
| Educational Attainment | Male Income | Female Income |
| Less than High School | - | - |
| High School Diploma | - | - |
| College or Associate's Degree | - | - |
| Bachelor's Degree | $176,563 | $0 |
| Graduate Degree | $250,001 | $0 |
| Total | $181,691 | $58,438 |
Family Income in Belvedere
Family Income Brackets in Belvedere
According to the Belvedere family income data, there are 446 families falling into the $200,000+ income range, which is the most common income bracket and makes up 67.8% of all families.
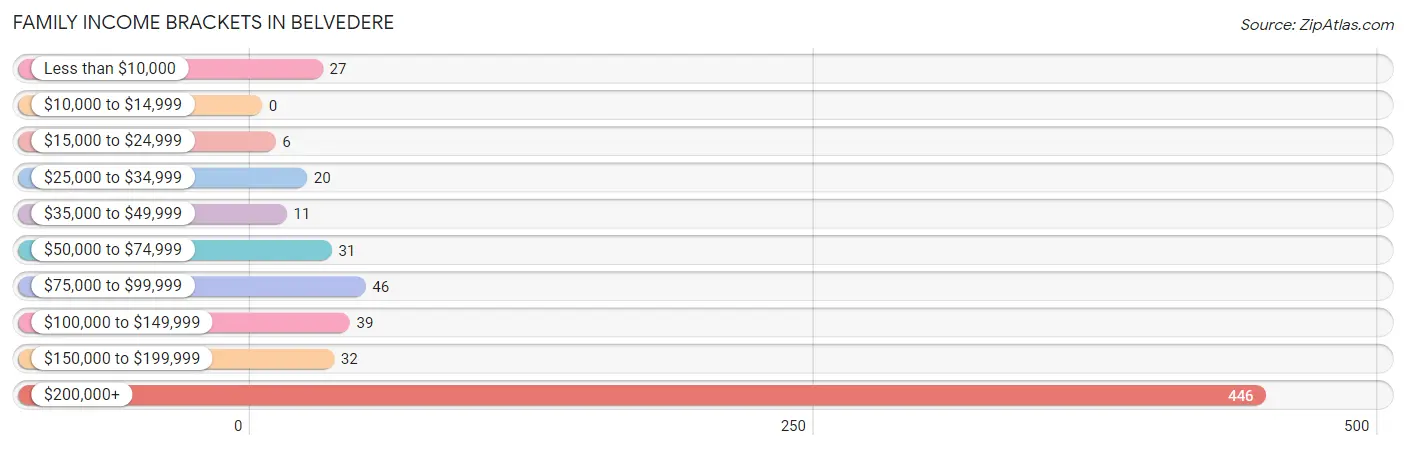
| Income Bracket | # Families | % Families |
| Less than $10,000 | 27 | 4.1% |
| $10,000 to $14,999 | 0 | 0.0% |
| $15,000 to $24,999 | 6 | 0.9% |
| $25,000 to $34,999 | 20 | 3.0% |
| $35,000 to $49,999 | 11 | 1.7% |
| $50,000 to $74,999 | 31 | 4.7% |
| $75,000 to $99,999 | 46 | 7.0% |
| $100,000 to $149,999 | 39 | 5.9% |
| $150,000 to $199,999 | 32 | 4.9% |
| $200,000+ | 446 | 67.8% |
Family Income by Famaliy Size in Belvedere
2-person families (323 | 49.1%) account for the highest median family income in Belvedere with $250,001 per family, while 2-person families (323 | 49.1%) have the highest median income of $125,000 per family member.
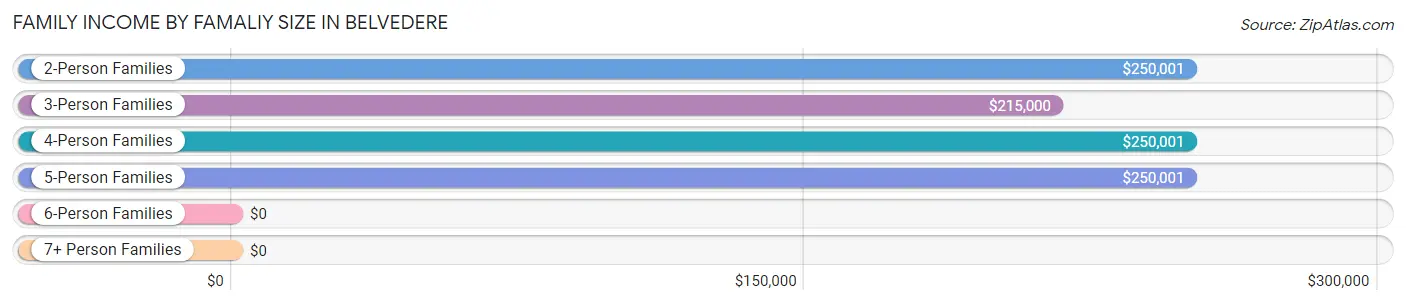
| Income Bracket | # Families | Median Income |
| 2-Person Families | 323 (49.1%) | $250,001 |
| 3-Person Families | 94 (14.3%) | $215,000 |
| 4-Person Families | 177 (26.9%) | $250,001 |
| 5-Person Families | 60 (9.1%) | $250,001 |
| 6-Person Families | 4 (0.6%) | $0 |
| 7+ Person Families | 0 (0.0%) | $0 |
| Total | 658 (100.0%) | $250,001 |
Family Income by Number of Earners in Belvedere
The median family income in Belvedere is $250,001, with families comprising 1 earner (231) having the highest median family income of $250,001, while families with no earners (122) have the lowest median family income of $228,333, accounting for 35.1% and 18.5% of families, respectively.
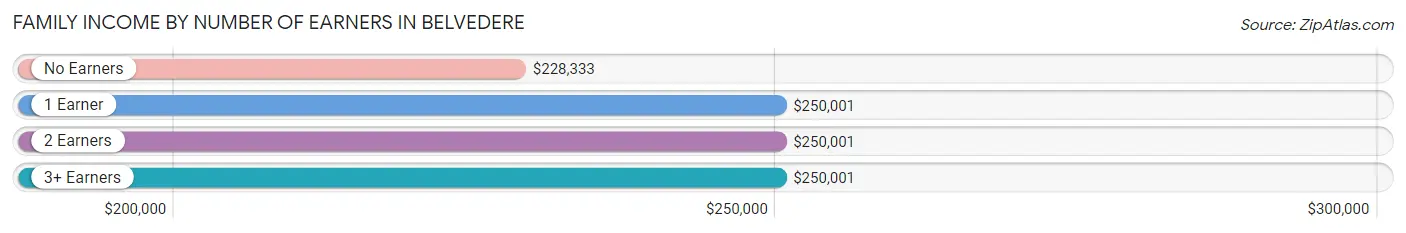
| Number of Earners | # Families | Median Income |
| No Earners | 122 (18.5%) | $228,333 |
| 1 Earner | 231 (35.1%) | $250,001 |
| 2 Earners | 284 (43.2%) | $250,001 |
| 3+ Earners | 21 (3.2%) | $250,001 |
| Total | 658 (100.0%) | $250,001 |
Household Income in Belvedere
Household Income Brackets in Belvedere
With 522 households falling in the category, the $200,000+ income range is the most frequent in Belvedere, accounting for 58.9% of all households. In contrast, only 11 households (1.2%) fall into the $10,000 to $14,999 income bracket, making it the least populous group.
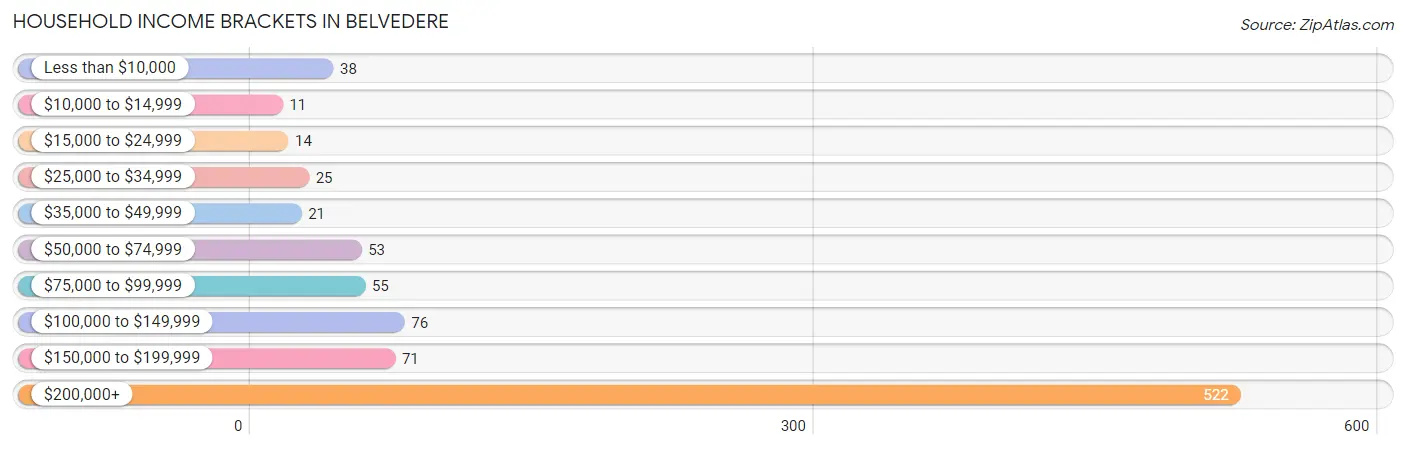
| Income Bracket | # Households | % Households |
| Less than $10,000 | 38 | 4.3% |
| $10,000 to $14,999 | 11 | 1.2% |
| $15,000 to $24,999 | 14 | 1.6% |
| $25,000 to $34,999 | 25 | 2.8% |
| $35,000 to $49,999 | 21 | 2.4% |
| $50,000 to $74,999 | 53 | 6.0% |
| $75,000 to $99,999 | 55 | 6.2% |
| $100,000 to $149,999 | 76 | 8.6% |
| $150,000 to $199,999 | 71 | 8.0% |
| $200,000+ | 522 | 58.9% |
Household Income by Householder Age in Belvedere
The median household income in Belvedere is $250,001, with the highest median household income of $250,001 found in the 25 to 44 years age bracket for the primary householder. A total of 81 households (9.1%) fall into this category.
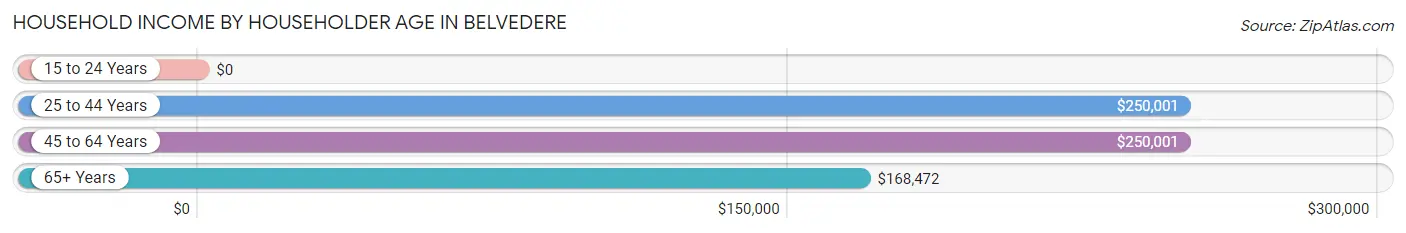
| Income Bracket | # Households | Median Income |
| 15 to 24 Years | 0 (0.0%) | $0 |
| 25 to 44 Years | 81 (9.1%) | $250,001 |
| 45 to 64 Years | 450 (50.8%) | $250,001 |
| 65+ Years | 355 (40.1%) | $168,472 |
| Total | 886 (100.0%) | $250,001 |
Poverty in Belvedere
Income Below Poverty by Sex and Age in Belvedere
With 2.5% poverty level for males and 8.8% for females among the residents of Belvedere, 16 and 17 year old males and 25 to 34 year old females are the most vulnerable to poverty, with 5 males (19.2%) and 42 females (35.6%) in their respective age groups living below the poverty level.
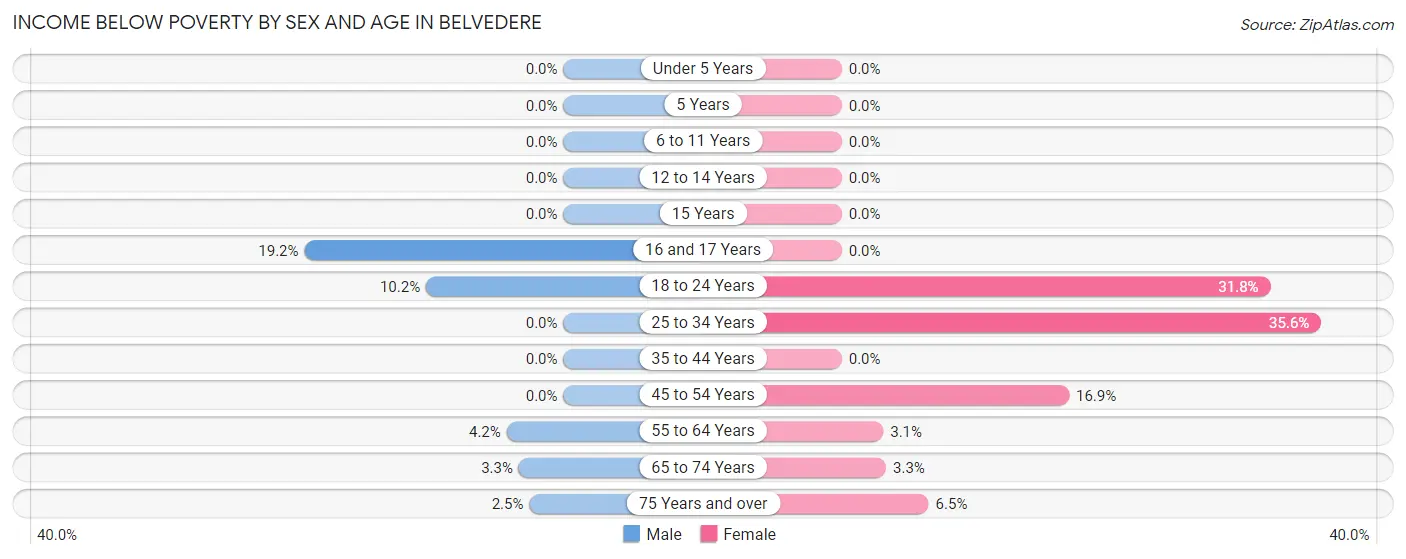
| Age Bracket | Male | Female |
| Under 5 Years | 0 (0.0%) | 0 (0.0%) |
| 5 Years | 0 (0.0%) | 0 (0.0%) |
| 6 to 11 Years | 0 (0.0%) | 0 (0.0%) |
| 12 to 14 Years | 0 (0.0%) | 0 (0.0%) |
| 15 Years | 0 (0.0%) | 0 (0.0%) |
| 16 and 17 Years | 5 (19.2%) | 0 (0.0%) |
| 18 to 24 Years | 5 (10.2%) | 21 (31.8%) |
| 25 to 34 Years | 0 (0.0%) | 42 (35.6%) |
| 35 to 44 Years | 0 (0.0%) | 0 (0.0%) |
| 45 to 54 Years | 0 (0.0%) | 28 (16.9%) |
| 55 to 64 Years | 8 (4.2%) | 6 (3.1%) |
| 65 to 74 Years | 4 (3.3%) | 5 (3.3%) |
| 75 Years and over | 4 (2.5%) | 10 (6.5%) |
| Total | 26 (2.5%) | 112 (8.8%) |
Income Above Poverty by Sex and Age in Belvedere
According to the poverty statistics in Belvedere, males aged under 5 years and females aged under 5 years are the age groups that are most secure financially, with 100.0% of males and 100.0% of females in these age groups living above the poverty line.
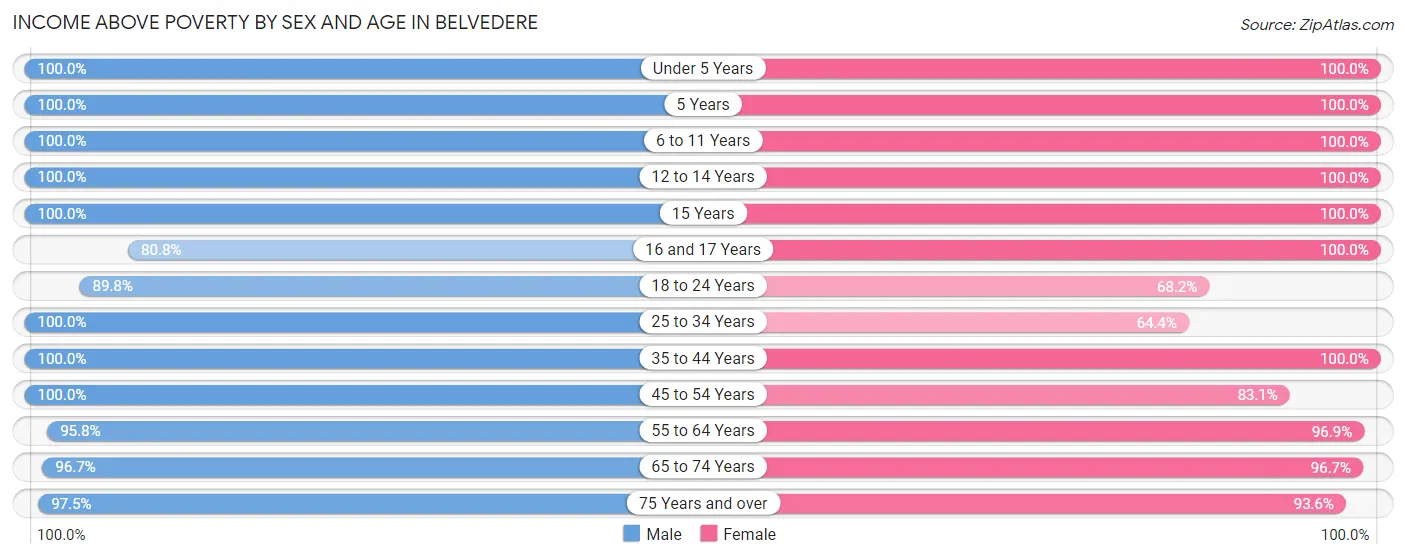
| Age Bracket | Male | Female |
| Under 5 Years | 26 (100.0%) | 78 (100.0%) |
| 5 Years | 20 (100.0%) | 7 (100.0%) |
| 6 to 11 Years | 66 (100.0%) | 54 (100.0%) |
| 12 to 14 Years | 88 (100.0%) | 80 (100.0%) |
| 15 Years | 12 (100.0%) | 24 (100.0%) |
| 16 and 17 Years | 21 (80.8%) | 74 (100.0%) |
| 18 to 24 Years | 44 (89.8%) | 45 (68.2%) |
| 25 to 34 Years | 20 (100.0%) | 76 (64.4%) |
| 35 to 44 Years | 112 (100.0%) | 101 (100.0%) |
| 45 to 54 Years | 162 (100.0%) | 138 (83.1%) |
| 55 to 64 Years | 182 (95.8%) | 189 (96.9%) |
| 65 to 74 Years | 117 (96.7%) | 147 (96.7%) |
| 75 Years and over | 154 (97.5%) | 145 (93.5%) |
| Total | 1,024 (97.5%) | 1,158 (91.2%) |
Income Below Poverty Among Married-Couple Families in Belvedere
The poverty statistics for married-couple families in Belvedere show that 0.7% or 4 of the total 560 families live below the poverty line. Families with 1 or 2 children have the highest poverty rate of 1.9%, comprising of 4 families. On the other hand, families with no children have the lowest poverty rate of 0.0%, which includes 0 families.
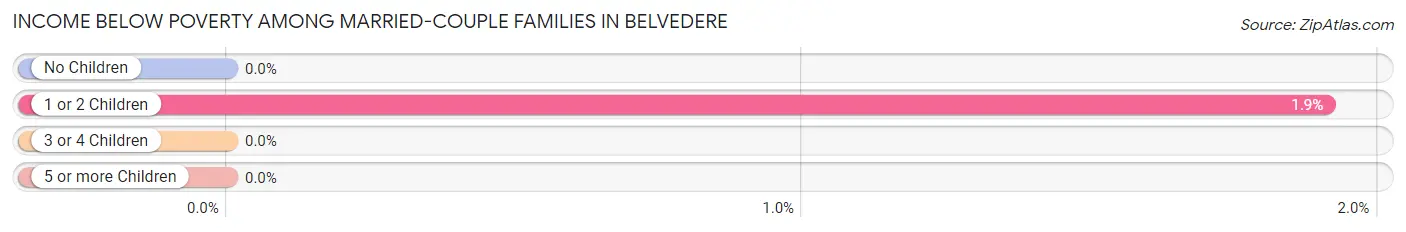
| Children | Above Poverty | Below Poverty |
| No Children | 307 (100.0%) | 0 (0.0%) |
| 1 or 2 Children | 205 (98.1%) | 4 (1.9%) |
| 3 or 4 Children | 44 (100.0%) | 0 (0.0%) |
| 5 or more Children | 0 (0.0%) | 0 (0.0%) |
| Total | 556 (99.3%) | 4 (0.7%) |
Income Below Poverty Among Single-Parent Households in Belvedere
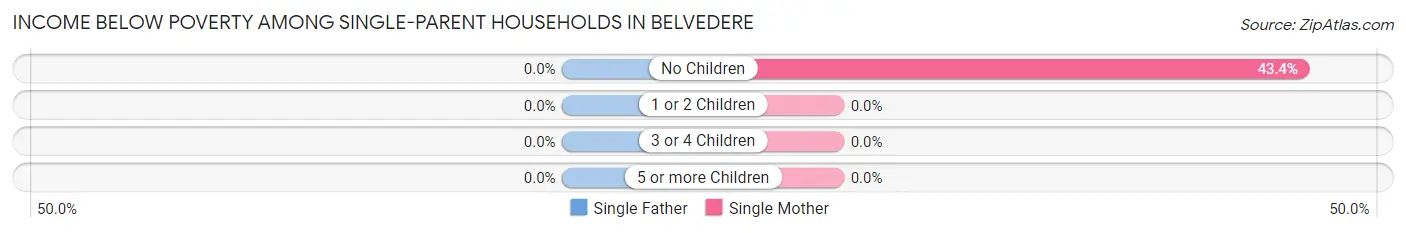
| Children | Single Father | Single Mother |
| No Children | 0 (0.0%) | 23 (43.4%) |
| 1 or 2 Children | 0 (0.0%) | 0 (0.0%) |
| 3 or 4 Children | 0 (0.0%) | 0 (0.0%) |
| 5 or more Children | 0 (0.0%) | 0 (0.0%) |
| Total | 0 (0.0%) | 23 (35.9%) |
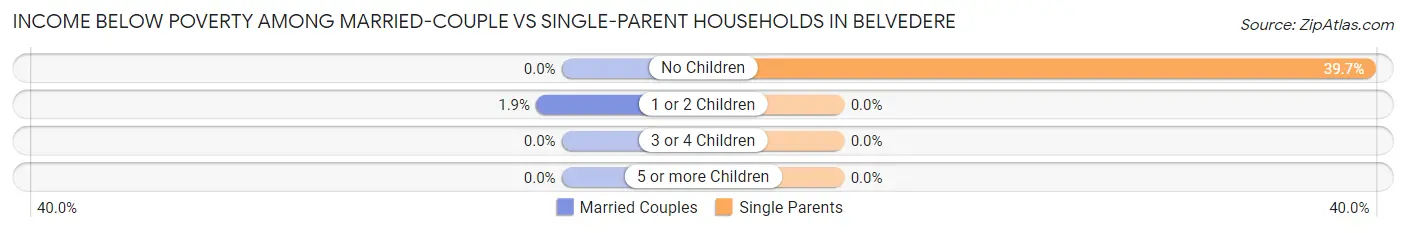
Income Below Poverty Among Married-Couple vs Single-Parent Households in Belvedere
The poverty data for Belvedere shows that 4 of the married-couple family households (0.7%) and 23 of the single-parent households (23.5%) are living below the poverty level. Within the married-couple family households, those with 1 or 2 children have the highest poverty rate, with 4 households (1.9%) falling below the poverty line. Among the single-parent households, those with no children have the highest poverty rate, with 23 household (39.7%) living below poverty.
| Children | Married-Couple Families | Single-Parent Households |
| No Children | 0 (0.0%) | 23 (39.7%) |
| 1 or 2 Children | 4 (1.9%) | 0 (0.0%) |
| 3 or 4 Children | 0 (0.0%) | 0 (0.0%) |
| 5 or more Children | 0 (0.0%) | 0 (0.0%) |
| Total | 4 (0.7%) | 23 (23.5%) |
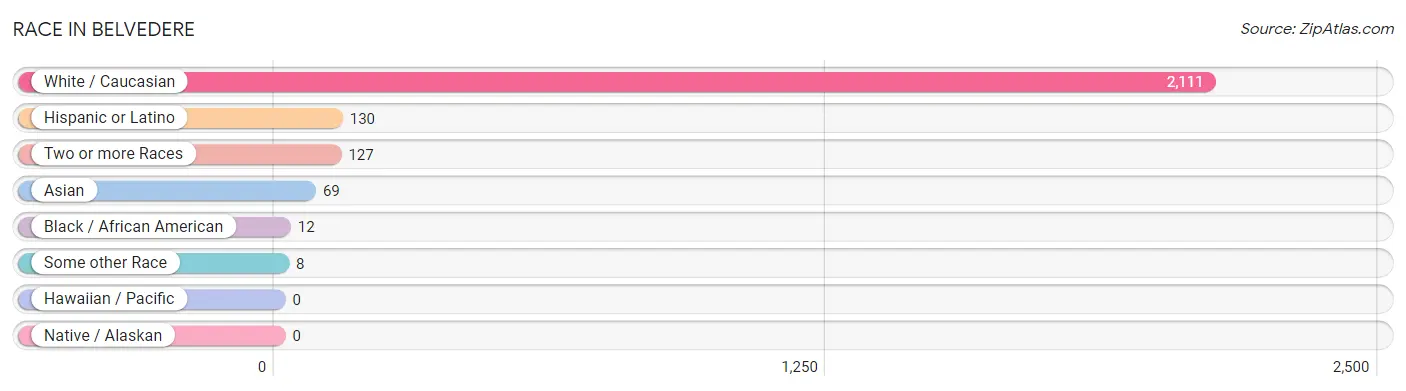
Race in Belvedere
The most populous races in Belvedere are White / Caucasian (2,111 | 90.7%), Hispanic or Latino (130 | 5.6%), and Two or more Races (127 | 5.5%).
| Race | # Population | % Population |
| Asian | 69 | 3.0% |
| Black / African American | 12 | 0.5% |
| Hawaiian / Pacific | 0 | 0.0% |
| Hispanic or Latino | 130 | 5.6% |
| Native / Alaskan | 0 | 0.0% |
| White / Caucasian | 2,111 | 90.7% |
| Two or more Races | 127 | 5.5% |
| Some other Race | 8 | 0.3% |
| Total | 2,327 | 100.0% |
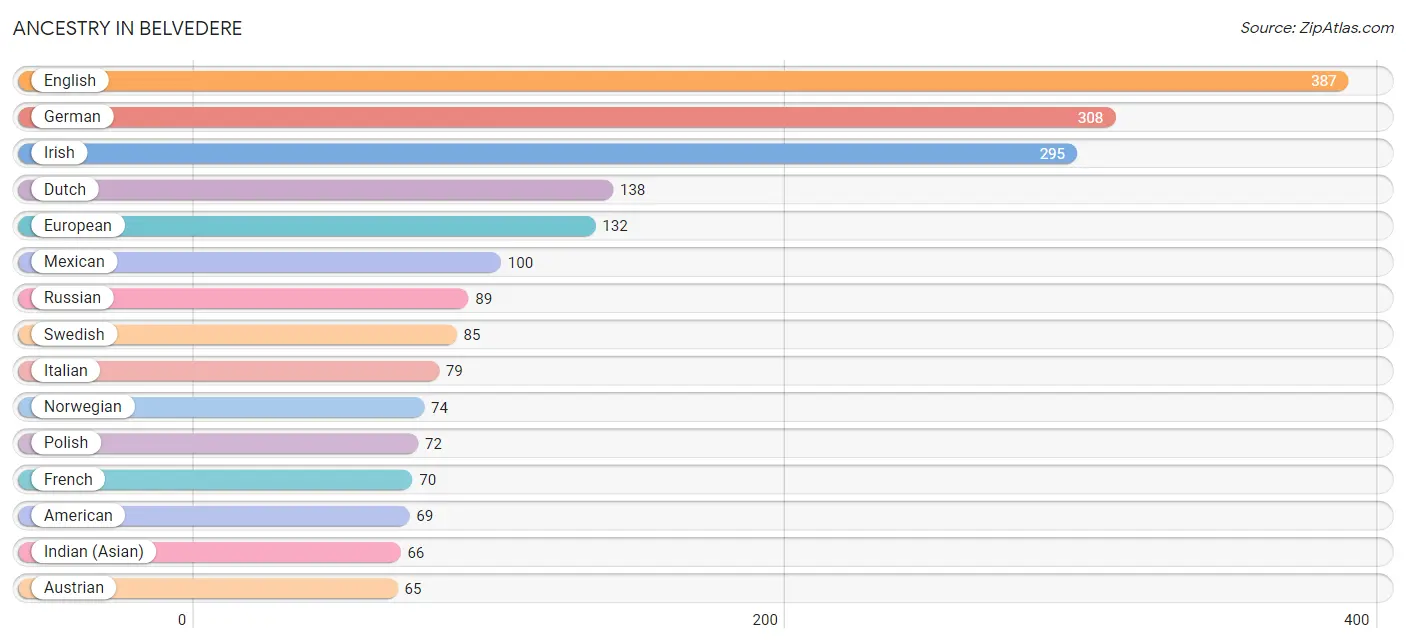
Ancestry in Belvedere
The most populous ancestries reported in Belvedere are English (387 | 16.6%), German (308 | 13.2%), Irish (295 | 12.7%), Dutch (138 | 5.9%), and European (132 | 5.7%), together accounting for 54.1% of all Belvedere residents.
| Ancestry | # Population | % Population |
| African | 6 | 0.3% |
| American | 69 | 3.0% |
| Armenian | 19 | 0.8% |
| Austrian | 65 | 2.8% |
| Bhutanese | 10 | 0.4% |
| British | 38 | 1.6% |
| Burmese | 16 | 0.7% |
| Canadian | 16 | 0.7% |
| Danish | 13 | 0.6% |
| Dominican | 30 | 1.3% |
| Dutch | 138 | 5.9% |
| Eastern European | 43 | 1.8% |
| English | 387 | 16.6% |
| European | 132 | 5.7% |
| Finnish | 12 | 0.5% |
| French | 70 | 3.0% |
| French Canadian | 4 | 0.2% |
| German | 308 | 13.2% |
| Greek | 16 | 0.7% |
| Hungarian | 9 | 0.4% |
| Indian (Asian) | 66 | 2.8% |
| Irish | 295 | 12.7% |
| Italian | 79 | 3.4% |
| Korean | 14 | 0.6% |
| Lithuanian | 14 | 0.6% |
| Mexican | 100 | 4.3% |
| Northern European | 61 | 2.6% |
| Norwegian | 74 | 3.2% |
| Pakistani | 22 | 0.9% |
| Polish | 72 | 3.1% |
| Portuguese | 35 | 1.5% |
| Romanian | 16 | 0.7% |
| Russian | 89 | 3.8% |
| Scandinavian | 58 | 2.5% |
| Scotch-Irish | 10 | 0.4% |
| Scottish | 53 | 2.3% |
| Slavic | 9 | 0.4% |
| South African | 10 | 0.4% |
| Subsaharan African | 16 | 0.7% |
| Swedish | 85 | 3.6% |
| Swiss | 4 | 0.2% |
| Turkish | 51 | 2.2% |
| Ukrainian | 35 | 1.5% |
| Welsh | 5 | 0.2% |
| Yaqui | 13 | 0.6% | View All 45 Rows |
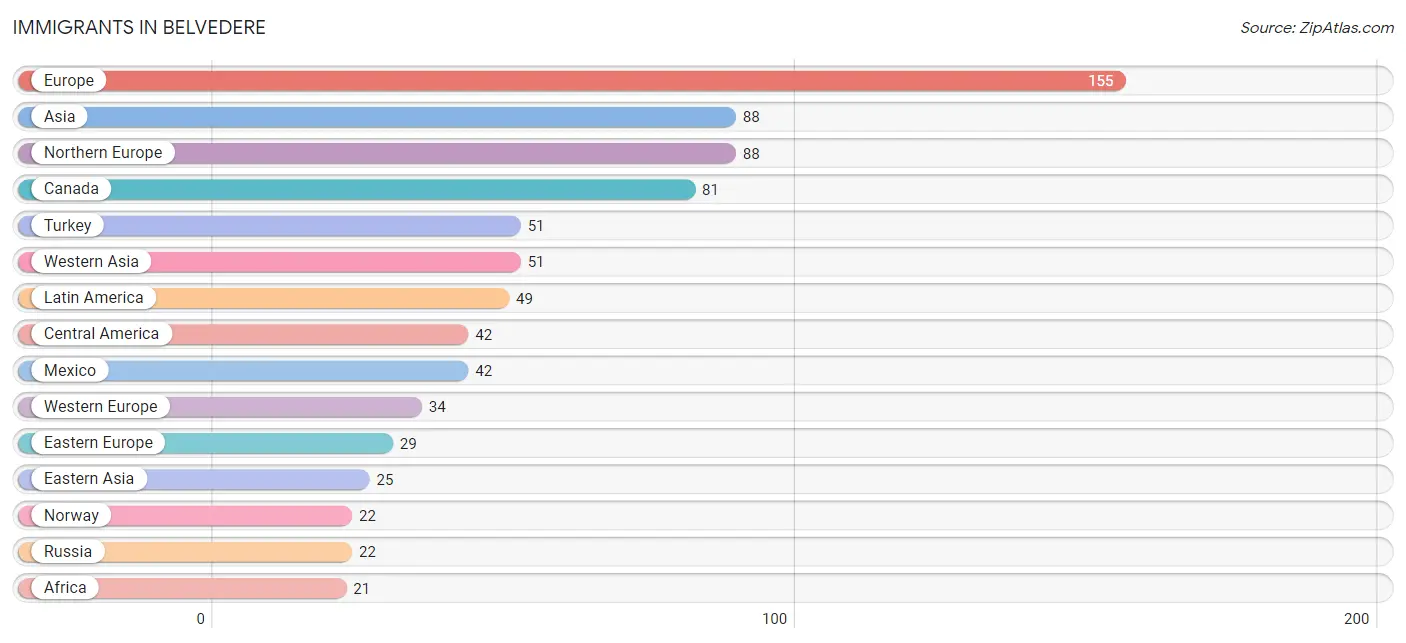
Immigrants in Belvedere
The most numerous immigrant groups reported in Belvedere came from Europe (155 | 6.7%), Asia (88 | 3.8%), Northern Europe (88 | 3.8%), Canada (81 | 3.5%), and Turkey (51 | 2.2%), together accounting for 19.9% of all Belvedere residents.
| Immigration Origin | # Population | % Population |
| Africa | 21 | 0.9% |
| Asia | 88 | 3.8% |
| Canada | 81 | 3.5% |
| Central America | 42 | 1.8% |
| China | 21 | 0.9% |
| Colombia | 7 | 0.3% |
| Eastern Africa | 5 | 0.2% |
| Eastern Asia | 25 | 1.1% |
| Eastern Europe | 29 | 1.3% |
| England | 3 | 0.1% |
| Europe | 155 | 6.7% |
| France | 19 | 0.8% |
| Germany | 15 | 0.6% |
| Korea | 4 | 0.2% |
| Latin America | 49 | 2.1% |
| Mexico | 42 | 1.8% |
| Middle Africa | 6 | 0.3% |
| Northern Europe | 88 | 3.8% |
| Norway | 22 | 0.9% |
| Philippines | 6 | 0.3% |
| Poland | 7 | 0.3% |
| Russia | 22 | 0.9% |
| South Africa | 10 | 0.4% |
| South America | 7 | 0.3% |
| South Eastern Asia | 12 | 0.5% |
| Southern Europe | 4 | 0.2% |
| Spain | 4 | 0.2% |
| Taiwan | 9 | 0.4% |
| Thailand | 6 | 0.3% |
| Turkey | 51 | 2.2% |
| Uganda | 5 | 0.2% |
| Western Asia | 51 | 2.2% |
| Western Europe | 34 | 1.5% | View All 33 Rows |
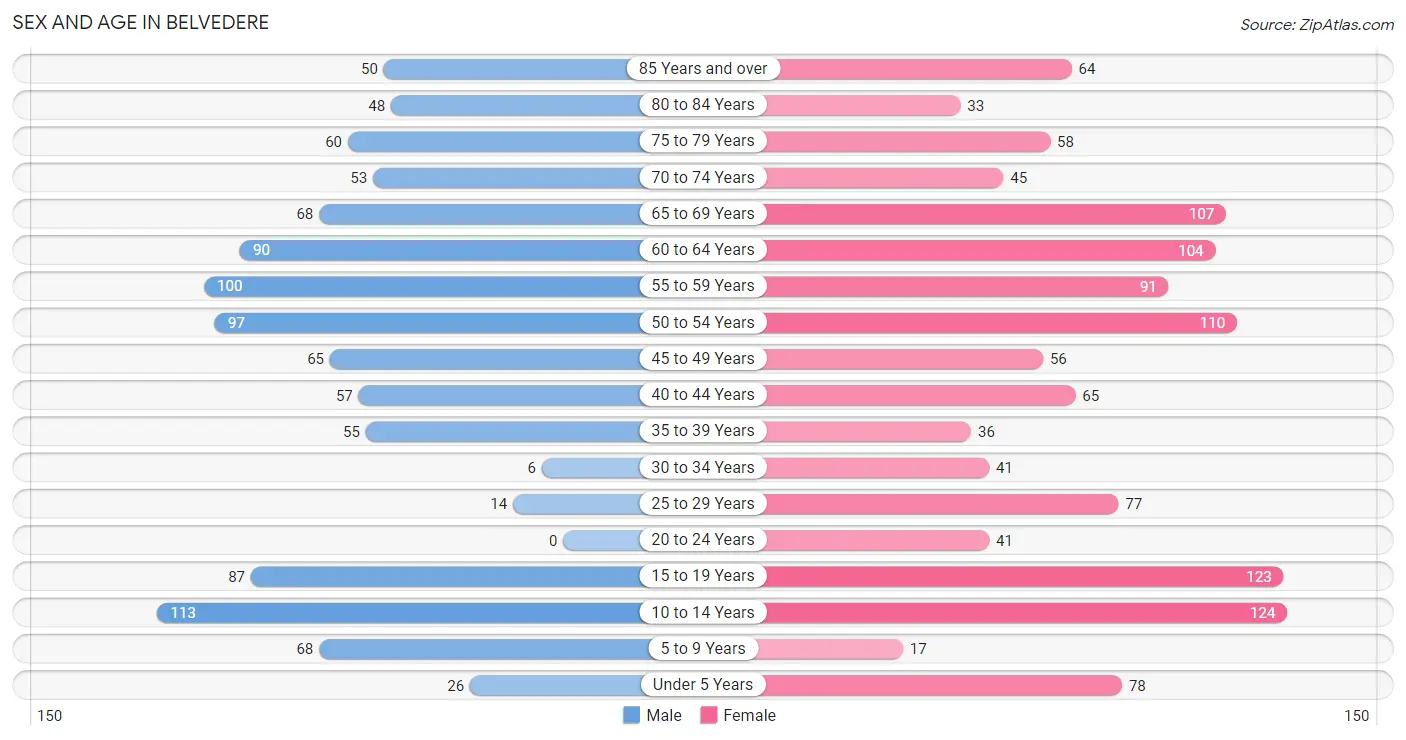
Sex and Age in Belvedere
Sex and Age in Belvedere
The most populous age groups in Belvedere are 10 to 14 Years (113 | 10.7%) for men and 10 to 14 Years (124 | 9.8%) for women.
| Age Bracket | Male | Female |
| Under 5 Years | 26 (2.5%) | 78 (6.1%) |
| 5 to 9 Years | 68 (6.4%) | 17 (1.3%) |
| 10 to 14 Years | 113 (10.7%) | 124 (9.8%) |
| 15 to 19 Years | 87 (8.2%) | 123 (9.7%) |
| 20 to 24 Years | 0 (0.0%) | 41 (3.2%) |
| 25 to 29 Years | 14 (1.3%) | 77 (6.1%) |
| 30 to 34 Years | 6 (0.6%) | 41 (3.2%) |
| 35 to 39 Years | 55 (5.2%) | 36 (2.8%) |
| 40 to 44 Years | 57 (5.4%) | 65 (5.1%) |
| 45 to 49 Years | 65 (6.1%) | 56 (4.4%) |
| 50 to 54 Years | 97 (9.2%) | 110 (8.7%) |
| 55 to 59 Years | 100 (9.5%) | 91 (7.2%) |
| 60 to 64 Years | 90 (8.5%) | 104 (8.2%) |
| 65 to 69 Years | 68 (6.4%) | 107 (8.4%) |
| 70 to 74 Years | 53 (5.0%) | 45 (3.5%) |
| 75 to 79 Years | 60 (5.7%) | 58 (4.6%) |
| 80 to 84 Years | 48 (4.5%) | 33 (2.6%) |
| 85 Years and over | 50 (4.7%) | 64 (5.0%) |
| Total | 1,057 (100.0%) | 1,270 (100.0%) |
Families and Households in Belvedere
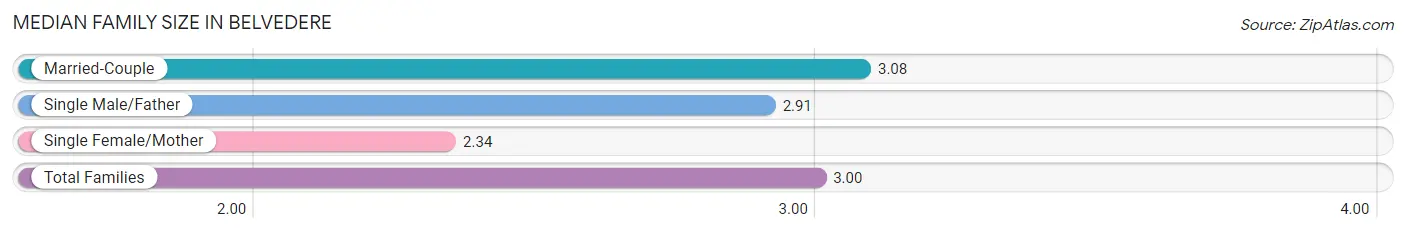
Median Family Size in Belvedere
The median family size in Belvedere is 3.00 persons per family, with married-couple families (560 | 85.1%) accounting for the largest median family size of 3.08 persons per family. On the other hand, single female/mother families (64 | 9.7%) represent the smallest median family size with 2.34 persons per family.
| Family Type | # Families | Family Size |
| Married-Couple | 560 (85.1%) | 3.08 |
| Single Male/Father | 34 (5.2%) | 2.91 |
| Single Female/Mother | 64 (9.7%) | 2.34 |
| Total Families | 658 (100.0%) | 3.00 |
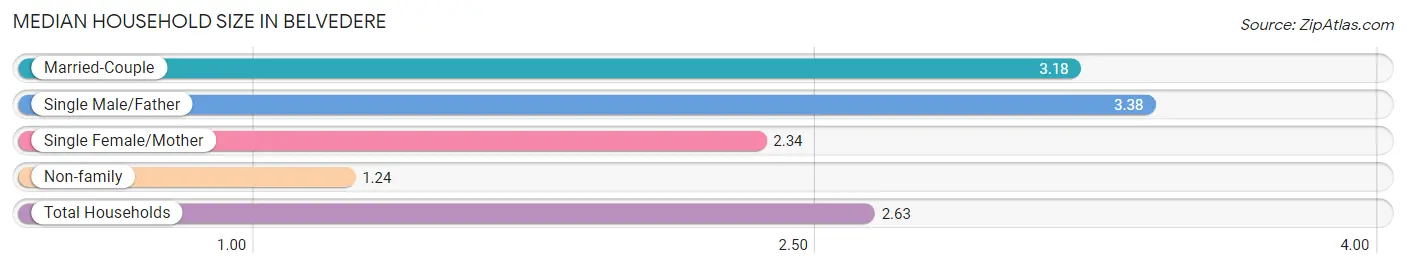
Median Household Size in Belvedere
The median household size in Belvedere is 2.63 persons per household, with single male/father households (34 | 3.8%) accounting for the largest median household size of 3.38 persons per household. non-family households (228 | 25.7%) represent the smallest median household size with 1.24 persons per household.
| Household Type | # Households | Household Size |
| Married-Couple | 560 (63.2%) | 3.18 |
| Single Male/Father | 34 (3.8%) | 3.38 |
| Single Female/Mother | 64 (7.2%) | 2.34 |
| Non-family | 228 (25.7%) | 1.24 |
| Total Households | 886 (100.0%) | 2.63 |
Household Size by Marriage Status in Belvedere
Out of a total of 886 households in Belvedere, 658 (74.3%) are family households, while 228 (25.7%) are nonfamily households. The most numerous type of family households are 2-person households, comprising 315, and the most common type of nonfamily households are 1-person households, comprising 195.
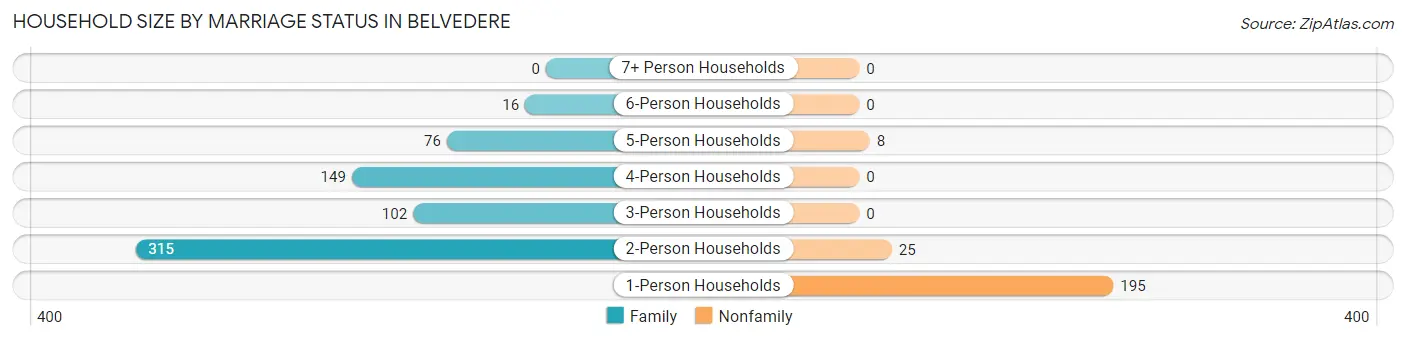
| Household Size | Family Households | Nonfamily Households |
| 1-Person Households | - | 195 (22.0%) |
| 2-Person Households | 315 (35.5%) | 25 (2.8%) |
| 3-Person Households | 102 (11.5%) | 0 (0.0%) |
| 4-Person Households | 149 (16.8%) | 0 (0.0%) |
| 5-Person Households | 76 (8.6%) | 8 (0.9%) |
| 6-Person Households | 16 (1.8%) | 0 (0.0%) |
| 7+ Person Households | 0 (0.0%) | 0 (0.0%) |
| Total | 658 (74.3%) | 228 (25.7%) |
Female Fertility in Belvedere
Fertility by Age in Belvedere
Average fertility rate in Belvedere is 56.0 births per 1,000 women. Women in the age bracket of 35 to 50 years have the highest fertility rate with 120.0 births per 1,000 women. Women in the age bracket of 35 to 50 years acount for 84.6% of all women with births.
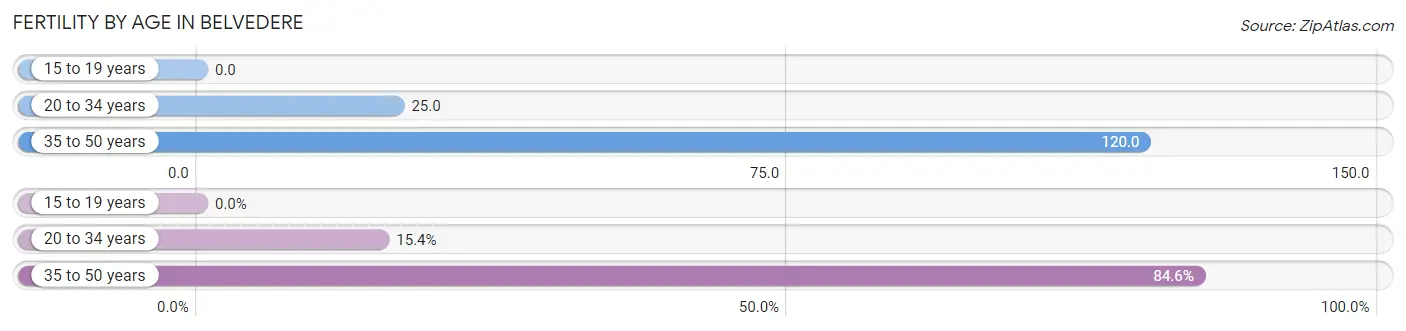
| Age Bracket | Women with Births | Births / 1,000 Women |
| 15 to 19 years | 0 (0.0%) | 0.0 |
| 20 to 34 years | 4 (15.4%) | 25.0 |
| 35 to 50 years | 22 (84.6%) | 120.0 |
| Total | 26 (100.0%) | 56.0 |
Fertility by Age by Marriage Status in Belvedere
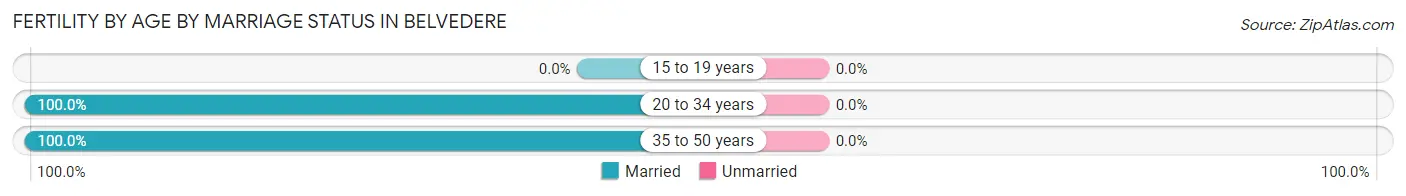
| Age Bracket | Married | Unmarried |
| 15 to 19 years | 0 (0.0%) | 0 (0.0%) |
| 20 to 34 years | 4 (100.0%) | 0 (0.0%) |
| 35 to 50 years | 22 (100.0%) | 0 (0.0%) |
| Total | 26 (100.0%) | 0 (0.0%) |
Fertility by Education in Belvedere
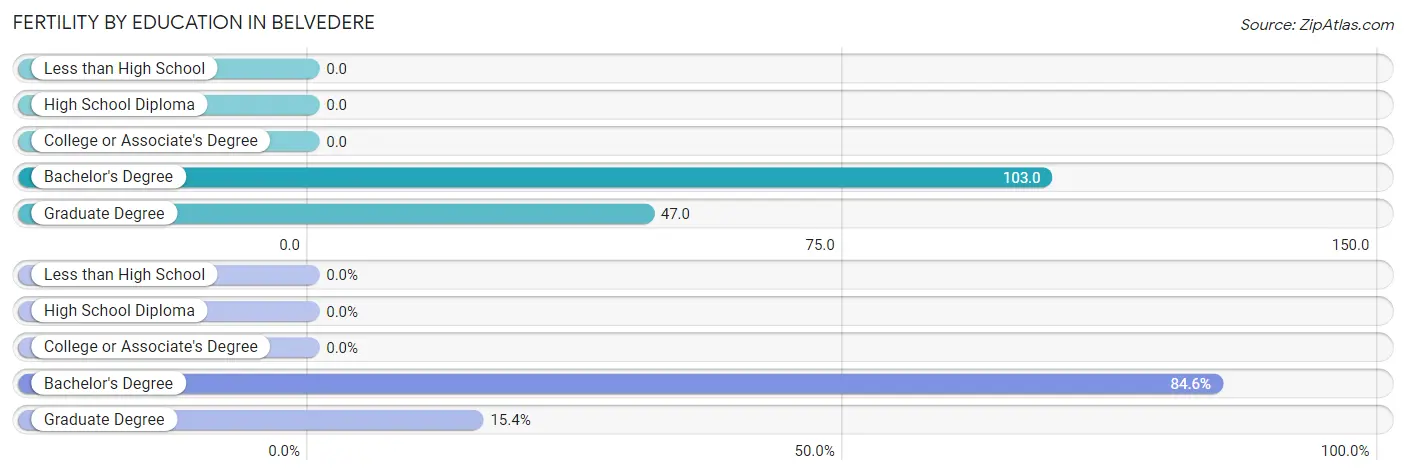
| Educational Attainment | Women with Births | Births / 1,000 Women |
| Less than High School | 0 (0.0%) | 0.0 |
| High School Diploma | 0 (0.0%) | 0.0 |
| College or Associate's Degree | 0 (0.0%) | 0.0 |
| Bachelor's Degree | 22 (84.6%) | 103.0 |
| Graduate Degree | 4 (15.4%) | 47.0 |
| Total | 26 (100.0%) | 56.0 |
Fertility by Education by Marriage Status in Belvedere
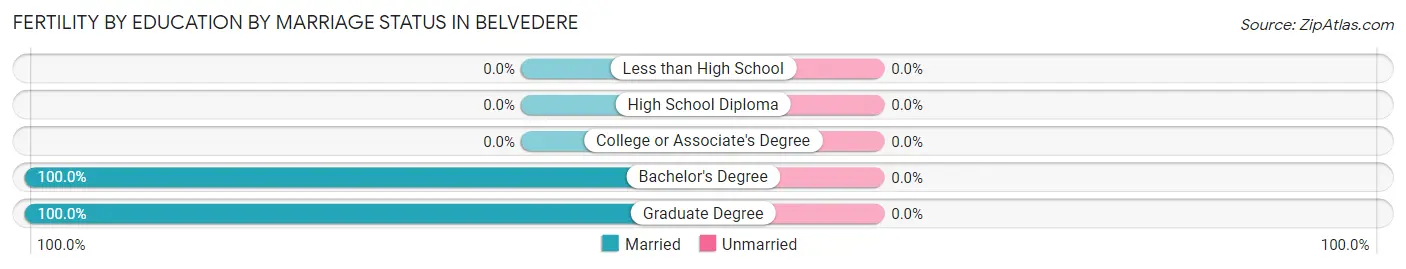
| Educational Attainment | Married | Unmarried |
| Less than High School | 0 (0.0%) | 0 (0.0%) |
| High School Diploma | 0 (0.0%) | 0 (0.0%) |
| College or Associate's Degree | 0 (0.0%) | 0 (0.0%) |
| Bachelor's Degree | 22 (100.0%) | 0 (0.0%) |
| Graduate Degree | 4 (100.0%) | 0 (0.0%) |
| Total | 26 (100.0%) | 0 (0.0%) |
Employment Characteristics in Belvedere
Employment by Class of Employer in Belvedere
Among the 868 employed individuals in Belvedere, private company employees (533 | 61.4%), self-employed (not incorporated) (154 | 17.7%), and self-employed (incorporated) (85 | 9.8%) make up the most common classes of employment.
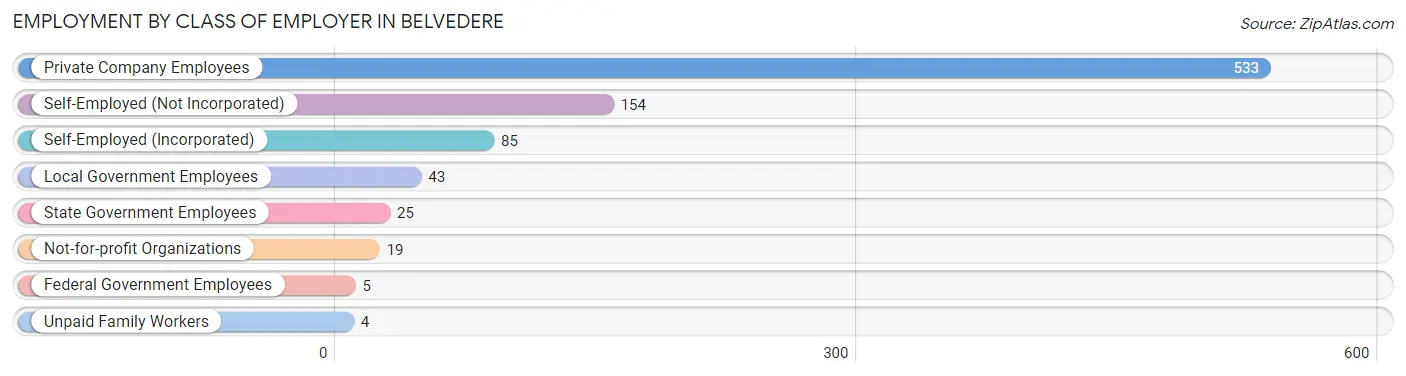
| Employer Class | # Employees | % Employees |
| Private Company Employees | 533 | 61.4% |
| Self-Employed (Incorporated) | 85 | 9.8% |
| Self-Employed (Not Incorporated) | 154 | 17.7% |
| Not-for-profit Organizations | 19 | 2.2% |
| Local Government Employees | 43 | 5.0% |
| State Government Employees | 25 | 2.9% |
| Federal Government Employees | 5 | 0.6% |
| Unpaid Family Workers | 4 | 0.5% |
| Total | 868 | 100.0% |
Employment Status by Age in Belvedere
According to the labor force statistics for Belvedere, out of the total population over 16 years of age (1,865), 50.0% or 932 individuals are in the labor force, with 1.4% or 13 of them unemployed. The age group with the highest labor force participation rate is 25 to 29 years, with 90.1% or 82 individuals in the labor force. Within the labor force, the 55 to 59 years age range has the highest percentage of unemployed individuals, with 3.9% or 5 of them being unemployed.
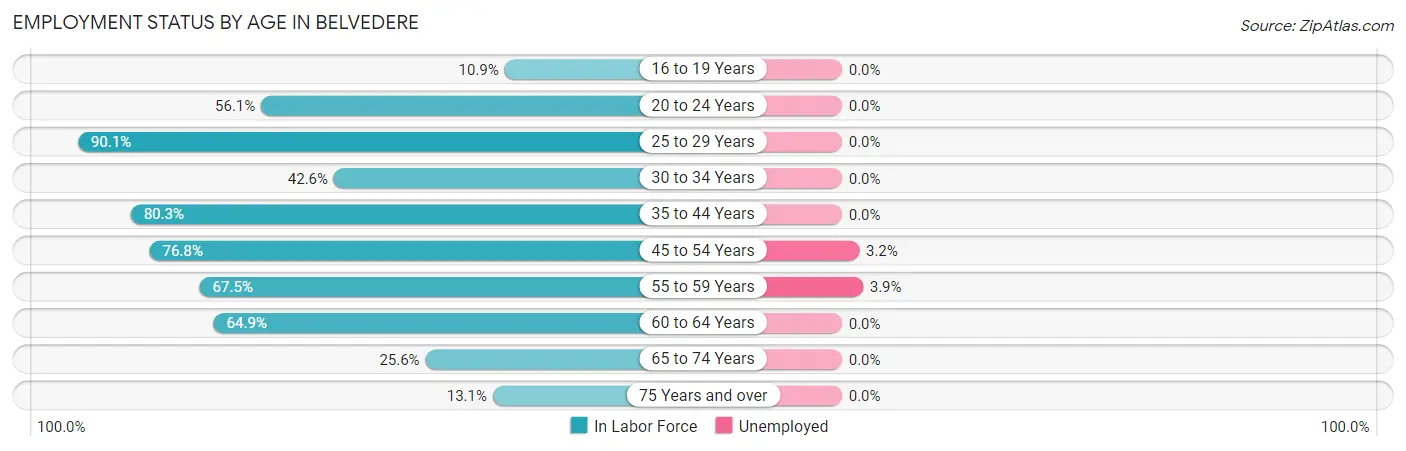
| Age Bracket | In Labor Force | Unemployed |
| 16 to 19 Years | 19 (10.9%) | 0 (0.0%) |
| 20 to 24 Years | 23 (56.1%) | 0 (0.0%) |
| 25 to 29 Years | 82 (90.1%) | 0 (0.0%) |
| 30 to 34 Years | 20 (42.6%) | 0 (0.0%) |
| 35 to 44 Years | 171 (80.3%) | 0 (0.0%) |
| 45 to 54 Years | 252 (76.8%) | 8 (3.2%) |
| 55 to 59 Years | 129 (67.5%) | 5 (3.9%) |
| 60 to 64 Years | 126 (64.9%) | 0 (0.0%) |
| 65 to 74 Years | 70 (25.6%) | 0 (0.0%) |
| 75 Years and over | 41 (13.1%) | 0 (0.0%) |
| Total | 932 (50.0%) | 13 (1.4%) |
Employment Status by Educational Attainment in Belvedere
According to labor force statistics for Belvedere, 73.3% of individuals (780) out of the total population between 25 and 64 years of age (1,064) are in the labor force, with 1.7% or 13 of them being unemployed. The group with the highest labor force participation rate are those with the educational attainment of less than high school, with 100.0% or 7 individuals in the labor force. Within the labor force, individuals with bachelor's degree or higher education have the highest percentage of unemployment, with 1.9% or 13 of them being unemployed.
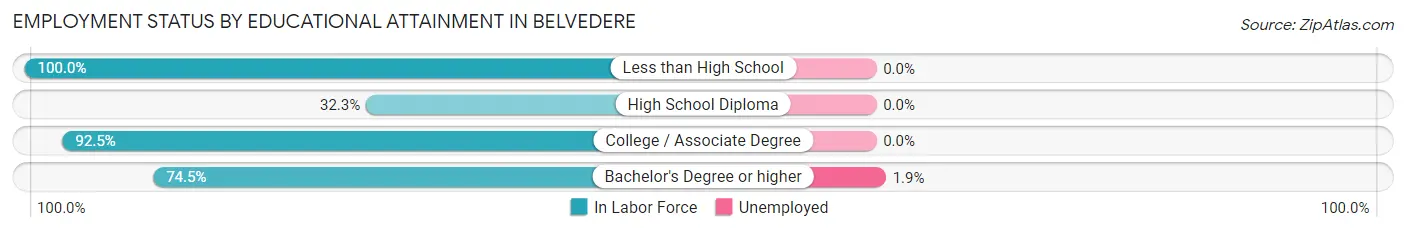
| Educational Attainment | In Labor Force | Unemployed |
| Less than High School | 7 (100.0%) | 0 (0.0%) |
| High School Diploma | 20 (32.3%) | 0 (0.0%) |
| College / Associate Degree | 62 (92.5%) | 0 (0.0%) |
| Bachelor's Degree or higher | 691 (74.5%) | 18 (1.9%) |
| Total | 780 (73.3%) | 18 (1.7%) |
Employment Occupations by Sex in Belvedere
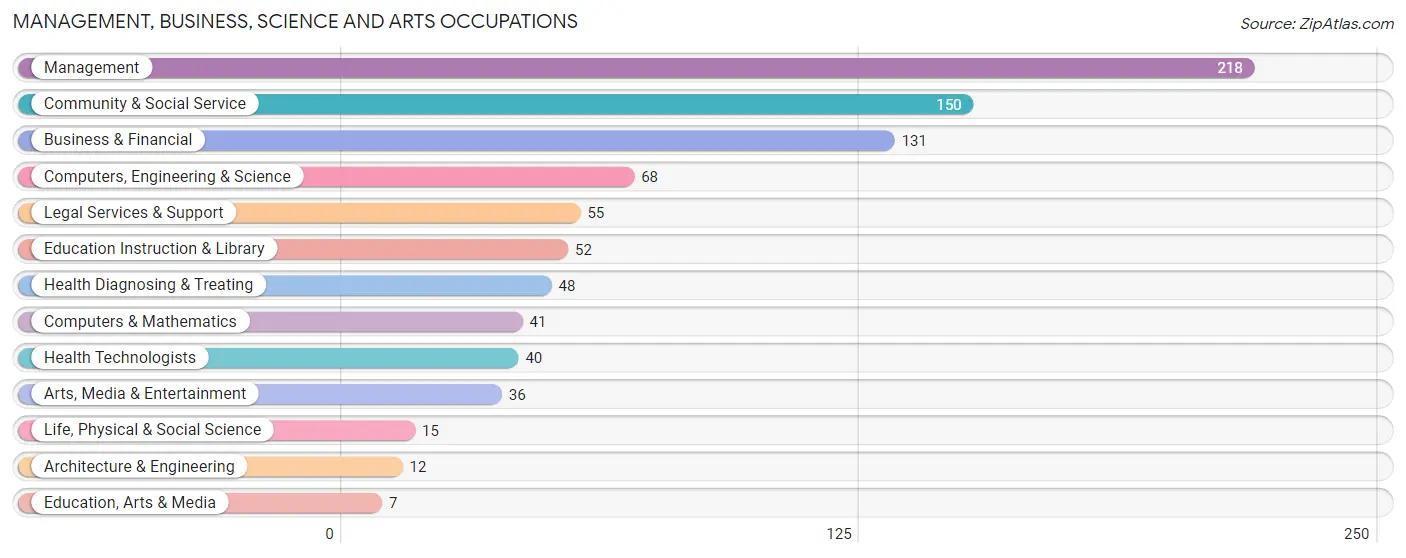
Management, Business, Science and Arts Occupations
The most common Management, Business, Science and Arts occupations in Belvedere are Management (218 | 23.7%), Community & Social Service (150 | 16.3%), Business & Financial (131 | 14.2%), Computers, Engineering & Science (68 | 7.4%), and Legal Services & Support (55 | 6.0%).
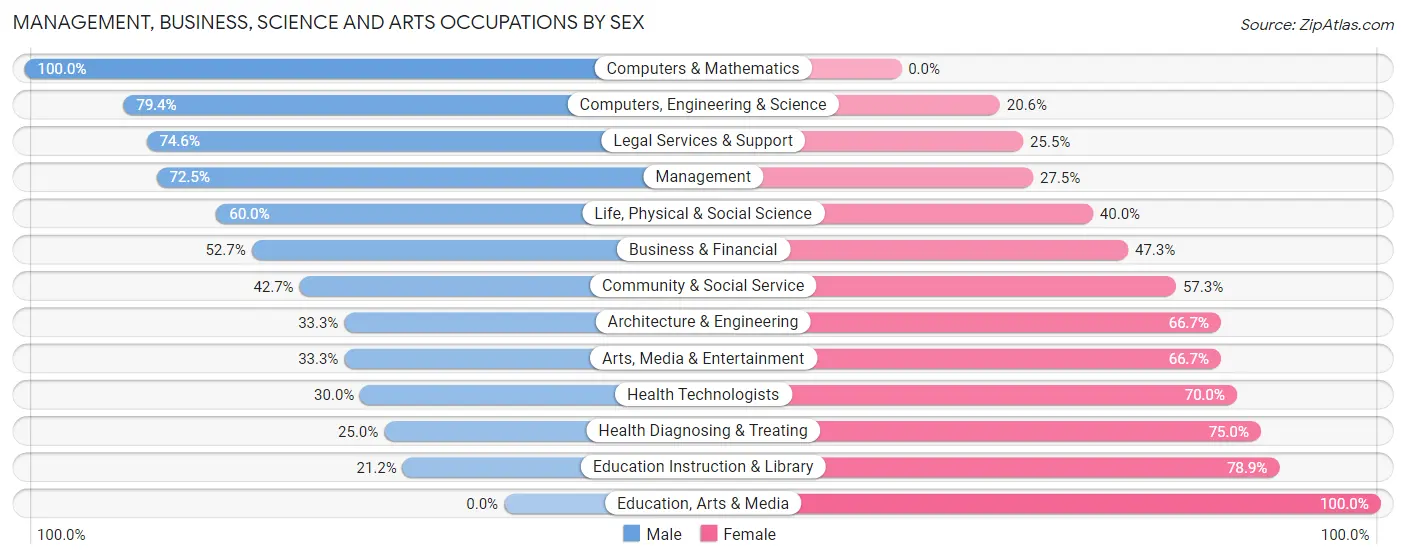
Management, Business, Science and Arts Occupations by Sex
Within the Management, Business, Science and Arts occupations in Belvedere, the most male-oriented occupations are Computers & Mathematics (100.0%), Computers, Engineering & Science (79.4%), and Legal Services & Support (74.6%), while the most female-oriented occupations are Education, Arts & Media (100.0%), Education Instruction & Library (78.8%), and Health Diagnosing & Treating (75.0%).
| Occupation | Male | Female |
| Management | 158 (72.5%) | 60 (27.5%) |
| Business & Financial | 69 (52.7%) | 62 (47.3%) |
| Computers, Engineering & Science | 54 (79.4%) | 14 (20.6%) |
| Computers & Mathematics | 41 (100.0%) | 0 (0.0%) |
| Architecture & Engineering | 4 (33.3%) | 8 (66.7%) |
| Life, Physical & Social Science | 9 (60.0%) | 6 (40.0%) |
| Community & Social Service | 64 (42.7%) | 86 (57.3%) |
| Education, Arts & Media | 0 (0.0%) | 7 (100.0%) |
| Legal Services & Support | 41 (74.6%) | 14 (25.5%) |
| Education Instruction & Library | 11 (21.1%) | 41 (78.8%) |
| Arts, Media & Entertainment | 12 (33.3%) | 24 (66.7%) |
| Health Diagnosing & Treating | 12 (25.0%) | 36 (75.0%) |
| Health Technologists | 12 (30.0%) | 28 (70.0%) |
| Total (Category) | 357 (58.1%) | 258 (41.9%) |
| Total (Overall) | 546 (59.4%) | 374 (40.6%) |
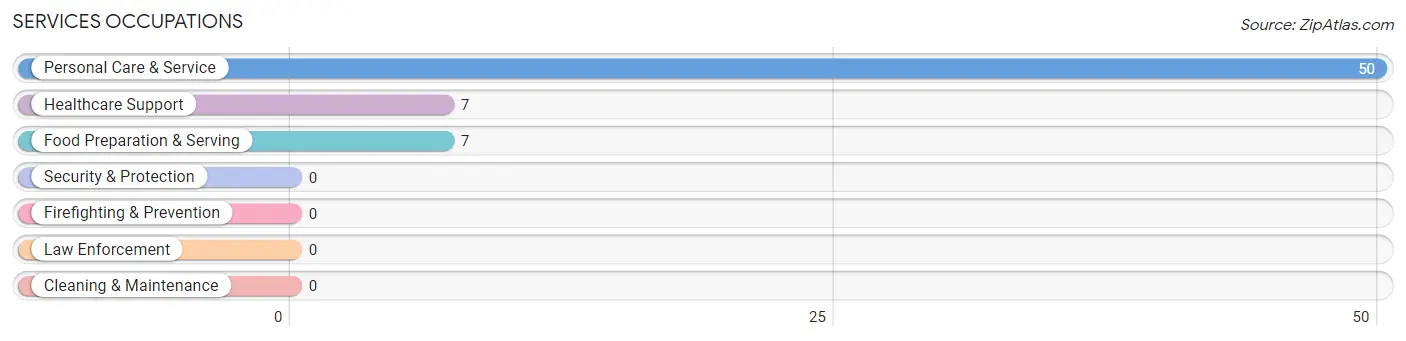
Services Occupations
The most common Services occupations in Belvedere are Personal Care & Service (50 | 5.4%), Healthcare Support (7 | 0.8%), and Food Preparation & Serving (7 | 0.8%).
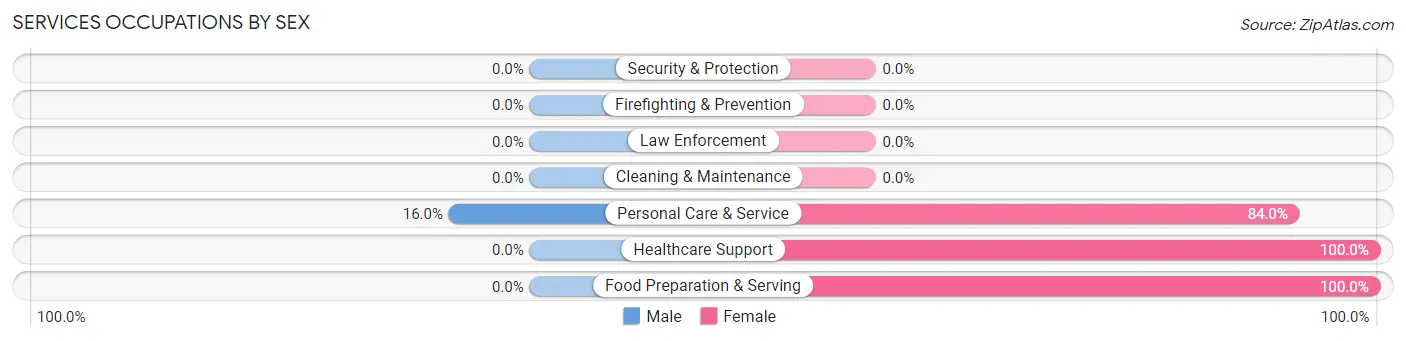
Services Occupations by Sex
| Occupation | Male | Female |
| Healthcare Support | 0 (0.0%) | 7 (100.0%) |
| Security & Protection | 0 (0.0%) | 0 (0.0%) |
| Firefighting & Prevention | 0 (0.0%) | 0 (0.0%) |
| Law Enforcement | 0 (0.0%) | 0 (0.0%) |
| Food Preparation & Serving | 0 (0.0%) | 7 (100.0%) |
| Cleaning & Maintenance | 0 (0.0%) | 0 (0.0%) |
| Personal Care & Service | 8 (16.0%) | 42 (84.0%) |
| Total (Category) | 8 (12.5%) | 56 (87.5%) |
| Total (Overall) | 546 (59.4%) | 374 (40.6%) |
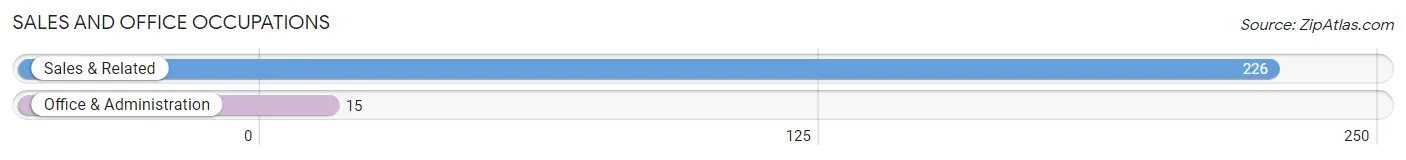
Sales and Office Occupations
The most common Sales and Office occupations in Belvedere are Sales & Related (226 | 24.6%), and Office & Administration (15 | 1.6%).
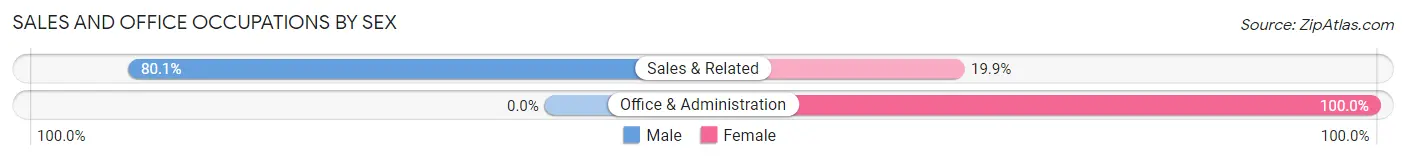
Sales and Office Occupations by Sex
| Occupation | Male | Female |
| Sales & Related | 181 (80.1%) | 45 (19.9%) |
| Office & Administration | 0 (0.0%) | 15 (100.0%) |
| Total (Category) | 181 (75.1%) | 60 (24.9%) |
| Total (Overall) | 546 (59.4%) | 374 (40.6%) |
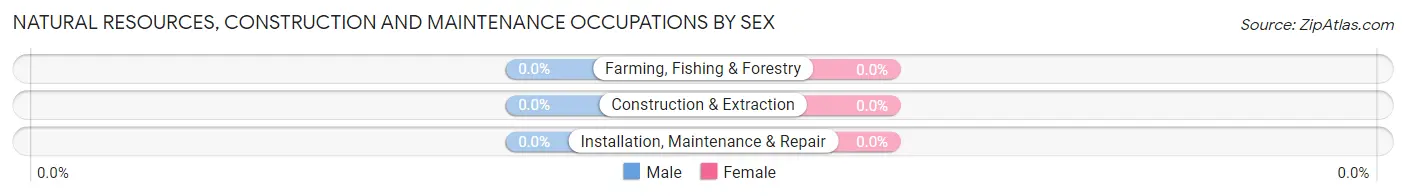
Natural Resources, Construction and Maintenance Occupations

Natural Resources, Construction and Maintenance Occupations by Sex
| Occupation | Male | Female |
| Farming, Fishing & Forestry | 0 (0.0%) | 0 (0.0%) |
| Construction & Extraction | 0 (0.0%) | 0 (0.0%) |
| Installation, Maintenance & Repair | 0 (0.0%) | 0 (0.0%) |
| Total (Category) | 0 (0.0%) | 0 (0.0%) |
| Total (Overall) | 546 (59.4%) | 374 (40.6%) |
Production, Transportation and Moving Occupations
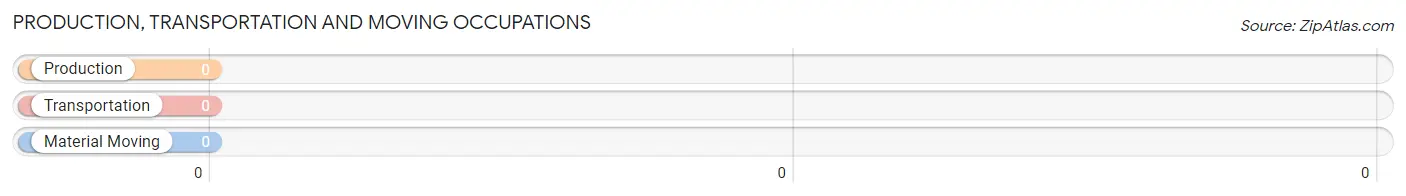
Production, Transportation and Moving Occupations by Sex
| Occupation | Male | Female |
| Production | 0 (0.0%) | 0 (0.0%) |
| Transportation | 0 (0.0%) | 0 (0.0%) |
| Material Moving | 0 (0.0%) | 0 (0.0%) |
| Total (Category) | 0 (0.0%) | 0 (0.0%) |
| Total (Overall) | 546 (59.4%) | 374 (40.6%) |
Employment Industries by Sex in Belvedere
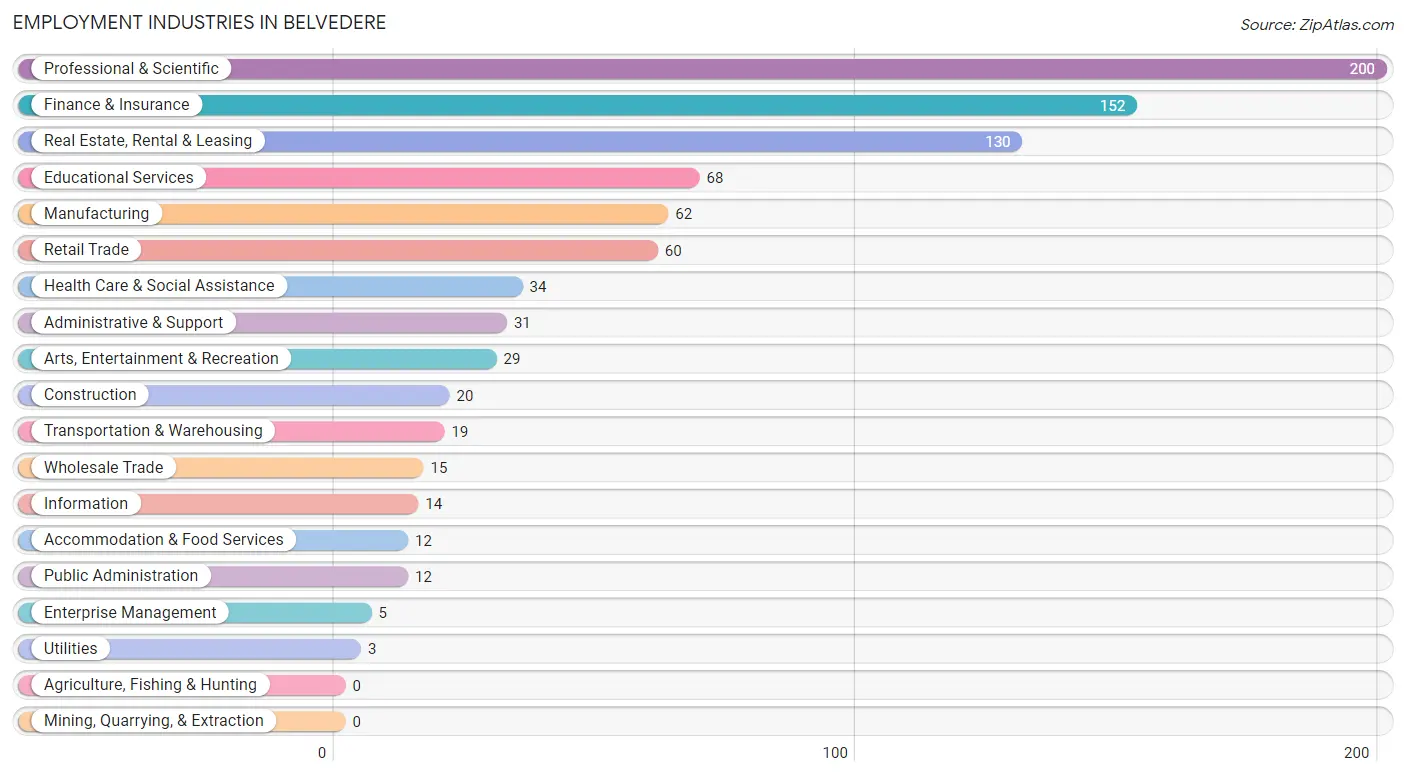
Employment Industries in Belvedere
The major employment industries in Belvedere include Professional & Scientific (200 | 21.7%), Finance & Insurance (152 | 16.5%), Real Estate, Rental & Leasing (130 | 14.1%), Educational Services (68 | 7.4%), and Manufacturing (62 | 6.7%).
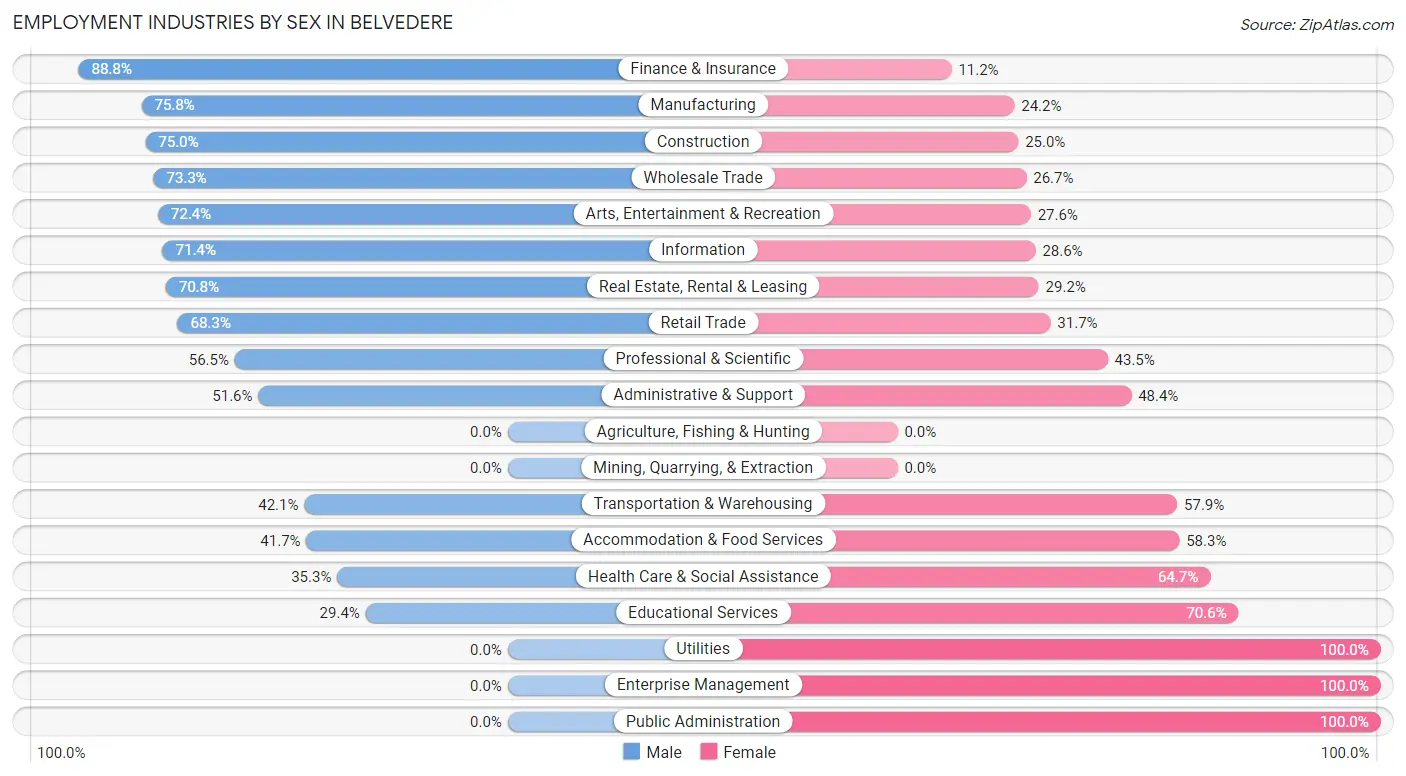
Employment Industries by Sex in Belvedere
The Belvedere industries that see more men than women are Finance & Insurance (88.8%), Manufacturing (75.8%), and Construction (75.0%), whereas the industries that tend to have a higher number of women are Utilities (100.0%), Enterprise Management (100.0%), and Public Administration (100.0%).
| Industry | Male | Female |
| Agriculture, Fishing & Hunting | 0 (0.0%) | 0 (0.0%) |
| Mining, Quarrying, & Extraction | 0 (0.0%) | 0 (0.0%) |
| Construction | 15 (75.0%) | 5 (25.0%) |
| Manufacturing | 47 (75.8%) | 15 (24.2%) |
| Wholesale Trade | 11 (73.3%) | 4 (26.7%) |
| Retail Trade | 41 (68.3%) | 19 (31.7%) |
| Transportation & Warehousing | 8 (42.1%) | 11 (57.9%) |
| Utilities | 0 (0.0%) | 3 (100.0%) |
| Information | 10 (71.4%) | 4 (28.6%) |
| Finance & Insurance | 135 (88.8%) | 17 (11.2%) |
| Real Estate, Rental & Leasing | 92 (70.8%) | 38 (29.2%) |
| Professional & Scientific | 113 (56.5%) | 87 (43.5%) |
| Enterprise Management | 0 (0.0%) | 5 (100.0%) |
| Administrative & Support | 16 (51.6%) | 15 (48.4%) |
| Educational Services | 20 (29.4%) | 48 (70.6%) |
| Health Care & Social Assistance | 12 (35.3%) | 22 (64.7%) |
| Arts, Entertainment & Recreation | 21 (72.4%) | 8 (27.6%) |
| Accommodation & Food Services | 5 (41.7%) | 7 (58.3%) |
| Public Administration | 0 (0.0%) | 12 (100.0%) |
| Total | 546 (59.4%) | 374 (40.6%) |
Education in Belvedere
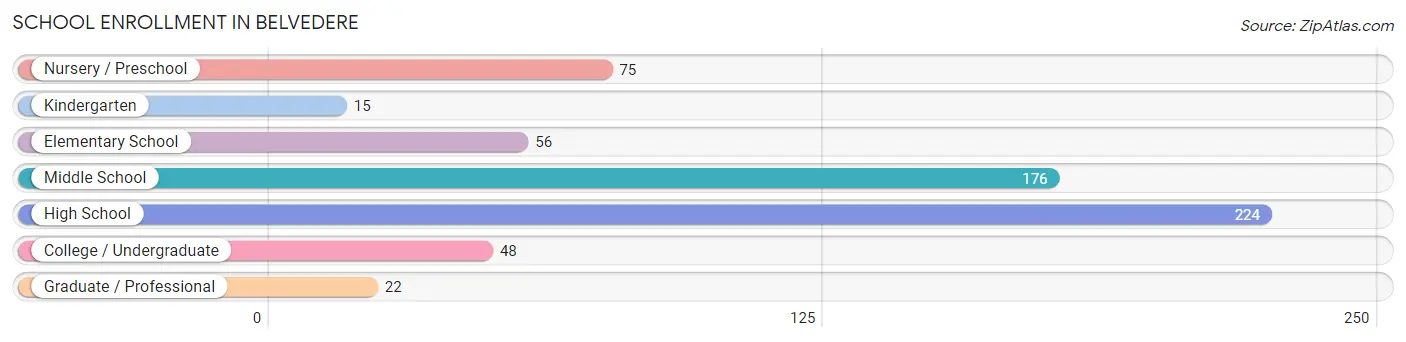
School Enrollment in Belvedere
The most common levels of schooling among the 616 students in Belvedere are high school (224 | 36.4%), middle school (176 | 28.6%), and nursery / preschool (75 | 12.2%).
| School Level | # Students | % Students |
| Nursery / Preschool | 75 | 12.2% |
| Kindergarten | 15 | 2.4% |
| Elementary School | 56 | 9.1% |
| Middle School | 176 | 28.6% |
| High School | 224 | 36.4% |
| College / Undergraduate | 48 | 7.8% |
| Graduate / Professional | 22 | 3.6% |
| Total | 616 | 100.0% |
School Enrollment by Age by Funding Source in Belvedere
Out of a total of 616 students who are enrolled in schools in Belvedere, 341 (55.4%) attend a private institution, while the remaining 275 (44.6%) are enrolled in public schools. The age group of 3 to 4 year olds has the highest likelihood of being enrolled in private schools, with 53 (100.0% in the age bracket) enrolled. Conversely, the age group of 10 to 14 year olds has the lowest likelihood of being enrolled in a private school, with 174 (73.4% in the age bracket) attending a public institution.
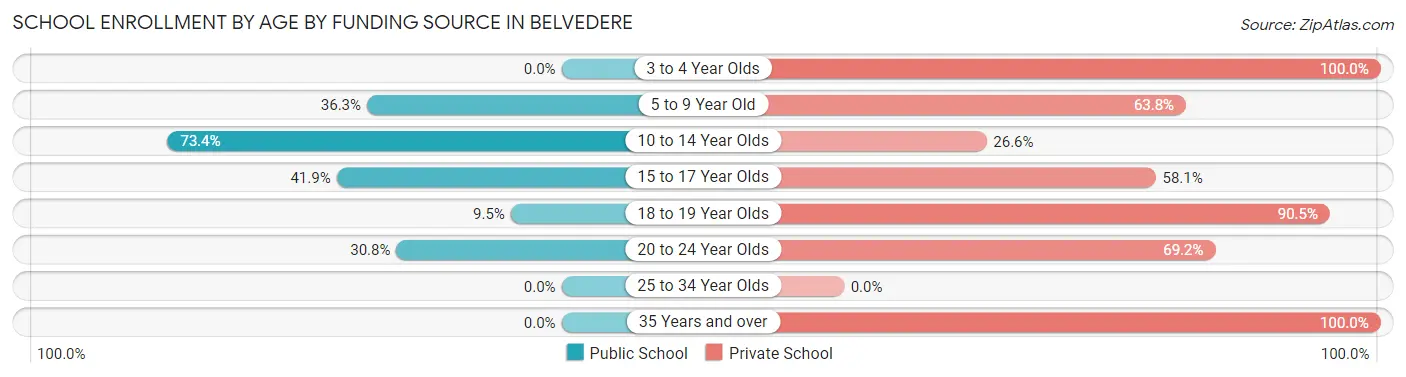
| Age Bracket | Public School | Private School |
| 3 to 4 Year Olds | 0 (0.0%) | 53 (100.0%) |
| 5 to 9 Year Old | 29 (36.2%) | 51 (63.7%) |
| 10 to 14 Year Olds | 174 (73.4%) | 63 (26.6%) |
| 15 to 17 Year Olds | 57 (41.9%) | 79 (58.1%) |
| 18 to 19 Year Olds | 7 (9.5%) | 67 (90.5%) |
| 20 to 24 Year Olds | 8 (30.8%) | 18 (69.2%) |
| 25 to 34 Year Olds | 0 (0.0%) | 0 (0.0%) |
| 35 Years and over | 0 (0.0%) | 10 (100.0%) |
| Total | 275 (44.6%) | 341 (55.4%) |
Educational Attainment by Field of Study in Belvedere
Social sciences (335 | 20.9%), business (297 | 18.5%), literature & languages (113 | 7.0%), engineering (103 | 6.4%), and bio, nature & agricultural (102 | 6.4%) are the most common fields of study among 1,602 individuals in Belvedere who have obtained a bachelor's degree or higher.
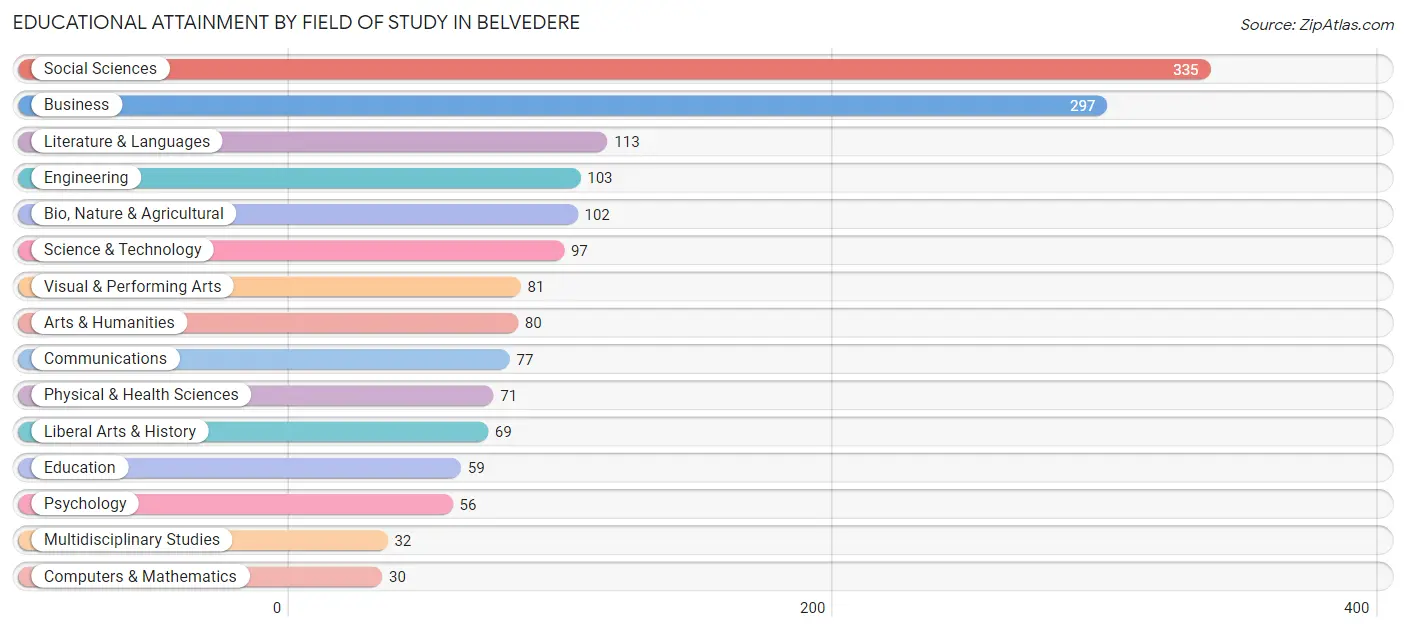
| Field of Study | # Graduates | % Graduates |
| Computers & Mathematics | 30 | 1.9% |
| Bio, Nature & Agricultural | 102 | 6.4% |
| Physical & Health Sciences | 71 | 4.4% |
| Psychology | 56 | 3.5% |
| Social Sciences | 335 | 20.9% |
| Engineering | 103 | 6.4% |
| Multidisciplinary Studies | 32 | 2.0% |
| Science & Technology | 97 | 6.0% |
| Business | 297 | 18.5% |
| Education | 59 | 3.7% |
| Literature & Languages | 113 | 7.0% |
| Liberal Arts & History | 69 | 4.3% |
| Visual & Performing Arts | 81 | 5.1% |
| Communications | 77 | 4.8% |
| Arts & Humanities | 80 | 5.0% |
| Total | 1,602 | 100.0% |
Transportation & Commute in Belvedere
Vehicle Availability by Sex in Belvedere
The most prevalent vehicle ownership categories in Belvedere are males with 2 vehicles (202, accounting for 38.9%) and females with 2 vehicles (135, making up 58.1%).
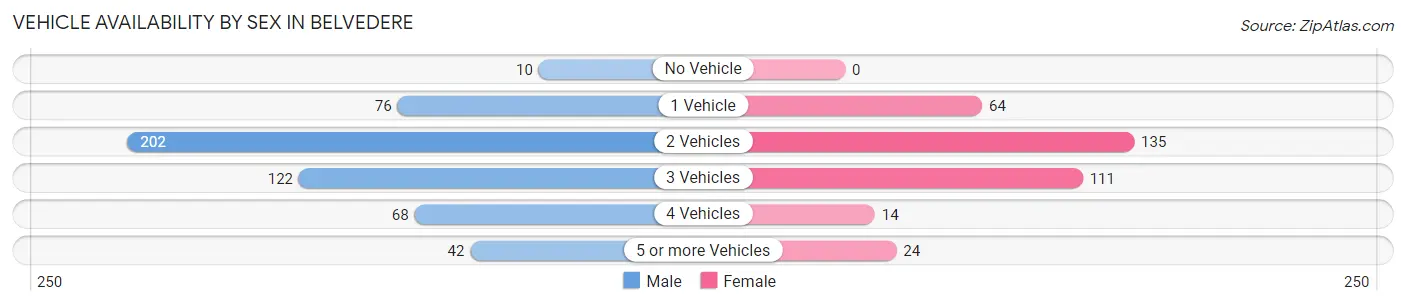
| Vehicles Available | Male | Female |
| No Vehicle | 10 (1.9%) | 0 (0.0%) |
| 1 Vehicle | 76 (14.6%) | 64 (18.4%) |
| 2 Vehicles | 202 (38.9%) | 135 (38.8%) |
| 3 Vehicles | 122 (23.5%) | 111 (31.9%) |
| 4 Vehicles | 68 (13.1%) | 14 (4.0%) |
| 5 or more Vehicles | 42 (8.1%) | 24 (6.9%) |
| Total | 520 (100.0%) | 348 (100.0%) |
Commute Time in Belvedere
The most frequently occuring commute durations in Belvedere are 45 to 59 minutes (88 commuters, 17.8%), 60 to 89 minutes (76 commuters, 15.3%), and 30 to 34 minutes (70 commuters, 14.1%).
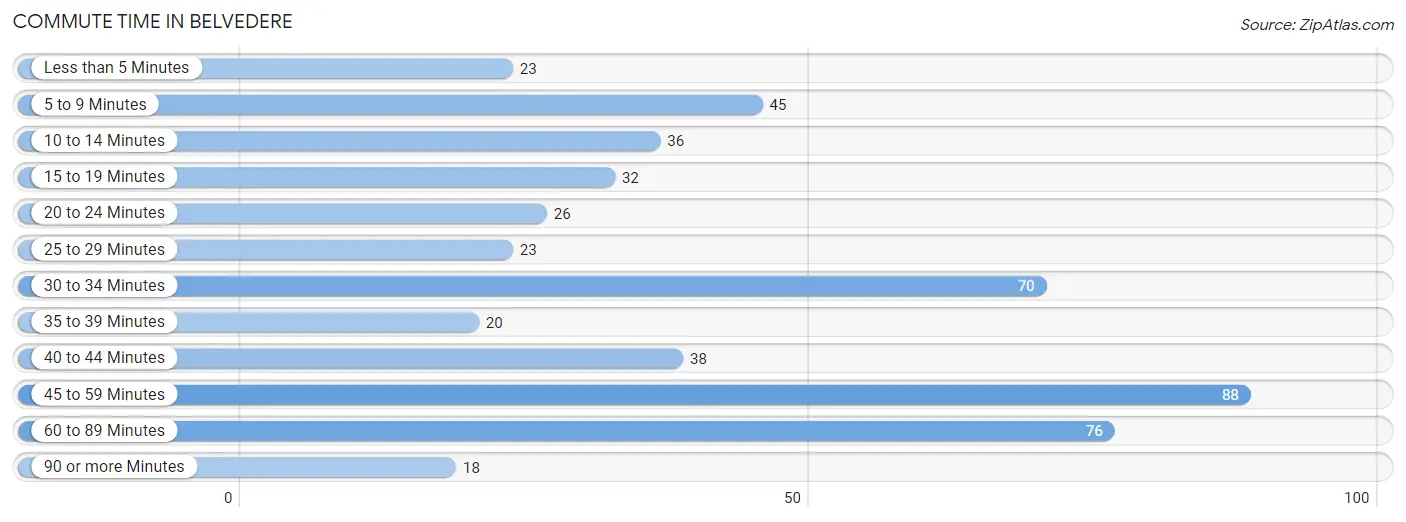
| Commute Time | # Commuters | % Commuters |
| Less than 5 Minutes | 23 | 4.6% |
| 5 to 9 Minutes | 45 | 9.1% |
| 10 to 14 Minutes | 36 | 7.3% |
| 15 to 19 Minutes | 32 | 6.5% |
| 20 to 24 Minutes | 26 | 5.2% |
| 25 to 29 Minutes | 23 | 4.6% |
| 30 to 34 Minutes | 70 | 14.1% |
| 35 to 39 Minutes | 20 | 4.0% |
| 40 to 44 Minutes | 38 | 7.7% |
| 45 to 59 Minutes | 88 | 17.8% |
| 60 to 89 Minutes | 76 | 15.3% |
| 90 or more Minutes | 18 | 3.6% |
Commute Time by Sex in Belvedere
The most common commute times in Belvedere are 45 to 59 minutes (76 commuters, 23.2%) for males and 30 to 34 minutes (49 commuters, 29.2%) for females.
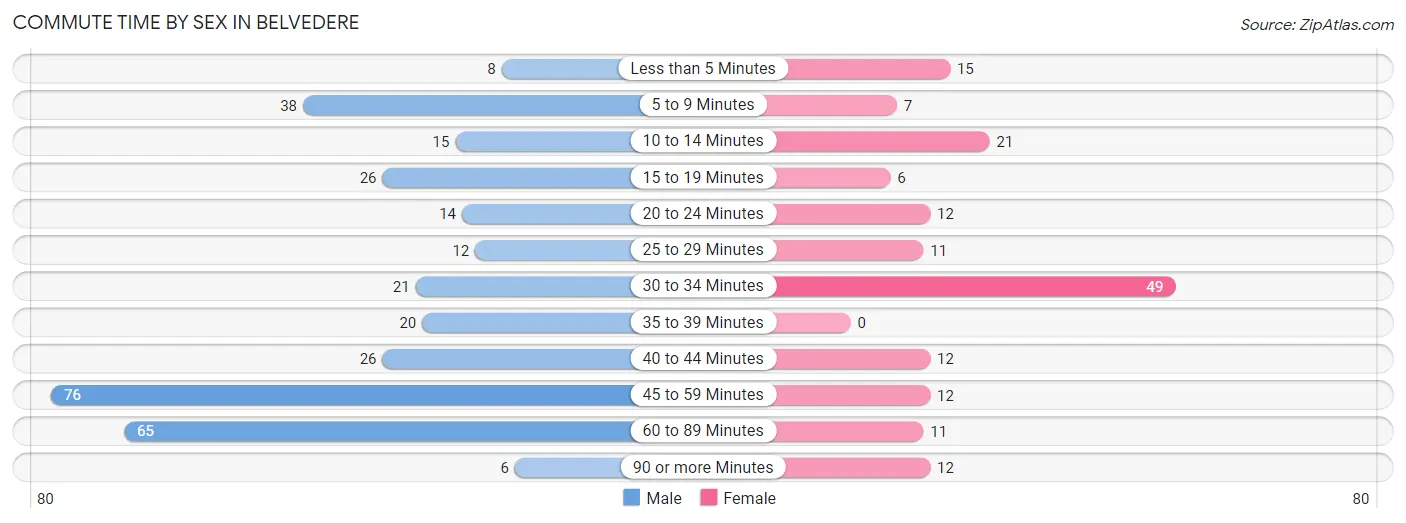
| Commute Time | Male | Female |
| Less than 5 Minutes | 8 (2.5%) | 15 (8.9%) |
| 5 to 9 Minutes | 38 (11.6%) | 7 (4.2%) |
| 10 to 14 Minutes | 15 (4.6%) | 21 (12.5%) |
| 15 to 19 Minutes | 26 (8.0%) | 6 (3.6%) |
| 20 to 24 Minutes | 14 (4.3%) | 12 (7.1%) |
| 25 to 29 Minutes | 12 (3.7%) | 11 (6.6%) |
| 30 to 34 Minutes | 21 (6.4%) | 49 (29.2%) |
| 35 to 39 Minutes | 20 (6.1%) | 0 (0.0%) |
| 40 to 44 Minutes | 26 (8.0%) | 12 (7.1%) |
| 45 to 59 Minutes | 76 (23.2%) | 12 (7.1%) |
| 60 to 89 Minutes | 65 (19.9%) | 11 (6.6%) |
| 90 or more Minutes | 6 (1.8%) | 12 (7.1%) |
Time of Departure to Work by Sex in Belvedere
The most frequent times of departure to work in Belvedere are 8:00 AM to 8:29 AM (94, 28.7%) for males and 8:00 AM to 8:29 AM (33, 19.6%) for females.
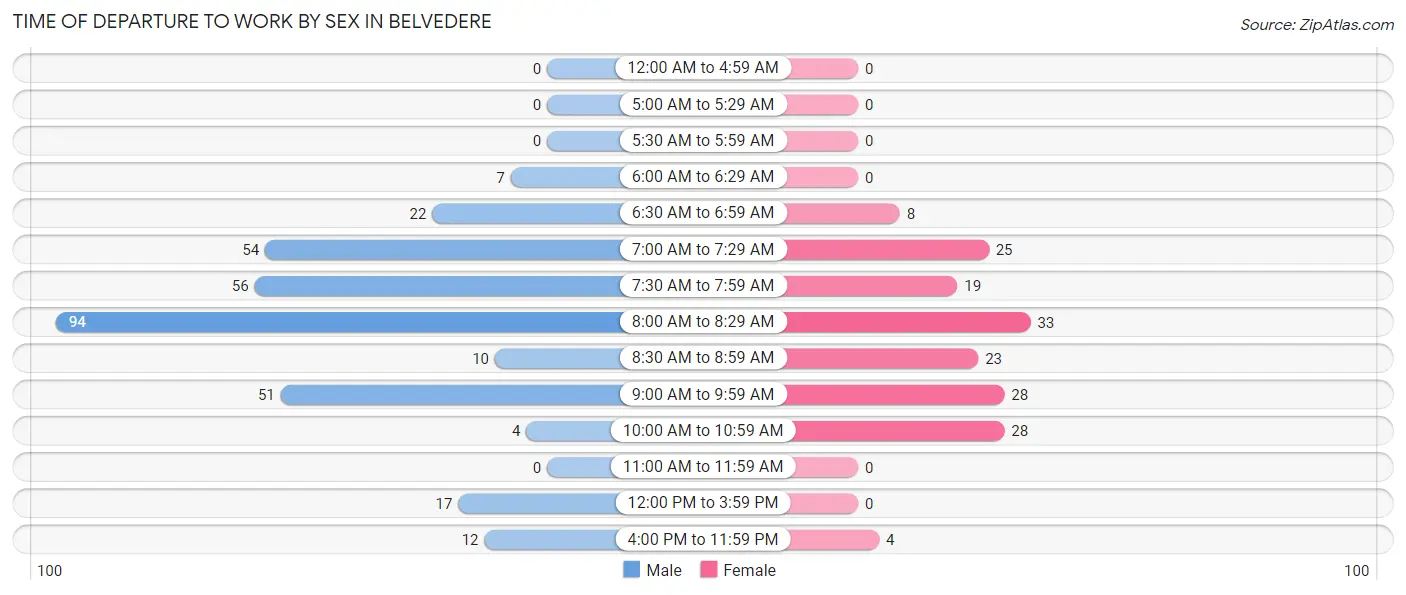
| Time of Departure | Male | Female |
| 12:00 AM to 4:59 AM | 0 (0.0%) | 0 (0.0%) |
| 5:00 AM to 5:29 AM | 0 (0.0%) | 0 (0.0%) |
| 5:30 AM to 5:59 AM | 0 (0.0%) | 0 (0.0%) |
| 6:00 AM to 6:29 AM | 7 (2.1%) | 0 (0.0%) |
| 6:30 AM to 6:59 AM | 22 (6.7%) | 8 (4.8%) |
| 7:00 AM to 7:29 AM | 54 (16.5%) | 25 (14.9%) |
| 7:30 AM to 7:59 AM | 56 (17.1%) | 19 (11.3%) |
| 8:00 AM to 8:29 AM | 94 (28.7%) | 33 (19.6%) |
| 8:30 AM to 8:59 AM | 10 (3.1%) | 23 (13.7%) |
| 9:00 AM to 9:59 AM | 51 (15.6%) | 28 (16.7%) |
| 10:00 AM to 10:59 AM | 4 (1.2%) | 28 (16.7%) |
| 11:00 AM to 11:59 AM | 0 (0.0%) | 0 (0.0%) |
| 12:00 PM to 3:59 PM | 17 (5.2%) | 0 (0.0%) |
| 4:00 PM to 11:59 PM | 12 (3.7%) | 4 (2.4%) |
| Total | 327 (100.0%) | 168 (100.0%) |
Housing Occupancy in Belvedere
Occupancy by Ownership in Belvedere
Of the total 886 dwellings in Belvedere, owner-occupied units account for 659 (74.4%), while renter-occupied units make up 227 (25.6%).
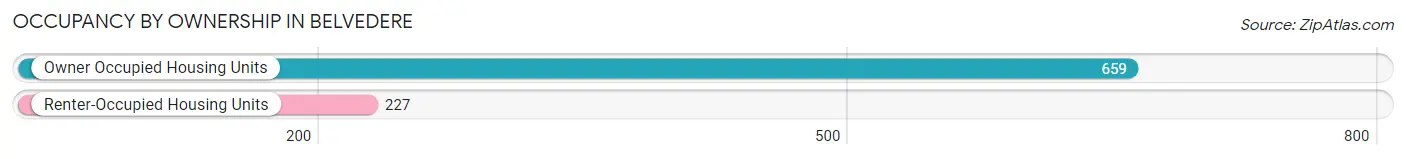
| Occupancy | # Housing Units | % Housing Units |
| Owner Occupied Housing Units | 659 | 74.4% |
| Renter-Occupied Housing Units | 227 | 25.6% |
| Total Occupied Housing Units | 886 | 100.0% |
Occupancy by Household Size in Belvedere
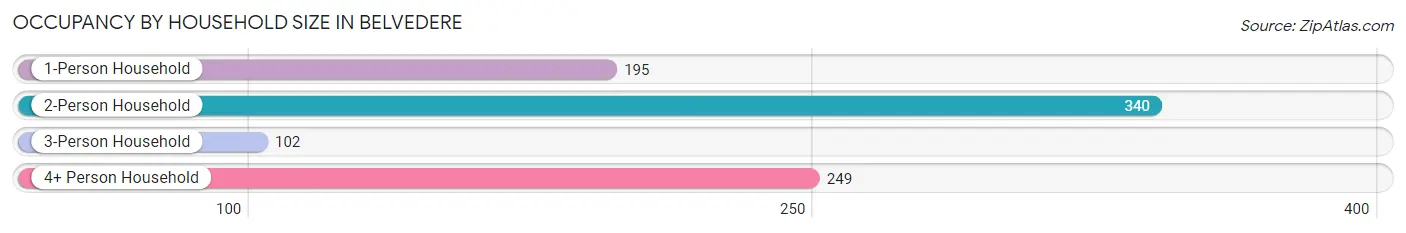
| Household Size | # Housing Units | % Housing Units |
| 1-Person Household | 195 | 22.0% |
| 2-Person Household | 340 | 38.4% |
| 3-Person Household | 102 | 11.5% |
| 4+ Person Household | 249 | 28.1% |
| Total Housing Units | 886 | 100.0% |
Occupancy by Ownership by Household Size in Belvedere
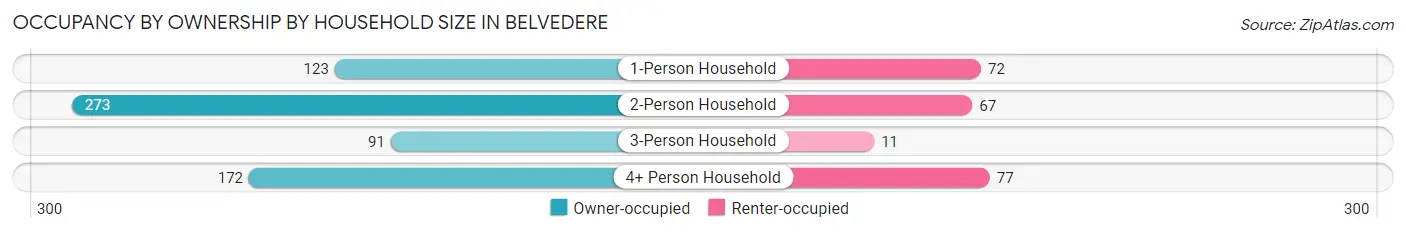
| Household Size | Owner-occupied | Renter-occupied |
| 1-Person Household | 123 (63.1%) | 72 (36.9%) |
| 2-Person Household | 273 (80.3%) | 67 (19.7%) |
| 3-Person Household | 91 (89.2%) | 11 (10.8%) |
| 4+ Person Household | 172 (69.1%) | 77 (30.9%) |
| Total Housing Units | 659 (74.4%) | 227 (25.6%) |
Occupancy by Educational Attainment in Belvedere
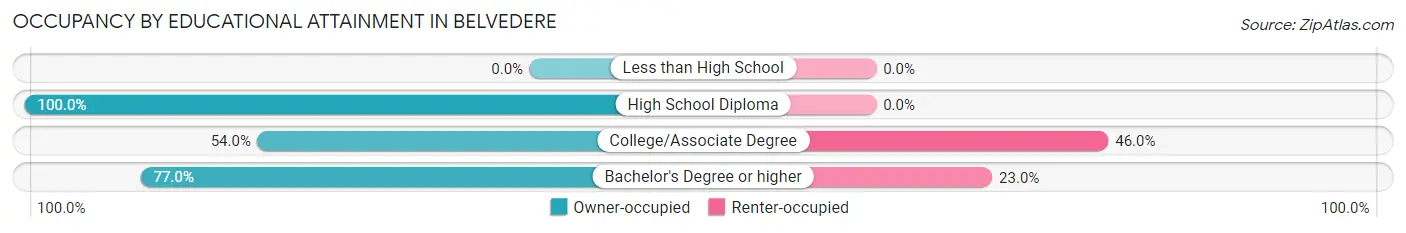
| Household Size | Owner-occupied | Renter-occupied |
| Less than High School | 0 (0.0%) | 0 (0.0%) |
| High School Diploma | 12 (100.0%) | 0 (0.0%) |
| College/Associate Degree | 61 (54.0%) | 52 (46.0%) |
| Bachelor's Degree or higher | 586 (77.0%) | 175 (23.0%) |
Occupancy by Age of Householder in Belvedere
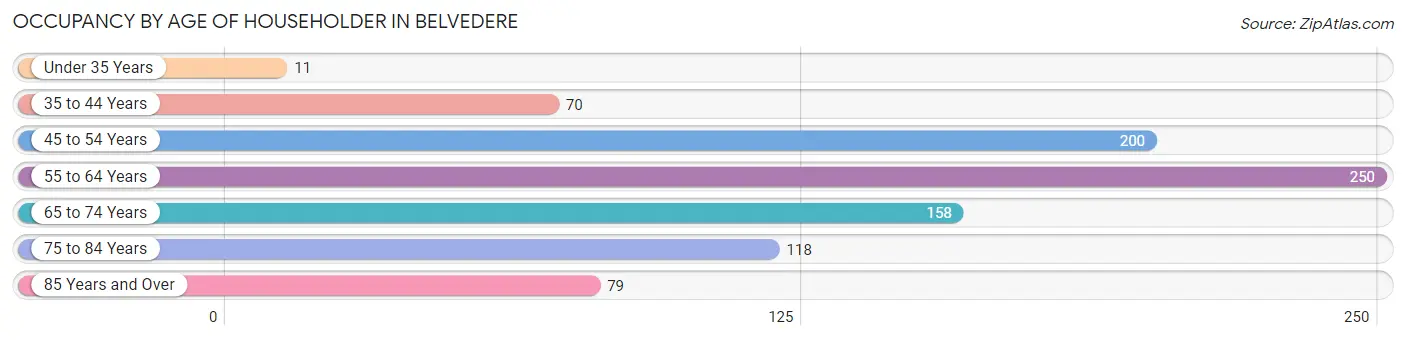
| Age Bracket | # Households | % Households |
| Under 35 Years | 11 | 1.2% |
| 35 to 44 Years | 70 | 7.9% |
| 45 to 54 Years | 200 | 22.6% |
| 55 to 64 Years | 250 | 28.2% |
| 65 to 74 Years | 158 | 17.8% |
| 75 to 84 Years | 118 | 13.3% |
| 85 Years and Over | 79 | 8.9% |
| Total | 886 | 100.0% |
Housing Finances in Belvedere
Median Income by Occupancy in Belvedere
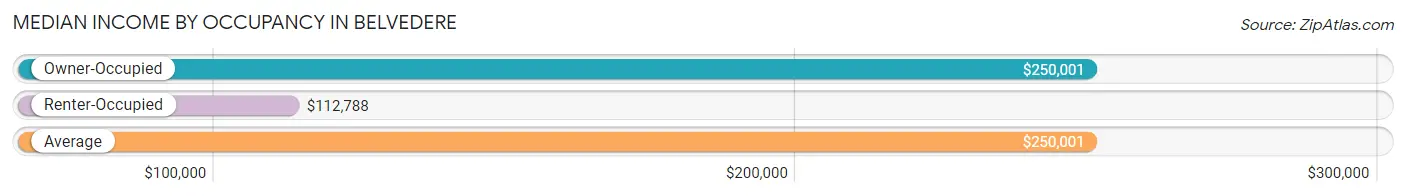
| Occupancy Type | # Households | Median Income |
| Owner-Occupied | 659 (74.4%) | $250,001 |
| Renter-Occupied | 227 (25.6%) | $112,788 |
| Average | 886 (100.0%) | $250,001 |
Occupancy by Householder Income Bracket in Belvedere
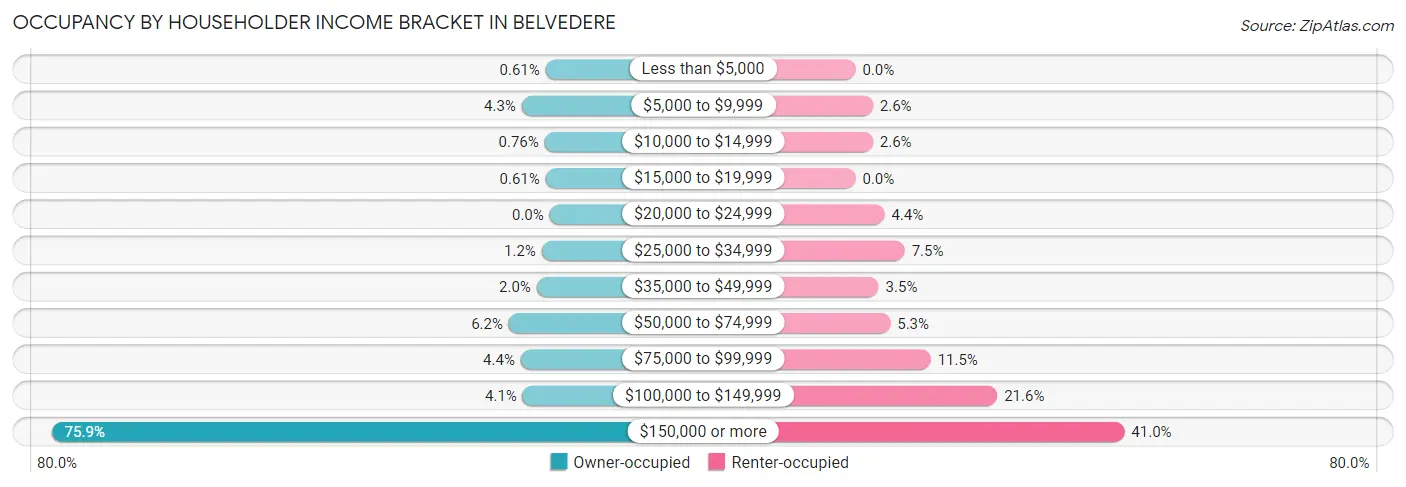
| Income Bracket | Owner-occupied | Renter-occupied |
| Less than $5,000 | 4 (0.6%) | 0 (0.0%) |
| $5,000 to $9,999 | 28 (4.3%) | 6 (2.6%) |
| $10,000 to $14,999 | 5 (0.8%) | 6 (2.6%) |
| $15,000 to $19,999 | 4 (0.6%) | 0 (0.0%) |
| $20,000 to $24,999 | 0 (0.0%) | 10 (4.4%) |
| $25,000 to $34,999 | 8 (1.2%) | 17 (7.5%) |
| $35,000 to $49,999 | 13 (2.0%) | 8 (3.5%) |
| $50,000 to $74,999 | 41 (6.2%) | 12 (5.3%) |
| $75,000 to $99,999 | 29 (4.4%) | 26 (11.5%) |
| $100,000 to $149,999 | 27 (4.1%) | 49 (21.6%) |
| $150,000 or more | 500 (75.9%) | 93 (41.0%) |
| Total | 659 (100.0%) | 227 (100.0%) |
Monthly Housing Cost Tiers in Belvedere
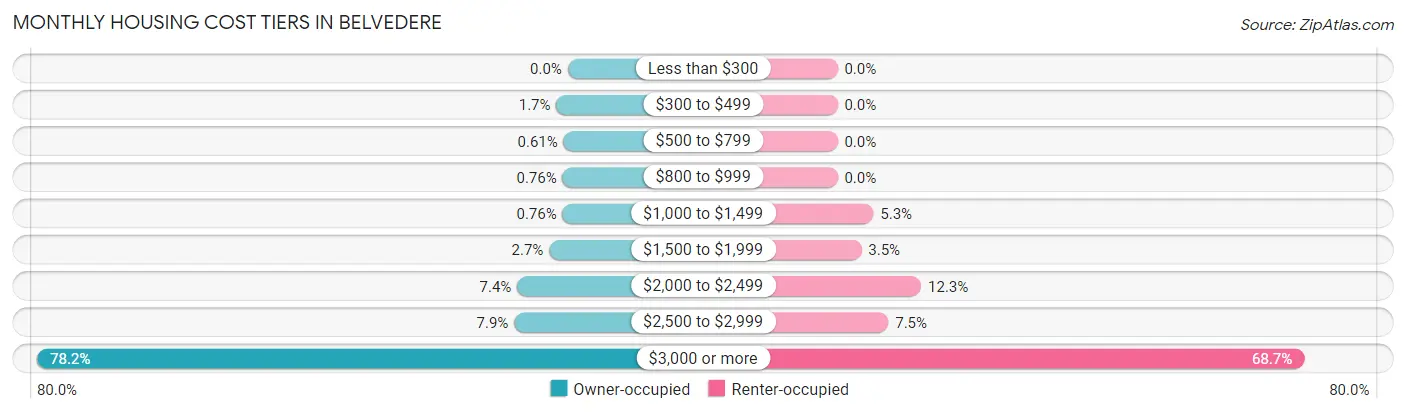
| Monthly Cost | Owner-occupied | Renter-occupied |
| Less than $300 | 0 (0.0%) | 0 (0.0%) |
| $300 to $499 | 11 (1.7%) | 0 (0.0%) |
| $500 to $799 | 4 (0.6%) | 0 (0.0%) |
| $800 to $999 | 5 (0.8%) | 0 (0.0%) |
| $1,000 to $1,499 | 5 (0.8%) | 12 (5.3%) |
| $1,500 to $1,999 | 18 (2.7%) | 8 (3.5%) |
| $2,000 to $2,499 | 49 (7.4%) | 28 (12.3%) |
| $2,500 to $2,999 | 52 (7.9%) | 17 (7.5%) |
| $3,000 or more | 515 (78.1%) | 156 (68.7%) |
| Total | 659 (100.0%) | 227 (100.0%) |
Physical Housing Characteristics in Belvedere
Housing Structures in Belvedere
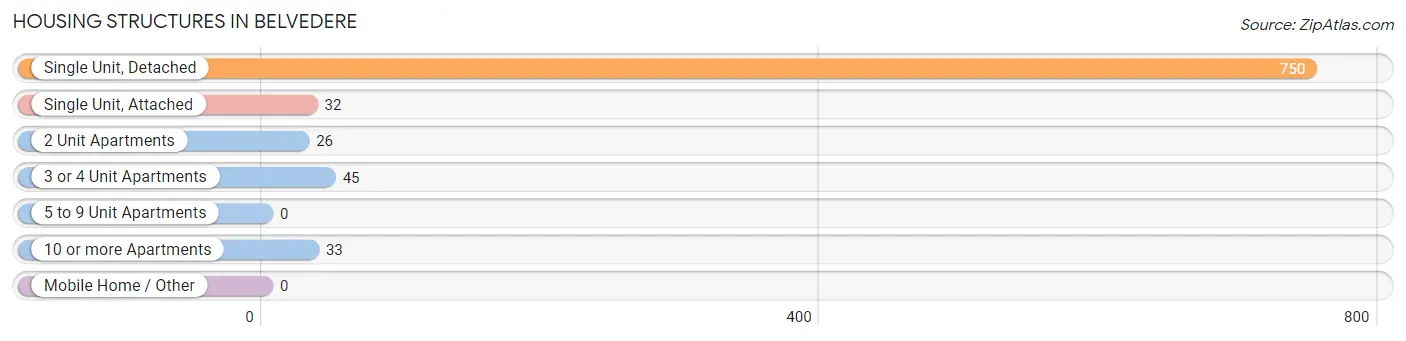
| Structure Type | # Housing Units | % Housing Units |
| Single Unit, Detached | 750 | 84.7% |
| Single Unit, Attached | 32 | 3.6% |
| 2 Unit Apartments | 26 | 2.9% |
| 3 or 4 Unit Apartments | 45 | 5.1% |
| 5 to 9 Unit Apartments | 0 | 0.0% |
| 10 or more Apartments | 33 | 3.7% |
| Mobile Home / Other | 0 | 0.0% |
| Total | 886 | 100.0% |
Housing Structures by Occupancy in Belvedere
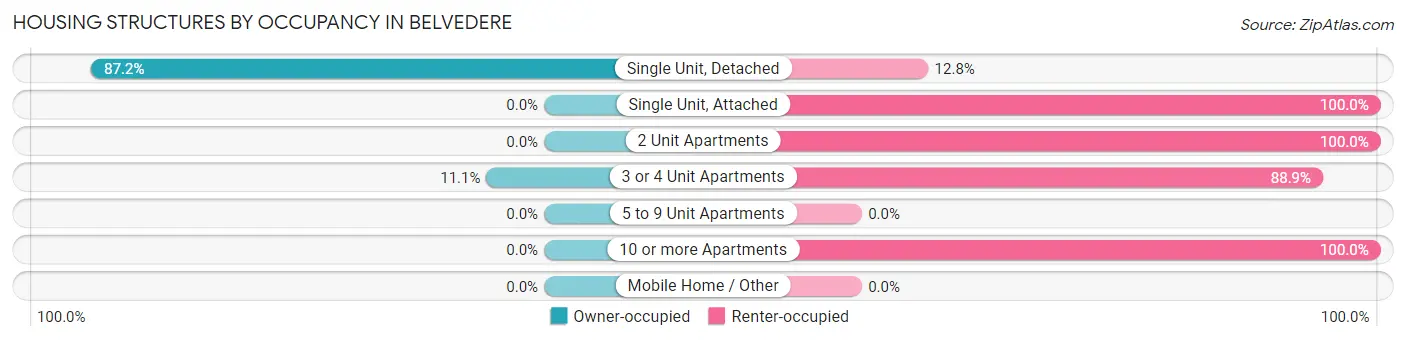
| Structure Type | Owner-occupied | Renter-occupied |
| Single Unit, Detached | 654 (87.2%) | 96 (12.8%) |
| Single Unit, Attached | 0 (0.0%) | 32 (100.0%) |
| 2 Unit Apartments | 0 (0.0%) | 26 (100.0%) |
| 3 or 4 Unit Apartments | 5 (11.1%) | 40 (88.9%) |
| 5 to 9 Unit Apartments | 0 (0.0%) | 0 (0.0%) |
| 10 or more Apartments | 0 (0.0%) | 33 (100.0%) |
| Mobile Home / Other | 0 (0.0%) | 0 (0.0%) |
| Total | 659 (74.4%) | 227 (25.6%) |
Housing Structures by Number of Rooms in Belvedere
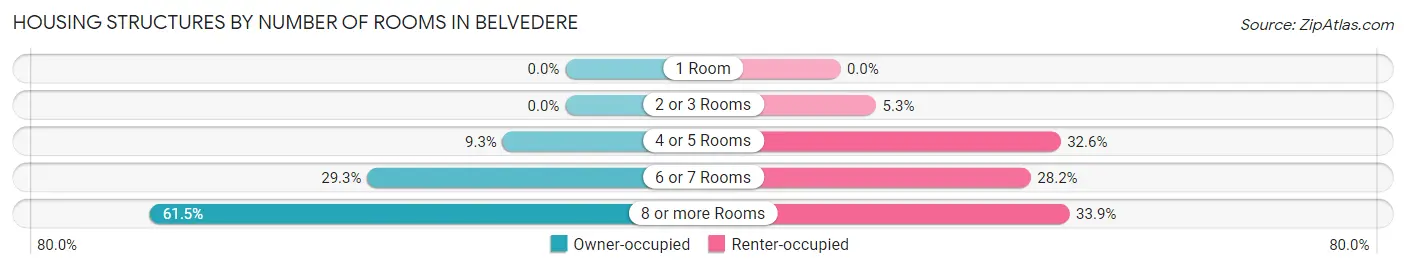
| Number of Rooms | Owner-occupied | Renter-occupied |
| 1 Room | 0 (0.0%) | 0 (0.0%) |
| 2 or 3 Rooms | 0 (0.0%) | 12 (5.3%) |
| 4 or 5 Rooms | 61 (9.3%) | 74 (32.6%) |
| 6 or 7 Rooms | 193 (29.3%) | 64 (28.2%) |
| 8 or more Rooms | 405 (61.5%) | 77 (33.9%) |
| Total | 659 (100.0%) | 227 (100.0%) |
Housing Structure by Heating Type in Belvedere
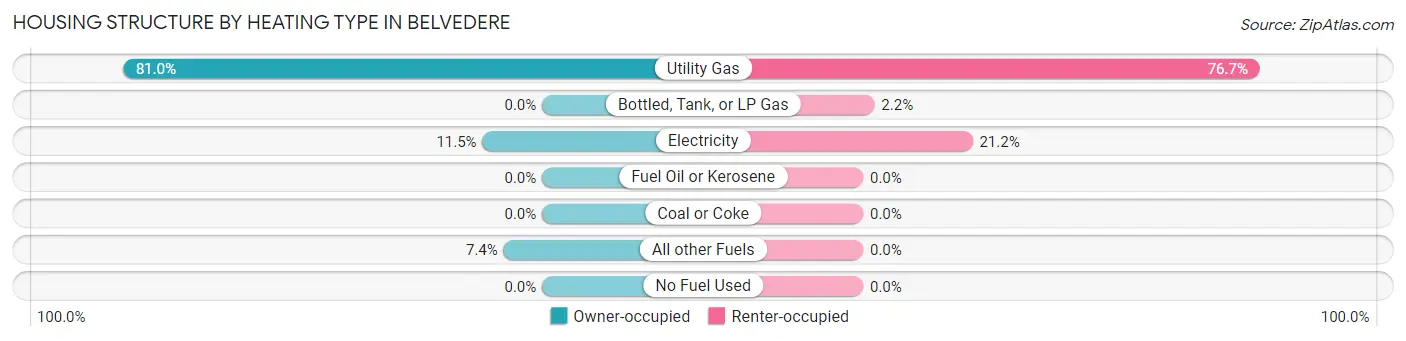
| Heating Type | Owner-occupied | Renter-occupied |
| Utility Gas | 534 (81.0%) | 174 (76.6%) |
| Bottled, Tank, or LP Gas | 0 (0.0%) | 5 (2.2%) |
| Electricity | 76 (11.5%) | 48 (21.1%) |
| Fuel Oil or Kerosene | 0 (0.0%) | 0 (0.0%) |
| Coal or Coke | 0 (0.0%) | 0 (0.0%) |
| All other Fuels | 49 (7.4%) | 0 (0.0%) |
| No Fuel Used | 0 (0.0%) | 0 (0.0%) |
| Total | 659 (100.0%) | 227 (100.0%) |
Household Vehicle Usage in Belvedere
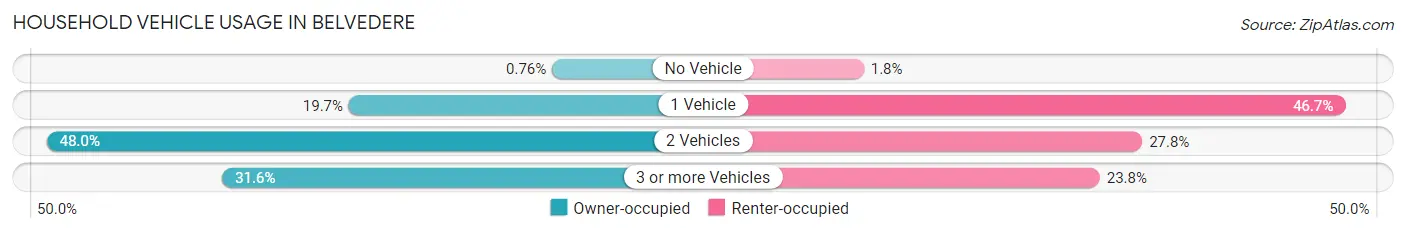
| Vehicles per Household | Owner-occupied | Renter-occupied |
| No Vehicle | 5 (0.8%) | 4 (1.8%) |
| 1 Vehicle | 130 (19.7%) | 106 (46.7%) |
| 2 Vehicles | 316 (47.9%) | 63 (27.8%) |
| 3 or more Vehicles | 208 (31.6%) | 54 (23.8%) |
| Total | 659 (100.0%) | 227 (100.0%) |
Real Estate & Mortgages in Belvedere
Real Estate and Mortgage Overview in Belvedere
| Characteristic | Without Mortgage | With Mortgage |
| Housing Units | 242 | 417 |
| Median Property Value | $2,000,001 | $2,000,001 |
| Median Household Income | $231,563 | $333 |
| Monthly Housing Costs | $1,501 | $397 |
| Real Estate Taxes | $10,001 | $0 |
Property Value by Mortgage Status in Belvedere
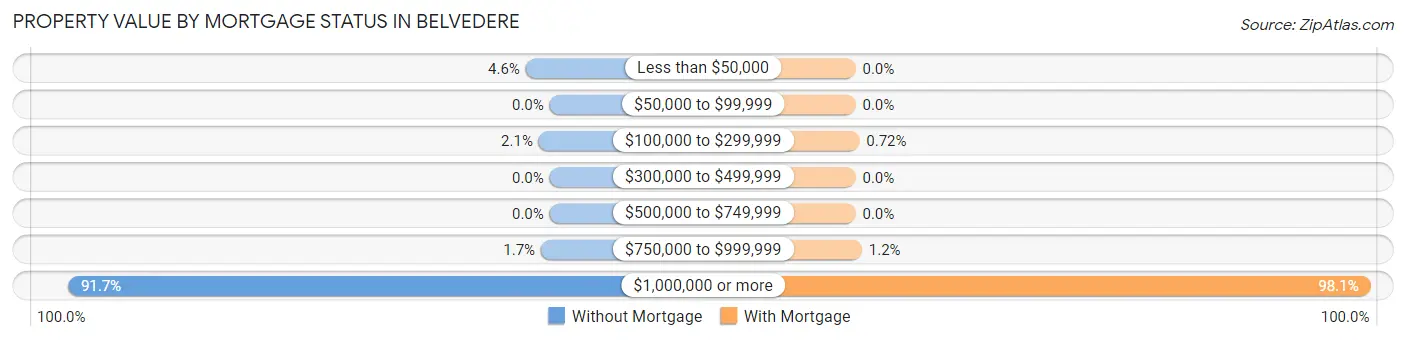
| Property Value | Without Mortgage | With Mortgage |
| Less than $50,000 | 11 (4.5%) | 0 (0.0%) |
| $50,000 to $99,999 | 0 (0.0%) | 0 (0.0%) |
| $100,000 to $299,999 | 5 (2.1%) | 3 (0.7%) |
| $300,000 to $499,999 | 0 (0.0%) | 0 (0.0%) |
| $500,000 to $749,999 | 0 (0.0%) | 0 (0.0%) |
| $750,000 to $999,999 | 4 (1.7%) | 5 (1.2%) |
| $1,000,000 or more | 222 (91.7%) | 409 (98.1%) |
| Total | 242 (100.0%) | 417 (100.0%) |
Household Income by Mortgage Status in Belvedere
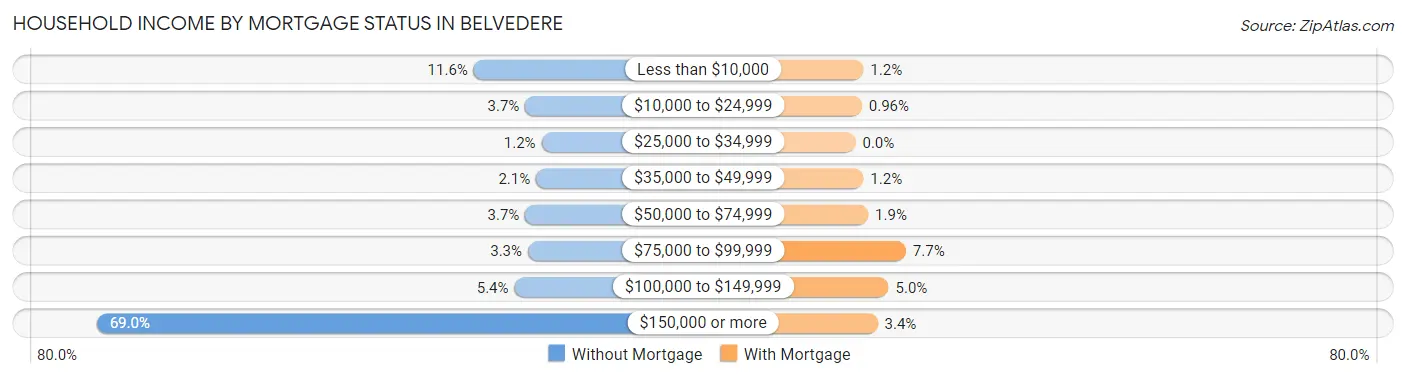
| Household Income | Without Mortgage | With Mortgage |
| Less than $10,000 | 28 (11.6%) | 5 (1.2%) |
| $10,000 to $24,999 | 9 (3.7%) | 4 (1.0%) |
| $25,000 to $34,999 | 3 (1.2%) | 0 (0.0%) |
| $35,000 to $49,999 | 5 (2.1%) | 5 (1.2%) |
| $50,000 to $74,999 | 9 (3.7%) | 8 (1.9%) |
| $75,000 to $99,999 | 8 (3.3%) | 32 (7.7%) |
| $100,000 to $149,999 | 13 (5.4%) | 21 (5.0%) |
| $150,000 or more | 167 (69.0%) | 14 (3.4%) |
| Total | 242 (100.0%) | 417 (100.0%) |
Property Value to Household Income Ratio in Belvedere
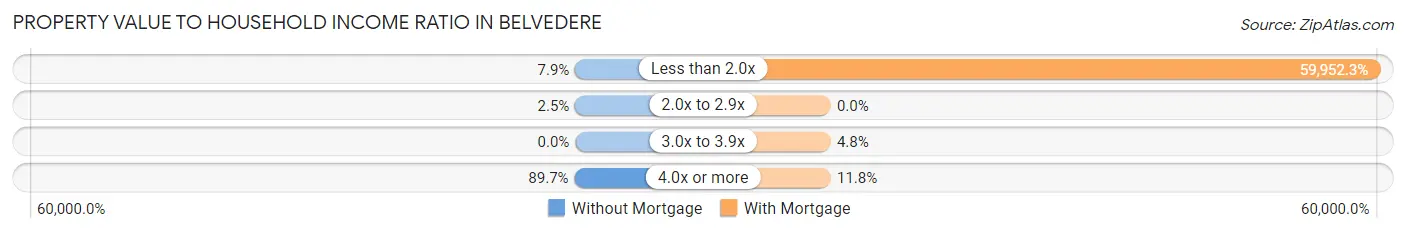
| Value-to-Income Ratio | Without Mortgage | With Mortgage |
| Less than 2.0x | 19 (7.9%) | 250,001 (59,952.3%) |
| 2.0x to 2.9x | 6 (2.5%) | 0 (0.0%) |
| 3.0x to 3.9x | 0 (0.0%) | 20 (4.8%) |
| 4.0x or more | 217 (89.7%) | 49 (11.7%) |
| Total | 242 (100.0%) | 417 (100.0%) |
Real Estate Taxes by Mortgage Status in Belvedere
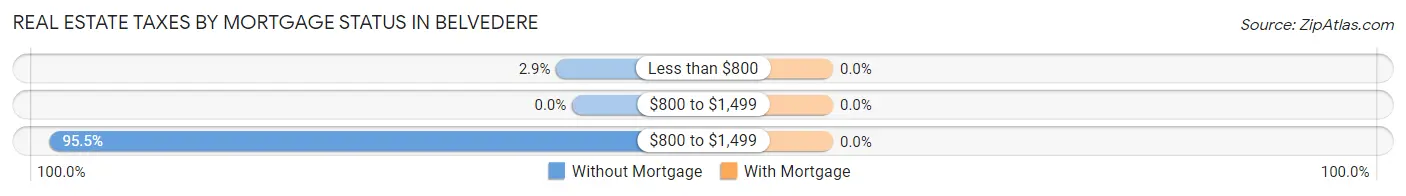
| Property Taxes | Without Mortgage | With Mortgage |
| Less than $800 | 7 (2.9%) | 0 (0.0%) |
| $800 to $1,499 | 0 (0.0%) | 0 (0.0%) |
| $800 to $1,499 | 231 (95.5%) | 0 (0.0%) |
| Total | 242 (100.0%) | 417 (100.0%) |
Health & Disability in Belvedere
Health Insurance Coverage by Age in Belvedere
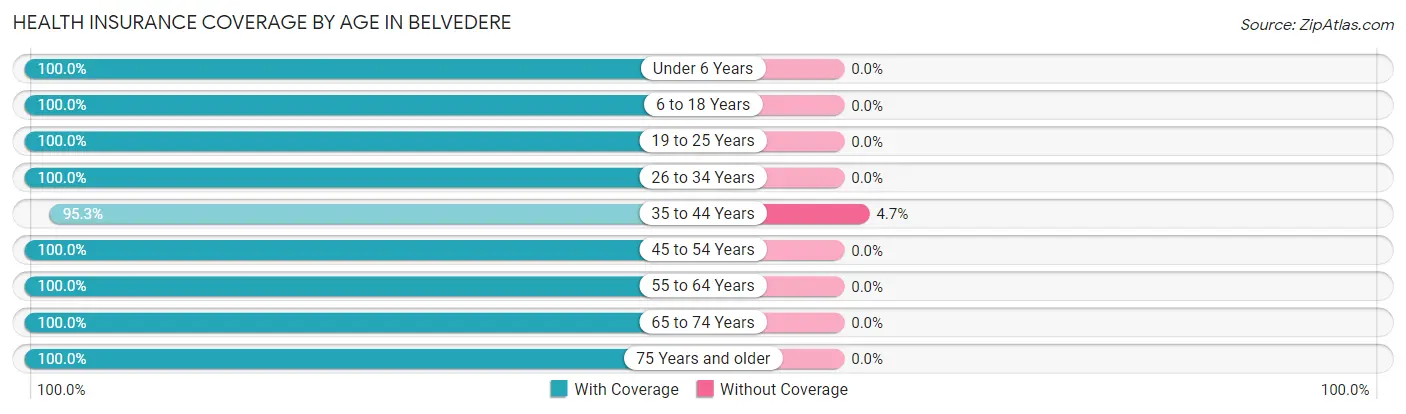
| Age Bracket | With Coverage | Without Coverage |
| Under 6 Years | 131 (100.0%) | 0 (0.0%) |
| 6 to 18 Years | 489 (100.0%) | 0 (0.0%) |
| 19 to 25 Years | 63 (100.0%) | 0 (0.0%) |
| 26 to 34 Years | 132 (100.0%) | 0 (0.0%) |
| 35 to 44 Years | 203 (95.3%) | 10 (4.7%) |
| 45 to 54 Years | 328 (100.0%) | 0 (0.0%) |
| 55 to 64 Years | 385 (100.0%) | 0 (0.0%) |
| 65 to 74 Years | 273 (100.0%) | 0 (0.0%) |
| 75 Years and older | 313 (100.0%) | 0 (0.0%) |
| Total | 2,317 (99.6%) | 10 (0.4%) |
Health Insurance Coverage by Citizenship Status in Belvedere
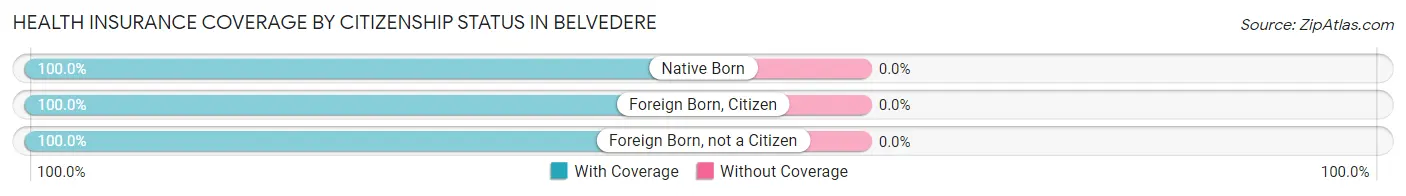
| Citizenship Status | With Coverage | Without Coverage |
| Native Born | 131 (100.0%) | 0 (0.0%) |
| Foreign Born, Citizen | 489 (100.0%) | 0 (0.0%) |
| Foreign Born, not a Citizen | 63 (100.0%) | 0 (0.0%) |
Health Insurance Coverage by Household Income in Belvedere
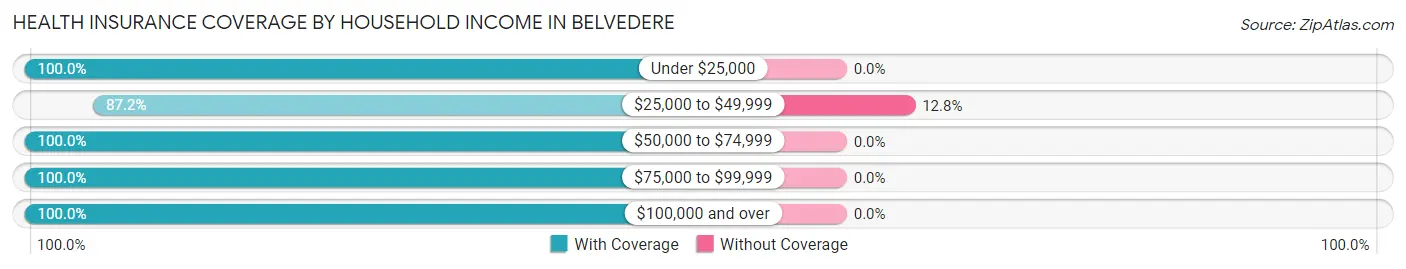
| Household Income | With Coverage | Without Coverage |
| Under $25,000 | 101 (100.0%) | 0 (0.0%) |
| $25,000 to $49,999 | 68 (87.2%) | 10 (12.8%) |
| $50,000 to $74,999 | 97 (100.0%) | 0 (0.0%) |
| $75,000 to $99,999 | 146 (100.0%) | 0 (0.0%) |
| $100,000 and over | 1,905 (100.0%) | 0 (0.0%) |
Public vs Private Health Insurance Coverage by Age in Belvedere
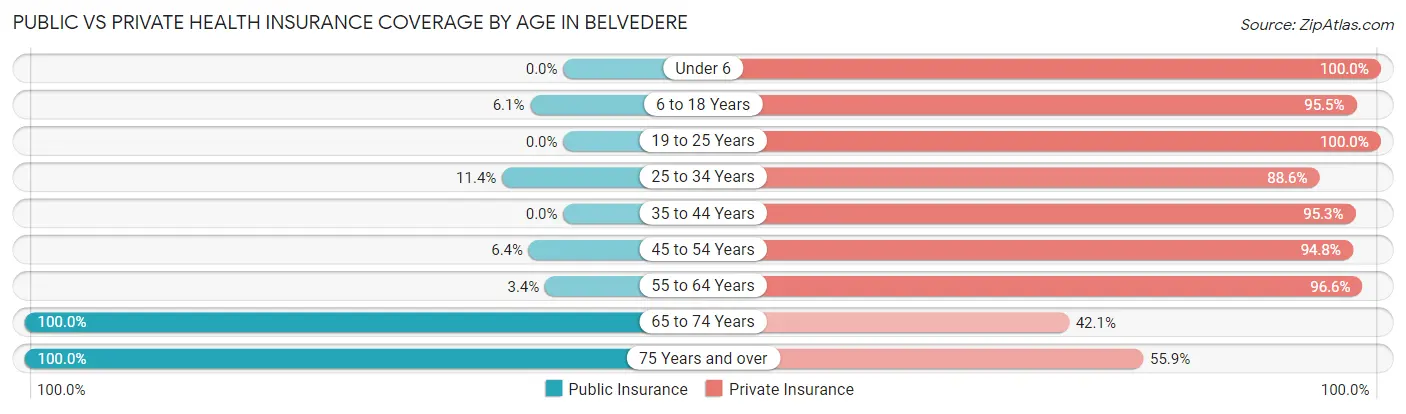
| Age Bracket | Public Insurance | Private Insurance |
| Under 6 | 0 (0.0%) | 131 (100.0%) |
| 6 to 18 Years | 30 (6.1%) | 467 (95.5%) |
| 19 to 25 Years | 0 (0.0%) | 63 (100.0%) |
| 25 to 34 Years | 15 (11.4%) | 117 (88.6%) |
| 35 to 44 Years | 0 (0.0%) | 203 (95.3%) |
| 45 to 54 Years | 21 (6.4%) | 311 (94.8%) |
| 55 to 64 Years | 13 (3.4%) | 372 (96.6%) |
| 65 to 74 Years | 273 (100.0%) | 115 (42.1%) |
| 75 Years and over | 313 (100.0%) | 175 (55.9%) |
| Total | 665 (28.6%) | 1,954 (84.0%) |
Disability Status by Sex by Age in Belvedere
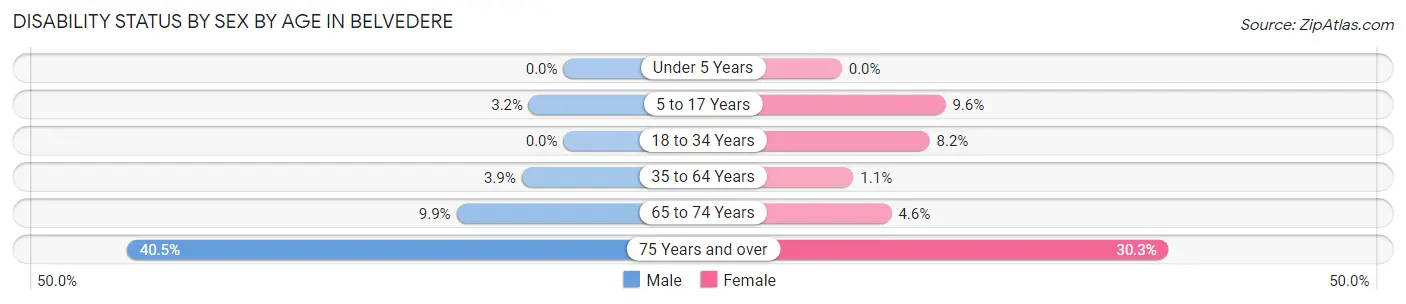
| Age Bracket | Male | Female |
| Under 5 Years | 0 (0.0%) | 0 (0.0%) |
| 5 to 17 Years | 7 (3.2%) | 23 (9.6%) |
| 18 to 34 Years | 0 (0.0%) | 15 (8.2%) |
| 35 to 64 Years | 18 (3.9%) | 5 (1.1%) |
| 65 to 74 Years | 12 (9.9%) | 7 (4.6%) |
| 75 Years and over | 64 (40.5%) | 47 (30.3%) |
Disability Class by Sex by Age in Belvedere
Disability Class: Hearing Difficulty
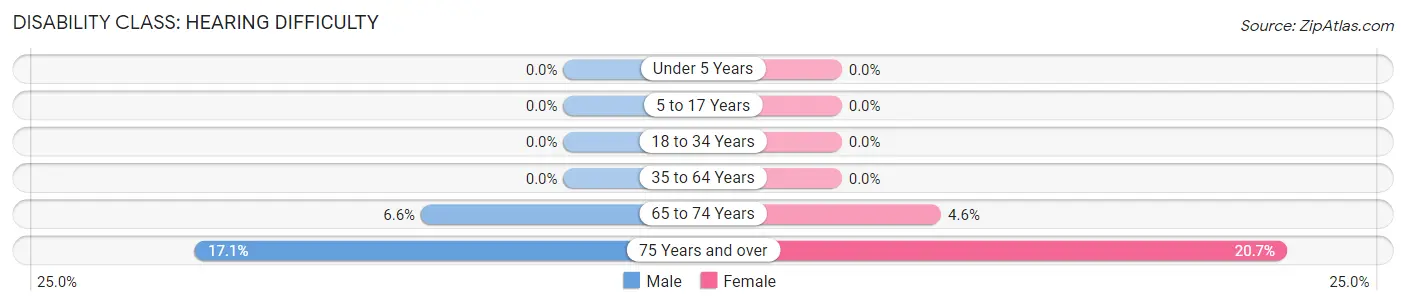
| Age Bracket | Male | Female |
| Under 5 Years | 0 (0.0%) | 0 (0.0%) |
| 5 to 17 Years | 0 (0.0%) | 0 (0.0%) |
| 18 to 34 Years | 0 (0.0%) | 0 (0.0%) |
| 35 to 64 Years | 0 (0.0%) | 0 (0.0%) |
| 65 to 74 Years | 8 (6.6%) | 7 (4.6%) |
| 75 Years and over | 27 (17.1%) | 32 (20.6%) |
Disability Class: Vision Difficulty
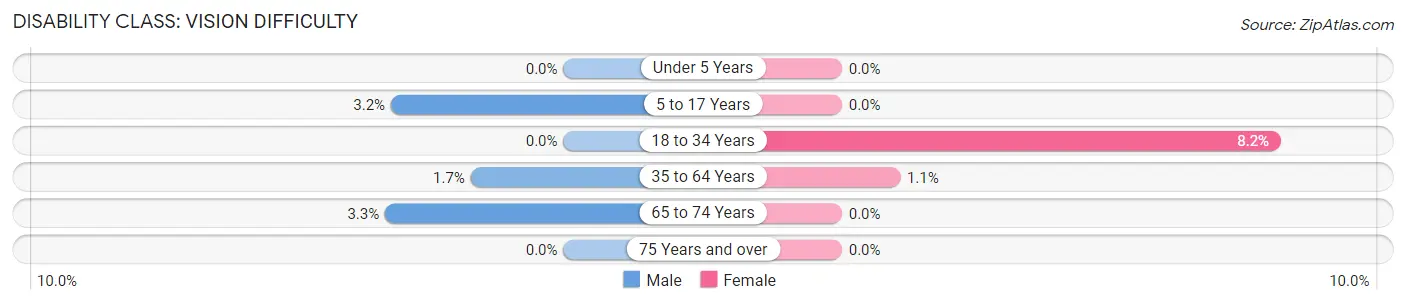
| Age Bracket | Male | Female |
| Under 5 Years | 0 (0.0%) | 0 (0.0%) |
| 5 to 17 Years | 7 (3.2%) | 0 (0.0%) |
| 18 to 34 Years | 0 (0.0%) | 15 (8.2%) |
| 35 to 64 Years | 8 (1.7%) | 5 (1.1%) |
| 65 to 74 Years | 4 (3.3%) | 0 (0.0%) |
| 75 Years and over | 0 (0.0%) | 0 (0.0%) |
Disability Class: Cognitive Difficulty
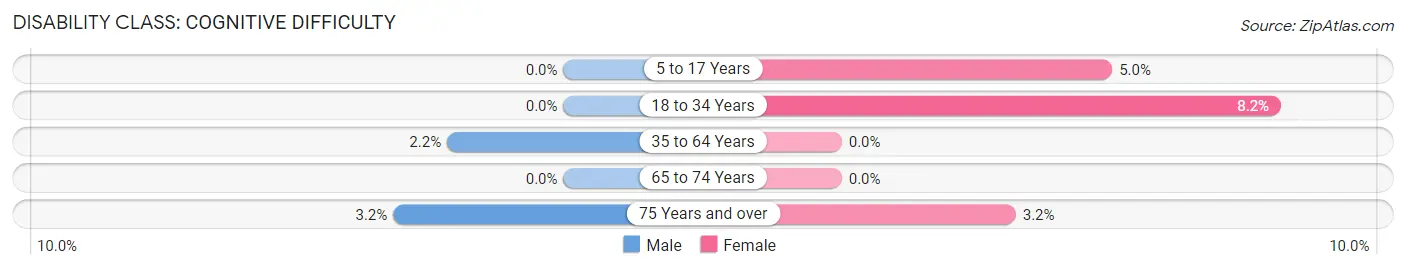
| Age Bracket | Male | Female |
| 5 to 17 Years | 0 (0.0%) | 12 (5.0%) |
| 18 to 34 Years | 0 (0.0%) | 15 (8.2%) |
| 35 to 64 Years | 10 (2.2%) | 0 (0.0%) |
| 65 to 74 Years | 0 (0.0%) | 0 (0.0%) |
| 75 Years and over | 5 (3.2%) | 5 (3.2%) |
Disability Class: Ambulatory Difficulty
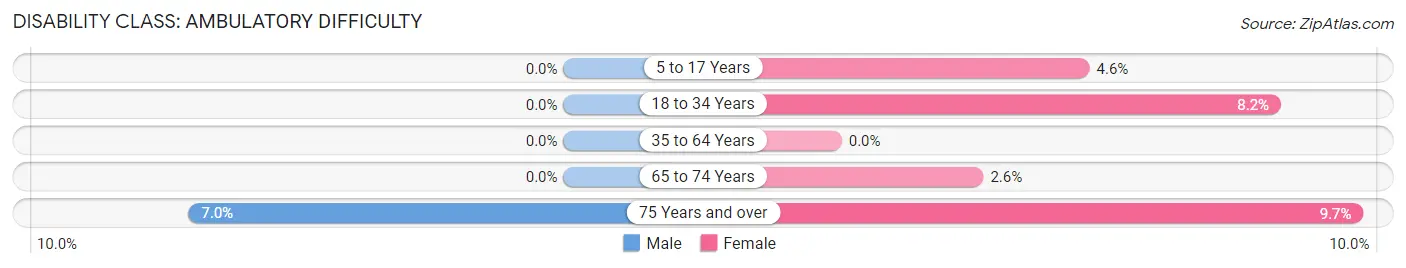
| Age Bracket | Male | Female |
| 5 to 17 Years | 0 (0.0%) | 11 (4.6%) |
| 18 to 34 Years | 0 (0.0%) | 15 (8.2%) |
| 35 to 64 Years | 0 (0.0%) | 0 (0.0%) |
| 65 to 74 Years | 0 (0.0%) | 4 (2.6%) |
| 75 Years and over | 11 (7.0%) | 15 (9.7%) |
Disability Class: Self-Care Difficulty
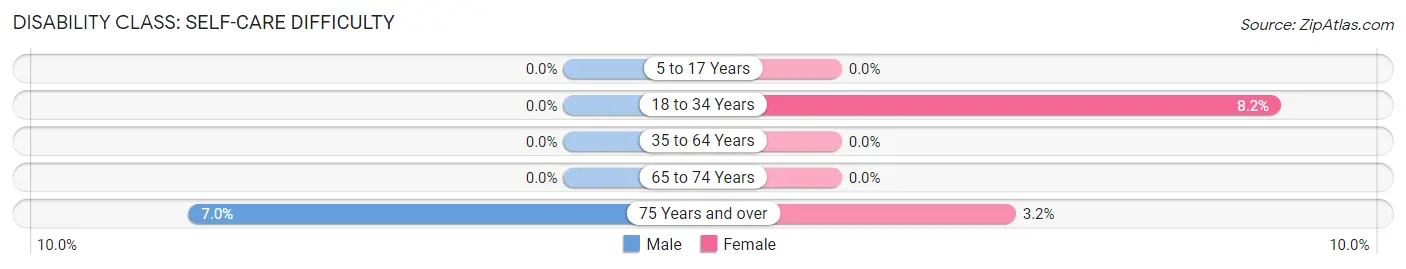
| Age Bracket | Male | Female |
| 5 to 17 Years | 0 (0.0%) | 0 (0.0%) |
| 18 to 34 Years | 0 (0.0%) | 15 (8.2%) |
| 35 to 64 Years | 0 (0.0%) | 0 (0.0%) |
| 65 to 74 Years | 0 (0.0%) | 0 (0.0%) |
| 75 Years and over | 11 (7.0%) | 5 (3.2%) |
Technology Access in Belvedere
Computing Device Access in Belvedere
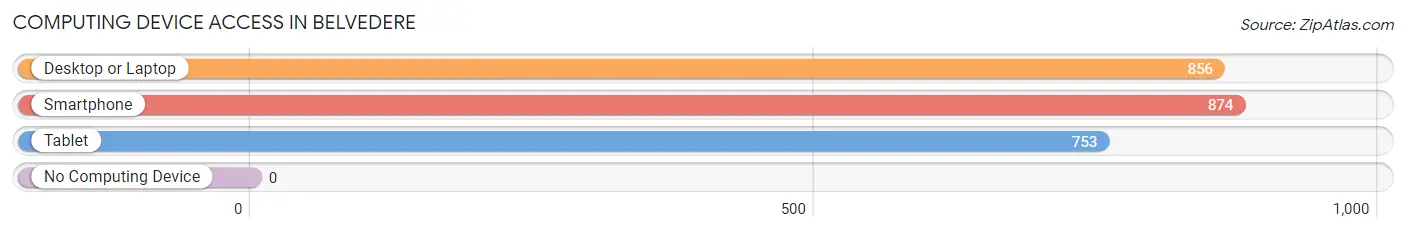
| Device Type | # Households | % Households |
| Desktop or Laptop | 856 | 96.6% |
| Smartphone | 874 | 98.7% |
| Tablet | 753 | 85.0% |
| No Computing Device | 0 | 0.0% |
| Total | 886 | 100.0% |
Internet Access in Belvedere
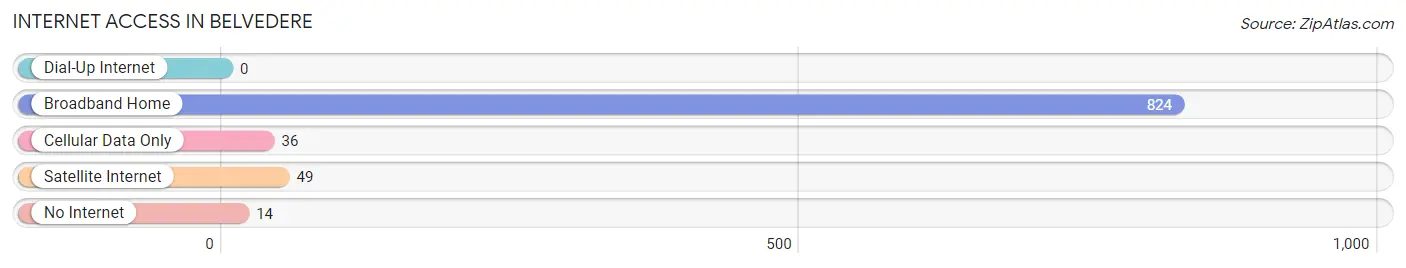
| Internet Type | # Households | % Households |
| Dial-Up Internet | 0 | 0.0% |
| Broadband Home | 824 | 93.0% |
| Cellular Data Only | 36 | 4.1% |
| Satellite Internet | 49 | 5.5% |
| No Internet | 14 | 1.6% |
| Total | 886 | 100.0% |
Belvedere Summary
Belvedere, California is a small city located in Marin County, California. It is situated on two islands in the San Francisco Bay, Belvedere Island and Tiburon Island. Belvedere is known for its stunning views of the San Francisco skyline, its waterfront homes, and its small-town charm.
History
Belvedere was originally part of a Mexican land grant given to William Richardson in 1838. In 1868, the land was purchased by a group of San Francisco businessmen who formed the Belvedere Land Company. The company developed the area into a resort community, and in 1896, the city of Belvedere was incorporated.
In the early 1900s, Belvedere was a popular destination for wealthy San Franciscans looking to escape the hustle and bustle of the city. The city was known for its grand estates, luxurious hotels, and exclusive clubs.
In the 1950s, Belvedere began to experience a decline in popularity as the wealthy moved to other parts of the Bay Area. The city was also affected by the construction of the Golden Gate Bridge, which diverted traffic away from Belvedere.
In the 1970s, Belvedere began to experience a resurgence in popularity as the city was rediscovered by the wealthy. The city was also revitalized by the construction of the Tiburon Ferry Terminal, which provided easy access to San Francisco.
Geography
Belvedere is located in Marin County, California. It is situated on two islands in the San Francisco Bay, Belvedere Island and Tiburon Island. The city is bordered by the cities of Tiburon, Mill Valley, and Sausalito.
Belvedere is known for its stunning views of the San Francisco skyline, its waterfront homes, and its small-town charm. The city is home to several parks, including Belvedere Park, which offers views of the San Francisco skyline and the Golden Gate Bridge.
Economy
Belvedere is a wealthy city with a median household income of $150,000. The city is home to several high-end boutiques, restaurants, and art galleries. The city is also home to several corporate offices, including the headquarters of the Gap, Inc.
The city is also home to several marinas, which provide access to the San Francisco Bay. The city is also home to several yacht clubs, which offer sailing and other water sports.
Demographics
Belvedere is a small city with a population of 2,131 as of the 2010 census. The city is predominantly white, with a population that is 88.3% white, 4.2% Asian, 2.2% Hispanic, and 1.2% African American.
The median age in Belvedere is 48.7, and the median household income is $150,000. The city is home to several wealthy families, and the average home value is $2.2 million.
Conclusion
Belvedere, California is a small city located in Marin County, California. It is situated on two islands in the San Francisco Bay, Belvedere Island and Tiburon Island. Belvedere is known for its stunning views of the San Francisco skyline, its waterfront homes, and its small-town charm. The city is predominantly white, with a population that is 88.3% white, 4.2% Asian, 2.2% Hispanic, and 1.2% African American. The median age in Belvedere is 48.7, and the median household income is $150,000. The city is home to several high-end boutiques, restaurants, and art galleries, as well as several corporate offices and marinas. Belvedere is a wealthy city with a median household income of $150,000 and an average home value of $2.2 million.
Common Questions
What is Per Capita Income in Belvedere?
Per Capita income in Belvedere is $165,410.
What is the Median Family Income in Belvedere?
Median Family Income in Belvedere is $250,001.
What is the Median Household income in Belvedere?
Median Household Income in Belvedere is $250,001.
What is Income or Wage Gap in Belvedere?
Income or Wage Gap in Belvedere is 76.1%.
Women in Belvedere earn 23.9 cents for every dollar earned by a man.
What is Inequality or Gini Index in Belvedere?
Inequality or Gini Index in Belvedere is 0.52.
What is the Total Population of Belvedere?
Total Population of Belvedere is 2,327.
What is the Total Male Population of Belvedere?
Total Male Population of Belvedere is 1,057.
What is the Total Female Population of Belvedere?
Total Female Population of Belvedere is 1,270.
What is the Ratio of Males per 100 Females in Belvedere?
There are 83.23 Males per 100 Females in Belvedere.
What is the Ratio of Females per 100 Males in Belvedere?
There are 120.15 Females per 100 Males in Belvedere.
What is the Median Population Age in Belvedere?
Median Population Age in Belvedere is 50.3 Years.
What is the Average Family Size in Belvedere
Average Family Size in Belvedere is 3.0 People.
What is the Average Household Size in Belvedere
Average Household Size in Belvedere is 2.6 People.
How Large is the Labor Force in Belvedere?
There are 932 People in the Labor Forcein in Belvedere.
What is the Percentage of People in the Labor Force in Belvedere?
50.0% of People are in the Labor Force in Belvedere.
What is the Unemployment Rate in Belvedere?
Unemployment Rate in Belvedere is 1.4%.