Cities with the Highest Percentage of Population Employed in Legal Services & Support in Missouri
RELATED REPORTS & OPTIONS
Legal Services & Support
Missouri
Compare Cities
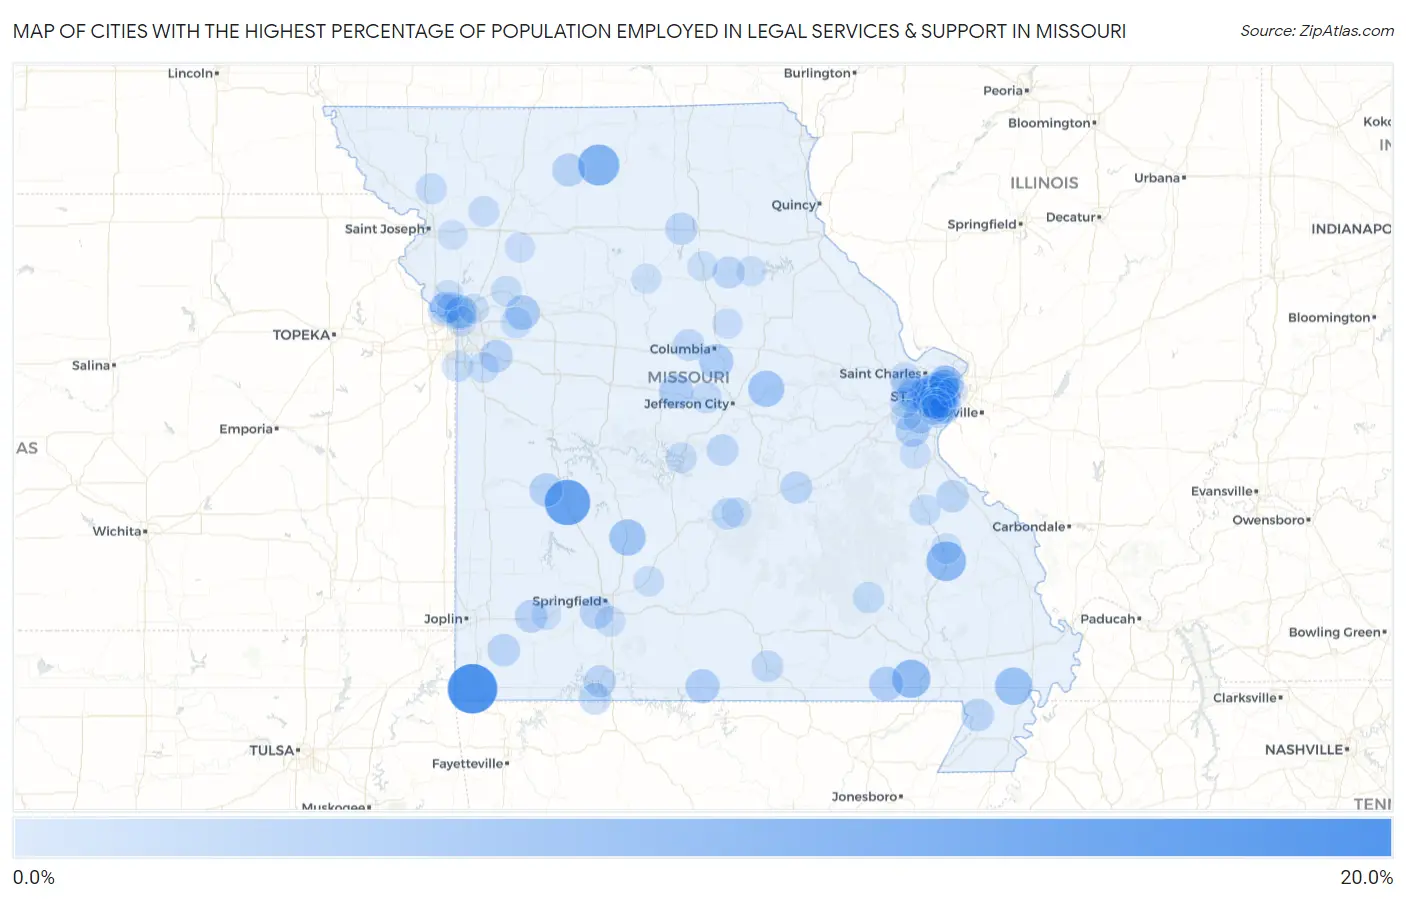
Map of Cities with the Highest Percentage of Population Employed in Legal Services & Support in Missouri
0.0%
20.0%
Cities with the Highest Percentage of Population Employed in Legal Services & Support in Missouri
| City | % Employed | vs State | vs National | |
| 1. | Ginger Blue | 19.7% | 0.99%(+18.7)#1 | 1.2%(+18.6)#60 |
| 2. | Collins | 15.8% | 0.99%(+14.8)#2 | 1.2%(+14.6)#95 |
| 3. | Osgood | 11.8% | 0.99%(+10.8)#3 | 1.2%(+10.6)#165 |
| 4. | Cherokee Pass | 10.3% | 0.99%(+9.27)#4 | 1.2%(+9.07)#211 |
| 5. | Fairdealing | 9.1% | 0.99%(+8.14)#5 | 1.2%(+7.94)#265 |
| 6. | Westwood | 9.0% | 0.99%(+7.98)#6 | 1.2%(+7.78)#275 |
| 7. | Crystal Lake Park | 8.9% | 0.99%(+7.96)#7 | 1.2%(+7.76)#277 |
| 8. | Catron | 8.3% | 0.99%(+7.34)#8 | 1.2%(+7.15)#319 |
| 9. | Ladue | 7.5% | 0.99%(+6.52)#9 | 1.2%(+6.32)#376 |
| 10. | Buffalo | 7.4% | 0.99%(+6.37)#10 | 1.2%(+6.18)#394 |
| 11. | Glendale | 7.3% | 0.99%(+6.27)#11 | 1.2%(+6.07)#409 |
| 12. | Mokane | 7.1% | 0.99%(+6.15)#12 | 1.2%(+5.96)#428 |
| 13. | Pasadena Hills | 6.3% | 0.99%(+5.28)#13 | 1.2%(+5.09)#552 |
| 14. | Camden | 5.7% | 0.99%(+4.72)#14 | 1.2%(+4.53)#661 |
| 15. | Oaks | 5.7% | 0.99%(+4.69)#15 | 1.2%(+4.50)#665 |
| 16. | Pierpont | 5.6% | 0.99%(+4.57)#16 | 1.2%(+4.37)#704 |
| 17. | Doniphan | 5.3% | 0.99%(+4.34)#17 | 1.2%(+4.15)#752 |
| 18. | Gainesville | 5.3% | 0.99%(+4.27)#18 | 1.2%(+4.08)#764 |
| 19. | Clarksburg | 5.3% | 0.99%(+4.27)#19 | 1.2%(+4.08)#766 |
| 20. | Scotsdale | 5.0% | 0.99%(+4.01)#20 | 1.2%(+3.82)#841 |
| 21. | Frontenac | 4.9% | 0.99%(+3.90)#21 | 1.2%(+3.71)#874 |
| 22. | Olivette | 4.9% | 0.99%(+3.89)#22 | 1.2%(+3.70)#881 |
| 23. | Rock Hill | 4.9% | 0.99%(+3.88)#23 | 1.2%(+3.69)#886 |
| 24. | Warson Woods | 4.8% | 0.99%(+3.84)#24 | 1.2%(+3.65)#897 |
| 25. | Shakertowne | 4.8% | 0.99%(+3.82)#25 | 1.2%(+3.63)#903 |
| 26. | Raintree Plantation | 4.7% | 0.99%(+3.71)#26 | 1.2%(+3.51)#950 |
| 27. | Roscoe | 4.7% | 0.99%(+3.66)#27 | 1.2%(+3.47)#967 |
| 28. | Clayton | 4.5% | 0.99%(+3.48)#28 | 1.2%(+3.28)#1,025 |
| 29. | Tindall | 4.3% | 0.99%(+3.36)#29 | 1.2%(+3.16)#1,071 |
| 30. | Webster Groves | 4.3% | 0.99%(+3.36)#30 | 1.2%(+3.16)#1,074 |
| 31. | Battlefield | 4.3% | 0.99%(+3.27)#31 | 1.2%(+3.07)#1,106 |
| 32. | University City | 4.2% | 0.99%(+3.26)#32 | 1.2%(+3.06)#1,112 |
| 33. | Lake Lotawana | 4.2% | 0.99%(+3.17)#33 | 1.2%(+2.98)#1,151 |
| 34. | Stotts City | 4.1% | 0.99%(+3.13)#34 | 1.2%(+2.94)#1,166 |
| 35. | Grantwood Village | 4.1% | 0.99%(+3.13)#35 | 1.2%(+2.94)#1,167 |
| 36. | Town And Country | 4.1% | 0.99%(+3.12)#36 | 1.2%(+2.93)#1,171 |
| 37. | Holcomb | 4.0% | 0.99%(+3.00)#37 | 1.2%(+2.80)#1,238 |
| 38. | Chesterfield | 3.9% | 0.99%(+2.94)#38 | 1.2%(+2.75)#1,268 |
| 39. | Stark City | 3.8% | 0.99%(+2.86)#39 | 1.2%(+2.66)#1,309 |
| 40. | Parkdale | 3.7% | 0.99%(+2.76)#40 | 1.2%(+2.57)#1,356 |
| 41. | Grayhawk | 3.7% | 0.99%(+2.76)#41 | 1.2%(+2.56)#1,358 |
| 42. | Callao | 3.7% | 0.99%(+2.71)#42 | 1.2%(+2.52)#1,389 |
| 43. | Parkville | 3.6% | 0.99%(+2.58)#43 | 1.2%(+2.39)#1,487 |
| 44. | St James | 3.6% | 0.99%(+2.56)#44 | 1.2%(+2.37)#1,501 |
| 45. | Cool Valley | 3.5% | 0.99%(+2.50)#45 | 1.2%(+2.31)#1,540 |
| 46. | Indian Point | 3.5% | 0.99%(+2.50)#46 | 1.2%(+2.30)#1,546 |
| 47. | Madison | 3.4% | 0.99%(+2.44)#47 | 1.2%(+2.24)#1,587 |
| 48. | Rocheport | 3.3% | 0.99%(+2.34)#48 | 1.2%(+2.15)#1,654 |
| 49. | Des Peres | 3.3% | 0.99%(+2.34)#49 | 1.2%(+2.14)#1,663 |
| 50. | Weatherby Lake | 3.3% | 0.99%(+2.32)#50 | 1.2%(+2.13)#1,674 |
| 51. | St Elizabeth | 3.3% | 0.99%(+2.31)#51 | 1.2%(+2.12)#1,684 |
| 52. | Clarkson Valley | 3.3% | 0.99%(+2.28)#52 | 1.2%(+2.09)#1,703 |
| 53. | West Plains | 3.2% | 0.99%(+2.24)#53 | 1.2%(+2.05)#1,730 |
| 54. | Blue Eye | 3.2% | 0.99%(+2.24)#54 | 1.2%(+2.04)#1,736 |
| 55. | Richmond Heights | 3.2% | 0.99%(+2.21)#55 | 1.2%(+2.02)#1,758 |
| 56. | Waynesville | 3.1% | 0.99%(+2.08)#56 | 1.2%(+1.89)#1,859 |
| 57. | Wilbur Park | 3.0% | 0.99%(+2.05)#57 | 1.2%(+1.86)#1,885 |
| 58. | Centertown | 3.0% | 0.99%(+2.02)#58 | 1.2%(+1.83)#1,918 |
| 59. | Brentwood | 3.0% | 0.99%(+1.97)#59 | 1.2%(+1.78)#1,972 |
| 60. | Creve Coeur | 2.9% | 0.99%(+1.95)#60 | 1.2%(+1.75)#2,001 |
| 61. | Ellington | 2.9% | 0.99%(+1.94)#61 | 1.2%(+1.75)#2,004 |
| 62. | Kirkwood | 2.8% | 0.99%(+1.84)#62 | 1.2%(+1.65)#2,093 |
| 63. | Napoleon | 2.8% | 0.99%(+1.84)#63 | 1.2%(+1.65)#2,094 |
| 64. | Lake Waukomis | 2.8% | 0.99%(+1.76)#64 | 1.2%(+1.57)#2,178 |
| 65. | Loch Lloyd | 2.7% | 0.99%(+1.75)#65 | 1.2%(+1.55)#2,201 |
| 66. | Oakwood | 2.7% | 0.99%(+1.68)#66 | 1.2%(+1.48)#2,268 |
| 67. | Rosendale | 2.6% | 0.99%(+1.57)#67 | 1.2%(+1.38)#2,388 |
| 68. | Leadington | 2.5% | 0.99%(+1.56)#68 | 1.2%(+1.37)#2,399 |
| 69. | Wood Heights | 2.5% | 0.99%(+1.50)#69 | 1.2%(+1.30)#2,456 |
| 70. | Eureka | 2.5% | 0.99%(+1.49)#70 | 1.2%(+1.29)#2,464 |
| 71. | Lake Winnebago | 2.5% | 0.99%(+1.48)#71 | 1.2%(+1.29)#2,478 |
| 72. | Maysville | 2.5% | 0.99%(+1.48)#72 | 1.2%(+1.28)#2,485 |
| 73. | Concord | 2.5% | 0.99%(+1.47)#73 | 1.2%(+1.28)#2,487 |
| 74. | Bellerive Acres | 2.4% | 0.99%(+1.41)#74 | 1.2%(+1.22)#2,577 |
| 75. | Fremont Hills | 2.4% | 0.99%(+1.41)#75 | 1.2%(+1.21)#2,582 |
| 76. | Junction City | 2.3% | 0.99%(+1.34)#76 | 1.2%(+1.14)#2,688 |
| 77. | Lake Ozark | 2.3% | 0.99%(+1.33)#77 | 1.2%(+1.14)#2,696 |
| 78. | Wildwood | 2.3% | 0.99%(+1.29)#78 | 1.2%(+1.09)#2,750 |
| 79. | Marshfield | 2.3% | 0.99%(+1.28)#79 | 1.2%(+1.09)#2,752 |
| 80. | Cottleville | 2.3% | 0.99%(+1.28)#80 | 1.2%(+1.08)#2,772 |
| 81. | Shrewsbury | 2.2% | 0.99%(+1.22)#81 | 1.2%(+1.02)#2,863 |
| 82. | Weldon Spring | 2.2% | 0.99%(+1.17)#82 | 1.2%(+0.980)#2,943 |
| 83. | St George | 2.1% | 0.99%(+1.16)#83 | 1.2%(+0.963)#2,968 |
| 84. | Bel Nor | 2.1% | 0.99%(+1.07)#84 | 1.2%(+0.872)#3,119 |
| 85. | Crestwood | 2.0% | 0.99%(+1.05)#85 | 1.2%(+0.857)#3,133 |
| 86. | North Kansas City | 2.0% | 0.99%(+1.02)#86 | 1.2%(+0.827)#3,194 |
| 87. | Hallsville | 2.0% | 0.99%(+1.02)#87 | 1.2%(+0.827)#3,195 |
| 88. | Cairo | 2.0% | 0.99%(+0.971)#88 | 1.2%(+0.777)#3,292 |
| 89. | Glenaire | 2.0% | 0.99%(+0.964)#89 | 1.2%(+0.771)#3,304 |
| 90. | Kingston | 1.9% | 0.99%(+0.933)#90 | 1.2%(+0.739)#3,359 |
| 91. | Hillsboro | 1.9% | 0.99%(+0.925)#91 | 1.2%(+0.732)#3,369 |
| 92. | Oakland | 1.9% | 0.99%(+0.924)#92 | 1.2%(+0.730)#3,376 |
| 93. | Paris | 1.9% | 0.99%(+0.893)#93 | 1.2%(+0.700)#3,438 |
| 94. | St Louis | 1.8% | 0.99%(+0.843)#94 | 1.2%(+0.649)#3,557 |
| 95. | Keytesville | 1.8% | 0.99%(+0.828)#95 | 1.2%(+0.634)#3,601 |
| 96. | St Robert | 1.8% | 0.99%(+0.804)#96 | 1.2%(+0.610)#3,662 |
| 97. | Sunset Hills | 1.8% | 0.99%(+0.798)#97 | 1.2%(+0.604)#3,668 |
| 98. | Ferrelview | 1.8% | 0.99%(+0.764)#98 | 1.2%(+0.571)#3,744 |
| 99. | Mount Vernon | 1.8% | 0.99%(+0.762)#99 | 1.2%(+0.569)#3,751 |
| 100. | Easton | 1.7% | 0.99%(+0.749)#100 | 1.2%(+0.555)#3,781 |
Common Questions
What are the Top 10 Cities with the Highest Percentage of Population Employed in Legal Services & Support in Missouri?
Top 10 Cities with the Highest Percentage of Population Employed in Legal Services & Support in Missouri are:
#1
19.7%
#2
15.8%
#3
11.8%
#4
10.3%
#5
9.1%
#6
9.0%
#7
8.9%
#8
8.3%
#9
7.5%
#10
7.4%
What city has the Highest Percentage of Population Employed in Legal Services & Support in Missouri?
Ginger Blue has the Highest Percentage of Population Employed in Legal Services & Support in Missouri with 19.7%.
What is the Percentage of Population Employed in Legal Services & Support in the State of Missouri?
Percentage of Population Employed in Legal Services & Support in Missouri is 0.99%.
What is the Percentage of Population Employed in Legal Services & Support in the United States?
Percentage of Population Employed in Legal Services & Support in the United States is 1.2%.