Red Corral, CA Map & Demographics
Red Corral Map
Red Corral Overview
$28,150
PER CAPITA INCOME
$89,375
AVG FAMILY INCOME
61.8%
WAGE / INCOME GAP [ % ]
38.2¢/ $1
WAGE / INCOME GAP [ $ ]
0.38
INEQUALITY / GINI INDEX
1,271
TOTAL POPULATION
649
MALE POPULATION
622
FEMALE POPULATION
104.34
MALES / 100 FEMALES
95.84
FEMALES / 100 MALES
48.9
MEDIAN AGE
3.8
AVG FAMILY SIZE
2.9
AVG HOUSEHOLD SIZE
268
LABOR FORCE [ PEOPLE ]
24.5%
PERCENT IN LABOR FORCE
Income in Red Corral
Income Overview in Red Corral
| Characteristic | Number | Measure |
| Per Capita Income | 1,271 | $28,150 |
| Median Family Income | 257 | $89,375 |
| Mean Family Income | 257 | $97,216 |
| Median Household Income | 416 | $0 |
| Mean Household Income | 416 | $79,208 |
| Income Deficit | 257 | $0 |
| Wage / Income Gap (%) | 1,271 | 61.82% |
| Wage / Income Gap ($) | 1,271 | 38.18¢ per $1 |
| Gini / Inequality Index | 1,271 | 0.38 |
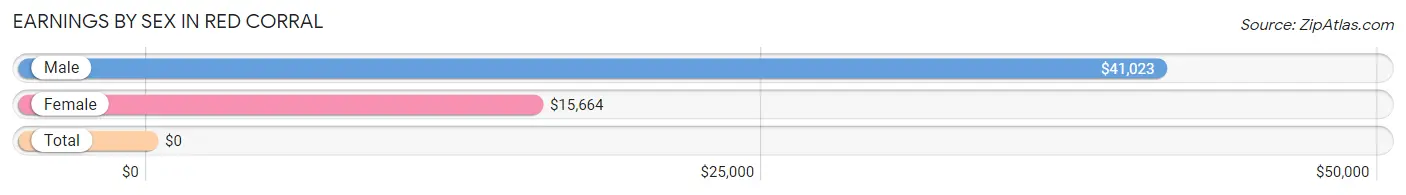
Earnings by Sex in Red Corral
| Sex | Number | Average Earnings |
| Male | 166 (37.7%) | $41,023 |
| Female | 274 (62.3%) | $15,664 |
| Total | 440 (100.0%) | $0 |
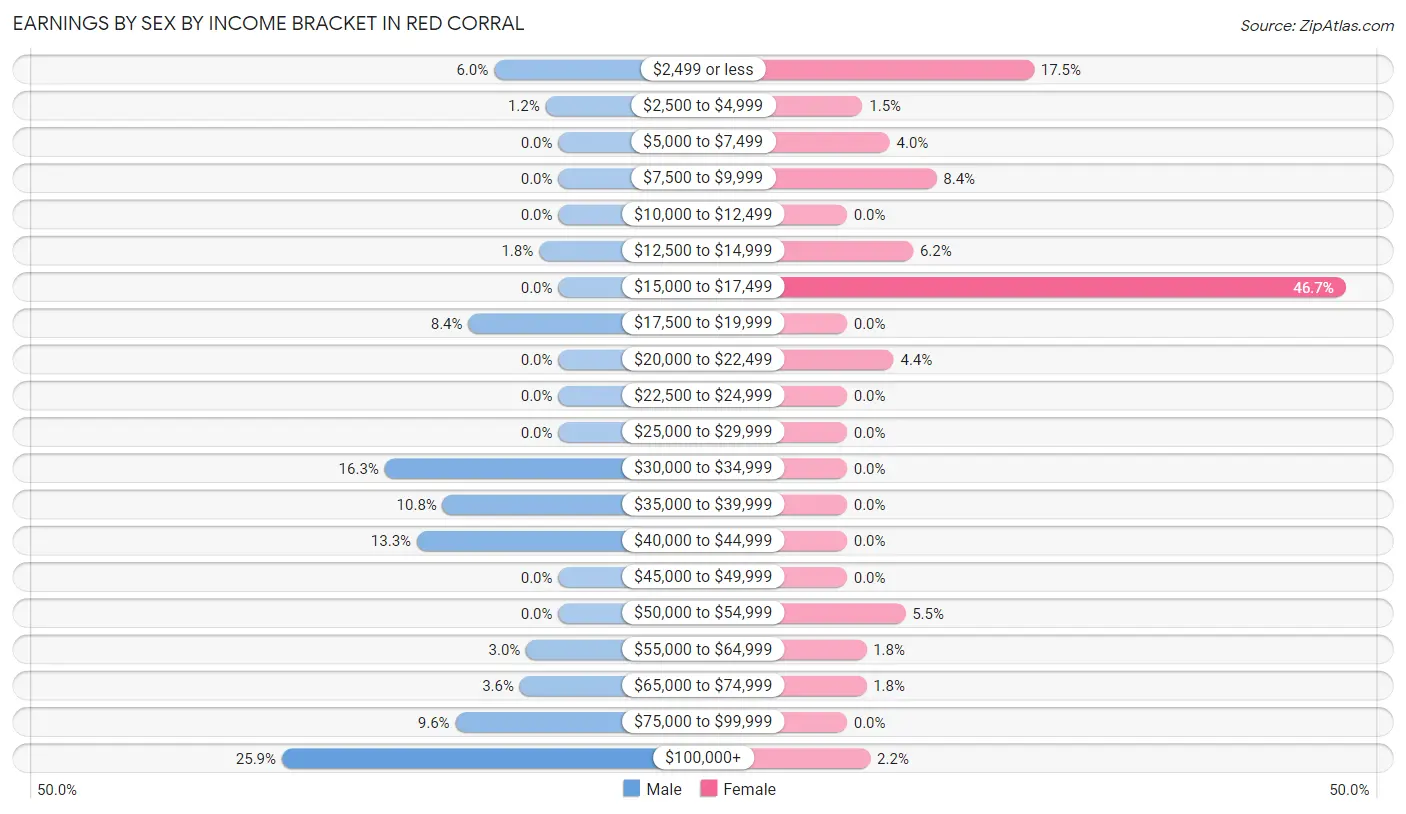
Earnings by Sex by Income Bracket in Red Corral
The most common earnings brackets in Red Corral are $100,000+ for men (43 | 25.9%) and $15,000 to $17,499 for women (128 | 46.7%).
| Income | Male | Female |
| $2,499 or less | 10 (6.0%) | 48 (17.5%) |
| $2,500 to $4,999 | 2 (1.2%) | 4 (1.5%) |
| $5,000 to $7,499 | 0 (0.0%) | 11 (4.0%) |
| $7,500 to $9,999 | 0 (0.0%) | 23 (8.4%) |
| $10,000 to $12,499 | 0 (0.0%) | 0 (0.0%) |
| $12,500 to $14,999 | 3 (1.8%) | 17 (6.2%) |
| $15,000 to $17,499 | 0 (0.0%) | 128 (46.7%) |
| $17,500 to $19,999 | 14 (8.4%) | 0 (0.0%) |
| $20,000 to $22,499 | 0 (0.0%) | 12 (4.4%) |
| $22,500 to $24,999 | 0 (0.0%) | 0 (0.0%) |
| $25,000 to $29,999 | 0 (0.0%) | 0 (0.0%) |
| $30,000 to $34,999 | 27 (16.3%) | 0 (0.0%) |
| $35,000 to $39,999 | 18 (10.8%) | 0 (0.0%) |
| $40,000 to $44,999 | 22 (13.3%) | 0 (0.0%) |
| $45,000 to $49,999 | 0 (0.0%) | 0 (0.0%) |
| $50,000 to $54,999 | 0 (0.0%) | 15 (5.5%) |
| $55,000 to $64,999 | 5 (3.0%) | 5 (1.8%) |
| $65,000 to $74,999 | 6 (3.6%) | 5 (1.8%) |
| $75,000 to $99,999 | 16 (9.6%) | 0 (0.0%) |
| $100,000+ | 43 (25.9%) | 6 (2.2%) |
| Total | 166 (100.0%) | 274 (100.0%) |
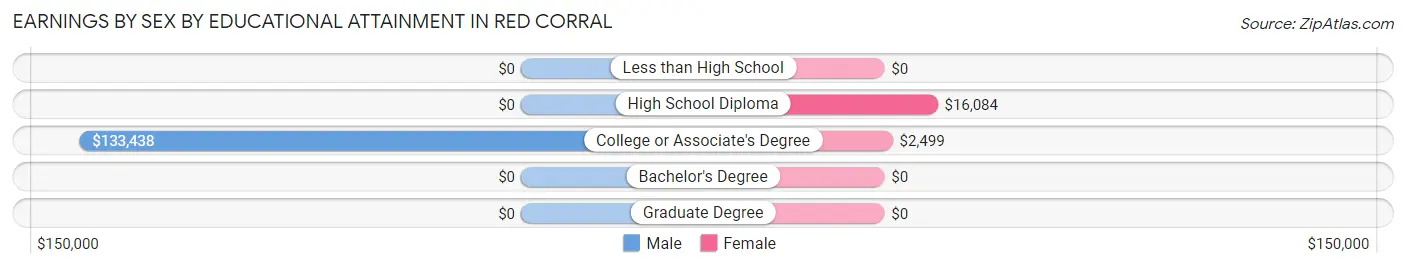
Earnings by Sex by Educational Attainment in Red Corral
| Educational Attainment | Male Income | Female Income |
| Less than High School | - | - |
| High School Diploma | - | - |
| College or Associate's Degree | $133,438 | $2,499 |
| Bachelor's Degree | - | - |
| Graduate Degree | - | - |
| Total | - | - |
Family Income in Red Corral
Family Income Brackets in Red Corral
According to the Red Corral family income data, there are 73 families falling into the $35,000 to $49,999 income range, which is the most common income bracket and makes up 28.4% of all families.
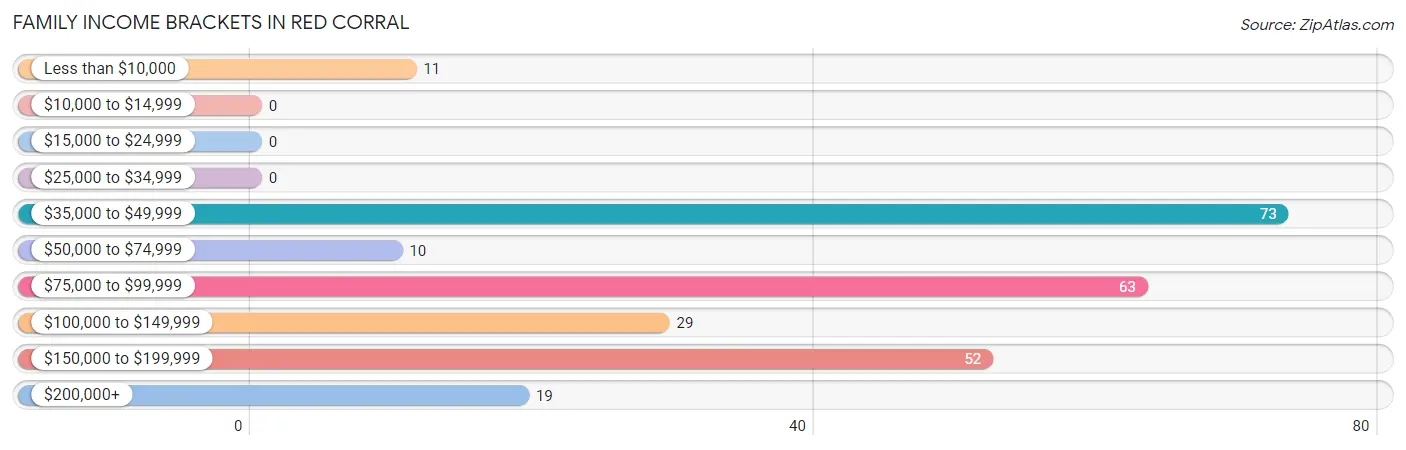
| Income Bracket | # Families | % Families |
| Less than $10,000 | 11 | 4.3% |
| $10,000 to $14,999 | 0 | 0.0% |
| $15,000 to $24,999 | 0 | 0.0% |
| $25,000 to $34,999 | 0 | 0.0% |
| $35,000 to $49,999 | 73 | 28.4% |
| $50,000 to $74,999 | 10 | 3.9% |
| $75,000 to $99,999 | 63 | 24.5% |
| $100,000 to $149,999 | 29 | 11.3% |
| $150,000 to $199,999 | 52 | 20.2% |
| $200,000+ | 19 | 7.4% |
Family Income by Famaliy Size in Red Corral
2-person families (111 | 43.2%) account for the highest median family income in Red Corral with $89,432 per family, while 2-person families (111 | 43.2%) have the highest median income of $44,716 per family member.
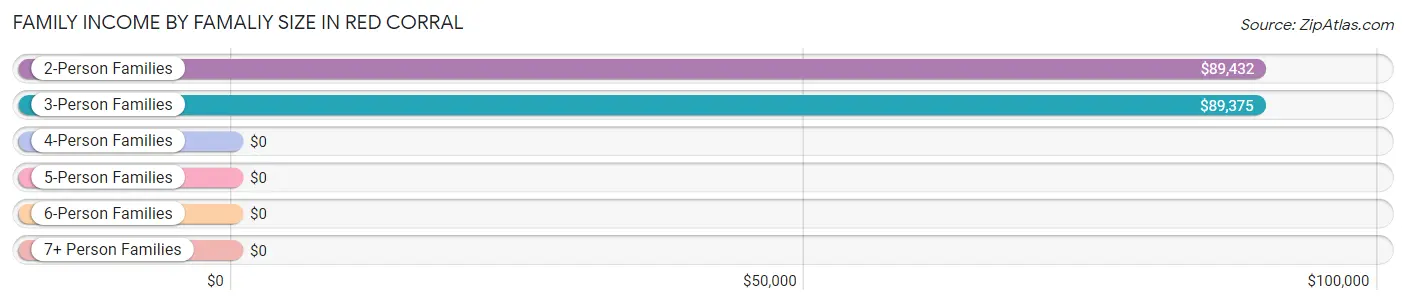
| Income Bracket | # Families | Median Income |
| 2-Person Families | 111 (43.2%) | $89,432 |
| 3-Person Families | 15 (5.8%) | $89,375 |
| 4-Person Families | 116 (45.1%) | $0 |
| 5-Person Families | 15 (5.8%) | $0 |
| 6-Person Families | 0 (0.0%) | $0 |
| 7+ Person Families | 0 (0.0%) | $0 |
| Total | 257 (100.0%) | $89,375 |
Family Income by Number of Earners in Red Corral
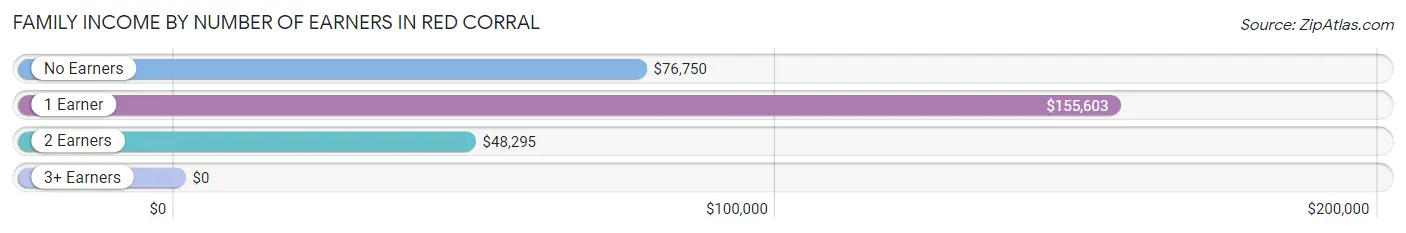
| Number of Earners | # Families | Median Income |
| No Earners | 73 (28.4%) | $76,750 |
| 1 Earner | 82 (31.9%) | $155,603 |
| 2 Earners | 82 (31.9%) | $48,295 |
| 3+ Earners | 20 (7.8%) | $0 |
| Total | 257 (100.0%) | $89,375 |
Household Income in Red Corral
Household Income Brackets in Red Corral
With 131 households falling in the category, the $35,000 to $49,999 income range is the most frequent in Red Corral, accounting for 31.5% of all households.
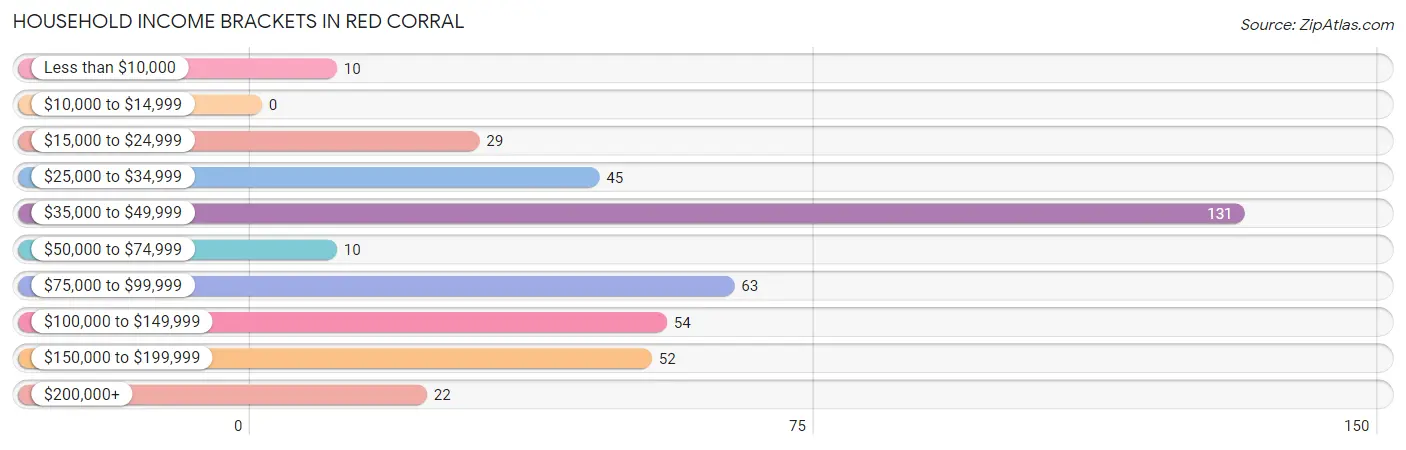
| Income Bracket | # Households | % Households |
| Less than $10,000 | 10 | 2.4% |
| $10,000 to $14,999 | 0 | 0.0% |
| $15,000 to $24,999 | 29 | 7.0% |
| $25,000 to $34,999 | 45 | 10.8% |
| $35,000 to $49,999 | 131 | 31.5% |
| $50,000 to $74,999 | 10 | 2.4% |
| $75,000 to $99,999 | 63 | 15.1% |
| $100,000 to $149,999 | 54 | 13.0% |
| $150,000 to $199,999 | 52 | 12.5% |
| $200,000+ | 22 | 5.3% |
Household Income by Householder Age in Red Corral
The median household income in Red Corral is $0, with the highest median household income of $88,088 found in the 45 to 64 years age bracket for the primary householder. A total of 152 households (36.5%) fall into this category.
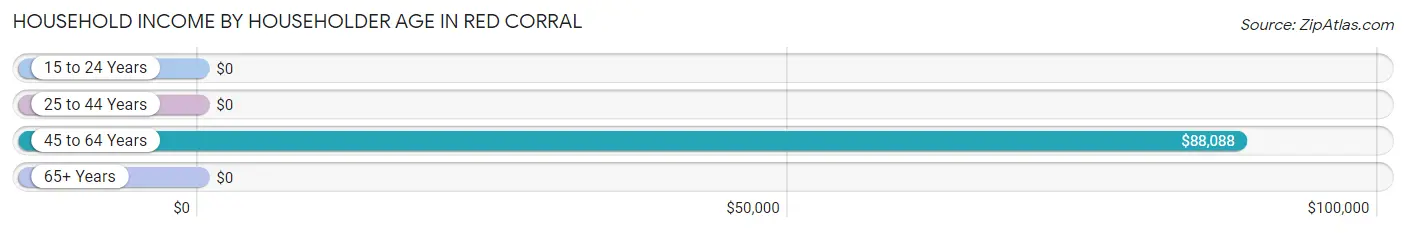
| Income Bracket | # Households | Median Income |
| 15 to 24 Years | 0 (0.0%) | $0 |
| 25 to 44 Years | 22 (5.3%) | $0 |
| 45 to 64 Years | 152 (36.5%) | $88,088 |
| 65+ Years | 242 (58.2%) | $0 |
| Total | 416 (100.0%) | $0 |
Poverty in Red Corral
Income Below Poverty by Sex and Age in Red Corral
With 10.5% poverty level for males and 3.9% for females among the residents of Red Corral, 25 to 34 year old males and 16 and 17 year old females are the most vulnerable to poverty, with 18 males (100.0%) and 5 females (100.0%) in their respective age groups living below the poverty level.
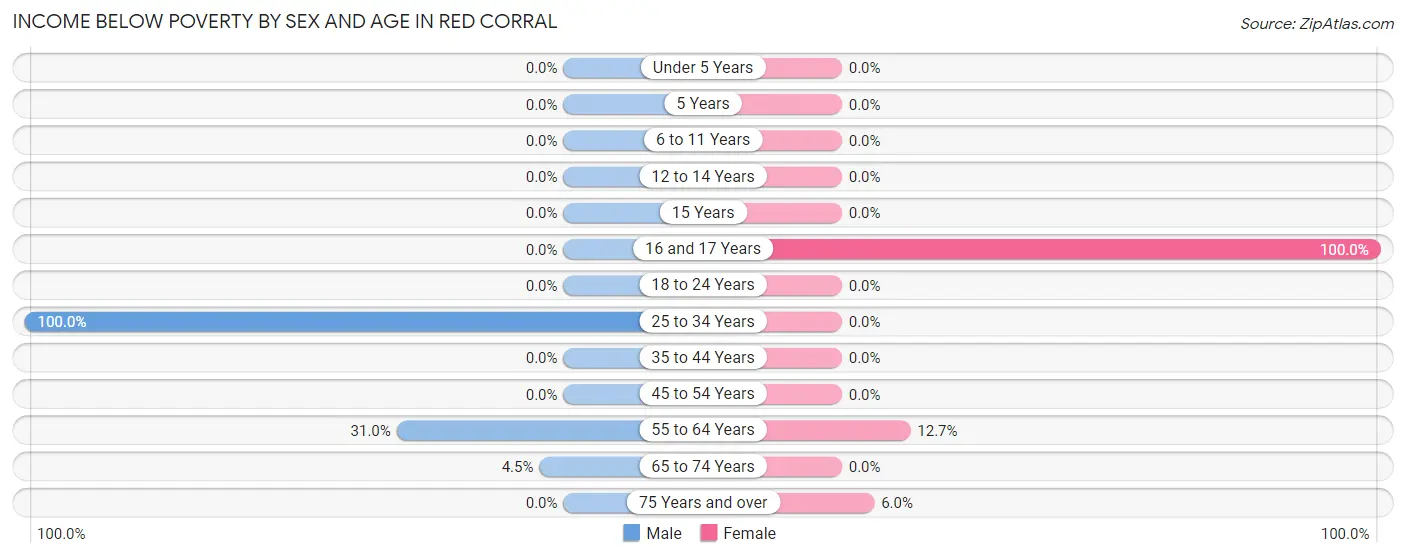
| Age Bracket | Male | Female |
| Under 5 Years | 0 (0.0%) | 0 (0.0%) |
| 5 Years | 0 (0.0%) | 0 (0.0%) |
| 6 to 11 Years | 0 (0.0%) | 0 (0.0%) |
| 12 to 14 Years | 0 (0.0%) | 0 (0.0%) |
| 15 Years | 0 (0.0%) | 0 (0.0%) |
| 16 and 17 Years | 0 (0.0%) | 5 (100.0%) |
| 18 to 24 Years | 0 (0.0%) | 0 (0.0%) |
| 25 to 34 Years | 18 (100.0%) | 0 (0.0%) |
| 35 to 44 Years | 0 (0.0%) | 0 (0.0%) |
| 45 to 54 Years | 0 (0.0%) | 0 (0.0%) |
| 55 to 64 Years | 39 (30.9%) | 14 (12.7%) |
| 65 to 74 Years | 5 (4.5%) | 0 (0.0%) |
| 75 Years and over | 0 (0.0%) | 5 (6.0%) |
| Total | 62 (10.5%) | 24 (3.9%) |
Income Above Poverty by Sex and Age in Red Corral
According to the poverty statistics in Red Corral, males aged under 5 years and females aged 5 years are the age groups that are most secure financially, with 100.0% of males and 100.0% of females in these age groups living above the poverty line.
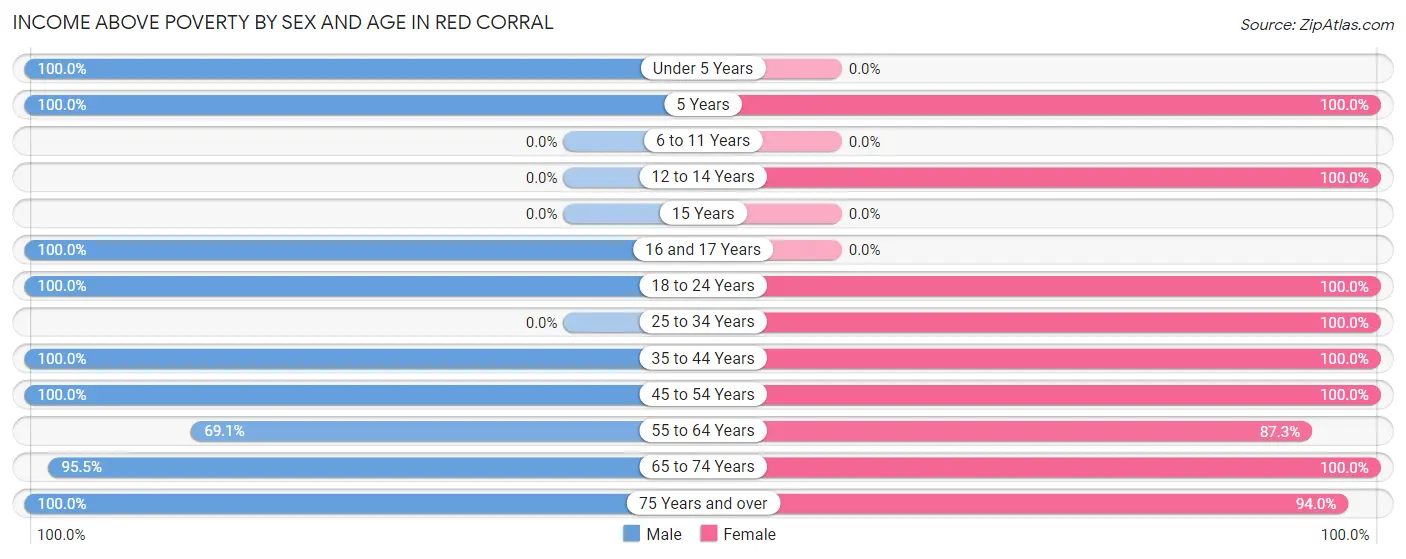
| Age Bracket | Male | Female |
| Under 5 Years | 82 (100.0%) | 0 (0.0%) |
| 5 Years | 13 (100.0%) | 60 (100.0%) |
| 6 to 11 Years | 0 (0.0%) | 0 (0.0%) |
| 12 to 14 Years | 0 (0.0%) | 24 (100.0%) |
| 15 Years | 0 (0.0%) | 0 (0.0%) |
| 16 and 17 Years | 53 (100.0%) | 0 (0.0%) |
| 18 to 24 Years | 17 (100.0%) | 37 (100.0%) |
| 25 to 34 Years | 0 (0.0%) | 23 (100.0%) |
| 35 to 44 Years | 22 (100.0%) | 139 (100.0%) |
| 45 to 54 Years | 50 (100.0%) | 59 (100.0%) |
| 55 to 64 Years | 87 (69.1%) | 96 (87.3%) |
| 65 to 74 Years | 107 (95.5%) | 82 (100.0%) |
| 75 Years and over | 99 (100.0%) | 78 (94.0%) |
| Total | 530 (89.5%) | 598 (96.1%) |
Income Below Poverty Among Married-Couple Families in Red Corral
The poverty statistics for married-couple families in Red Corral show that 2.9% or 5 of the total 173 families live below the poverty line. Families with no children have the highest poverty rate of 4.0%, comprising of 5 families. On the other hand, families with 1 or 2 children have the lowest poverty rate of 0.0%, which includes 0 families.
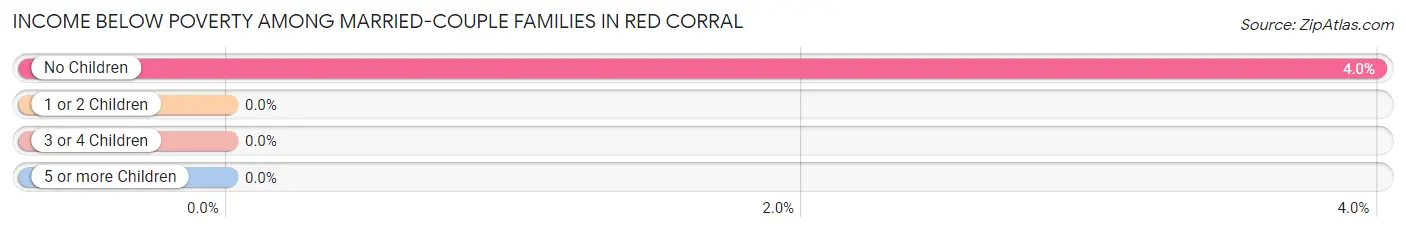
| Children | Above Poverty | Below Poverty |
| No Children | 120 (96.0%) | 5 (4.0%) |
| 1 or 2 Children | 33 (100.0%) | 0 (0.0%) |
| 3 or 4 Children | 15 (100.0%) | 0 (0.0%) |
| 5 or more Children | 0 (0.0%) | 0 (0.0%) |
| Total | 168 (97.1%) | 5 (2.9%) |
Income Below Poverty Among Single-Parent Households in Red Corral
According to the poverty data in Red Corral, 6.4% or 3 single-father households and 8.1% or 3 single-mother households are living below the poverty line. Among single-father households, those with no children have the highest poverty rate, with 3 households (16.7%) experiencing poverty. Likewise, among single-mother households, those with 1 or 2 children have the highest poverty rate, with 3 households (8.1%) falling below the poverty line.
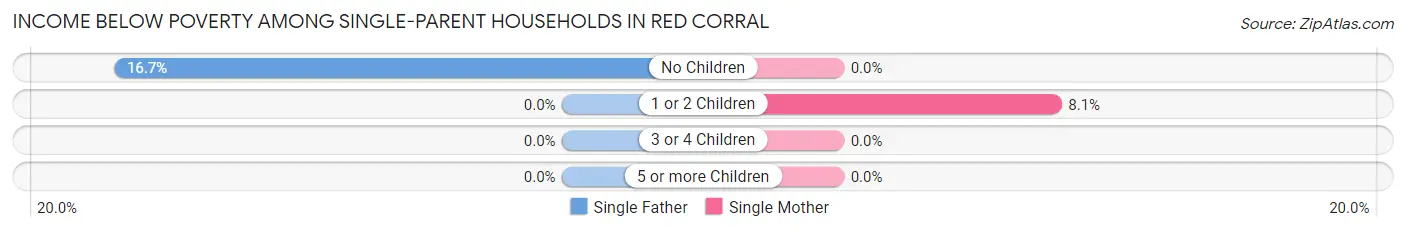
| Children | Single Father | Single Mother |
| No Children | 3 (16.7%) | 0 (0.0%) |
| 1 or 2 Children | 0 (0.0%) | 3 (8.1%) |
| 3 or 4 Children | 0 (0.0%) | 0 (0.0%) |
| 5 or more Children | 0 (0.0%) | 0 (0.0%) |
| Total | 3 (6.4%) | 3 (8.1%) |
Income Below Poverty Among Married-Couple vs Single-Parent Households in Red Corral
The poverty data for Red Corral shows that 5 of the married-couple family households (2.9%) and 6 of the single-parent households (7.1%) are living below the poverty level. Within the married-couple family households, those with no children have the highest poverty rate, with 5 households (4.0%) falling below the poverty line. Among the single-parent households, those with no children have the highest poverty rate, with 3 household (16.7%) living below poverty.
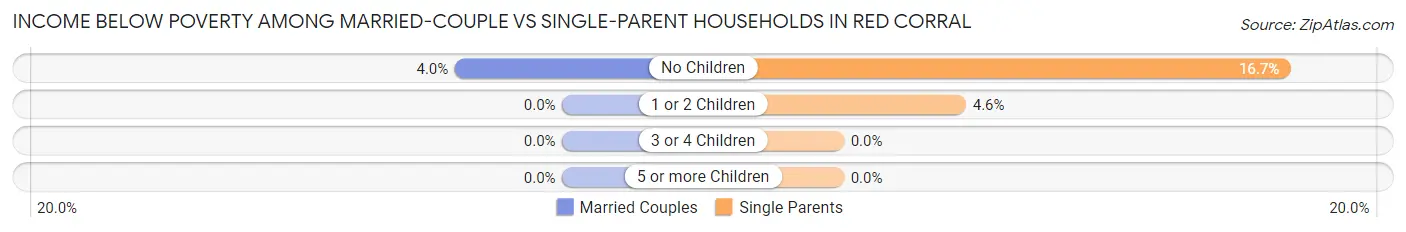
| Children | Married-Couple Families | Single-Parent Households |
| No Children | 5 (4.0%) | 3 (16.7%) |
| 1 or 2 Children | 0 (0.0%) | 3 (4.5%) |
| 3 or 4 Children | 0 (0.0%) | 0 (0.0%) |
| 5 or more Children | 0 (0.0%) | 0 (0.0%) |
| Total | 5 (2.9%) | 6 (7.1%) |
Race in Red Corral
The most populous races in Red Corral are White / Caucasian (850 | 66.9%), Hispanic or Latino (426 | 33.5%), and Two or more Races (321 | 25.3%).
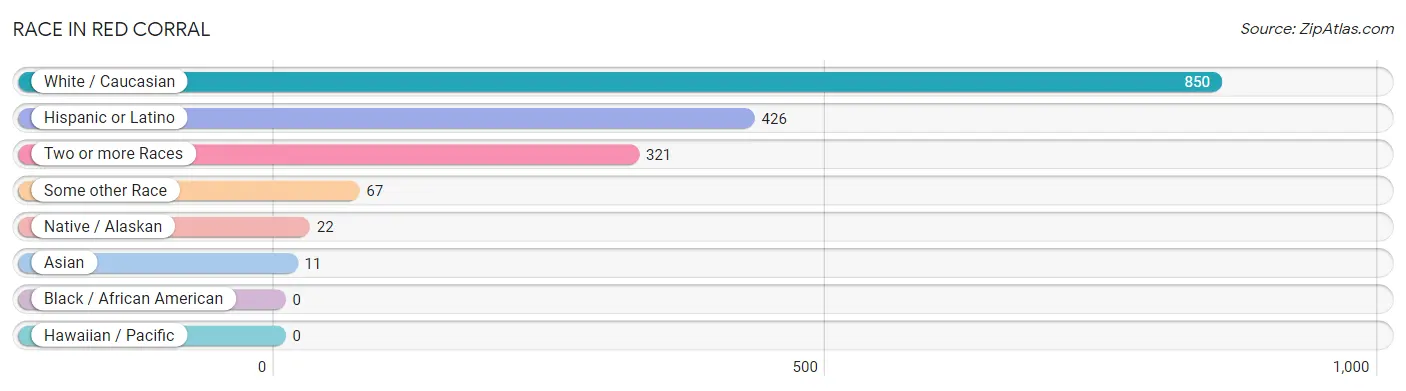
| Race | # Population | % Population |
| Asian | 11 | 0.9% |
| Black / African American | 0 | 0.0% |
| Hawaiian / Pacific | 0 | 0.0% |
| Hispanic or Latino | 426 | 33.5% |
| Native / Alaskan | 22 | 1.7% |
| White / Caucasian | 850 | 66.9% |
| Two or more Races | 321 | 25.3% |
| Some other Race | 67 | 5.3% |
| Total | 1,271 | 100.0% |
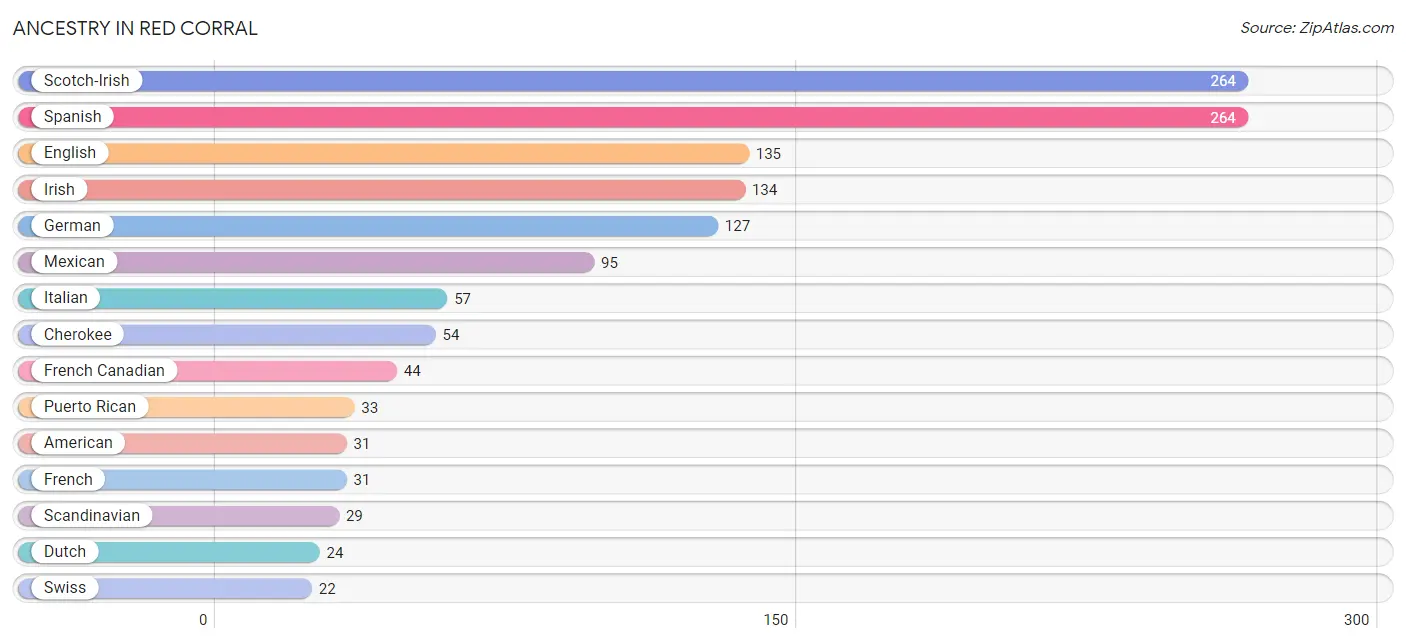
Ancestry in Red Corral
The most populous ancestries reported in Red Corral are Scotch-Irish (264 | 20.8%), Spanish (264 | 20.8%), English (135 | 10.6%), Irish (134 | 10.5%), and German (127 | 10.0%), together accounting for 72.7% of all Red Corral residents.
| Ancestry | # Population | % Population |
| American | 31 | 2.4% |
| Arab | 12 | 0.9% |
| Bhutanese | 6 | 0.5% |
| British | 8 | 0.6% |
| Central American | 16 | 1.3% |
| Cherokee | 54 | 4.3% |
| Colombian | 18 | 1.4% |
| Czech | 5 | 0.4% |
| Danish | 2 | 0.2% |
| Dutch | 24 | 1.9% |
| English | 135 | 10.6% |
| European | 20 | 1.6% |
| Finnish | 4 | 0.3% |
| French | 31 | 2.4% |
| French Canadian | 44 | 3.5% |
| German | 127 | 10.0% |
| Honduran | 16 | 1.3% |
| Irish | 134 | 10.5% |
| Italian | 57 | 4.5% |
| Korean | 14 | 1.1% |
| Lebanese | 12 | 0.9% |
| Mexican | 95 | 7.5% |
| Norwegian | 16 | 1.3% |
| Portuguese | 13 | 1.0% |
| Puerto Rican | 33 | 2.6% |
| Scandinavian | 29 | 2.3% |
| Scotch-Irish | 264 | 20.8% |
| Scottish | 6 | 0.5% |
| South American | 18 | 1.4% |
| Spanish | 264 | 20.8% |
| Swedish | 11 | 0.9% |
| Swiss | 22 | 1.7% |
| Yugoslavian | 6 | 0.5% | View All 33 Rows |
Immigrants in Red Corral
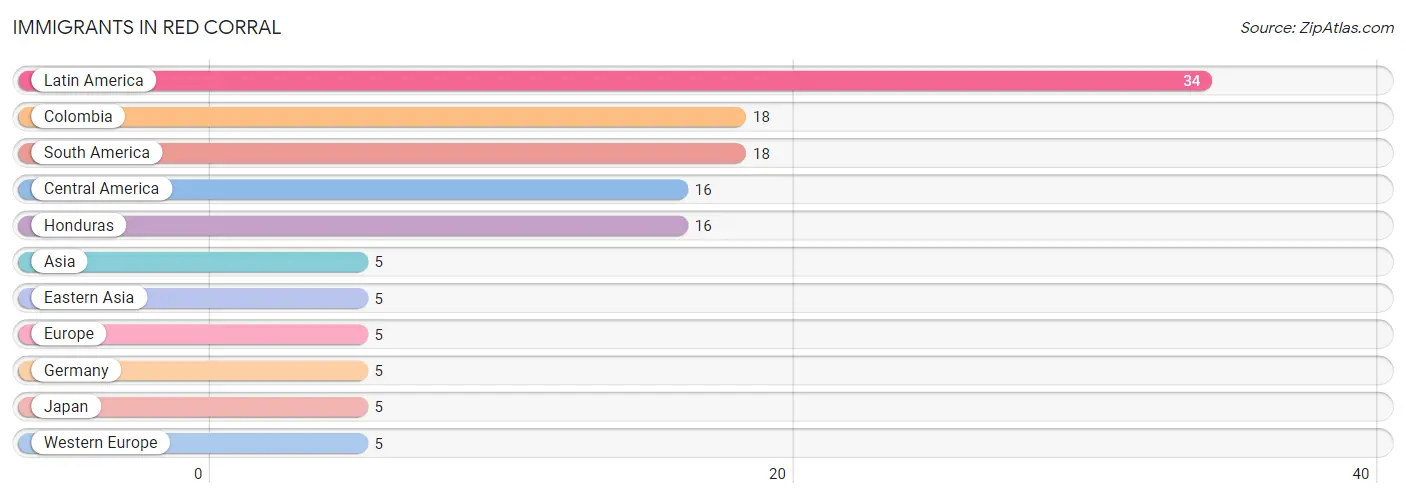
The most numerous immigrant groups reported in Red Corral came from Latin America (34 | 2.7%), Colombia (18 | 1.4%), South America (18 | 1.4%), Central America (16 | 1.3%), and Honduras (16 | 1.3%), together accounting for 8.0% of all Red Corral residents.
| Immigration Origin | # Population | % Population |
| Asia | 5 | 0.4% |
| Central America | 16 | 1.3% |
| Colombia | 18 | 1.4% |
| Eastern Asia | 5 | 0.4% |
| Europe | 5 | 0.4% |
| Germany | 5 | 0.4% |
| Honduras | 16 | 1.3% |
| Japan | 5 | 0.4% |
| Latin America | 34 | 2.7% |
| South America | 18 | 1.4% |
| Western Europe | 5 | 0.4% | View All 11 Rows |
Sex and Age in Red Corral
Sex and Age in Red Corral
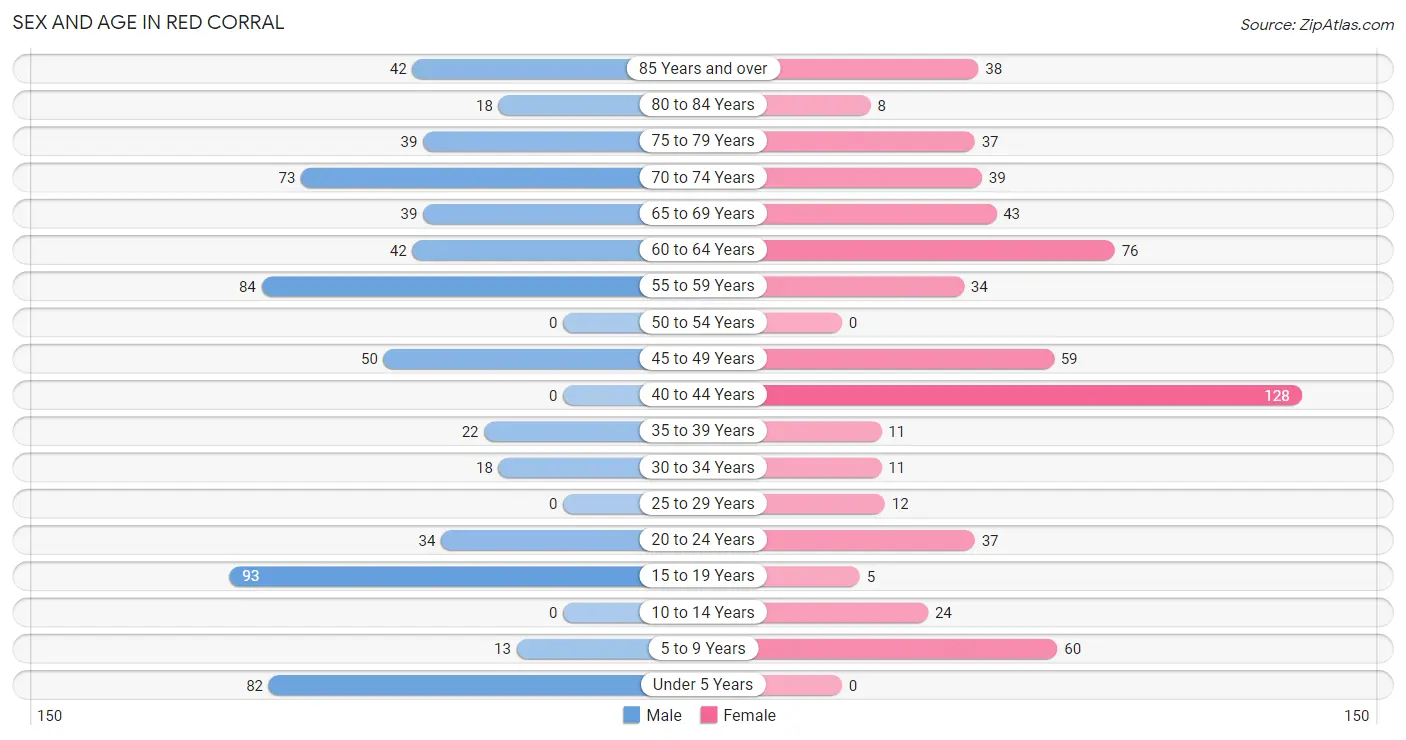
The most populous age groups in Red Corral are 15 to 19 Years (93 | 14.3%) for men and 40 to 44 Years (128 | 20.6%) for women.
| Age Bracket | Male | Female |
| Under 5 Years | 82 (12.6%) | 0 (0.0%) |
| 5 to 9 Years | 13 (2.0%) | 60 (9.7%) |
| 10 to 14 Years | 0 (0.0%) | 24 (3.9%) |
| 15 to 19 Years | 93 (14.3%) | 5 (0.8%) |
| 20 to 24 Years | 34 (5.2%) | 37 (5.9%) |
| 25 to 29 Years | 0 (0.0%) | 12 (1.9%) |
| 30 to 34 Years | 18 (2.8%) | 11 (1.8%) |
| 35 to 39 Years | 22 (3.4%) | 11 (1.8%) |
| 40 to 44 Years | 0 (0.0%) | 128 (20.6%) |
| 45 to 49 Years | 50 (7.7%) | 59 (9.5%) |
| 50 to 54 Years | 0 (0.0%) | 0 (0.0%) |
| 55 to 59 Years | 84 (12.9%) | 34 (5.5%) |
| 60 to 64 Years | 42 (6.5%) | 76 (12.2%) |
| 65 to 69 Years | 39 (6.0%) | 43 (6.9%) |
| 70 to 74 Years | 73 (11.3%) | 39 (6.3%) |
| 75 to 79 Years | 39 (6.0%) | 37 (5.9%) |
| 80 to 84 Years | 18 (2.8%) | 8 (1.3%) |
| 85 Years and over | 42 (6.5%) | 38 (6.1%) |
| Total | 649 (100.0%) | 622 (100.0%) |
Families and Households in Red Corral
Median Family Size in Red Corral
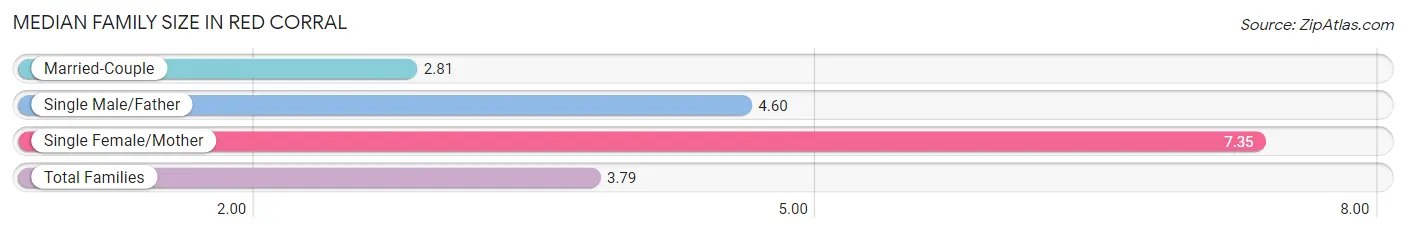
The median family size in Red Corral is 3.79 persons per family, with single female/mother families (37 | 14.4%) accounting for the largest median family size of 7.35 persons per family. On the other hand, married-couple families (173 | 67.3%) represent the smallest median family size with 2.81 persons per family.
| Family Type | # Families | Family Size |
| Married-Couple | 173 (67.3%) | 2.81 |
| Single Male/Father | 47 (18.3%) | 4.60 |
| Single Female/Mother | 37 (14.4%) | 7.35 |
| Total Families | 257 (100.0%) | 3.79 |
Median Household Size in Red Corral
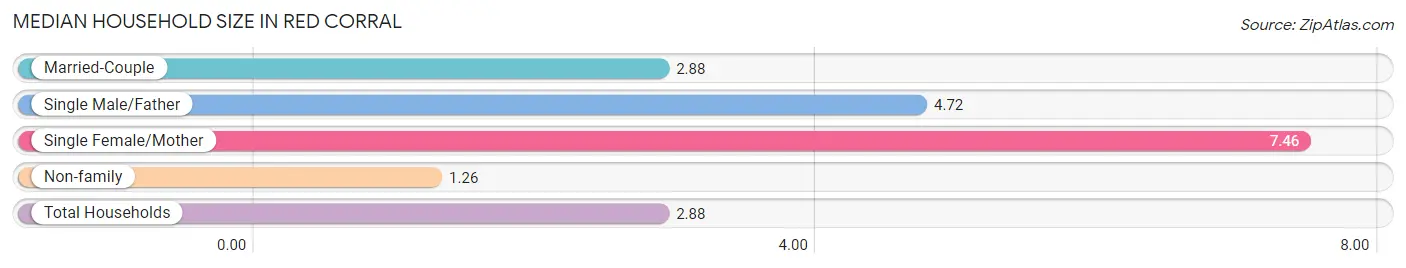
The median household size in Red Corral is 2.88 persons per household, with single female/mother households (37 | 8.9%) accounting for the largest median household size of 7.46 persons per household. non-family households (159 | 38.2%) represent the smallest median household size with 1.26 persons per household.
| Household Type | # Households | Household Size |
| Married-Couple | 173 (41.6%) | 2.88 |
| Single Male/Father | 47 (11.3%) | 4.72 |
| Single Female/Mother | 37 (8.9%) | 7.46 |
| Non-family | 159 (38.2%) | 1.26 |
| Total Households | 416 (100.0%) | 2.88 |
Household Size by Marriage Status in Red Corral
Out of a total of 416 households in Red Corral, 257 (61.8%) are family households, while 159 (38.2%) are nonfamily households. The most numerous type of family households are 4-person households, comprising 109, and the most common type of nonfamily households are 1-person households, comprising 114.
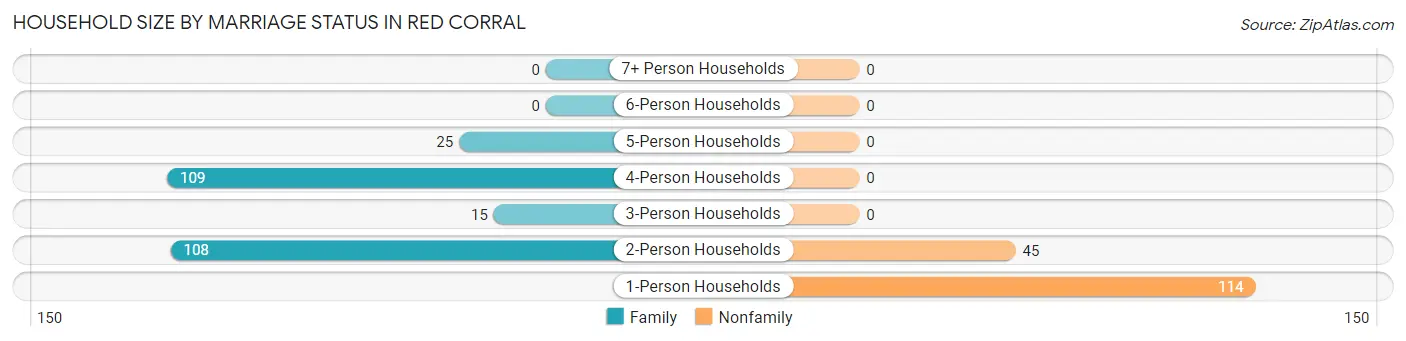
| Household Size | Family Households | Nonfamily Households |
| 1-Person Households | - | 114 (27.4%) |
| 2-Person Households | 108 (26.0%) | 45 (10.8%) |
| 3-Person Households | 15 (3.6%) | 0 (0.0%) |
| 4-Person Households | 109 (26.2%) | 0 (0.0%) |
| 5-Person Households | 25 (6.0%) | 0 (0.0%) |
| 6-Person Households | 0 (0.0%) | 0 (0.0%) |
| 7+ Person Households | 0 (0.0%) | 0 (0.0%) |
| Total | 257 (61.8%) | 159 (38.2%) |
Female Fertility in Red Corral
Fertility by Age in Red Corral
| Age Bracket | Women with Births | Births / 1,000 Women |
| 15 to 19 years | 0 (0.0%) | 0.0 |
| 20 to 34 years | 0 (0.0%) | 0.0 |
| 35 to 50 years | 0 (0.0%) | 0.0 |
| Total | 0 (0.0%) | 0.0 |
Fertility by Age by Marriage Status in Red Corral
| Age Bracket | Married | Unmarried |
| 15 to 19 years | 0 (0.0%) | 0 (0.0%) |
| 20 to 34 years | 0 (0.0%) | 0 (0.0%) |
| 35 to 50 years | 0 (0.0%) | 0 (0.0%) |
| Total | 0 (0.0%) | 0 (0.0%) |
Fertility by Education in Red Corral
| Educational Attainment | Women with Births | Births / 1,000 Women |
| Less than High School | 0 (0.0%) | 0.0 |
| High School Diploma | 0 (0.0%) | 0.0 |
| College or Associate's Degree | 0 (0.0%) | 0.0 |
| Bachelor's Degree | 0 (0.0%) | 0.0 |
| Graduate Degree | 0 (0.0%) | 0.0 |
| Total | 0 (0.0%) | 0.0 |
Fertility by Education by Marriage Status in Red Corral
| Educational Attainment | Married | Unmarried |
| Less than High School | 0 (0.0%) | 0 (0.0%) |
| High School Diploma | 0 (0.0%) | 0 (0.0%) |
| College or Associate's Degree | 0 (0.0%) | 0 (0.0%) |
| Bachelor's Degree | 0 (0.0%) | 0 (0.0%) |
| Graduate Degree | 0 (0.0%) | 0 (0.0%) |
| Total | 0 (0.0%) | 0 (0.0%) |
Employment Characteristics in Red Corral
Employment by Class of Employer in Red Corral
Among the 266 employed individuals in Red Corral, private company employees (153 | 57.5%), self-employed (not incorporated) (68 | 25.6%), and self-employed (incorporated) (22 | 8.3%) make up the most common classes of employment.
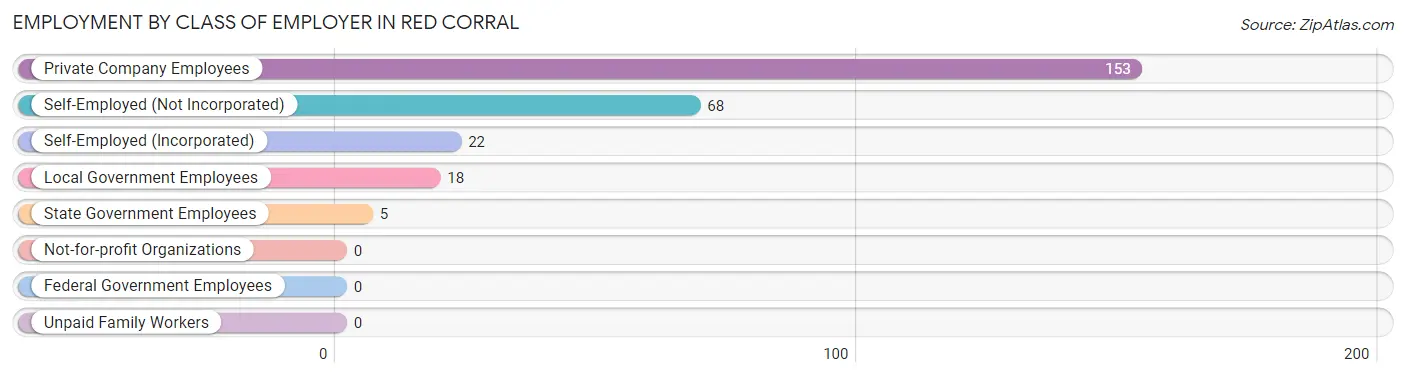
| Employer Class | # Employees | % Employees |
| Private Company Employees | 153 | 57.5% |
| Self-Employed (Incorporated) | 22 | 8.3% |
| Self-Employed (Not Incorporated) | 68 | 25.6% |
| Not-for-profit Organizations | 0 | 0.0% |
| Local Government Employees | 18 | 6.8% |
| State Government Employees | 5 | 1.9% |
| Federal Government Employees | 0 | 0.0% |
| Unpaid Family Workers | 0 | 0.0% |
| Total | 266 | 100.0% |
Employment Status by Age in Red Corral
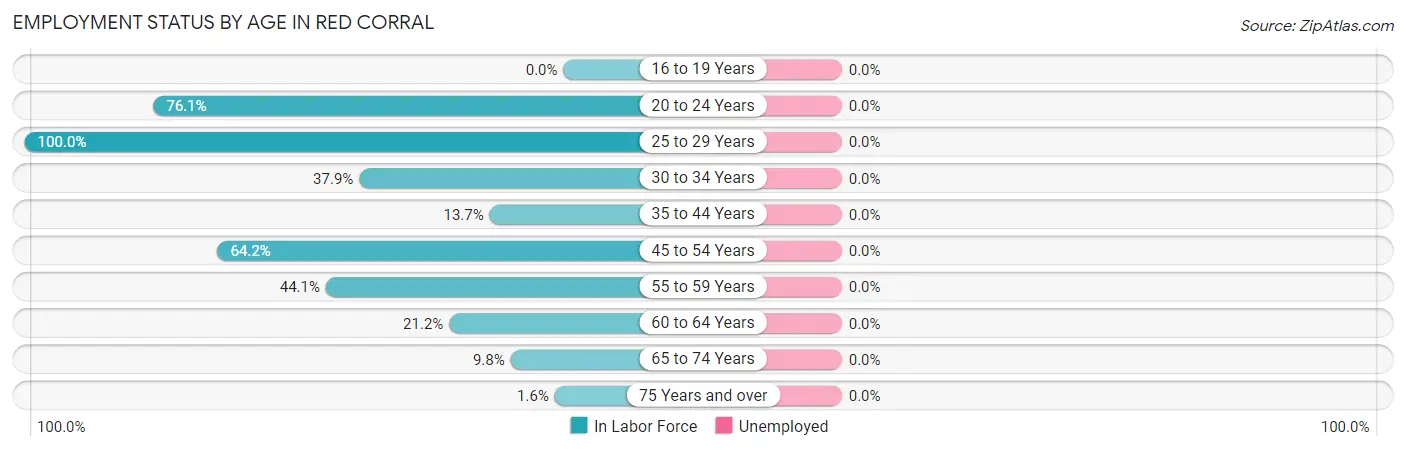
| Age Bracket | In Labor Force | Unemployed |
| 16 to 19 Years | 0 (0.0%) | 0 (0.0%) |
| 20 to 24 Years | 54 (76.1%) | 0 (0.0%) |
| 25 to 29 Years | 12 (100.0%) | 0 (0.0%) |
| 30 to 34 Years | 11 (37.9%) | 0 (0.0%) |
| 35 to 44 Years | 22 (13.7%) | 0 (0.0%) |
| 45 to 54 Years | 70 (64.2%) | 0 (0.0%) |
| 55 to 59 Years | 52 (44.1%) | 0 (0.0%) |
| 60 to 64 Years | 25 (21.2%) | 0 (0.0%) |
| 65 to 74 Years | 19 (9.8%) | 0 (0.0%) |
| 75 Years and over | 3 (1.6%) | 0 (0.0%) |
| Total | 268 (24.5%) | 0 (0.0%) |
Employment Status by Educational Attainment in Red Corral
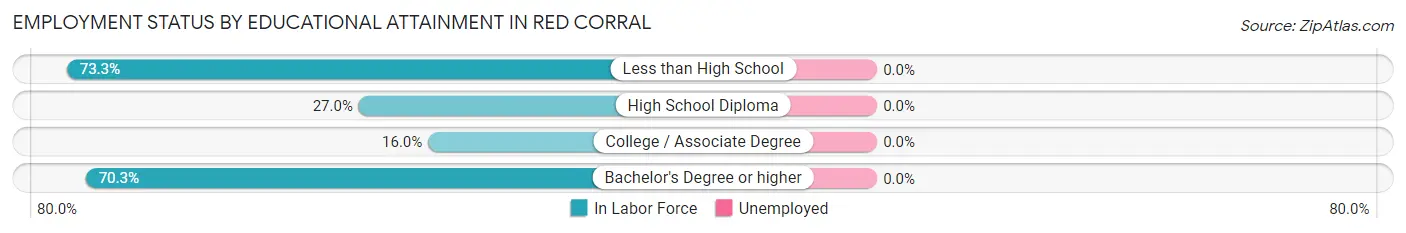
| Educational Attainment | In Labor Force | Unemployed |
| Less than High School | 33 (73.3%) | 0 (0.0%) |
| High School Diploma | 72 (27.0%) | 0 (0.0%) |
| College / Associate Degree | 23 (16.0%) | 0 (0.0%) |
| Bachelor's Degree or higher | 64 (70.3%) | 0 (0.0%) |
| Total | 192 (35.1%) | 0 (0.0%) |
Employment Occupations by Sex in Red Corral
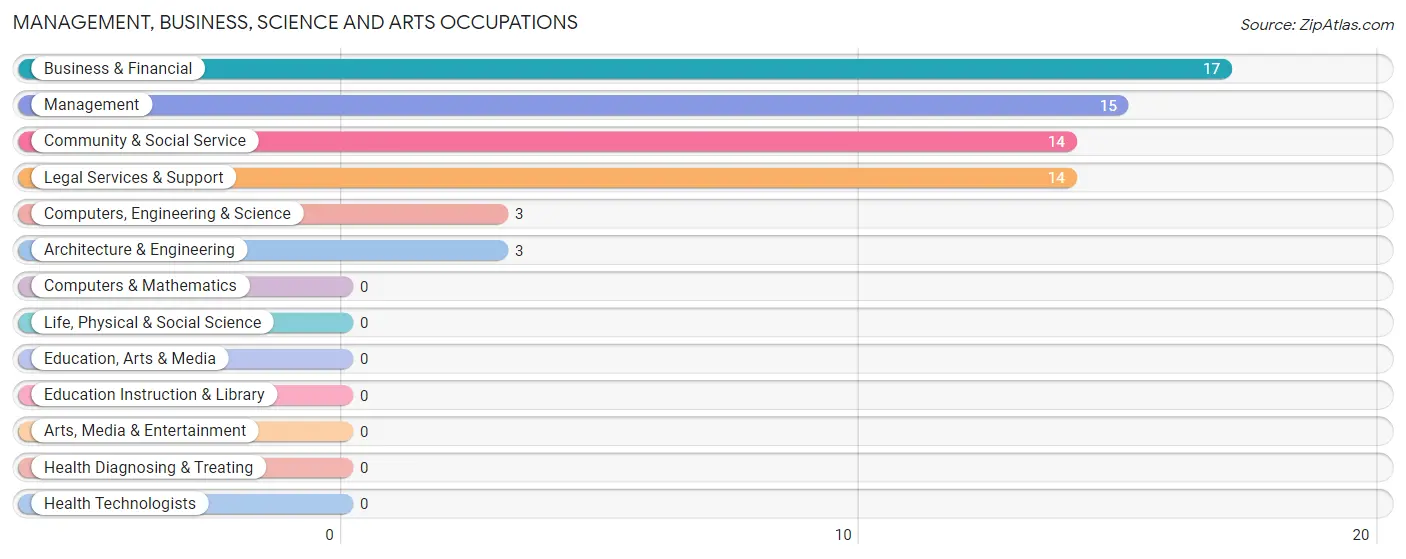
Management, Business, Science and Arts Occupations
The most common Management, Business, Science and Arts occupations in Red Corral are Business & Financial (17 | 6.3%), Management (15 | 5.6%), Community & Social Service (14 | 5.2%), Legal Services & Support (14 | 5.2%), and Computers, Engineering & Science (3 | 1.1%).
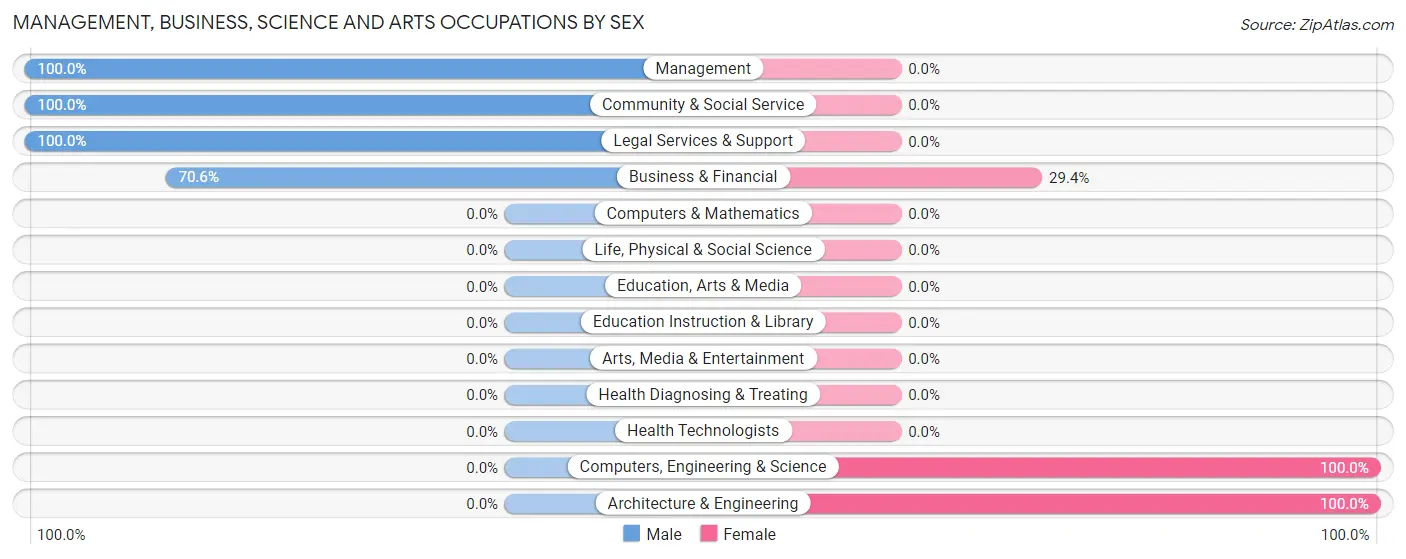
Management, Business, Science and Arts Occupations by Sex
Within the Management, Business, Science and Arts occupations in Red Corral, the most male-oriented occupations are Management (100.0%), Community & Social Service (100.0%), and Legal Services & Support (100.0%), while the most female-oriented occupations are Computers, Engineering & Science (100.0%), Architecture & Engineering (100.0%), and Business & Financial (29.4%).
| Occupation | Male | Female |
| Management | 15 (100.0%) | 0 (0.0%) |
| Business & Financial | 12 (70.6%) | 5 (29.4%) |
| Computers, Engineering & Science | 0 (0.0%) | 3 (100.0%) |
| Computers & Mathematics | 0 (0.0%) | 0 (0.0%) |
| Architecture & Engineering | 0 (0.0%) | 3 (100.0%) |
| Life, Physical & Social Science | 0 (0.0%) | 0 (0.0%) |
| Community & Social Service | 14 (100.0%) | 0 (0.0%) |
| Education, Arts & Media | 0 (0.0%) | 0 (0.0%) |
| Legal Services & Support | 14 (100.0%) | 0 (0.0%) |
| Education Instruction & Library | 0 (0.0%) | 0 (0.0%) |
| Arts, Media & Entertainment | 0 (0.0%) | 0 (0.0%) |
| Health Diagnosing & Treating | 0 (0.0%) | 0 (0.0%) |
| Health Technologists | 0 (0.0%) | 0 (0.0%) |
| Total (Category) | 41 (83.7%) | 8 (16.3%) |
| Total (Overall) | 156 (58.2%) | 112 (41.8%) |
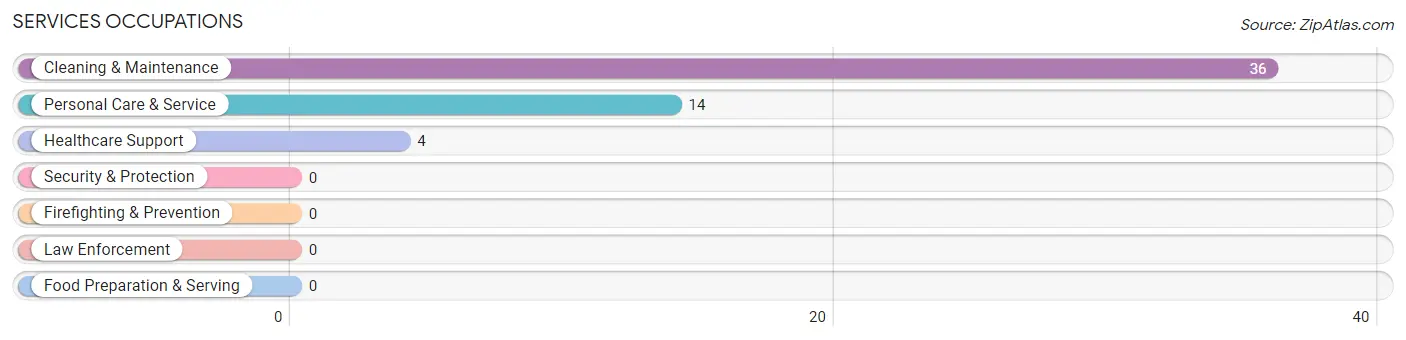
Services Occupations
The most common Services occupations in Red Corral are Cleaning & Maintenance (36 | 13.4%), Personal Care & Service (14 | 5.2%), and Healthcare Support (4 | 1.5%).
Services Occupations by Sex
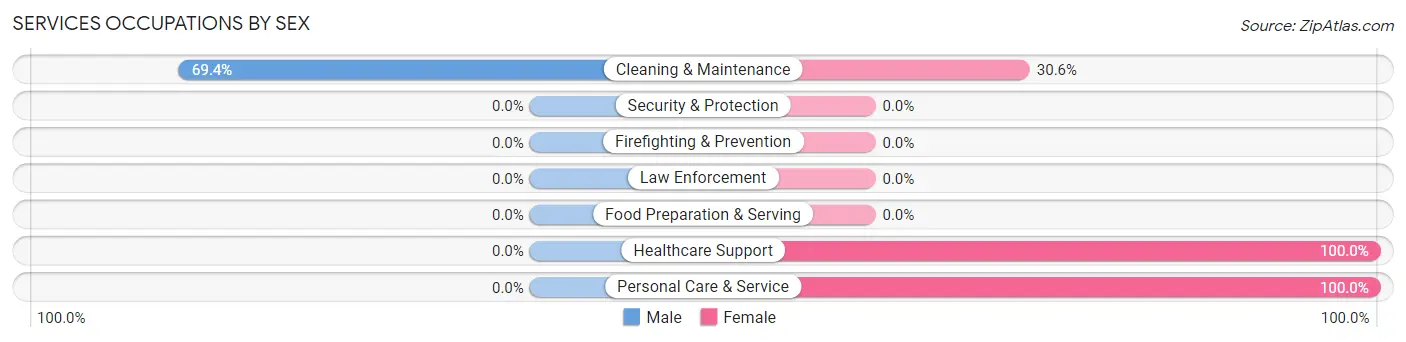
| Occupation | Male | Female |
| Healthcare Support | 0 (0.0%) | 4 (100.0%) |
| Security & Protection | 0 (0.0%) | 0 (0.0%) |
| Firefighting & Prevention | 0 (0.0%) | 0 (0.0%) |
| Law Enforcement | 0 (0.0%) | 0 (0.0%) |
| Food Preparation & Serving | 0 (0.0%) | 0 (0.0%) |
| Cleaning & Maintenance | 25 (69.4%) | 11 (30.6%) |
| Personal Care & Service | 0 (0.0%) | 14 (100.0%) |
| Total (Category) | 25 (46.3%) | 29 (53.7%) |
| Total (Overall) | 156 (58.2%) | 112 (41.8%) |
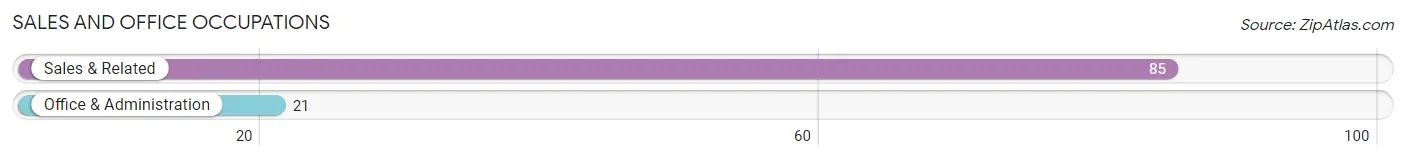
Sales and Office Occupations
The most common Sales and Office occupations in Red Corral are Sales & Related (85 | 31.7%), and Office & Administration (21 | 7.8%).
Sales and Office Occupations by Sex
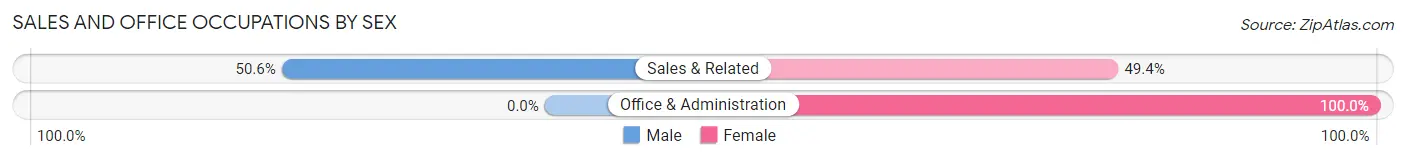
| Occupation | Male | Female |
| Sales & Related | 43 (50.6%) | 42 (49.4%) |
| Office & Administration | 0 (0.0%) | 21 (100.0%) |
| Total (Category) | 43 (40.6%) | 63 (59.4%) |
| Total (Overall) | 156 (58.2%) | 112 (41.8%) |
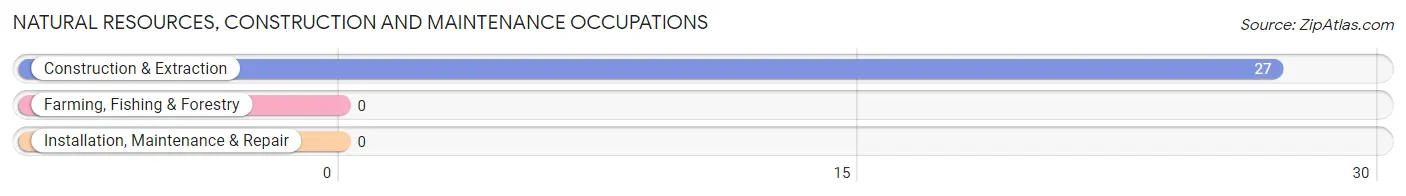
Natural Resources, Construction and Maintenance Occupations
The most common Natural Resources, Construction and Maintenance occupations in Red Corral are , and Construction & Extraction (27 | 10.1%).
Natural Resources, Construction and Maintenance Occupations by Sex
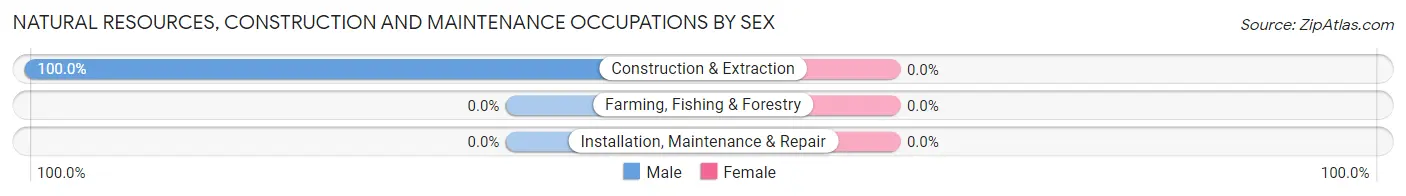
| Occupation | Male | Female |
| Farming, Fishing & Forestry | 0 (0.0%) | 0 (0.0%) |
| Construction & Extraction | 27 (100.0%) | 0 (0.0%) |
| Installation, Maintenance & Repair | 0 (0.0%) | 0 (0.0%) |
| Total (Category) | 27 (100.0%) | 0 (0.0%) |
| Total (Overall) | 156 (58.2%) | 112 (41.8%) |
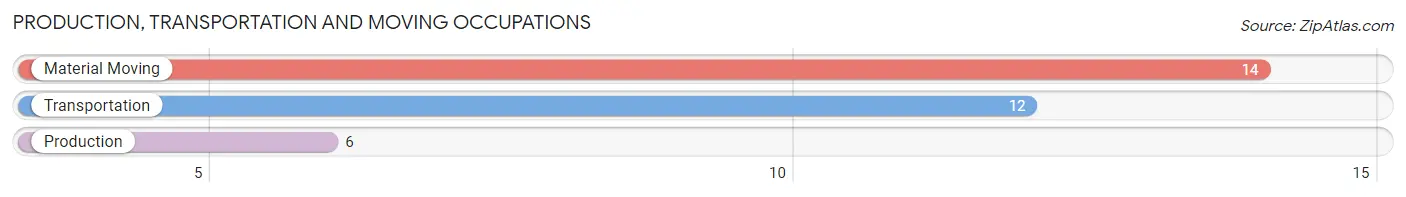
Production, Transportation and Moving Occupations
The most common Production, Transportation and Moving occupations in Red Corral are Material Moving (14 | 5.2%), Transportation (12 | 4.5%), and Production (6 | 2.2%).
Production, Transportation and Moving Occupations by Sex
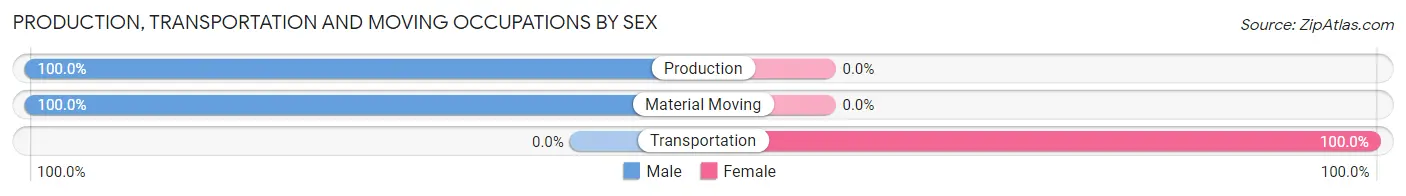
| Occupation | Male | Female |
| Production | 6 (100.0%) | 0 (0.0%) |
| Transportation | 0 (0.0%) | 12 (100.0%) |
| Material Moving | 14 (100.0%) | 0 (0.0%) |
| Total (Category) | 20 (62.5%) | 12 (37.5%) |
| Total (Overall) | 156 (58.2%) | 112 (41.8%) |
Employment Industries by Sex in Red Corral
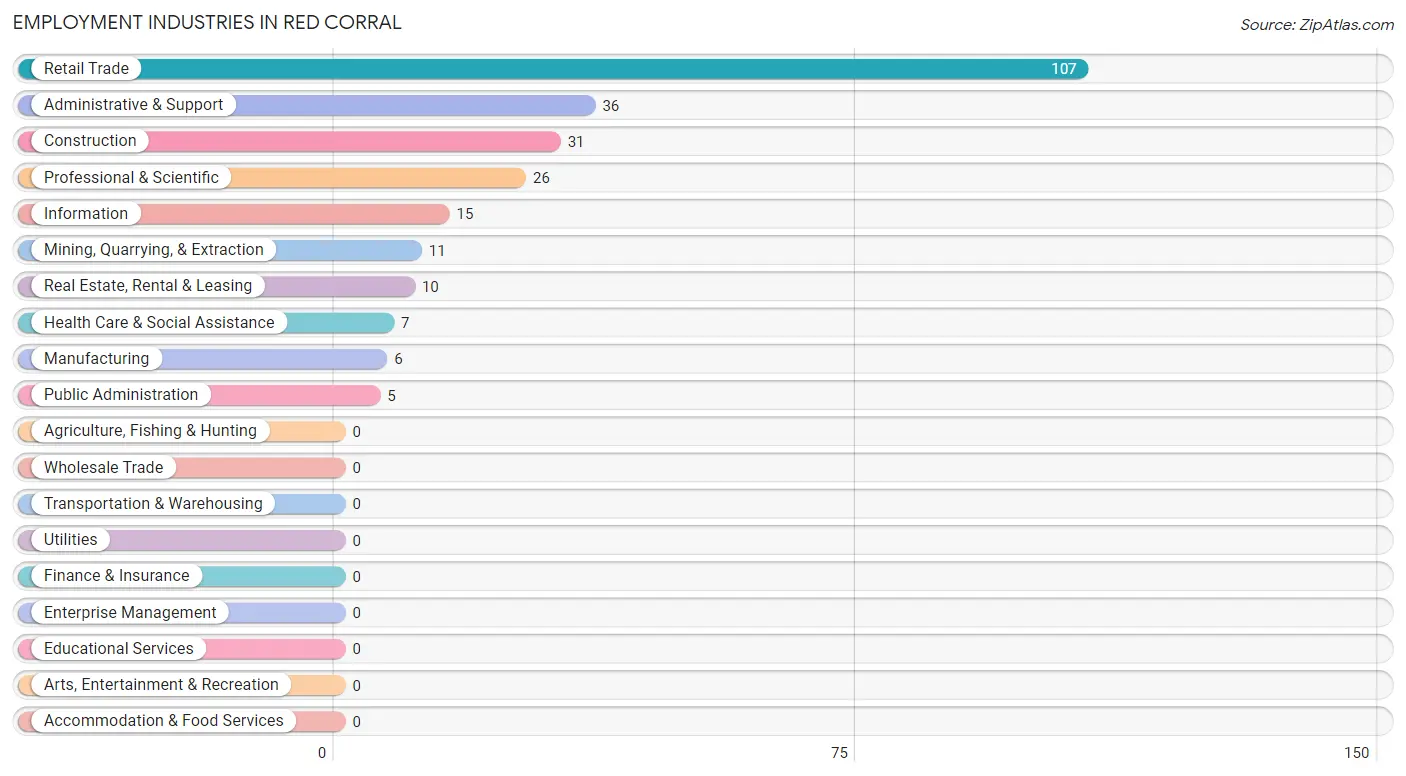
Employment Industries in Red Corral
The major employment industries in Red Corral include Retail Trade (107 | 39.9%), Administrative & Support (36 | 13.4%), Construction (31 | 11.6%), Professional & Scientific (26 | 9.7%), and Information (15 | 5.6%).
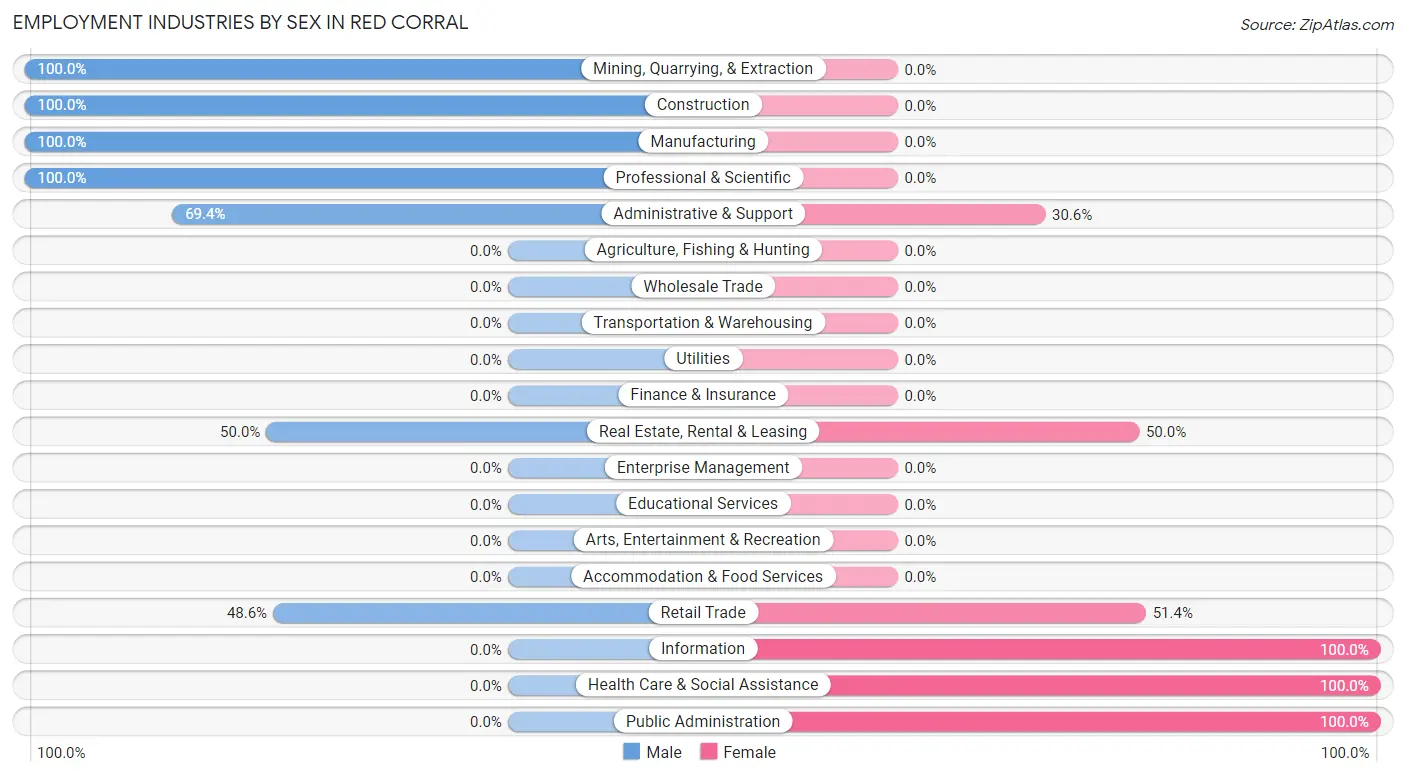
Employment Industries by Sex in Red Corral
The Red Corral industries that see more men than women are Mining, Quarrying, & Extraction (100.0%), Construction (100.0%), and Manufacturing (100.0%), whereas the industries that tend to have a higher number of women are Information (100.0%), Health Care & Social Assistance (100.0%), and Public Administration (100.0%).
| Industry | Male | Female |
| Agriculture, Fishing & Hunting | 0 (0.0%) | 0 (0.0%) |
| Mining, Quarrying, & Extraction | 11 (100.0%) | 0 (0.0%) |
| Construction | 31 (100.0%) | 0 (0.0%) |
| Manufacturing | 6 (100.0%) | 0 (0.0%) |
| Wholesale Trade | 0 (0.0%) | 0 (0.0%) |
| Retail Trade | 52 (48.6%) | 55 (51.4%) |
| Transportation & Warehousing | 0 (0.0%) | 0 (0.0%) |
| Utilities | 0 (0.0%) | 0 (0.0%) |
| Information | 0 (0.0%) | 15 (100.0%) |
| Finance & Insurance | 0 (0.0%) | 0 (0.0%) |
| Real Estate, Rental & Leasing | 5 (50.0%) | 5 (50.0%) |
| Professional & Scientific | 26 (100.0%) | 0 (0.0%) |
| Enterprise Management | 0 (0.0%) | 0 (0.0%) |
| Administrative & Support | 25 (69.4%) | 11 (30.6%) |
| Educational Services | 0 (0.0%) | 0 (0.0%) |
| Health Care & Social Assistance | 0 (0.0%) | 7 (100.0%) |
| Arts, Entertainment & Recreation | 0 (0.0%) | 0 (0.0%) |
| Accommodation & Food Services | 0 (0.0%) | 0 (0.0%) |
| Public Administration | 0 (0.0%) | 5 (100.0%) |
| Total | 156 (58.2%) | 112 (41.8%) |
Education in Red Corral
School Enrollment in Red Corral
The most common levels of schooling among the 191 students in Red Corral are high school (121 | 63.3%), graduate / professional (32 | 16.8%), and middle school (24 | 12.6%).
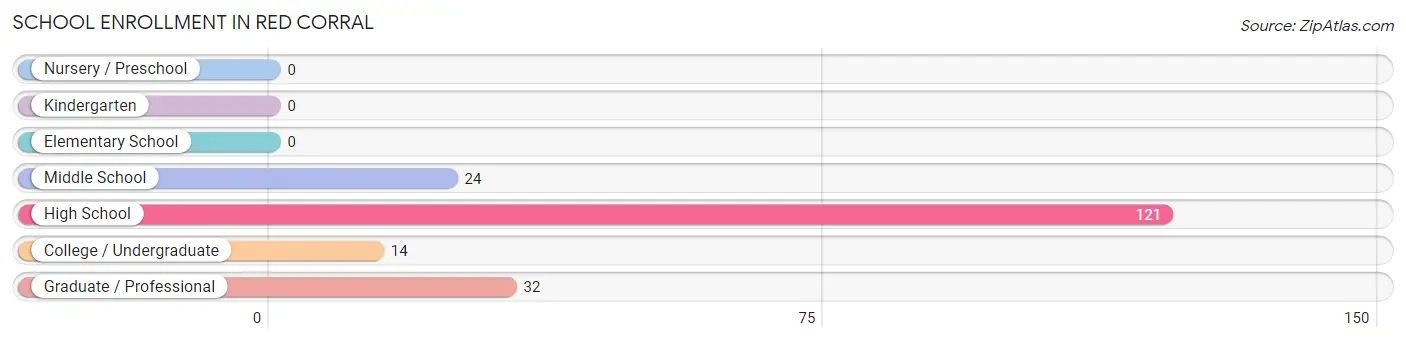
| School Level | # Students | % Students |
| Nursery / Preschool | 0 | 0.0% |
| Kindergarten | 0 | 0.0% |
| Elementary School | 0 | 0.0% |
| Middle School | 24 | 12.6% |
| High School | 121 | 63.3% |
| College / Undergraduate | 14 | 7.3% |
| Graduate / Professional | 32 | 16.8% |
| Total | 191 | 100.0% |
School Enrollment by Age by Funding Source in Red Corral
Out of a total of 191 students who are enrolled in schools in Red Corral, 46 (24.1%) attend a private institution, while the remaining 145 (75.9%) are enrolled in public schools. The age group of 35 years and over has the highest likelihood of being enrolled in private schools, with 32 (100.0% in the age bracket) enrolled. Conversely, the age group of 10 to 14 year olds has the lowest likelihood of being enrolled in a private school, with 24 (100.0% in the age bracket) attending a public institution.
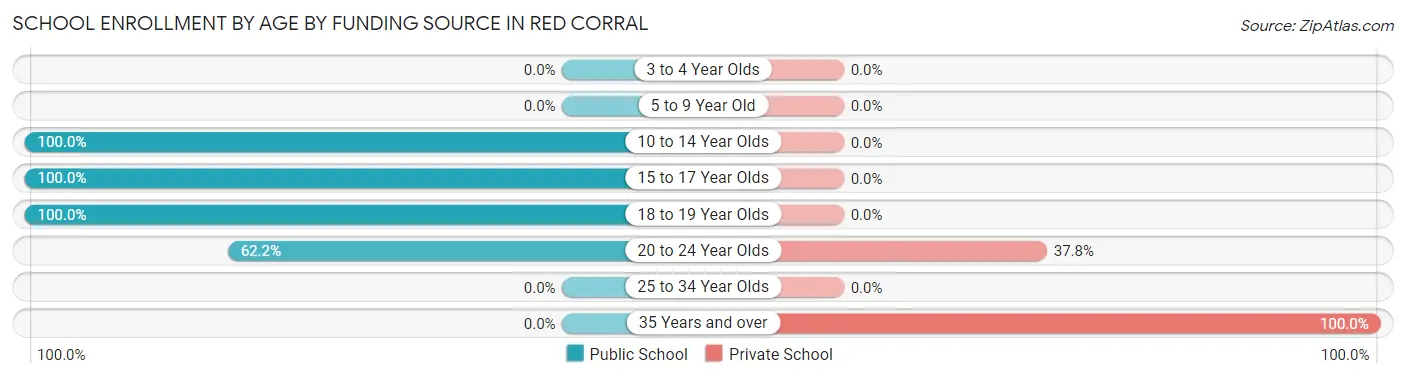
| Age Bracket | Public School | Private School |
| 3 to 4 Year Olds | 0 (0.0%) | 0 (0.0%) |
| 5 to 9 Year Old | 0 (0.0%) | 0 (0.0%) |
| 10 to 14 Year Olds | 24 (100.0%) | 0 (0.0%) |
| 15 to 17 Year Olds | 85 (100.0%) | 0 (0.0%) |
| 18 to 19 Year Olds | 13 (100.0%) | 0 (0.0%) |
| 20 to 24 Year Olds | 23 (62.2%) | 14 (37.8%) |
| 25 to 34 Year Olds | 0 (0.0%) | 0 (0.0%) |
| 35 Years and over | 0 (0.0%) | 32 (100.0%) |
| Total | 145 (75.9%) | 46 (24.1%) |
Educational Attainment by Field of Study in Red Corral
Education (43 | 25.4%), bio, nature & agricultural (34 | 20.1%), visual & performing arts (31 | 18.3%), communications (22 | 13.0%), and social sciences (18 | 10.6%) are the most common fields of study among 169 individuals in Red Corral who have obtained a bachelor's degree or higher.
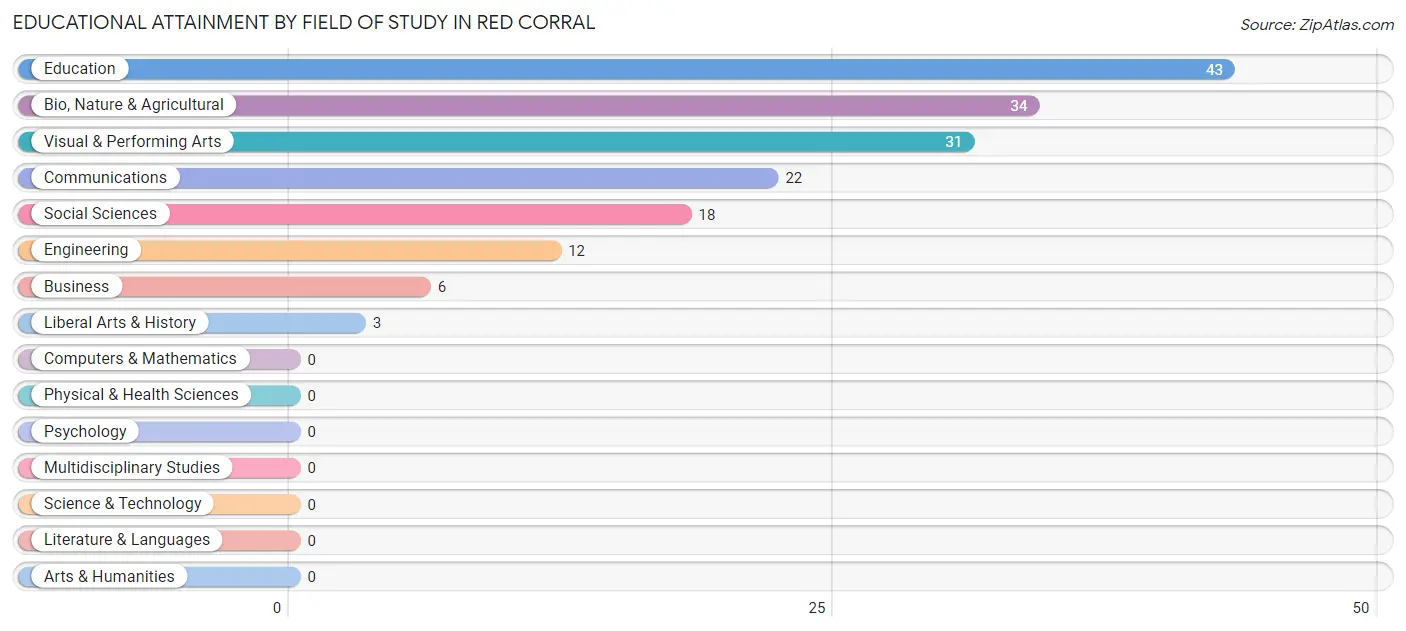
| Field of Study | # Graduates | % Graduates |
| Computers & Mathematics | 0 | 0.0% |
| Bio, Nature & Agricultural | 34 | 20.1% |
| Physical & Health Sciences | 0 | 0.0% |
| Psychology | 0 | 0.0% |
| Social Sciences | 18 | 10.6% |
| Engineering | 12 | 7.1% |
| Multidisciplinary Studies | 0 | 0.0% |
| Science & Technology | 0 | 0.0% |
| Business | 6 | 3.5% |
| Education | 43 | 25.4% |
| Literature & Languages | 0 | 0.0% |
| Liberal Arts & History | 3 | 1.8% |
| Visual & Performing Arts | 31 | 18.3% |
| Communications | 22 | 13.0% |
| Arts & Humanities | 0 | 0.0% |
| Total | 169 | 100.0% |
Transportation & Commute in Red Corral
Vehicle Availability by Sex in Red Corral
The most prevalent vehicle ownership categories in Red Corral are males with 2 vehicles (60, accounting for 39.0%) and females with 2 vehicles (32, making up 53.6%).
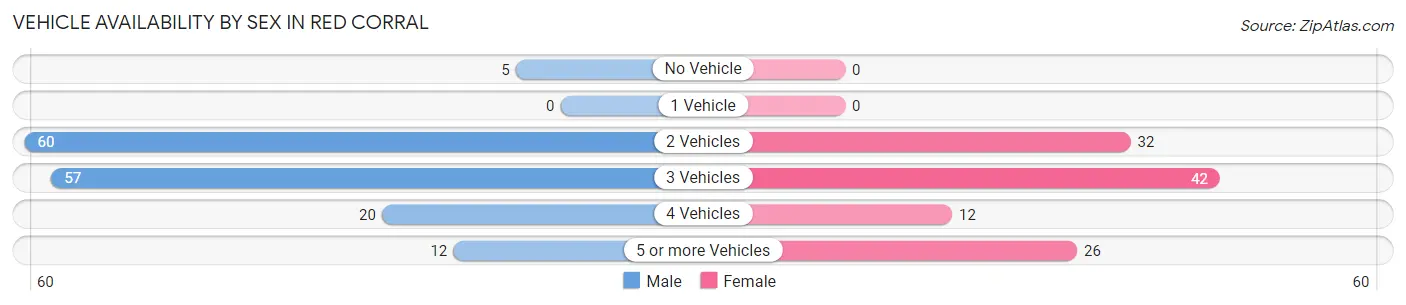
| Vehicles Available | Male | Female |
| No Vehicle | 5 (3.3%) | 0 (0.0%) |
| 1 Vehicle | 0 (0.0%) | 0 (0.0%) |
| 2 Vehicles | 60 (39.0%) | 32 (28.6%) |
| 3 Vehicles | 57 (37.0%) | 42 (37.5%) |
| 4 Vehicles | 20 (13.0%) | 12 (10.7%) |
| 5 or more Vehicles | 12 (7.8%) | 26 (23.2%) |
| Total | 154 (100.0%) | 112 (100.0%) |
Commute Time in Red Corral
The most frequently occuring commute durations in Red Corral are 30 to 34 minutes (97 commuters, 39.4%), 15 to 19 minutes (51 commuters, 20.7%), and 20 to 24 minutes (23 commuters, 9.3%).
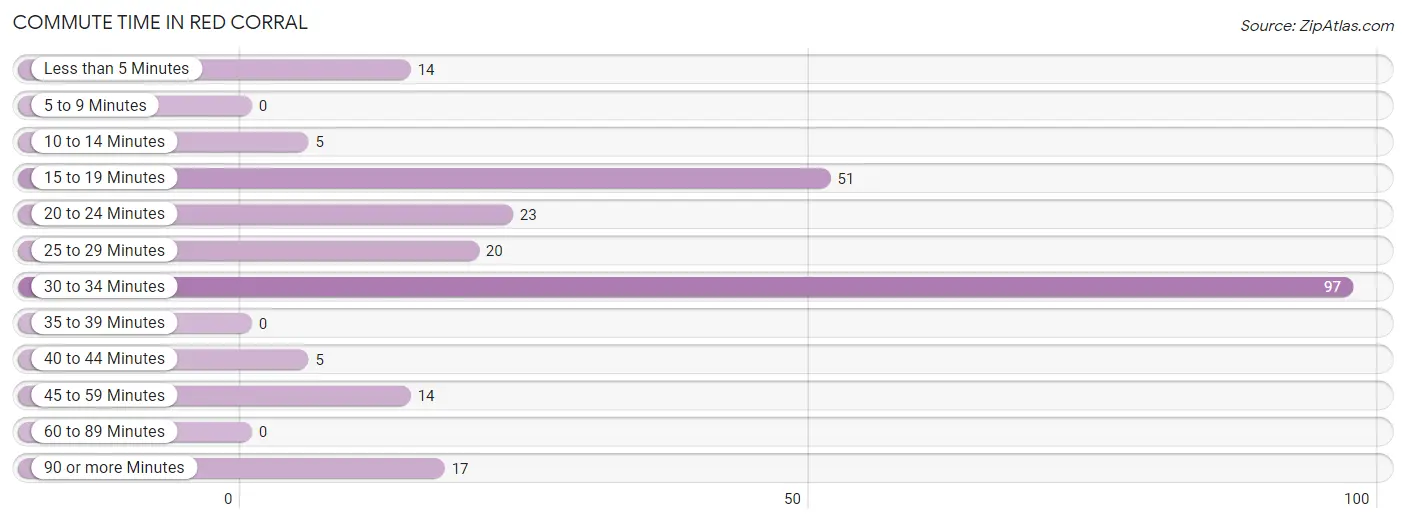
| Commute Time | # Commuters | % Commuters |
| Less than 5 Minutes | 14 | 5.7% |
| 5 to 9 Minutes | 0 | 0.0% |
| 10 to 14 Minutes | 5 | 2.0% |
| 15 to 19 Minutes | 51 | 20.7% |
| 20 to 24 Minutes | 23 | 9.3% |
| 25 to 29 Minutes | 20 | 8.1% |
| 30 to 34 Minutes | 97 | 39.4% |
| 35 to 39 Minutes | 0 | 0.0% |
| 40 to 44 Minutes | 5 | 2.0% |
| 45 to 59 Minutes | 14 | 5.7% |
| 60 to 89 Minutes | 0 | 0.0% |
| 90 or more Minutes | 17 | 6.9% |
Commute Time by Sex in Red Corral
The most common commute times in Red Corral are 30 to 34 minutes (60 commuters, 42.2%) for males and 30 to 34 minutes (37 commuters, 35.6%) for females.
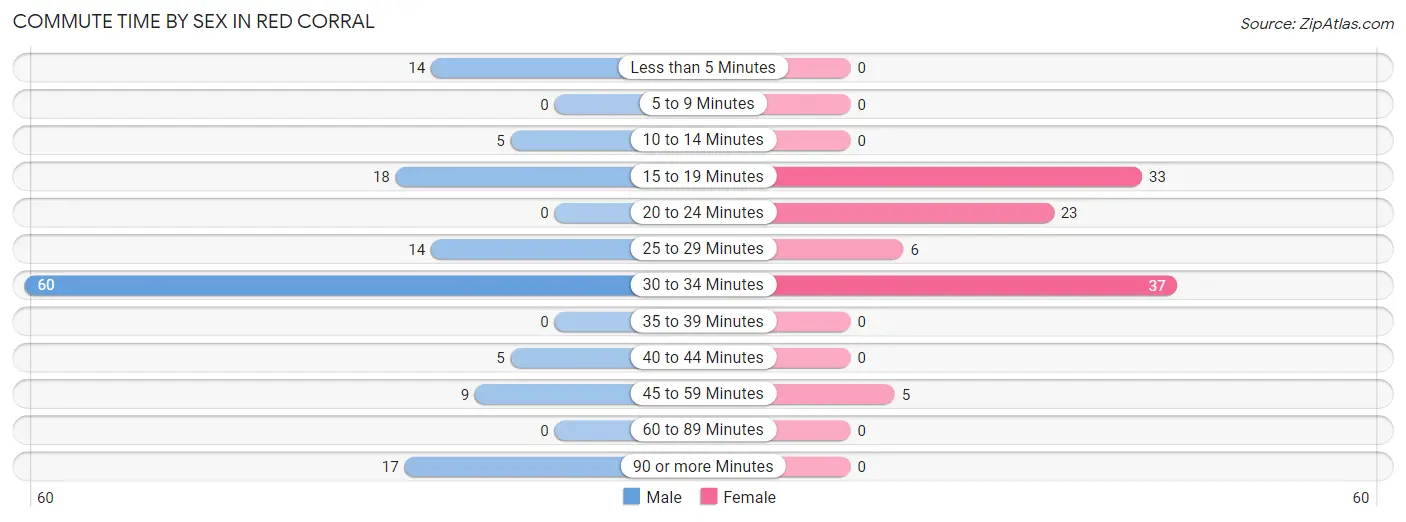
| Commute Time | Male | Female |
| Less than 5 Minutes | 14 (9.9%) | 0 (0.0%) |
| 5 to 9 Minutes | 0 (0.0%) | 0 (0.0%) |
| 10 to 14 Minutes | 5 (3.5%) | 0 (0.0%) |
| 15 to 19 Minutes | 18 (12.7%) | 33 (31.7%) |
| 20 to 24 Minutes | 0 (0.0%) | 23 (22.1%) |
| 25 to 29 Minutes | 14 (9.9%) | 6 (5.8%) |
| 30 to 34 Minutes | 60 (42.2%) | 37 (35.6%) |
| 35 to 39 Minutes | 0 (0.0%) | 0 (0.0%) |
| 40 to 44 Minutes | 5 (3.5%) | 0 (0.0%) |
| 45 to 59 Minutes | 9 (6.3%) | 5 (4.8%) |
| 60 to 89 Minutes | 0 (0.0%) | 0 (0.0%) |
| 90 or more Minutes | 17 (12.0%) | 0 (0.0%) |
Time of Departure to Work by Sex in Red Corral
The most frequent times of departure to work in Red Corral are 7:00 AM to 7:29 AM (54, 38.0%) for males and 6:00 AM to 6:29 AM (39, 37.5%) for females.
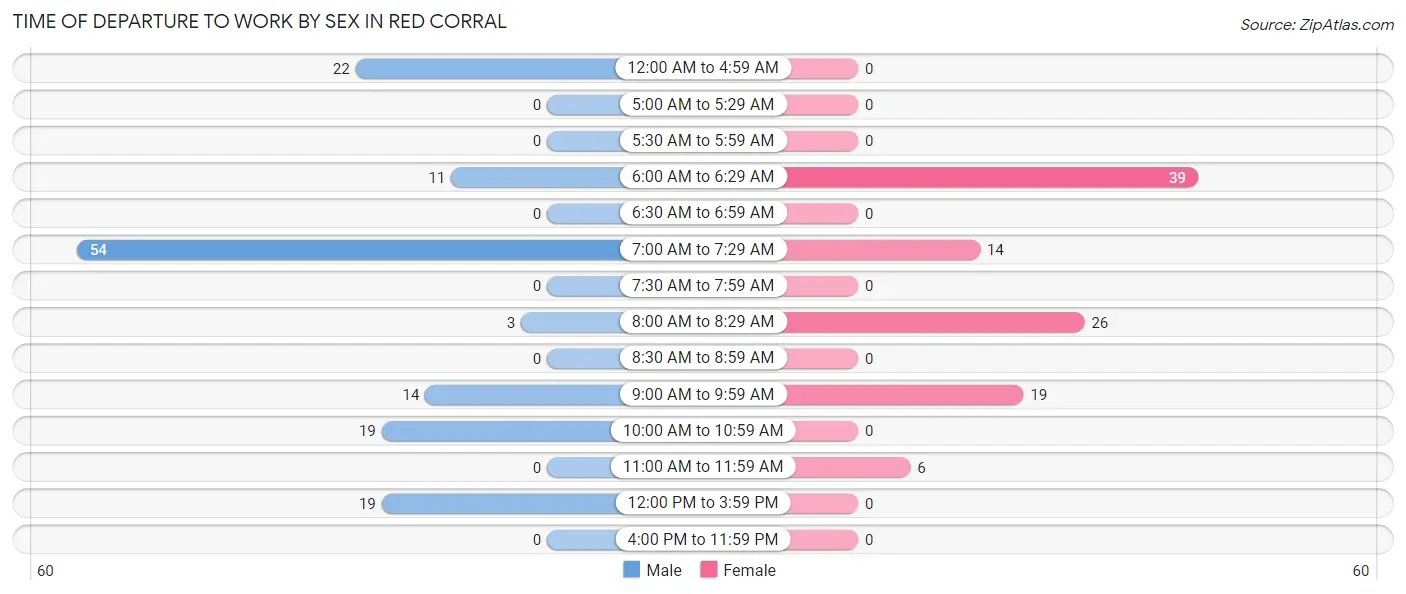
| Time of Departure | Male | Female |
| 12:00 AM to 4:59 AM | 22 (15.5%) | 0 (0.0%) |
| 5:00 AM to 5:29 AM | 0 (0.0%) | 0 (0.0%) |
| 5:30 AM to 5:59 AM | 0 (0.0%) | 0 (0.0%) |
| 6:00 AM to 6:29 AM | 11 (7.7%) | 39 (37.5%) |
| 6:30 AM to 6:59 AM | 0 (0.0%) | 0 (0.0%) |
| 7:00 AM to 7:29 AM | 54 (38.0%) | 14 (13.5%) |
| 7:30 AM to 7:59 AM | 0 (0.0%) | 0 (0.0%) |
| 8:00 AM to 8:29 AM | 3 (2.1%) | 26 (25.0%) |
| 8:30 AM to 8:59 AM | 0 (0.0%) | 0 (0.0%) |
| 9:00 AM to 9:59 AM | 14 (9.9%) | 19 (18.3%) |
| 10:00 AM to 10:59 AM | 19 (13.4%) | 0 (0.0%) |
| 11:00 AM to 11:59 AM | 0 (0.0%) | 6 (5.8%) |
| 12:00 PM to 3:59 PM | 19 (13.4%) | 0 (0.0%) |
| 4:00 PM to 11:59 PM | 0 (0.0%) | 0 (0.0%) |
| Total | 142 (100.0%) | 104 (100.0%) |
Housing Occupancy in Red Corral
Occupancy by Ownership in Red Corral
Of the total 416 dwellings in Red Corral, owner-occupied units account for 370 (88.9%), while renter-occupied units make up 46 (11.1%).
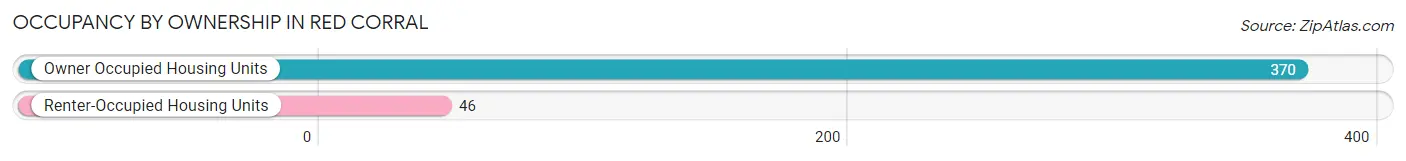
| Occupancy | # Housing Units | % Housing Units |
| Owner Occupied Housing Units | 370 | 88.9% |
| Renter-Occupied Housing Units | 46 | 11.1% |
| Total Occupied Housing Units | 416 | 100.0% |
Occupancy by Household Size in Red Corral
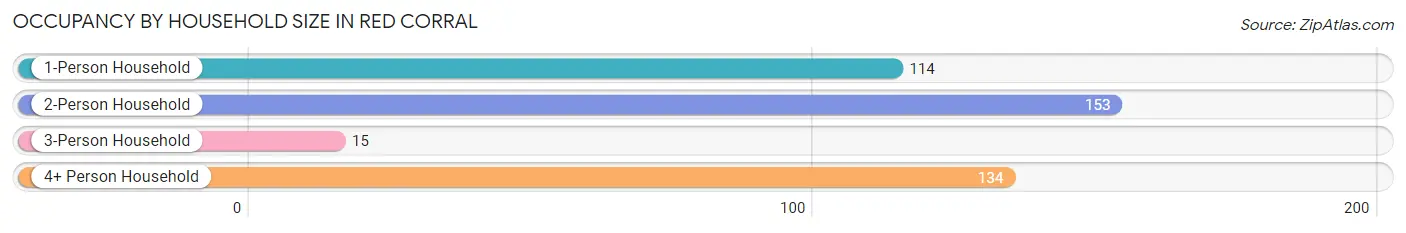
| Household Size | # Housing Units | % Housing Units |
| 1-Person Household | 114 | 27.4% |
| 2-Person Household | 153 | 36.8% |
| 3-Person Household | 15 | 3.6% |
| 4+ Person Household | 134 | 32.2% |
| Total Housing Units | 416 | 100.0% |
Occupancy by Ownership by Household Size in Red Corral
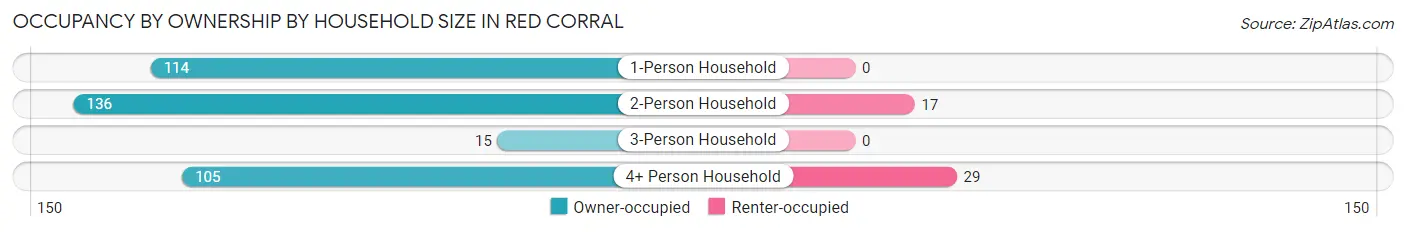
| Household Size | Owner-occupied | Renter-occupied |
| 1-Person Household | 114 (100.0%) | 0 (0.0%) |
| 2-Person Household | 136 (88.9%) | 17 (11.1%) |
| 3-Person Household | 15 (100.0%) | 0 (0.0%) |
| 4+ Person Household | 105 (78.4%) | 29 (21.6%) |
| Total Housing Units | 370 (88.9%) | 46 (11.1%) |
Occupancy by Educational Attainment in Red Corral
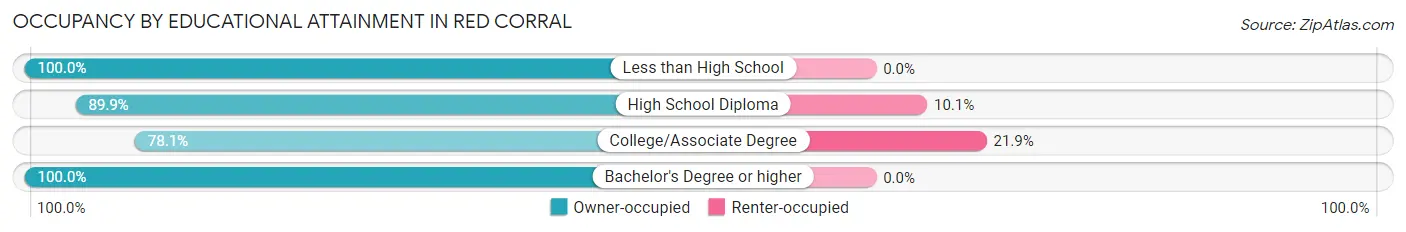
| Household Size | Owner-occupied | Renter-occupied |
| Less than High School | 36 (100.0%) | 0 (0.0%) |
| High School Diploma | 98 (89.9%) | 11 (10.1%) |
| College/Associate Degree | 125 (78.1%) | 35 (21.9%) |
| Bachelor's Degree or higher | 111 (100.0%) | 0 (0.0%) |
Occupancy by Age of Householder in Red Corral
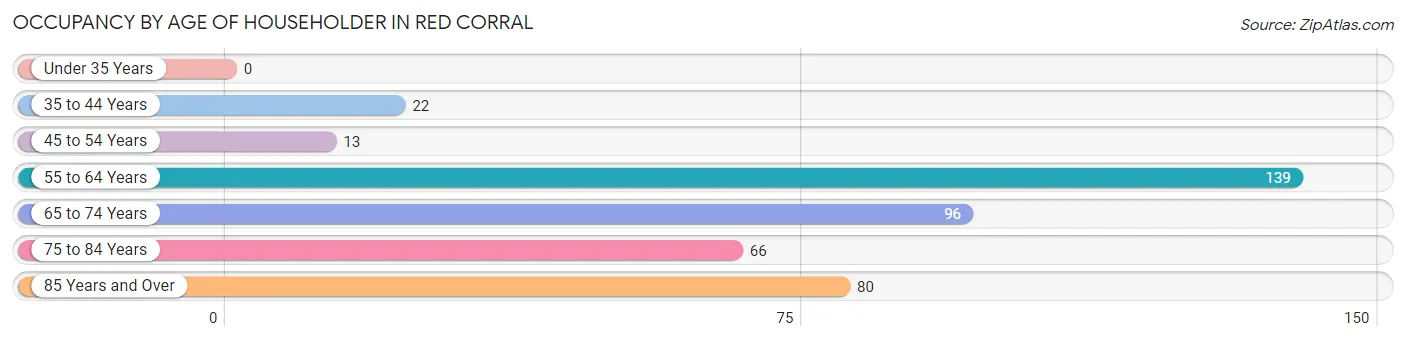
| Age Bracket | # Households | % Households |
| Under 35 Years | 0 | 0.0% |
| 35 to 44 Years | 22 | 5.3% |
| 45 to 54 Years | 13 | 3.1% |
| 55 to 64 Years | 139 | 33.4% |
| 65 to 74 Years | 96 | 23.1% |
| 75 to 84 Years | 66 | 15.9% |
| 85 Years and Over | 80 | 19.2% |
| Total | 416 | 100.0% |
Housing Finances in Red Corral
Median Income by Occupancy in Red Corral
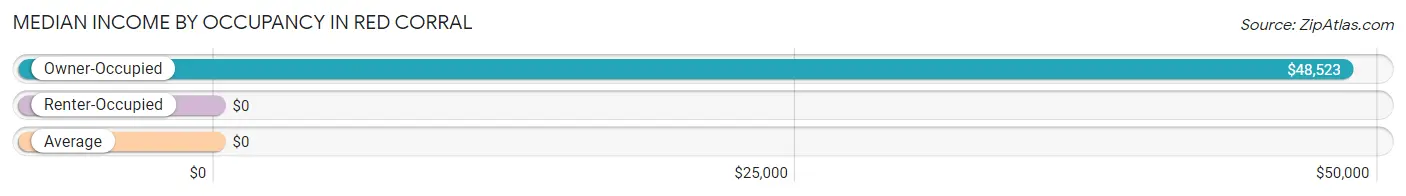
| Occupancy Type | # Households | Median Income |
| Owner-Occupied | 370 (88.9%) | $48,523 |
| Renter-Occupied | 46 (11.1%) | $0 |
| Average | 416 (100.0%) | $0 |
Occupancy by Householder Income Bracket in Red Corral
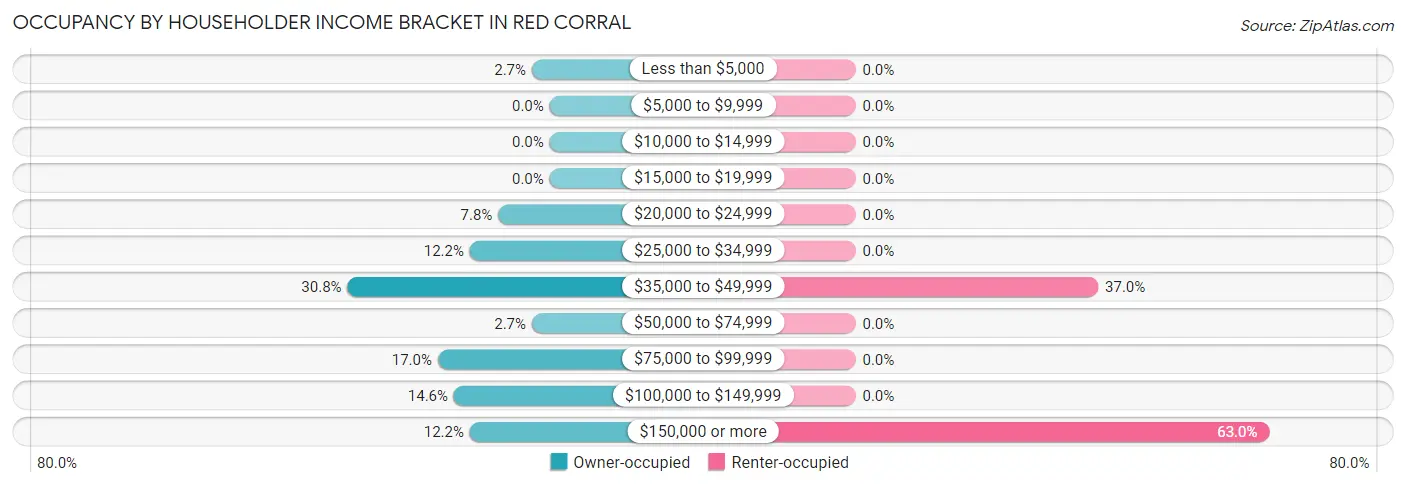
| Income Bracket | Owner-occupied | Renter-occupied |
| Less than $5,000 | 10 (2.7%) | 0 (0.0%) |
| $5,000 to $9,999 | 0 (0.0%) | 0 (0.0%) |
| $10,000 to $14,999 | 0 (0.0%) | 0 (0.0%) |
| $15,000 to $19,999 | 0 (0.0%) | 0 (0.0%) |
| $20,000 to $24,999 | 29 (7.8%) | 0 (0.0%) |
| $25,000 to $34,999 | 45 (12.2%) | 0 (0.0%) |
| $35,000 to $49,999 | 114 (30.8%) | 17 (37.0%) |
| $50,000 to $74,999 | 10 (2.7%) | 0 (0.0%) |
| $75,000 to $99,999 | 63 (17.0%) | 0 (0.0%) |
| $100,000 to $149,999 | 54 (14.6%) | 0 (0.0%) |
| $150,000 or more | 45 (12.2%) | 29 (63.0%) |
| Total | 370 (100.0%) | 46 (100.0%) |
Monthly Housing Cost Tiers in Red Corral
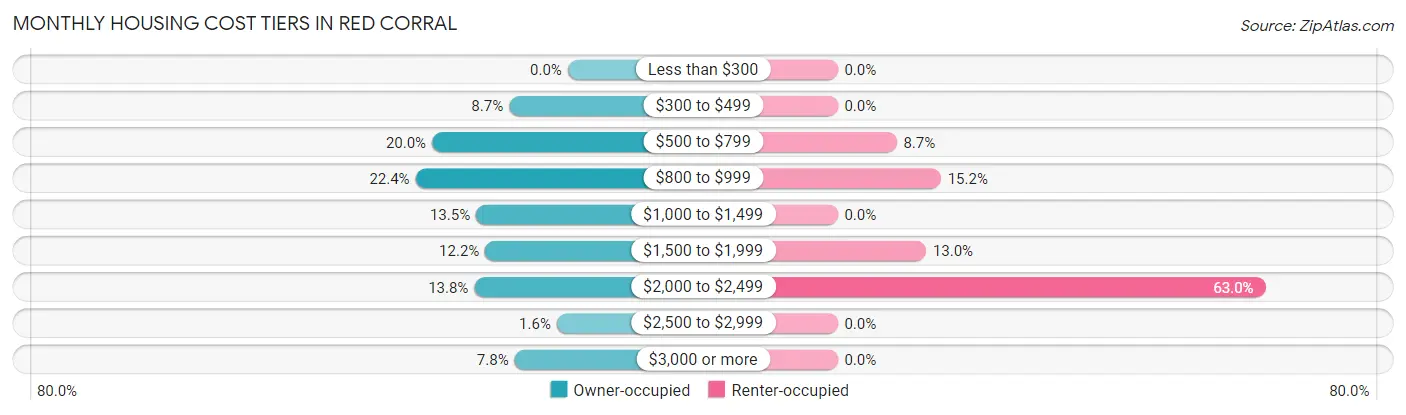
| Monthly Cost | Owner-occupied | Renter-occupied |
| Less than $300 | 0 (0.0%) | 0 (0.0%) |
| $300 to $499 | 32 (8.6%) | 0 (0.0%) |
| $500 to $799 | 74 (20.0%) | 4 (8.7%) |
| $800 to $999 | 83 (22.4%) | 7 (15.2%) |
| $1,000 to $1,499 | 50 (13.5%) | 0 (0.0%) |
| $1,500 to $1,999 | 45 (12.2%) | 6 (13.0%) |
| $2,000 to $2,499 | 51 (13.8%) | 29 (63.0%) |
| $2,500 to $2,999 | 6 (1.6%) | 0 (0.0%) |
| $3,000 or more | 29 (7.8%) | 0 (0.0%) |
| Total | 370 (100.0%) | 46 (100.0%) |
Physical Housing Characteristics in Red Corral
Housing Structures in Red Corral
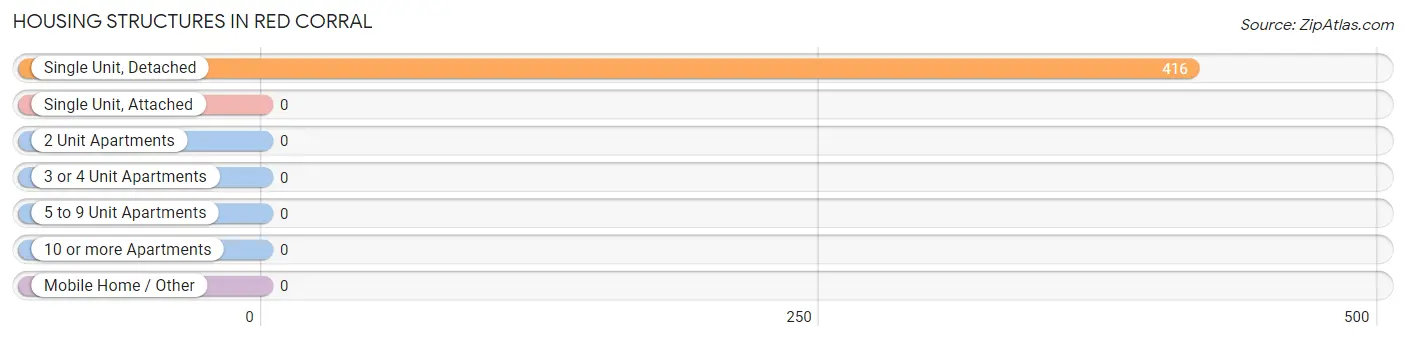
| Structure Type | # Housing Units | % Housing Units |
| Single Unit, Detached | 416 | 100.0% |
| Single Unit, Attached | 0 | 0.0% |
| 2 Unit Apartments | 0 | 0.0% |
| 3 or 4 Unit Apartments | 0 | 0.0% |
| 5 to 9 Unit Apartments | 0 | 0.0% |
| 10 or more Apartments | 0 | 0.0% |
| Mobile Home / Other | 0 | 0.0% |
| Total | 416 | 100.0% |
Housing Structures by Occupancy in Red Corral
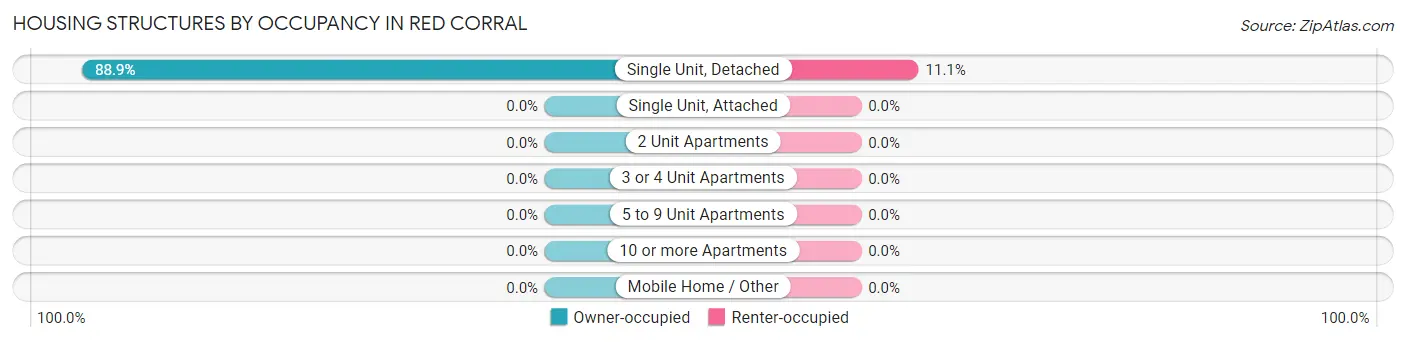
| Structure Type | Owner-occupied | Renter-occupied |
| Single Unit, Detached | 370 (88.9%) | 46 (11.1%) |
| Single Unit, Attached | 0 (0.0%) | 0 (0.0%) |
| 2 Unit Apartments | 0 (0.0%) | 0 (0.0%) |
| 3 or 4 Unit Apartments | 0 (0.0%) | 0 (0.0%) |
| 5 to 9 Unit Apartments | 0 (0.0%) | 0 (0.0%) |
| 10 or more Apartments | 0 (0.0%) | 0 (0.0%) |
| Mobile Home / Other | 0 (0.0%) | 0 (0.0%) |
| Total | 370 (88.9%) | 46 (11.1%) |
Housing Structures by Number of Rooms in Red Corral
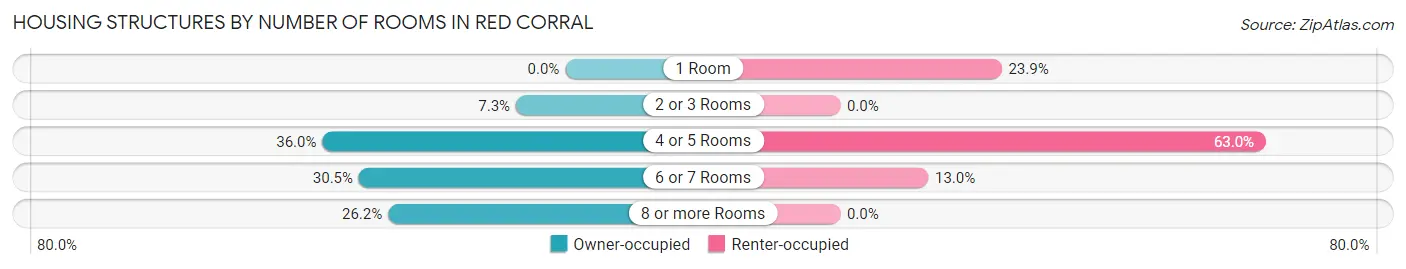
| Number of Rooms | Owner-occupied | Renter-occupied |
| 1 Room | 0 (0.0%) | 11 (23.9%) |
| 2 or 3 Rooms | 27 (7.3%) | 0 (0.0%) |
| 4 or 5 Rooms | 133 (35.9%) | 29 (63.0%) |
| 6 or 7 Rooms | 113 (30.5%) | 6 (13.0%) |
| 8 or more Rooms | 97 (26.2%) | 0 (0.0%) |
| Total | 370 (100.0%) | 46 (100.0%) |
Housing Structure by Heating Type in Red Corral
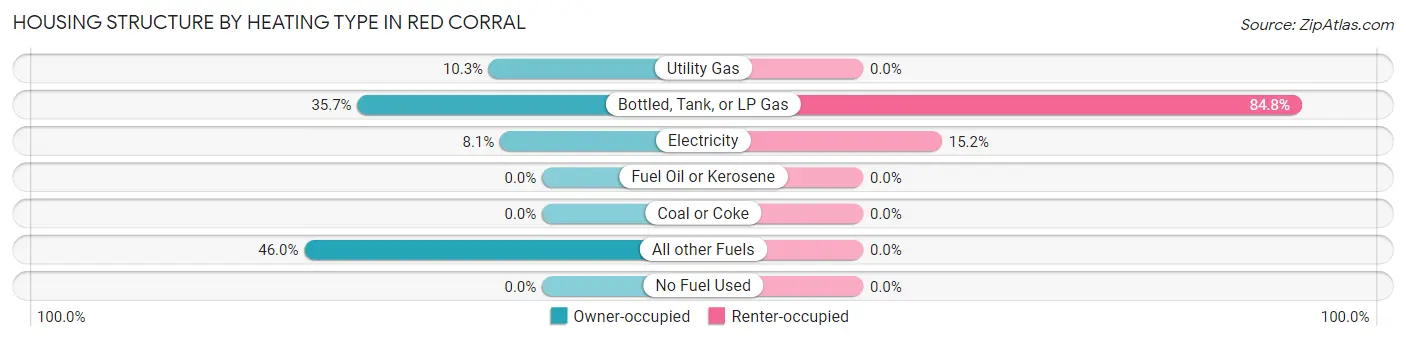
| Heating Type | Owner-occupied | Renter-occupied |
| Utility Gas | 38 (10.3%) | 0 (0.0%) |
| Bottled, Tank, or LP Gas | 132 (35.7%) | 39 (84.8%) |
| Electricity | 30 (8.1%) | 7 (15.2%) |
| Fuel Oil or Kerosene | 0 (0.0%) | 0 (0.0%) |
| Coal or Coke | 0 (0.0%) | 0 (0.0%) |
| All other Fuels | 170 (46.0%) | 0 (0.0%) |
| No Fuel Used | 0 (0.0%) | 0 (0.0%) |
| Total | 370 (100.0%) | 46 (100.0%) |
Household Vehicle Usage in Red Corral
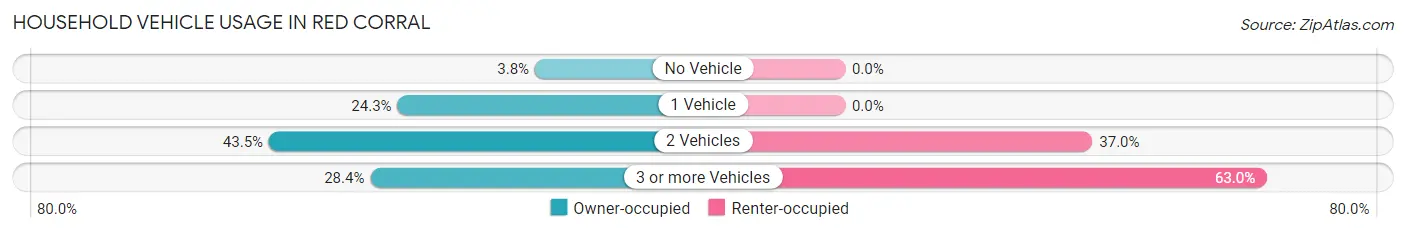
| Vehicles per Household | Owner-occupied | Renter-occupied |
| No Vehicle | 14 (3.8%) | 0 (0.0%) |
| 1 Vehicle | 90 (24.3%) | 0 (0.0%) |
| 2 Vehicles | 161 (43.5%) | 17 (37.0%) |
| 3 or more Vehicles | 105 (28.4%) | 29 (63.0%) |
| Total | 370 (100.0%) | 46 (100.0%) |
Real Estate & Mortgages in Red Corral
Real Estate and Mortgage Overview in Red Corral
| Characteristic | Without Mortgage | With Mortgage |
| Housing Units | 148 | 222 |
| Median Property Value | $416,200 | $376,300 |
| Median Household Income | - | - |
| Monthly Housing Costs | $684 | $29 |
| Real Estate Taxes | $3,037 | $13 |
Property Value by Mortgage Status in Red Corral
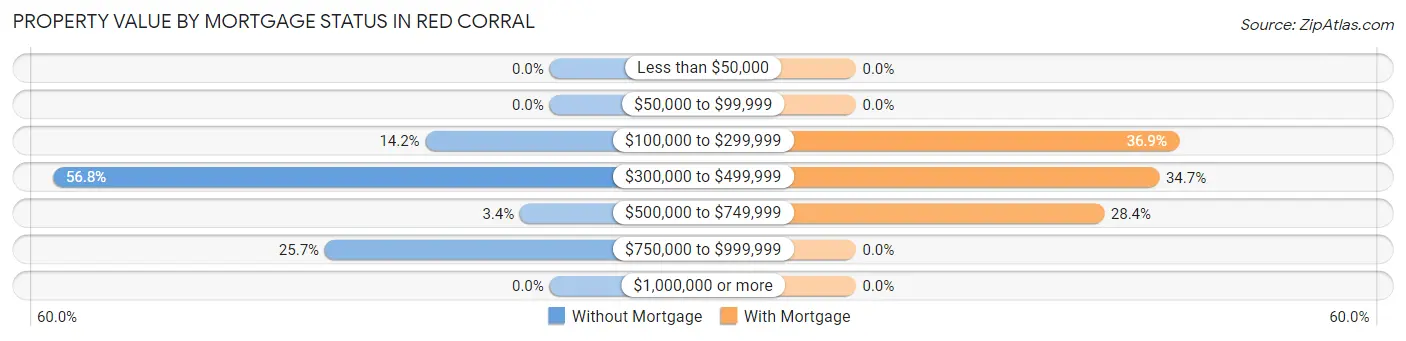
| Property Value | Without Mortgage | With Mortgage |
| Less than $50,000 | 0 (0.0%) | 0 (0.0%) |
| $50,000 to $99,999 | 0 (0.0%) | 0 (0.0%) |
| $100,000 to $299,999 | 21 (14.2%) | 82 (36.9%) |
| $300,000 to $499,999 | 84 (56.8%) | 77 (34.7%) |
| $500,000 to $749,999 | 5 (3.4%) | 63 (28.4%) |
| $750,000 to $999,999 | 38 (25.7%) | 0 (0.0%) |
| $1,000,000 or more | 0 (0.0%) | 0 (0.0%) |
| Total | 148 (100.0%) | 222 (100.0%) |
Household Income by Mortgage Status in Red Corral
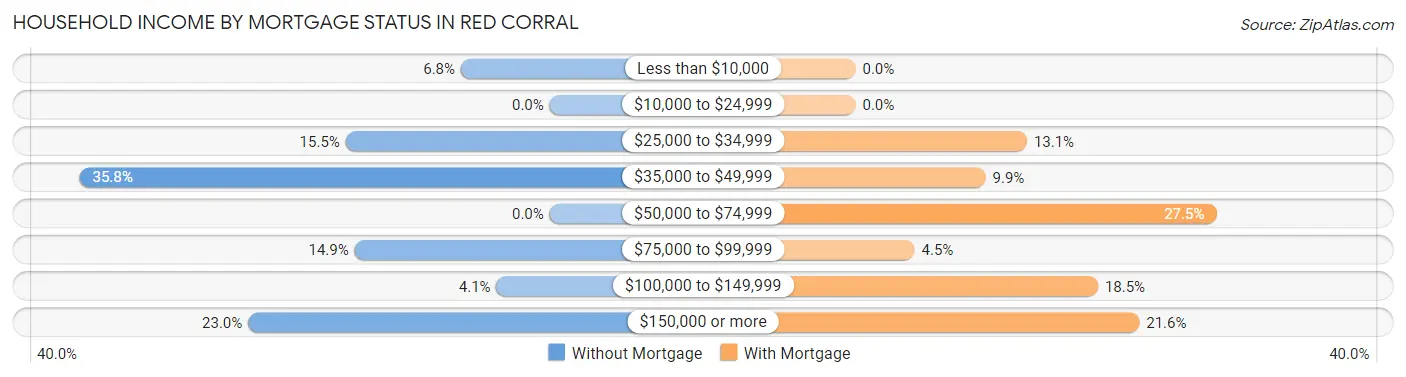
| Household Income | Without Mortgage | With Mortgage |
| Less than $10,000 | 10 (6.8%) | 0 (0.0%) |
| $10,000 to $24,999 | 0 (0.0%) | 0 (0.0%) |
| $25,000 to $34,999 | 23 (15.5%) | 29 (13.1%) |
| $35,000 to $49,999 | 53 (35.8%) | 22 (9.9%) |
| $50,000 to $74,999 | 0 (0.0%) | 61 (27.5%) |
| $75,000 to $99,999 | 22 (14.9%) | 10 (4.5%) |
| $100,000 to $149,999 | 6 (4.1%) | 41 (18.5%) |
| $150,000 or more | 34 (23.0%) | 48 (21.6%) |
| Total | 148 (100.0%) | 222 (100.0%) |
Property Value to Household Income Ratio in Red Corral
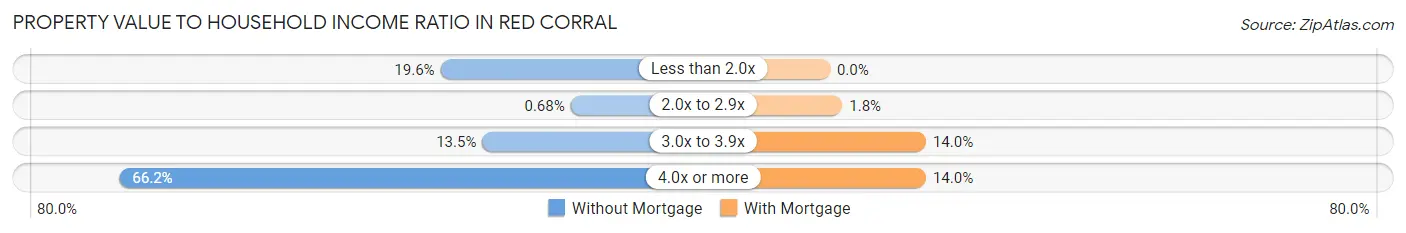
| Value-to-Income Ratio | Without Mortgage | With Mortgage |
| Less than 2.0x | 29 (19.6%) | 0 (0.0%) |
| 2.0x to 2.9x | 1 (0.7%) | 4 (1.8%) |
| 3.0x to 3.9x | 20 (13.5%) | 31 (14.0%) |
| 4.0x or more | 98 (66.2%) | 31 (14.0%) |
| Total | 148 (100.0%) | 222 (100.0%) |
Real Estate Taxes by Mortgage Status in Red Corral
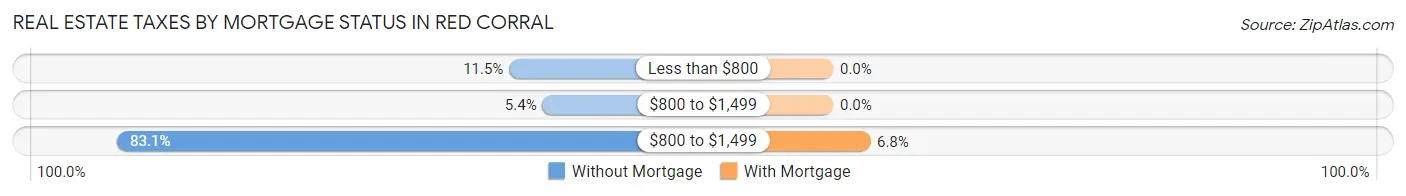
| Property Taxes | Without Mortgage | With Mortgage |
| Less than $800 | 17 (11.5%) | 0 (0.0%) |
| $800 to $1,499 | 8 (5.4%) | 0 (0.0%) |
| $800 to $1,499 | 123 (83.1%) | 15 (6.8%) |
| Total | 148 (100.0%) | 222 (100.0%) |
Health & Disability in Red Corral
Health Insurance Coverage by Age in Red Corral
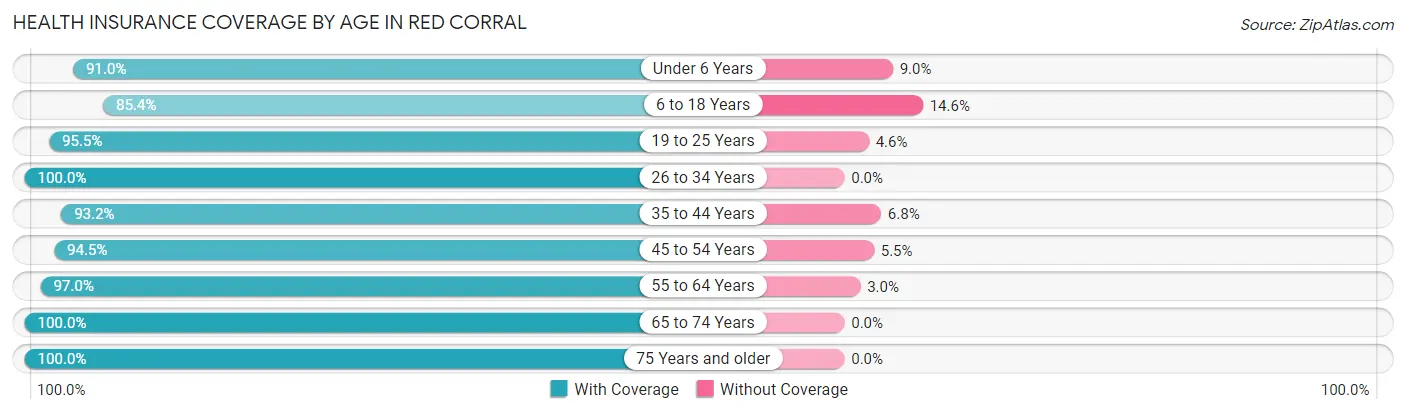
| Age Bracket | With Coverage | Without Coverage |
| Under 6 Years | 141 (91.0%) | 14 (9.0%) |
| 6 to 18 Years | 70 (85.4%) | 12 (14.6%) |
| 19 to 25 Years | 63 (95.5%) | 3 (4.5%) |
| 26 to 34 Years | 29 (100.0%) | 0 (0.0%) |
| 35 to 44 Years | 150 (93.2%) | 11 (6.8%) |
| 45 to 54 Years | 103 (94.5%) | 6 (5.5%) |
| 55 to 64 Years | 229 (97.0%) | 7 (3.0%) |
| 65 to 74 Years | 194 (100.0%) | 0 (0.0%) |
| 75 Years and older | 182 (100.0%) | 0 (0.0%) |
| Total | 1,161 (95.6%) | 53 (4.4%) |
Health Insurance Coverage by Citizenship Status in Red Corral
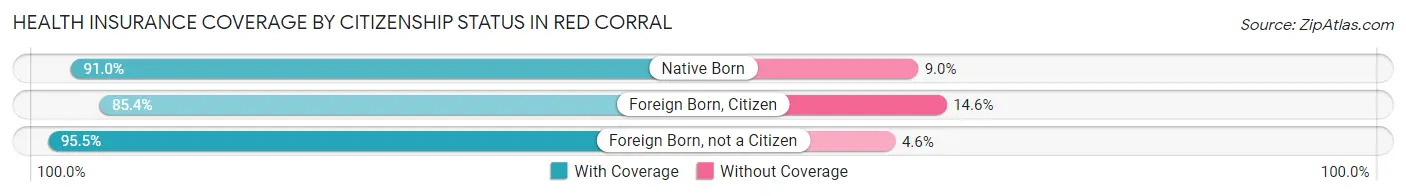
| Citizenship Status | With Coverage | Without Coverage |
| Native Born | 141 (91.0%) | 14 (9.0%) |
| Foreign Born, Citizen | 70 (85.4%) | 12 (14.6%) |
| Foreign Born, not a Citizen | 63 (95.5%) | 3 (4.5%) |
Health Insurance Coverage by Household Income in Red Corral
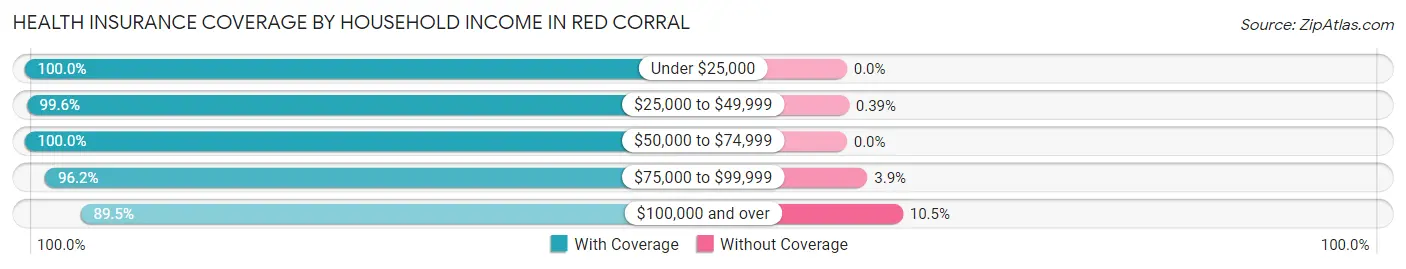
| Household Income | With Coverage | Without Coverage |
| Under $25,000 | 43 (100.0%) | 0 (0.0%) |
| $25,000 to $49,999 | 515 (99.6%) | 2 (0.4%) |
| $50,000 to $74,999 | 18 (100.0%) | 0 (0.0%) |
| $75,000 to $99,999 | 200 (96.2%) | 8 (3.8%) |
| $100,000 and over | 367 (89.5%) | 43 (10.5%) |
Public vs Private Health Insurance Coverage by Age in Red Corral
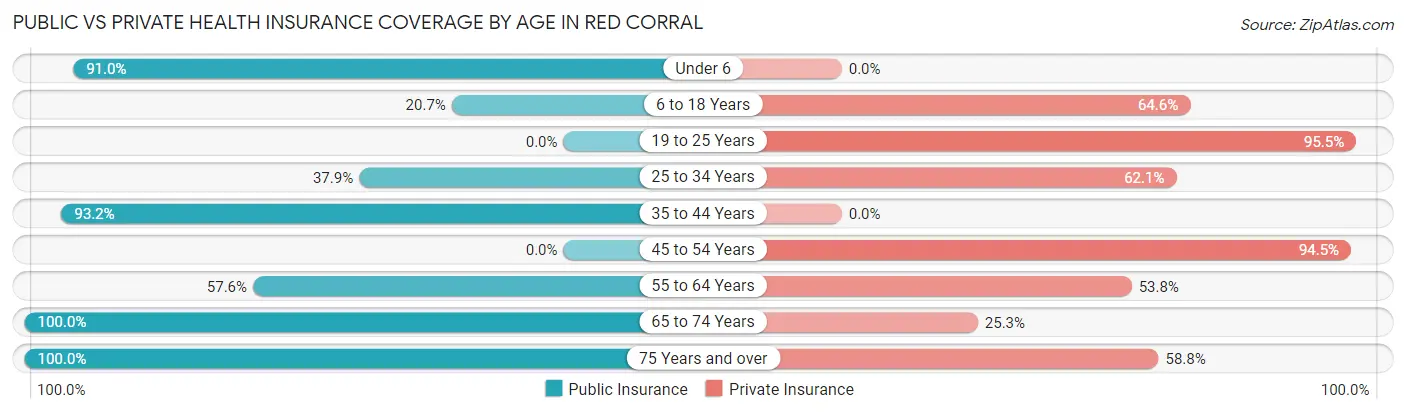
| Age Bracket | Public Insurance | Private Insurance |
| Under 6 | 141 (91.0%) | 0 (0.0%) |
| 6 to 18 Years | 17 (20.7%) | 53 (64.6%) |
| 19 to 25 Years | 0 (0.0%) | 63 (95.5%) |
| 25 to 34 Years | 11 (37.9%) | 18 (62.1%) |
| 35 to 44 Years | 150 (93.2%) | 0 (0.0%) |
| 45 to 54 Years | 0 (0.0%) | 103 (94.5%) |
| 55 to 64 Years | 136 (57.6%) | 127 (53.8%) |
| 65 to 74 Years | 194 (100.0%) | 49 (25.3%) |
| 75 Years and over | 182 (100.0%) | 107 (58.8%) |
| Total | 831 (68.4%) | 520 (42.8%) |
Disability Status by Sex by Age in Red Corral
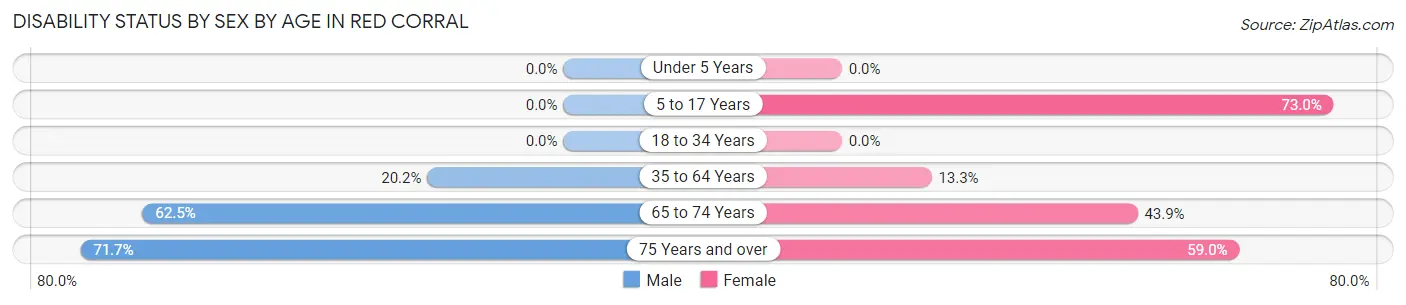
| Age Bracket | Male | Female |
| Under 5 Years | 0 (0.0%) | 0 (0.0%) |
| 5 to 17 Years | 0 (0.0%) | 65 (73.0%) |
| 18 to 34 Years | 0 (0.0%) | 0 (0.0%) |
| 35 to 64 Years | 40 (20.2%) | 41 (13.3%) |
| 65 to 74 Years | 70 (62.5%) | 36 (43.9%) |
| 75 Years and over | 71 (71.7%) | 49 (59.0%) |
Disability Class by Sex by Age in Red Corral
Disability Class: Hearing Difficulty
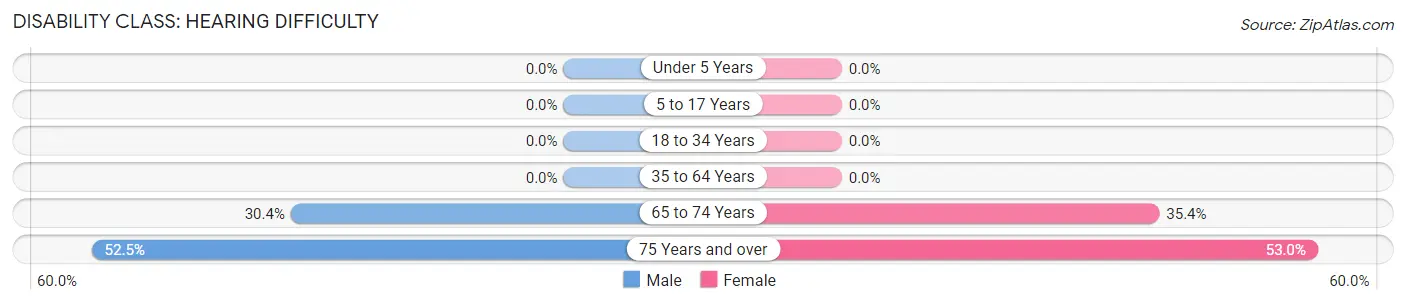
| Age Bracket | Male | Female |
| Under 5 Years | 0 (0.0%) | 0 (0.0%) |
| 5 to 17 Years | 0 (0.0%) | 0 (0.0%) |
| 18 to 34 Years | 0 (0.0%) | 0 (0.0%) |
| 35 to 64 Years | 0 (0.0%) | 0 (0.0%) |
| 65 to 74 Years | 34 (30.4%) | 29 (35.4%) |
| 75 Years and over | 52 (52.5%) | 44 (53.0%) |
Disability Class: Vision Difficulty
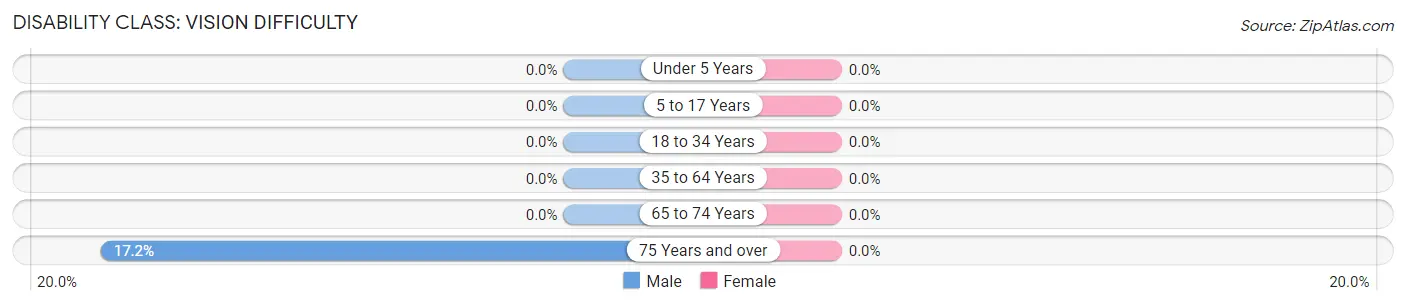
| Age Bracket | Male | Female |
| Under 5 Years | 0 (0.0%) | 0 (0.0%) |
| 5 to 17 Years | 0 (0.0%) | 0 (0.0%) |
| 18 to 34 Years | 0 (0.0%) | 0 (0.0%) |
| 35 to 64 Years | 0 (0.0%) | 0 (0.0%) |
| 65 to 74 Years | 0 (0.0%) | 0 (0.0%) |
| 75 Years and over | 17 (17.2%) | 0 (0.0%) |
Disability Class: Cognitive Difficulty
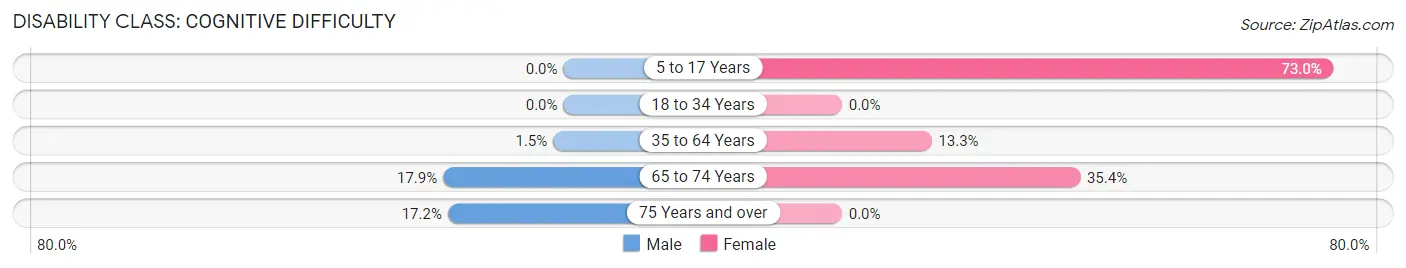
| Age Bracket | Male | Female |
| 5 to 17 Years | 0 (0.0%) | 65 (73.0%) |
| 18 to 34 Years | 0 (0.0%) | 0 (0.0%) |
| 35 to 64 Years | 3 (1.5%) | 41 (13.3%) |
| 65 to 74 Years | 20 (17.9%) | 29 (35.4%) |
| 75 Years and over | 17 (17.2%) | 0 (0.0%) |
Disability Class: Ambulatory Difficulty
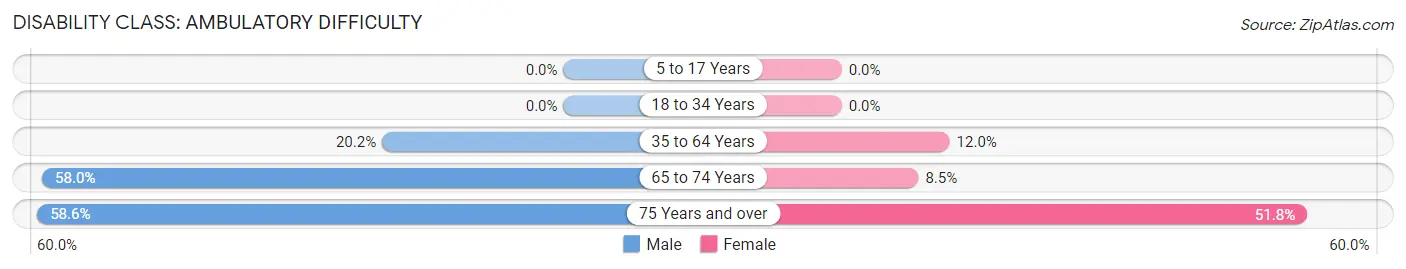
| Age Bracket | Male | Female |
| 5 to 17 Years | 0 (0.0%) | 0 (0.0%) |
| 18 to 34 Years | 0 (0.0%) | 0 (0.0%) |
| 35 to 64 Years | 40 (20.2%) | 37 (12.0%) |
| 65 to 74 Years | 65 (58.0%) | 7 (8.5%) |
| 75 Years and over | 58 (58.6%) | 43 (51.8%) |
Disability Class: Self-Care Difficulty
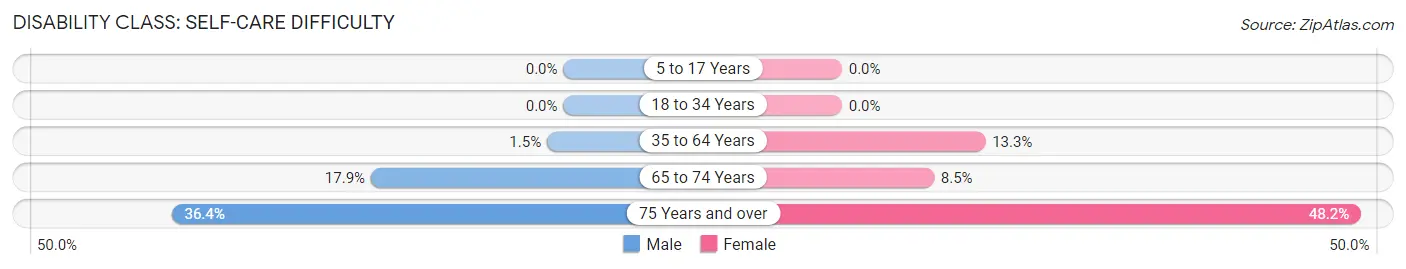
| Age Bracket | Male | Female |
| 5 to 17 Years | 0 (0.0%) | 0 (0.0%) |
| 18 to 34 Years | 0 (0.0%) | 0 (0.0%) |
| 35 to 64 Years | 3 (1.5%) | 41 (13.3%) |
| 65 to 74 Years | 20 (17.9%) | 7 (8.5%) |
| 75 Years and over | 36 (36.4%) | 40 (48.2%) |
Technology Access in Red Corral
Computing Device Access in Red Corral
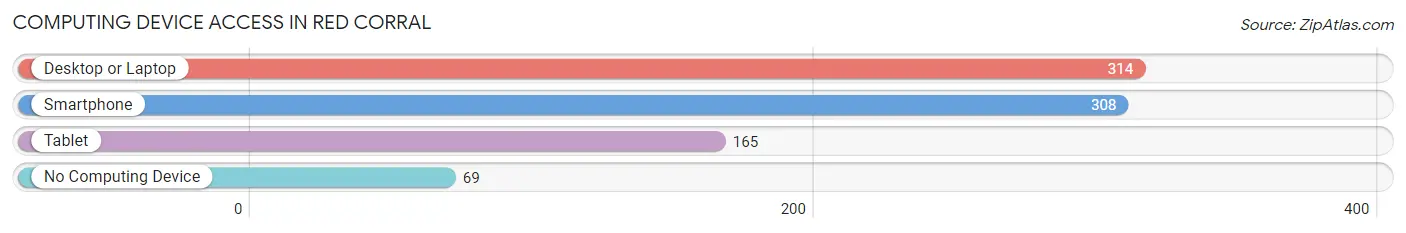
| Device Type | # Households | % Households |
| Desktop or Laptop | 314 | 75.5% |
| Smartphone | 308 | 74.0% |
| Tablet | 165 | 39.7% |
| No Computing Device | 69 | 16.6% |
| Total | 416 | 100.0% |
Internet Access in Red Corral
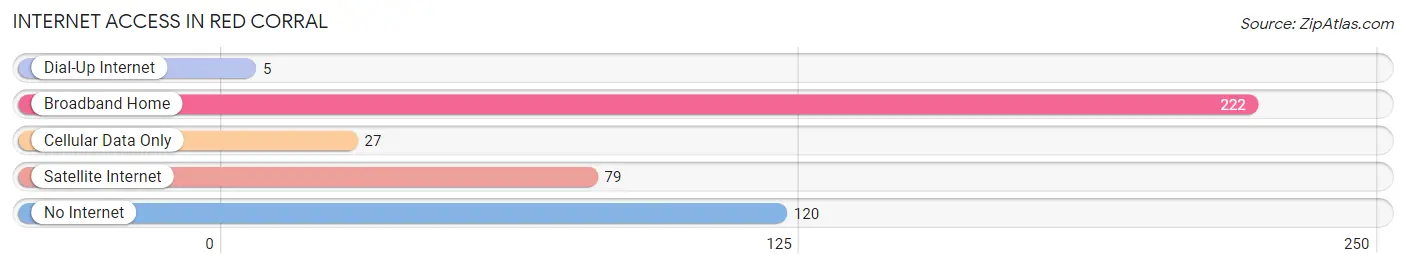
| Internet Type | # Households | % Households |
| Dial-Up Internet | 5 | 1.2% |
| Broadband Home | 222 | 53.4% |
| Cellular Data Only | 27 | 6.5% |
| Satellite Internet | 79 | 19.0% |
| No Internet | 120 | 28.8% |
| Total | 416 | 100.0% |
Red Corral Summary
History
Red Corral is a small unincorporated community located in the foothills of the Sierra Nevada Mountains in El Dorado County, California. The area was first settled in the late 1800s by miners and ranchers who were drawn to the area by the abundance of gold and other minerals. The town was officially established in 1891 and named after the red corral that was built to contain the horses of the miners and ranchers.
The town grew quickly and by the early 1900s, it had become a bustling center of commerce and industry. The town was home to several stores, a post office, a school, a hotel, and a saloon. The town also had a thriving mining industry, with several gold and silver mines in the area.
In the 1920s, the town began to decline as the mining industry began to decline. The Great Depression further exacerbated the decline, and by the 1940s, the town was nearly abandoned.
In the 1950s, the town began to experience a resurgence as the area became a popular destination for tourists and outdoor enthusiasts. The town was home to several resorts and lodges, and the area became a popular destination for fishing, camping, and hiking.
Geography
Red Corral is located in the foothills of the Sierra Nevada Mountains in El Dorado County, California. The town is situated at an elevation of 2,400 feet and is surrounded by the Eldorado National Forest. The town is located approximately 25 miles east of Placerville and 40 miles west of South Lake Tahoe.
The town is located in a mountainous region and is surrounded by several mountain peaks, including Mount Tallac, Pyramid Peak, and Mount Ralston. The area is also home to several rivers and streams, including the American River, the Rubicon River, and the South Fork of the American River.
Economy
The economy of Red Corral is largely based on tourism and outdoor recreation. The town is home to several resorts and lodges, and the area is a popular destination for fishing, camping, and hiking. The town is also home to several wineries and vineyards, and the area is known for its production of high-quality wines.
The town is also home to several small businesses, including restaurants, cafes, and shops. The town is also home to several art galleries and museums, and the area is known for its vibrant arts and culture scene.
Demographics
As of the 2010 census, the population of Red Corral was 1,845. The population is largely white (90.2%), with small percentages of African American (2.2%), Asian (2.1%), and Native American (1.2%) residents. The median household income is $50,000, and the median age is 44. The town is home to several churches, and the area is served by the El Dorado County School District.
Common Questions
What is Per Capita Income in Red Corral?
Per Capita income in Red Corral is $28,150.
What is the Median Family Income in Red Corral?
Median Family Income in Red Corral is $89,375.
What is Income or Wage Gap in Red Corral?
Income or Wage Gap in Red Corral is 61.8%.
Women in Red Corral earn 38.2 cents for every dollar earned by a man.
What is Inequality or Gini Index in Red Corral?
Inequality or Gini Index in Red Corral is 0.38.
What is the Total Population of Red Corral?
Total Population of Red Corral is 1,271.
What is the Total Male Population of Red Corral?
Total Male Population of Red Corral is 649.
What is the Total Female Population of Red Corral?
Total Female Population of Red Corral is 622.
What is the Ratio of Males per 100 Females in Red Corral?
There are 104.34 Males per 100 Females in Red Corral.
What is the Ratio of Females per 100 Males in Red Corral?
There are 95.84 Females per 100 Males in Red Corral.
What is the Median Population Age in Red Corral?
Median Population Age in Red Corral is 48.9 Years.
What is the Average Family Size in Red Corral
Average Family Size in Red Corral is 3.8 People.
What is the Average Household Size in Red Corral
Average Household Size in Red Corral is 2.9 People.
How Large is the Labor Force in Red Corral?
There are 268 People in the Labor Forcein in Red Corral.
What is the Percentage of People in the Labor Force in Red Corral?
24.5% of People are in the Labor Force in Red Corral.