Pine Hills, CA Map & Demographics
Pine Hills Map
Pine Hills Overview
$36,055
PER CAPITA INCOME
$81,435
AVG FAMILY INCOME
$78,047
AVG HOUSEHOLD INCOME
54.3%
WAGE / INCOME GAP [ % ]
45.7¢/ $1
WAGE / INCOME GAP [ $ ]
0.48
INEQUALITY / GINI INDEX
3,508
TOTAL POPULATION
1,679
MALE POPULATION
1,829
FEMALE POPULATION
91.80
MALES / 100 FEMALES
108.93
FEMALES / 100 MALES
47.8
MEDIAN AGE
3.1
AVG FAMILY SIZE
2.8
AVG HOUSEHOLD SIZE
1,369
LABOR FORCE [ PEOPLE ]
48.6%
PERCENT IN LABOR FORCE
3.6%
UNEMPLOYMENT RATE
Income in Pine Hills
Income Overview in Pine Hills
Per Capita Income in Pine Hills is $36,055, while median incomes of families and households are $81,435 and $78,047 respectively.
| Characteristic | Number | Measure |
| Per Capita Income | 3,508 | $36,055 |
| Median Family Income | 836 | $81,435 |
| Mean Family Income | 836 | $123,350 |
| Median Household Income | 1,228 | $78,047 |
| Mean Household Income | 1,228 | $105,809 |
| Income Deficit | 836 | $0 |
| Wage / Income Gap (%) | 3,508 | 54.26% |
| Wage / Income Gap ($) | 3,508 | 45.74¢ per $1 |
| Gini / Inequality Index | 3,508 | 0.48 |
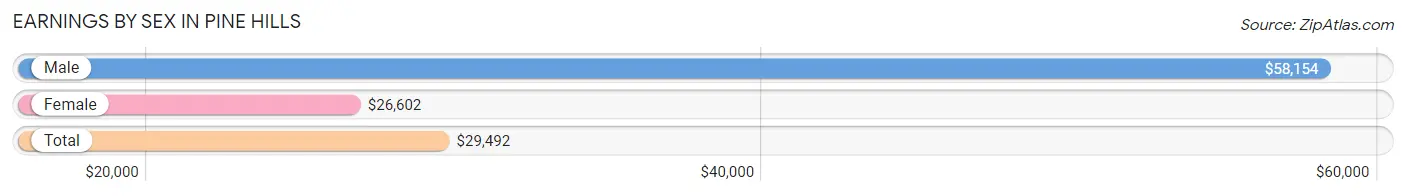
Earnings by Sex in Pine Hills
Average Earnings in Pine Hills are $29,492, $58,154 for men and $26,602 for women, a difference of 54.3%.
| Sex | Number | Average Earnings |
| Male | 729 (52.7%) | $58,154 |
| Female | 655 (47.3%) | $26,602 |
| Total | 1,384 (100.0%) | $29,492 |
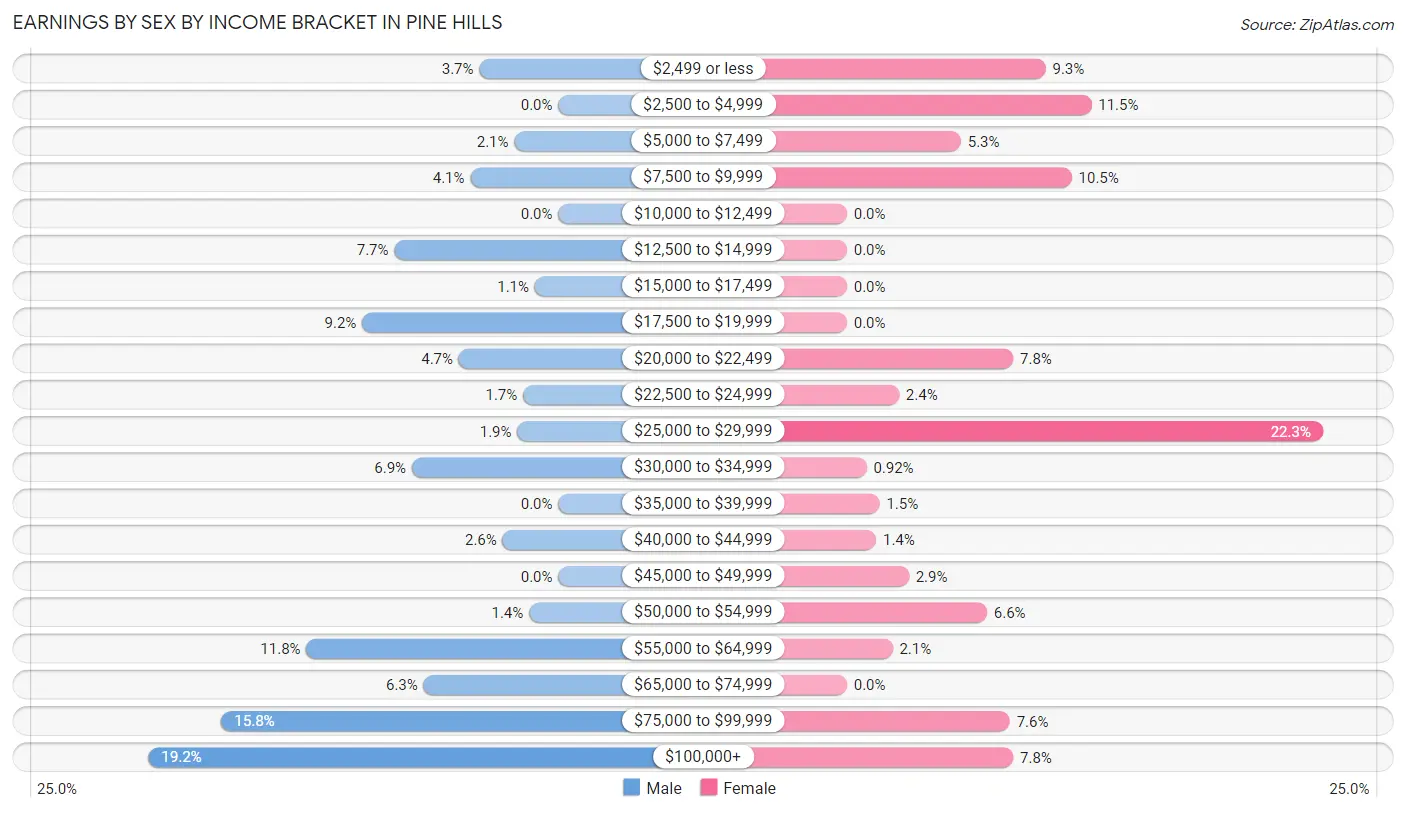
Earnings by Sex by Income Bracket in Pine Hills
The most common earnings brackets in Pine Hills are $100,000+ for men (140 | 19.2%) and $25,000 to $29,999 for women (146 | 22.3%).
| Income | Male | Female |
| $2,499 or less | 27 (3.7%) | 61 (9.3%) |
| $2,500 to $4,999 | 0 (0.0%) | 75 (11.5%) |
| $5,000 to $7,499 | 15 (2.1%) | 35 (5.3%) |
| $7,500 to $9,999 | 30 (4.1%) | 69 (10.5%) |
| $10,000 to $12,499 | 0 (0.0%) | 0 (0.0%) |
| $12,500 to $14,999 | 56 (7.7%) | 0 (0.0%) |
| $15,000 to $17,499 | 8 (1.1%) | 0 (0.0%) |
| $17,500 to $19,999 | 67 (9.2%) | 0 (0.0%) |
| $20,000 to $22,499 | 34 (4.7%) | 51 (7.8%) |
| $22,500 to $24,999 | 12 (1.7%) | 16 (2.4%) |
| $25,000 to $29,999 | 14 (1.9%) | 146 (22.3%) |
| $30,000 to $34,999 | 50 (6.9%) | 6 (0.9%) |
| $35,000 to $39,999 | 0 (0.0%) | 10 (1.5%) |
| $40,000 to $44,999 | 19 (2.6%) | 9 (1.4%) |
| $45,000 to $49,999 | 0 (0.0%) | 19 (2.9%) |
| $50,000 to $54,999 | 10 (1.4%) | 43 (6.6%) |
| $55,000 to $64,999 | 86 (11.8%) | 14 (2.1%) |
| $65,000 to $74,999 | 46 (6.3%) | 0 (0.0%) |
| $75,000 to $99,999 | 115 (15.8%) | 50 (7.6%) |
| $100,000+ | 140 (19.2%) | 51 (7.8%) |
| Total | 729 (100.0%) | 655 (100.0%) |
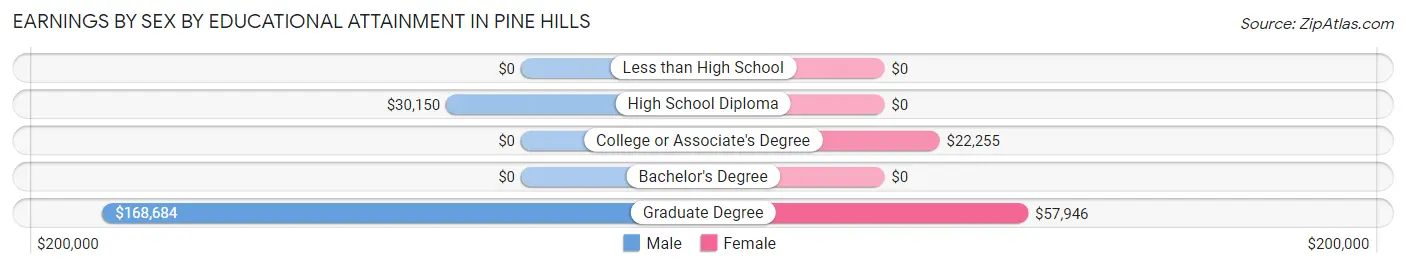
Earnings by Sex by Educational Attainment in Pine Hills
Average earnings in Pine Hills are $58,532 for men and $28,311 for women, a difference of 51.6%. Men with an educational attainment of graduate degree enjoy the highest average annual earnings of $168,684, while those with high school diploma education earn the least with $30,150. Women with an educational attainment of graduate degree earn the most with the average annual earnings of $57,946, while those with college or associate's degree education have the smallest earnings of $22,255.
| Educational Attainment | Male Income | Female Income |
| Less than High School | - | - |
| High School Diploma | $30,150 | $0 |
| College or Associate's Degree | - | - |
| Bachelor's Degree | - | - |
| Graduate Degree | $168,684 | $57,946 |
| Total | $58,532 | $28,311 |
Family Income in Pine Hills
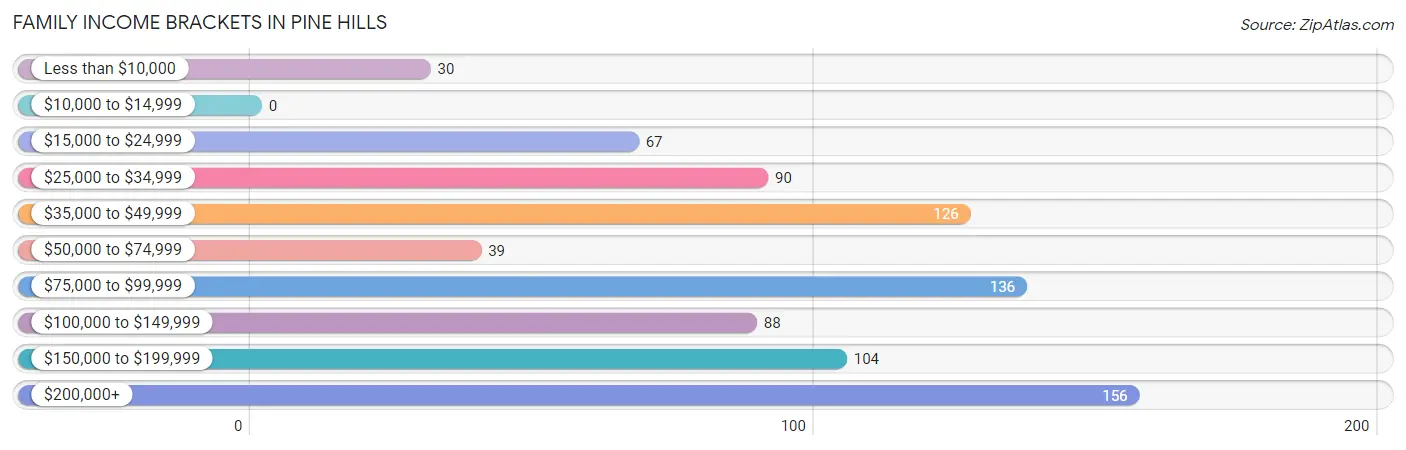
Family Income Brackets in Pine Hills
According to the Pine Hills family income data, there are 156 families falling into the $200,000+ income range, which is the most common income bracket and makes up 18.7% of all families.
| Income Bracket | # Families | % Families |
| Less than $10,000 | 30 | 3.6% |
| $10,000 to $14,999 | 0 | 0.0% |
| $15,000 to $24,999 | 67 | 8.0% |
| $25,000 to $34,999 | 90 | 10.8% |
| $35,000 to $49,999 | 126 | 15.1% |
| $50,000 to $74,999 | 39 | 4.7% |
| $75,000 to $99,999 | 136 | 16.3% |
| $100,000 to $149,999 | 88 | 10.5% |
| $150,000 to $199,999 | 104 | 12.4% |
| $200,000+ | 156 | 18.7% |
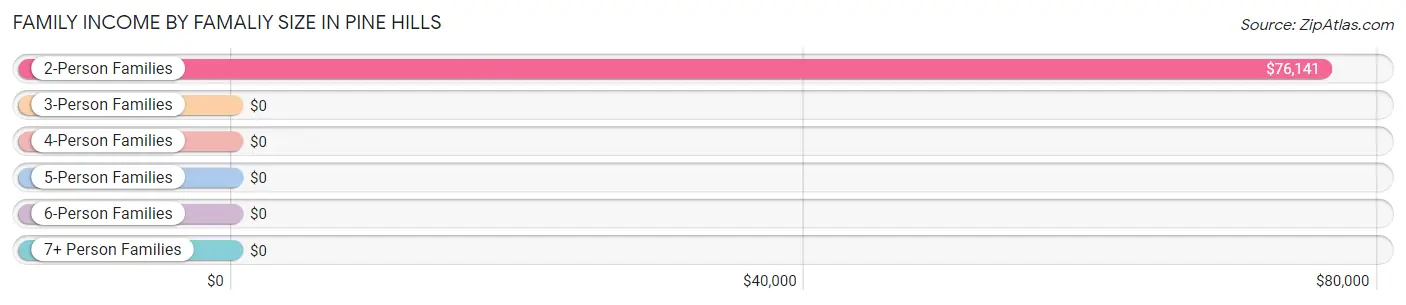
Family Income by Famaliy Size in Pine Hills
2-person families (443 | 53.0%) account for the highest median family income in Pine Hills with $76,141 per family, while 2-person families (443 | 53.0%) have the highest median income of $38,070 per family member.
| Income Bracket | # Families | Median Income |
| 2-Person Families | 443 (53.0%) | $76,141 |
| 3-Person Families | 70 (8.4%) | $0 |
| 4-Person Families | 164 (19.6%) | $0 |
| 5-Person Families | 139 (16.6%) | $0 |
| 6-Person Families | 4 (0.5%) | $0 |
| 7+ Person Families | 16 (1.9%) | $0 |
| Total | 836 (100.0%) | $81,435 |
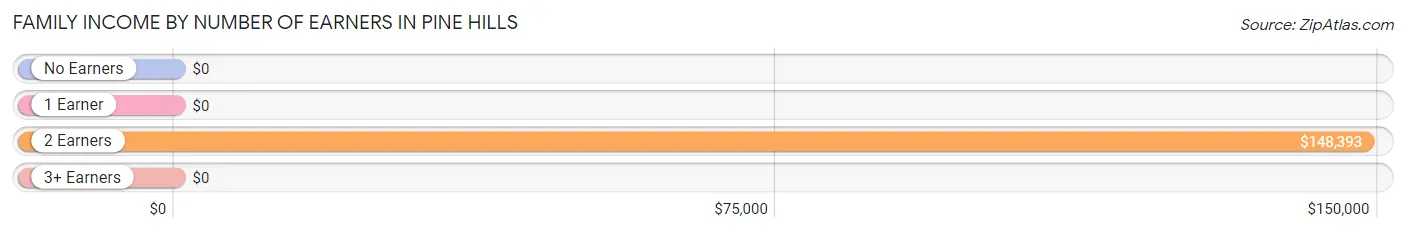
Family Income by Number of Earners in Pine Hills
| Number of Earners | # Families | Median Income |
| No Earners | 146 (17.5%) | $0 |
| 1 Earner | 396 (47.4%) | $0 |
| 2 Earners | 248 (29.7%) | $148,393 |
| 3+ Earners | 46 (5.5%) | $0 |
| Total | 836 (100.0%) | $81,435 |
Household Income in Pine Hills
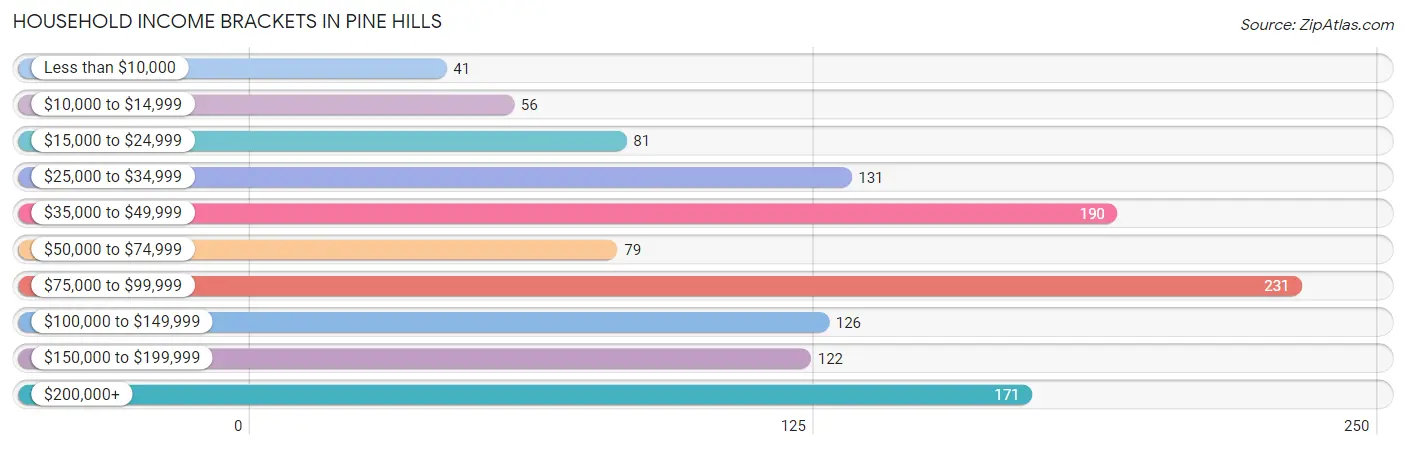
Household Income Brackets in Pine Hills
With 231 households falling in the category, the $75,000 to $99,999 income range is the most frequent in Pine Hills, accounting for 18.8% of all households. In contrast, only 41 households (3.3%) fall into the less than $10,000 income bracket, making it the least populous group.
| Income Bracket | # Households | % Households |
| Less than $10,000 | 41 | 3.3% |
| $10,000 to $14,999 | 56 | 4.6% |
| $15,000 to $24,999 | 81 | 6.6% |
| $25,000 to $34,999 | 131 | 10.7% |
| $35,000 to $49,999 | 190 | 15.5% |
| $50,000 to $74,999 | 79 | 6.4% |
| $75,000 to $99,999 | 231 | 18.8% |
| $100,000 to $149,999 | 126 | 10.3% |
| $150,000 to $199,999 | 122 | 9.9% |
| $200,000+ | 171 | 13.9% |
Household Income by Householder Age in Pine Hills
The median household income in Pine Hills is $78,047, with the highest median household income of $90,625 found in the 45 to 64 years age bracket for the primary householder. A total of 537 households (43.7%) fall into this category.
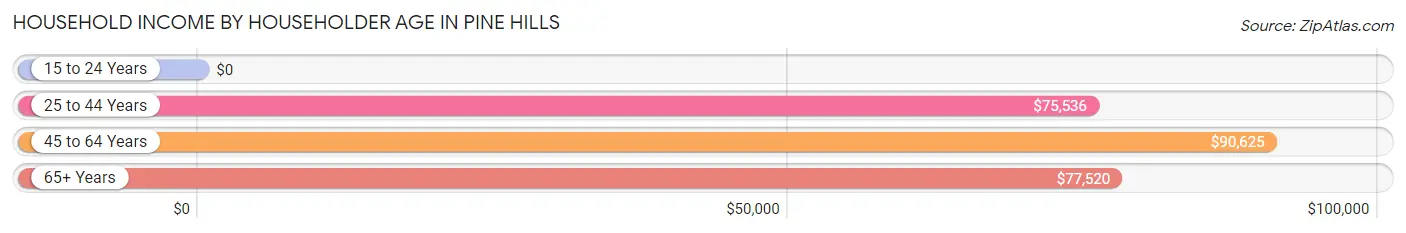
| Income Bracket | # Households | Median Income |
| 15 to 24 Years | 0 (0.0%) | $0 |
| 25 to 44 Years | 284 (23.1%) | $75,536 |
| 45 to 64 Years | 537 (43.7%) | $90,625 |
| 65+ Years | 407 (33.1%) | $77,520 |
| Total | 1,228 (100.0%) | $78,047 |
Poverty in Pine Hills
Income Below Poverty by Sex and Age in Pine Hills
With 26.9% poverty level for males and 14.3% for females among the residents of Pine Hills, under 5 year old males and 15 year old females are the most vulnerable to poverty, with 38 males (82.6%) and 4 females (100.0%) in their respective age groups living below the poverty level.
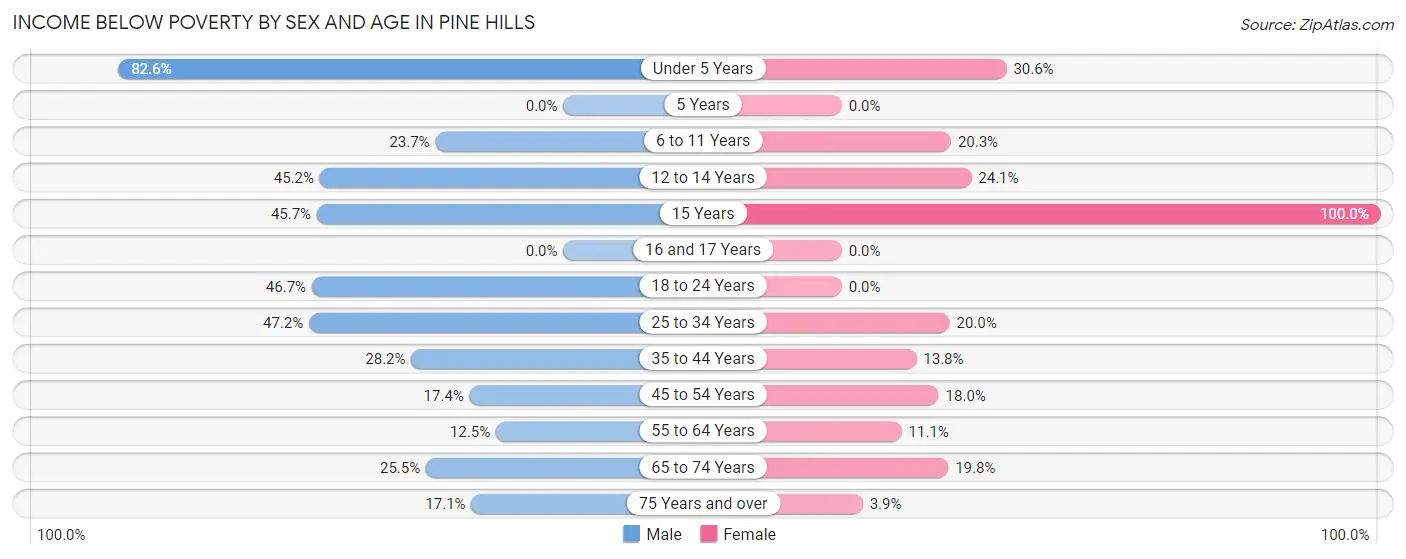
| Age Bracket | Male | Female |
| Under 5 Years | 38 (82.6%) | 22 (30.6%) |
| 5 Years | 0 (0.0%) | 0 (0.0%) |
| 6 to 11 Years | 33 (23.7%) | 31 (20.3%) |
| 12 to 14 Years | 47 (45.2%) | 19 (24.0%) |
| 15 Years | 43 (45.7%) | 4 (100.0%) |
| 16 and 17 Years | 0 (0.0%) | 0 (0.0%) |
| 18 to 24 Years | 7 (46.7%) | 0 (0.0%) |
| 25 to 34 Years | 84 (47.2%) | 41 (20.0%) |
| 35 to 44 Years | 22 (28.2%) | 31 (13.8%) |
| 45 to 54 Years | 40 (17.4%) | 32 (18.0%) |
| 55 to 64 Years | 37 (12.5%) | 25 (11.1%) |
| 65 to 74 Years | 65 (25.5%) | 47 (19.8%) |
| 75 Years and over | 35 (17.1%) | 10 (3.9%) |
| Total | 451 (26.9%) | 262 (14.3%) |
Income Above Poverty by Sex and Age in Pine Hills
According to the poverty statistics in Pine Hills, males aged 16 and 17 years and females aged 16 and 17 years are the age groups that are most secure financially, with 100.0% of males and 100.0% of females in these age groups living above the poverty line.
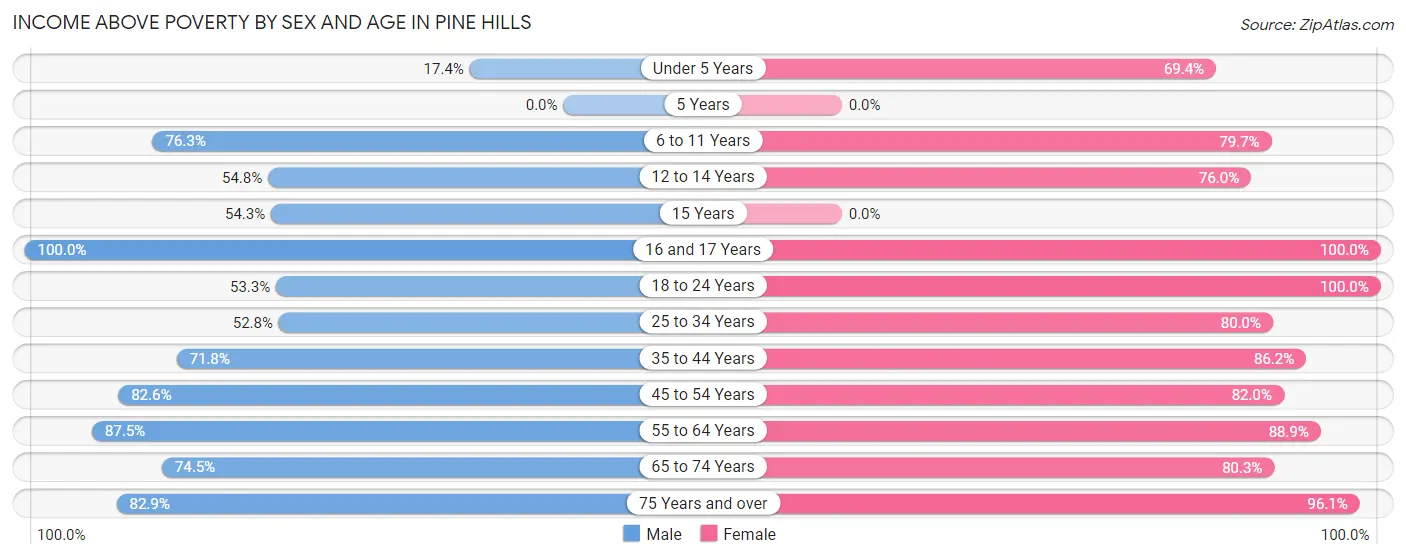
| Age Bracket | Male | Female |
| Under 5 Years | 8 (17.4%) | 50 (69.4%) |
| 5 Years | 0 (0.0%) | 0 (0.0%) |
| 6 to 11 Years | 106 (76.3%) | 122 (79.7%) |
| 12 to 14 Years | 57 (54.8%) | 60 (75.9%) |
| 15 Years | 51 (54.3%) | 0 (0.0%) |
| 16 and 17 Years | 39 (100.0%) | 95 (100.0%) |
| 18 to 24 Years | 8 (53.3%) | 97 (100.0%) |
| 25 to 34 Years | 94 (52.8%) | 164 (80.0%) |
| 35 to 44 Years | 56 (71.8%) | 193 (86.2%) |
| 45 to 54 Years | 190 (82.6%) | 146 (82.0%) |
| 55 to 64 Years | 259 (87.5%) | 200 (88.9%) |
| 65 to 74 Years | 190 (74.5%) | 191 (80.2%) |
| 75 Years and over | 170 (82.9%) | 248 (96.1%) |
| Total | 1,228 (73.1%) | 1,566 (85.7%) |
Income Below Poverty Among Married-Couple Families in Pine Hills
The poverty statistics for married-couple families in Pine Hills show that 6.7% or 39 of the total 581 families live below the poverty line. Families with 3 or 4 children have the highest poverty rate of 33.3%, comprising of 19 families. On the other hand, families with 5 or more children have the lowest poverty rate of 0.0%, which includes 0 families.
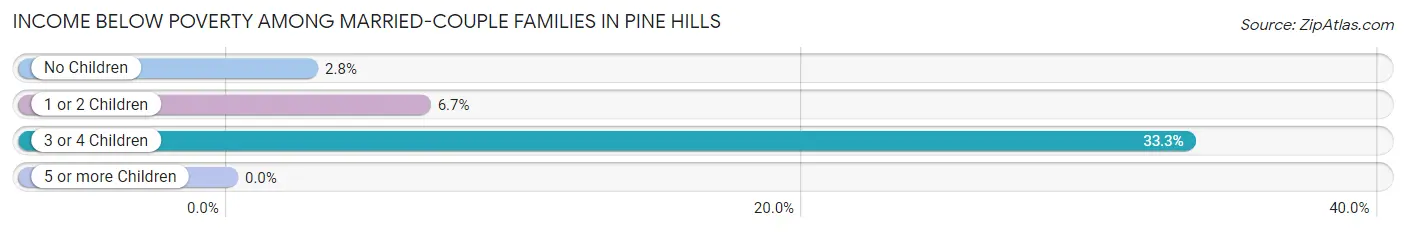
| Children | Above Poverty | Below Poverty |
| No Children | 349 (97.2%) | 10 (2.8%) |
| 1 or 2 Children | 139 (93.3%) | 10 (6.7%) |
| 3 or 4 Children | 38 (66.7%) | 19 (33.3%) |
| 5 or more Children | 16 (100.0%) | 0 (0.0%) |
| Total | 542 (93.3%) | 39 (6.7%) |
Income Below Poverty Among Single-Parent Households in Pine Hills
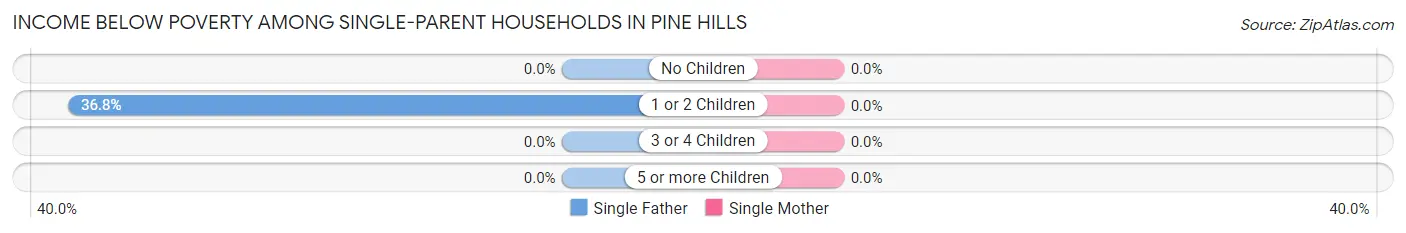
| Children | Single Father | Single Mother |
| No Children | 0 (0.0%) | 0 (0.0%) |
| 1 or 2 Children | 50 (36.8%) | 0 (0.0%) |
| 3 or 4 Children | 0 (0.0%) | 0 (0.0%) |
| 5 or more Children | 0 (0.0%) | 0 (0.0%) |
| Total | 50 (36.8%) | 0 (0.0%) |
Income Below Poverty Among Married-Couple vs Single-Parent Households in Pine Hills
The poverty data for Pine Hills shows that 39 of the married-couple family households (6.7%) and 50 of the single-parent households (19.6%) are living below the poverty level. Within the married-couple family households, those with 3 or 4 children have the highest poverty rate, with 19 households (33.3%) falling below the poverty line. Among the single-parent households, those with 1 or 2 children have the highest poverty rate, with 50 household (21.0%) living below poverty.
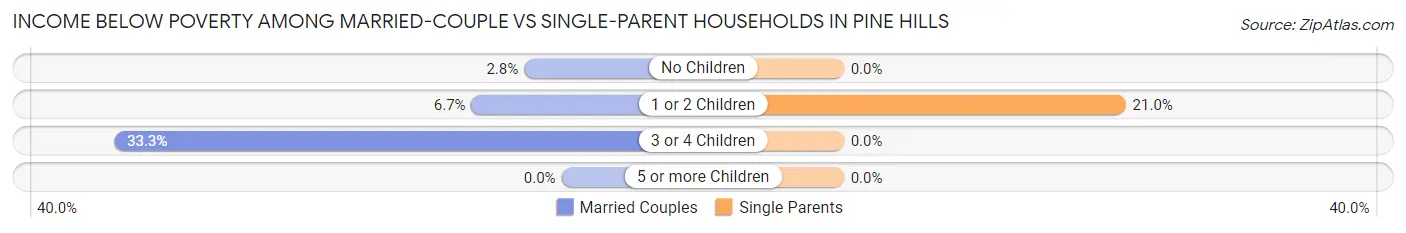
| Children | Married-Couple Families | Single-Parent Households |
| No Children | 10 (2.8%) | 0 (0.0%) |
| 1 or 2 Children | 10 (6.7%) | 50 (21.0%) |
| 3 or 4 Children | 19 (33.3%) | 0 (0.0%) |
| 5 or more Children | 0 (0.0%) | 0 (0.0%) |
| Total | 39 (6.7%) | 50 (19.6%) |
Race in Pine Hills
The most populous races in Pine Hills are White / Caucasian (2,971 | 84.7%), Hispanic or Latino (472 | 13.5%), and Two or more Races (240 | 6.8%).
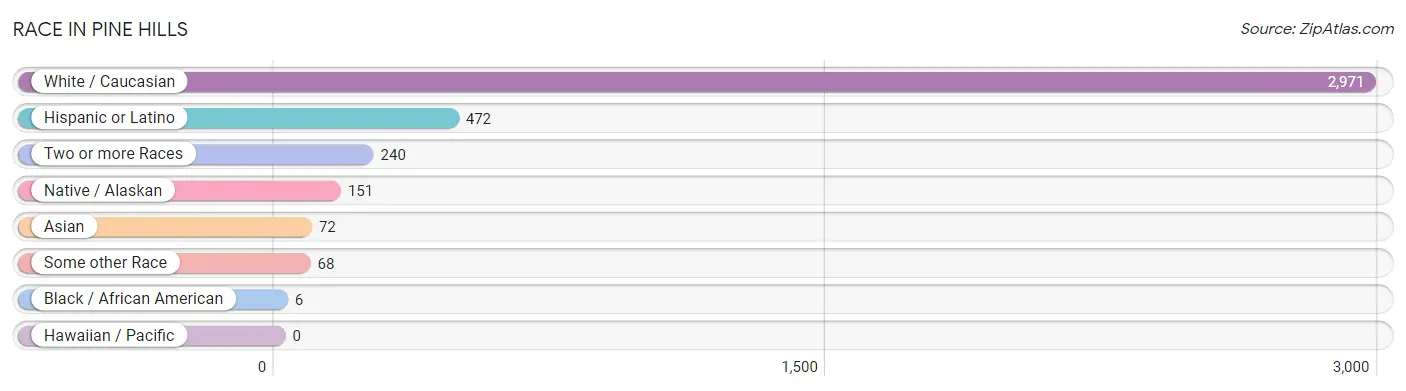
| Race | # Population | % Population |
| Asian | 72 | 2.1% |
| Black / African American | 6 | 0.2% |
| Hawaiian / Pacific | 0 | 0.0% |
| Hispanic or Latino | 472 | 13.5% |
| Native / Alaskan | 151 | 4.3% |
| White / Caucasian | 2,971 | 84.7% |
| Two or more Races | 240 | 6.8% |
| Some other Race | 68 | 1.9% |
| Total | 3,508 | 100.0% |
Ancestry in Pine Hills
The most populous ancestries reported in Pine Hills are German (546 | 15.6%), English (358 | 10.2%), Irish (248 | 7.1%), French (244 | 7.0%), and Mexican (216 | 6.2%), together accounting for 46.0% of all Pine Hills residents.
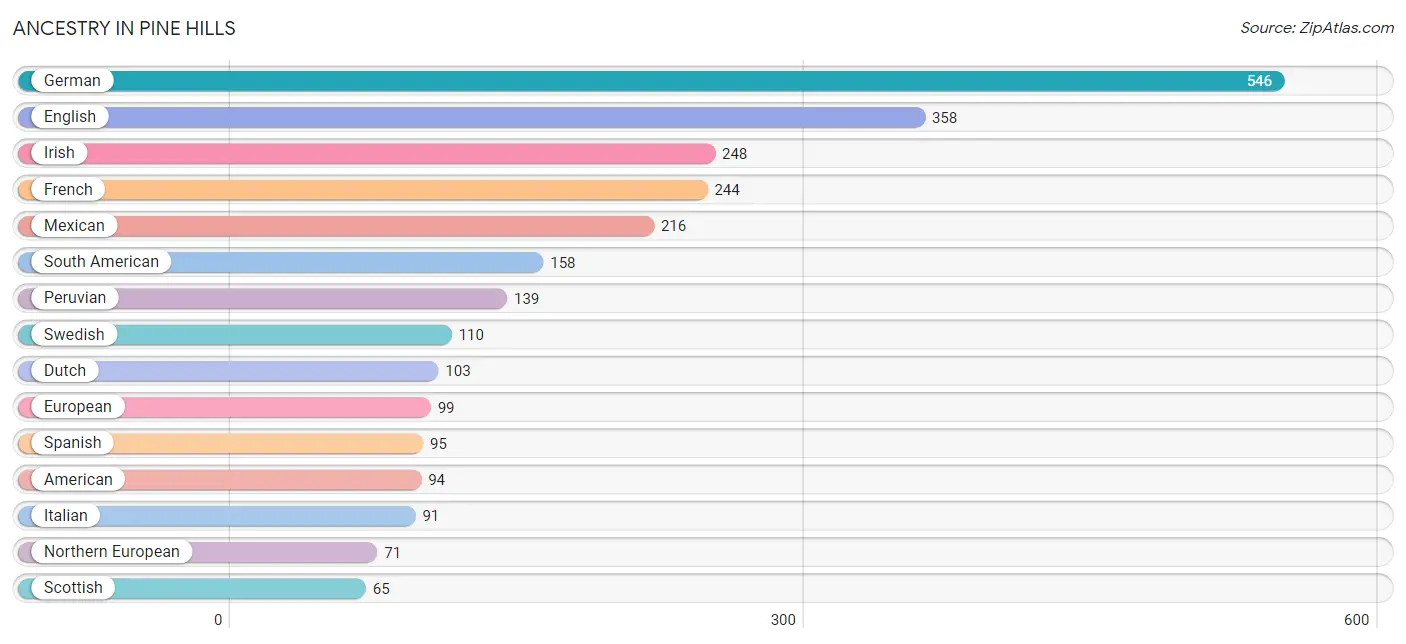
| Ancestry | # Population | % Population |
| African | 3 | 0.1% |
| American | 94 | 2.7% |
| Bhutanese | 12 | 0.3% |
| British | 38 | 1.1% |
| Chilean | 19 | 0.5% |
| Chippewa | 15 | 0.4% |
| Choctaw | 5 | 0.1% |
| Croatian | 26 | 0.7% |
| Danish | 32 | 0.9% |
| Dutch | 103 | 2.9% |
| Eastern European | 41 | 1.2% |
| English | 358 | 10.2% |
| European | 99 | 2.8% |
| Finnish | 18 | 0.5% |
| French | 244 | 7.0% |
| German | 546 | 15.6% |
| Indian (Asian) | 34 | 1.0% |
| Irish | 248 | 7.1% |
| Italian | 91 | 2.6% |
| Korean | 40 | 1.1% |
| Mexican | 216 | 6.2% |
| Northern European | 71 | 2.0% |
| Norwegian | 34 | 1.0% |
| Pakistani | 1 | 0.0% |
| Peruvian | 139 | 4.0% |
| Polish | 16 | 0.5% |
| Portuguese | 26 | 0.7% |
| Scotch-Irish | 30 | 0.9% |
| Scottish | 65 | 1.8% |
| South American | 158 | 4.5% |
| Spaniard | 3 | 0.1% |
| Spanish | 95 | 2.7% |
| Subsaharan African | 3 | 0.1% |
| Swedish | 110 | 3.1% |
| Welsh | 28 | 0.8% | View All 35 Rows |
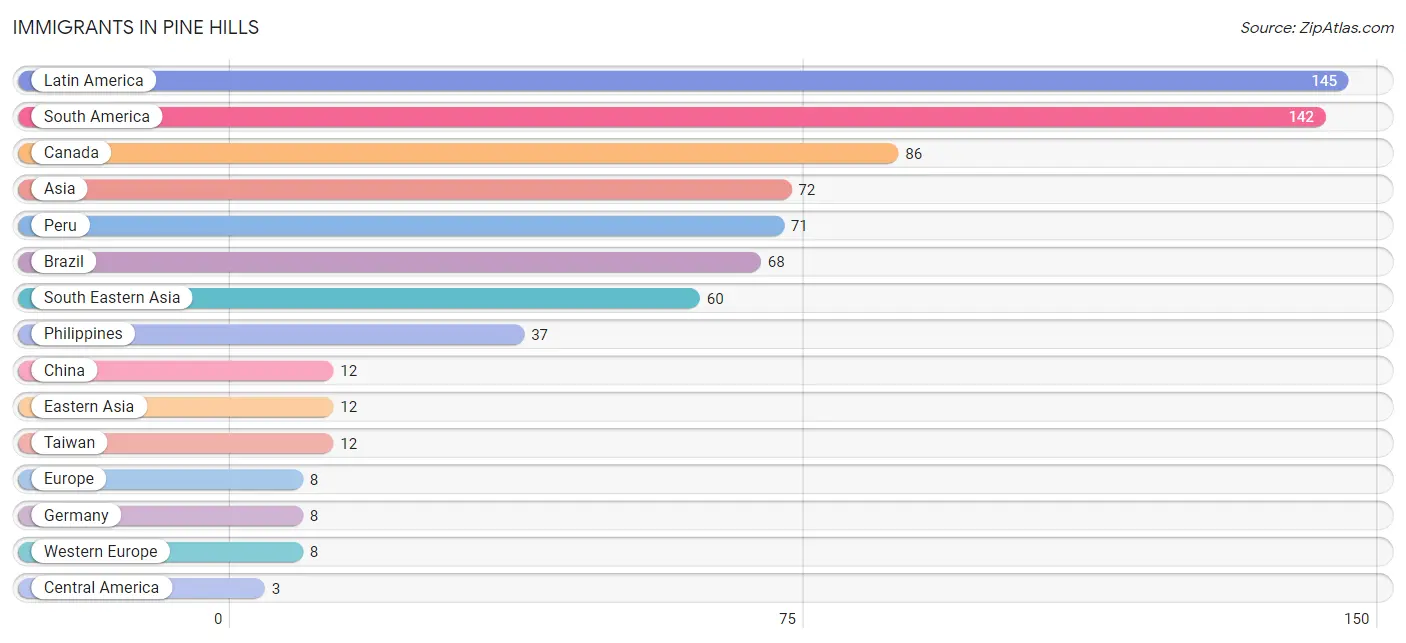
Immigrants in Pine Hills
The most numerous immigrant groups reported in Pine Hills came from Latin America (145 | 4.1%), South America (142 | 4.1%), Canada (86 | 2.5%), Asia (72 | 2.1%), and Peru (71 | 2.0%), together accounting for 14.7% of all Pine Hills residents.
| Immigration Origin | # Population | % Population |
| Asia | 72 | 2.1% |
| Brazil | 68 | 1.9% |
| Canada | 86 | 2.5% |
| Central America | 3 | 0.1% |
| Chile | 3 | 0.1% |
| China | 12 | 0.3% |
| Eastern Asia | 12 | 0.3% |
| Europe | 8 | 0.2% |
| Germany | 8 | 0.2% |
| Latin America | 145 | 4.1% |
| Mexico | 3 | 0.1% |
| Peru | 71 | 2.0% |
| Philippines | 37 | 1.1% |
| South America | 142 | 4.1% |
| South Eastern Asia | 60 | 1.7% |
| Taiwan | 12 | 0.3% |
| Thailand | 1 | 0.0% |
| Western Europe | 8 | 0.2% | View All 18 Rows |
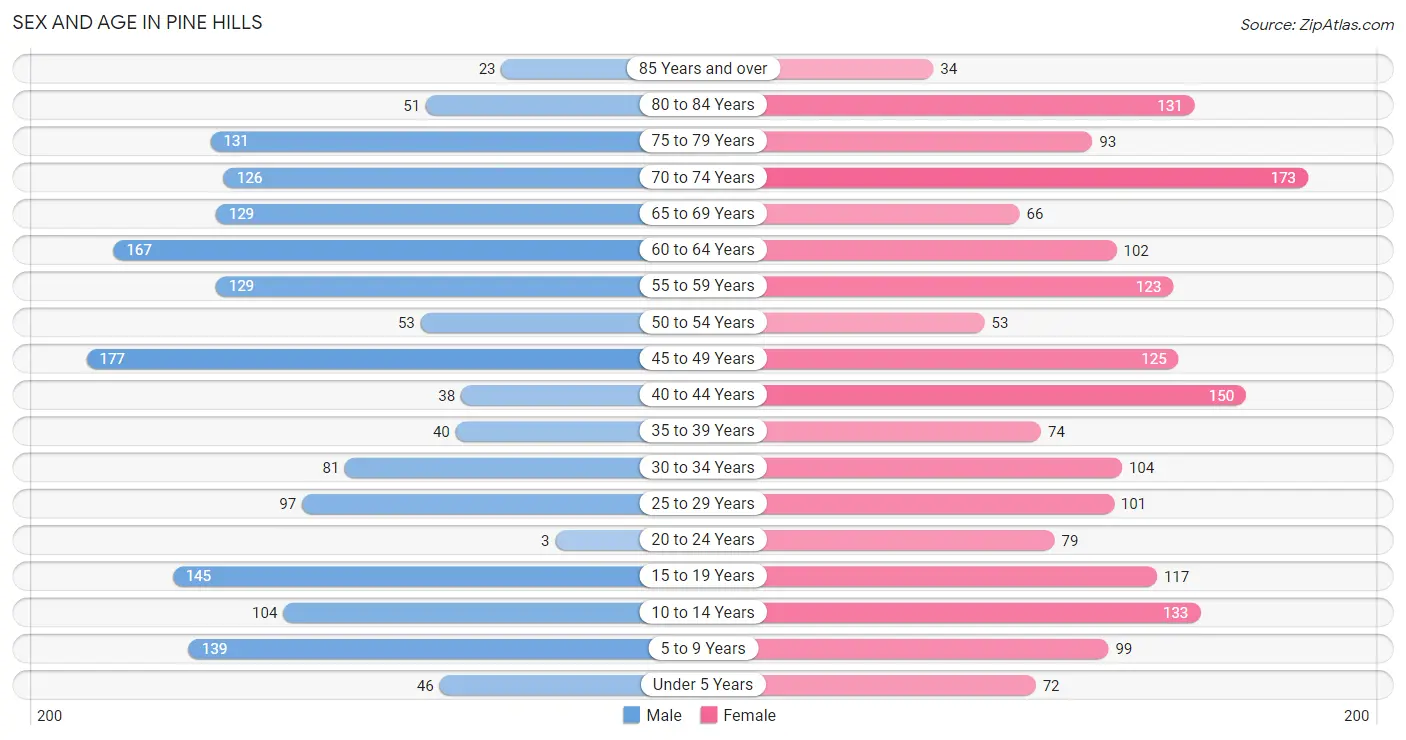
Sex and Age in Pine Hills
Sex and Age in Pine Hills
The most populous age groups in Pine Hills are 45 to 49 Years (177 | 10.5%) for men and 70 to 74 Years (173 | 9.5%) for women.
| Age Bracket | Male | Female |
| Under 5 Years | 46 (2.7%) | 72 (3.9%) |
| 5 to 9 Years | 139 (8.3%) | 99 (5.4%) |
| 10 to 14 Years | 104 (6.2%) | 133 (7.3%) |
| 15 to 19 Years | 145 (8.6%) | 117 (6.4%) |
| 20 to 24 Years | 3 (0.2%) | 79 (4.3%) |
| 25 to 29 Years | 97 (5.8%) | 101 (5.5%) |
| 30 to 34 Years | 81 (4.8%) | 104 (5.7%) |
| 35 to 39 Years | 40 (2.4%) | 74 (4.1%) |
| 40 to 44 Years | 38 (2.3%) | 150 (8.2%) |
| 45 to 49 Years | 177 (10.5%) | 125 (6.8%) |
| 50 to 54 Years | 53 (3.2%) | 53 (2.9%) |
| 55 to 59 Years | 129 (7.7%) | 123 (6.7%) |
| 60 to 64 Years | 167 (10.0%) | 102 (5.6%) |
| 65 to 69 Years | 129 (7.7%) | 66 (3.6%) |
| 70 to 74 Years | 126 (7.5%) | 173 (9.5%) |
| 75 to 79 Years | 131 (7.8%) | 93 (5.1%) |
| 80 to 84 Years | 51 (3.0%) | 131 (7.2%) |
| 85 Years and over | 23 (1.4%) | 34 (1.9%) |
| Total | 1,679 (100.0%) | 1,829 (100.0%) |
Families and Households in Pine Hills
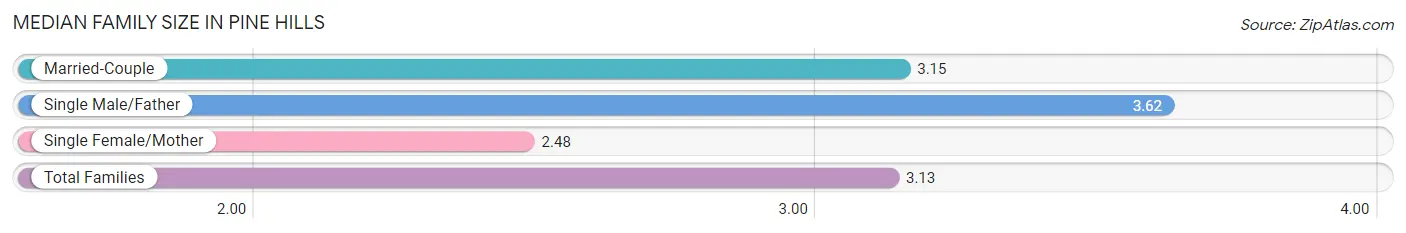
Median Family Size in Pine Hills
The median family size in Pine Hills is 3.13 persons per family, with single male/father families (136 | 16.3%) accounting for the largest median family size of 3.62 persons per family. On the other hand, single female/mother families (119 | 14.2%) represent the smallest median family size with 2.48 persons per family.
| Family Type | # Families | Family Size |
| Married-Couple | 581 (69.5%) | 3.15 |
| Single Male/Father | 136 (16.3%) | 3.62 |
| Single Female/Mother | 119 (14.2%) | 2.48 |
| Total Families | 836 (100.0%) | 3.13 |
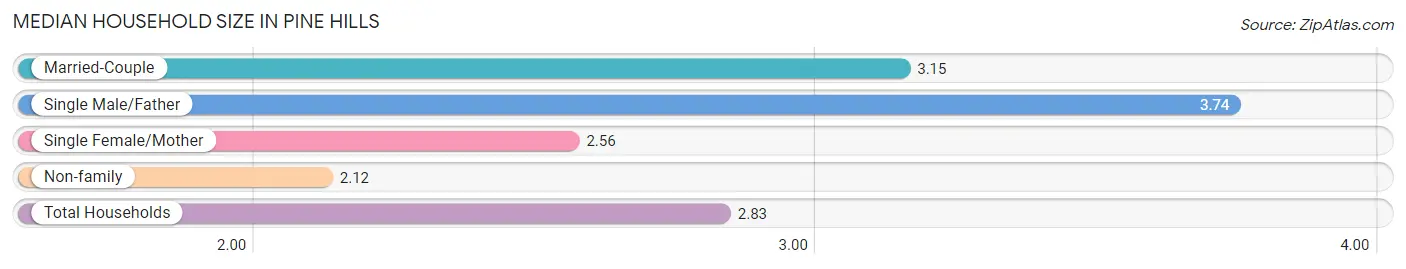
Median Household Size in Pine Hills
The median household size in Pine Hills is 2.83 persons per household, with single male/father households (136 | 11.1%) accounting for the largest median household size of 3.74 persons per household. non-family households (392 | 31.9%) represent the smallest median household size with 2.12 persons per household.
| Household Type | # Households | Household Size |
| Married-Couple | 581 (47.3%) | 3.15 |
| Single Male/Father | 136 (11.1%) | 3.74 |
| Single Female/Mother | 119 (9.7%) | 2.56 |
| Non-family | 392 (31.9%) | 2.12 |
| Total Households | 1,228 (100.0%) | 2.83 |
Household Size by Marriage Status in Pine Hills
Out of a total of 1,228 households in Pine Hills, 836 (68.1%) are family households, while 392 (31.9%) are nonfamily households. The most numerous type of family households are 2-person households, comprising 414, and the most common type of nonfamily households are 1-person households, comprising 246.
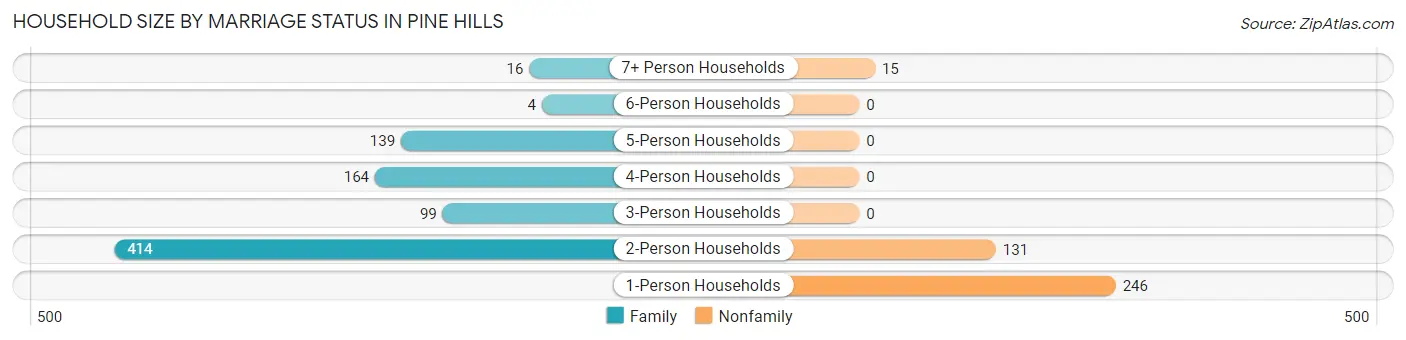
| Household Size | Family Households | Nonfamily Households |
| 1-Person Households | - | 246 (20.0%) |
| 2-Person Households | 414 (33.7%) | 131 (10.7%) |
| 3-Person Households | 99 (8.1%) | 0 (0.0%) |
| 4-Person Households | 164 (13.4%) | 0 (0.0%) |
| 5-Person Households | 139 (11.3%) | 0 (0.0%) |
| 6-Person Households | 4 (0.3%) | 0 (0.0%) |
| 7+ Person Households | 16 (1.3%) | 15 (1.2%) |
| Total | 836 (68.1%) | 392 (31.9%) |
Female Fertility in Pine Hills
Fertility by Age in Pine Hills
Average fertility rate in Pine Hills is 16.0 births per 1,000 women. Women in the age bracket of 20 to 34 years have the highest fertility rate with 32.0 births per 1,000 women. Women in the age bracket of 20 to 34 years acount for 75.0% of all women with births.
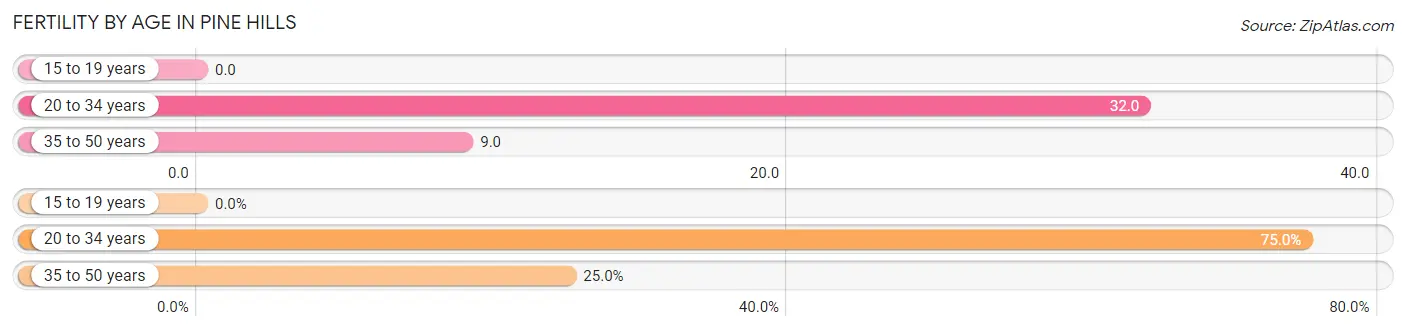
| Age Bracket | Women with Births | Births / 1,000 Women |
| 15 to 19 years | 0 (0.0%) | 0.0 |
| 20 to 34 years | 9 (75.0%) | 32.0 |
| 35 to 50 years | 3 (25.0%) | 9.0 |
| Total | 12 (100.0%) | 16.0 |
Fertility by Age by Marriage Status in Pine Hills
25.0% of women with births (12) in Pine Hills are married. The highest percentage of unmarried women with births falls into 20 to 34 years age bracket with 100.0% of them unmarried at the time of birth, while the lowest percentage of unmarried women with births belong to 35 to 50 years age bracket with 0.0% of them unmarried.
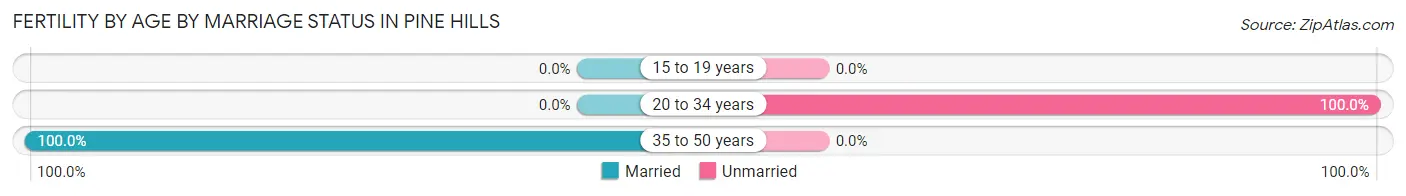
| Age Bracket | Married | Unmarried |
| 15 to 19 years | 0 (0.0%) | 0 (0.0%) |
| 20 to 34 years | 0 (0.0%) | 9 (100.0%) |
| 35 to 50 years | 3 (100.0%) | 0 (0.0%) |
| Total | 3 (25.0%) | 9 (75.0%) |
Fertility by Education in Pine Hills
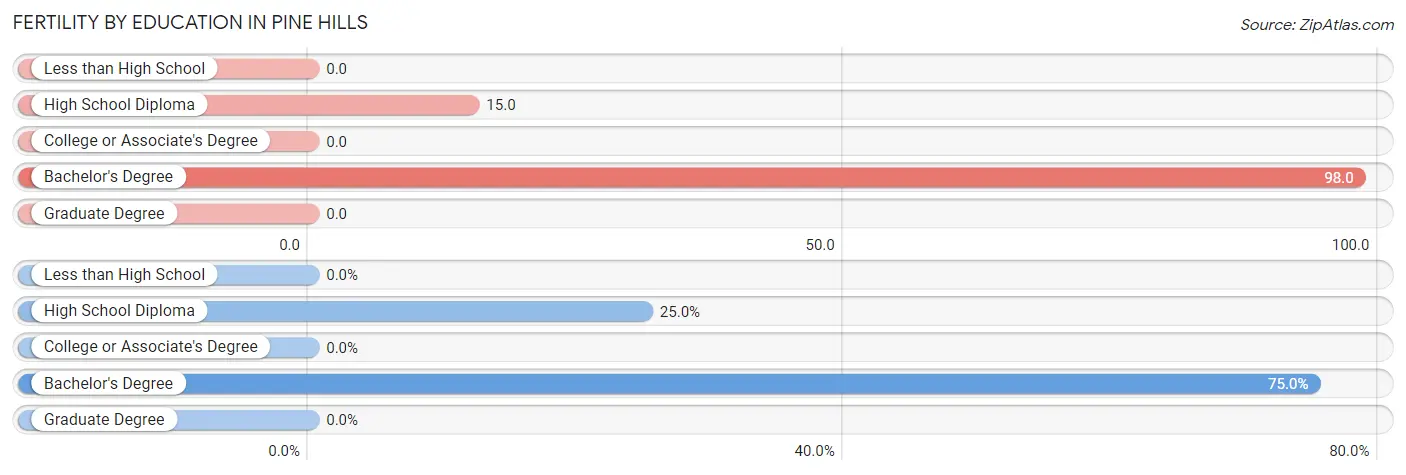
| Educational Attainment | Women with Births | Births / 1,000 Women |
| Less than High School | 0 (0.0%) | 0.0 |
| High School Diploma | 3 (25.0%) | 15.0 |
| College or Associate's Degree | 0 (0.0%) | 0.0 |
| Bachelor's Degree | 9 (75.0%) | 98.0 |
| Graduate Degree | 0 (0.0%) | 0.0 |
| Total | 12 (100.0%) | 16.0 |
Fertility by Education by Marriage Status in Pine Hills
75.0% of women with births in Pine Hills are unmarried. Women with the educational attainment of high school diploma are most likely to be married with 100.0% of them married at childbirth, while women with the educational attainment of bachelor's degree are least likely to be married with 100.0% of them unmarried at childbirth.
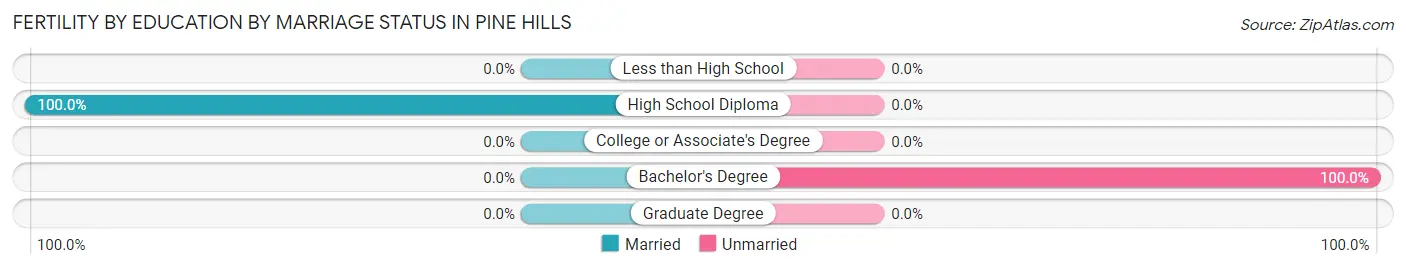
| Educational Attainment | Married | Unmarried |
| Less than High School | 0 (0.0%) | 0 (0.0%) |
| High School Diploma | 3 (100.0%) | 0 (0.0%) |
| College or Associate's Degree | 0 (0.0%) | 0 (0.0%) |
| Bachelor's Degree | 0 (0.0%) | 9 (100.0%) |
| Graduate Degree | 0 (0.0%) | 0 (0.0%) |
| Total | 3 (25.0%) | 9 (75.0%) |
Employment Characteristics in Pine Hills
Employment by Class of Employer in Pine Hills
Among the 1,254 employed individuals in Pine Hills, private company employees (402 | 32.1%), self-employed (not incorporated) (279 | 22.3%), and state government employees (187 | 14.9%) make up the most common classes of employment.
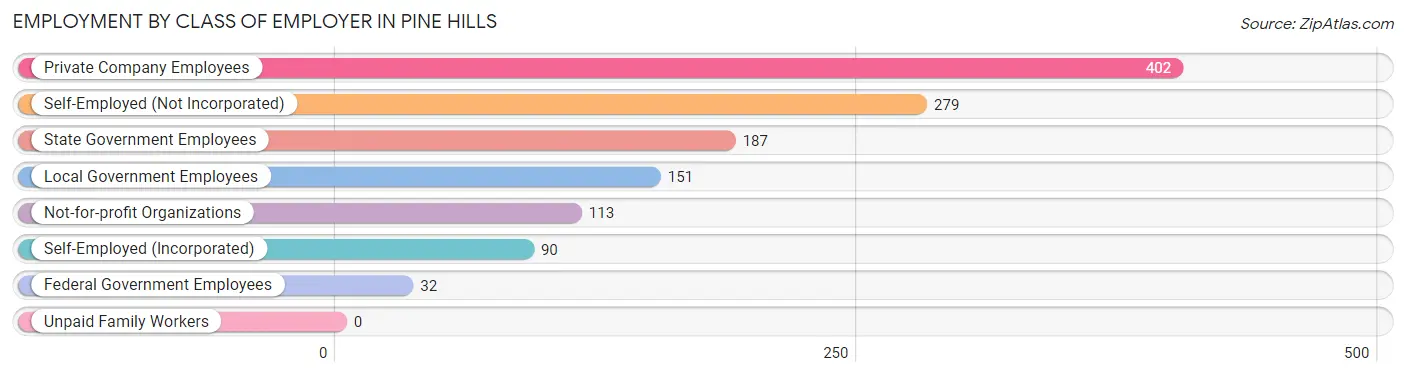
| Employer Class | # Employees | % Employees |
| Private Company Employees | 402 | 32.1% |
| Self-Employed (Incorporated) | 90 | 7.2% |
| Self-Employed (Not Incorporated) | 279 | 22.3% |
| Not-for-profit Organizations | 113 | 9.0% |
| Local Government Employees | 151 | 12.0% |
| State Government Employees | 187 | 14.9% |
| Federal Government Employees | 32 | 2.5% |
| Unpaid Family Workers | 0 | 0.0% |
| Total | 1,254 | 100.0% |
Employment Status by Age in Pine Hills
According to the labor force statistics for Pine Hills, out of the total population over 16 years of age (2,817), 48.6% or 1,369 individuals are in the labor force, with 3.6% or 49 of them unemployed. The age group with the highest labor force participation rate is 20 to 24 years, with 100.0% or 82 individuals in the labor force. Within the labor force, the 75 years and over age range has the highest percentage of unemployed individuals, with 20.6% or 14 of them being unemployed.
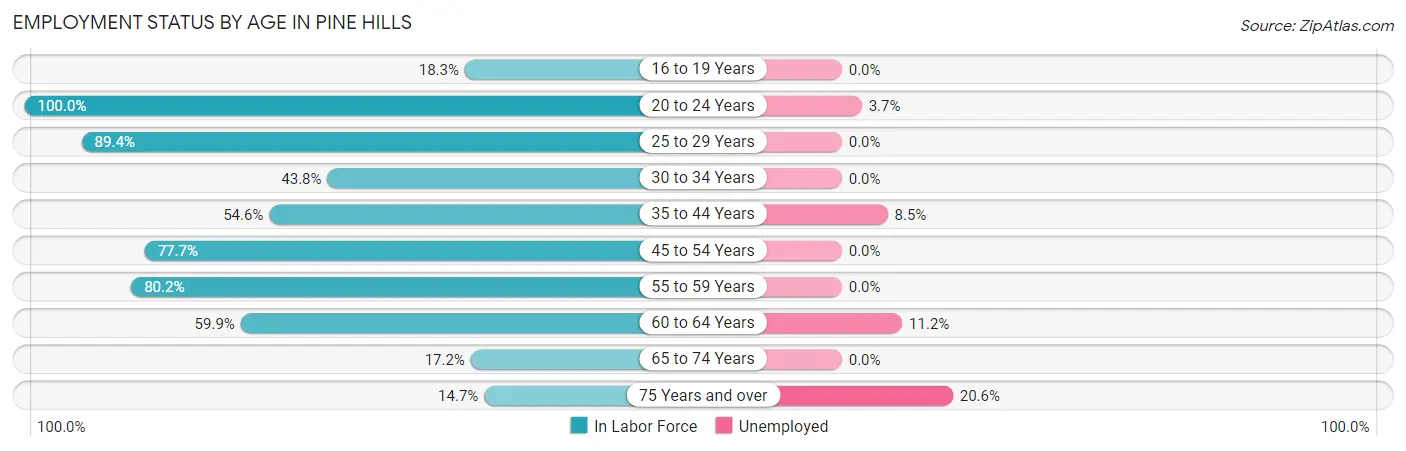
| Age Bracket | In Labor Force | Unemployed |
| 16 to 19 Years | 30 (18.3%) | 0 (0.0%) |
| 20 to 24 Years | 82 (100.0%) | 3 (3.7%) |
| 25 to 29 Years | 177 (89.4%) | 0 (0.0%) |
| 30 to 34 Years | 81 (43.8%) | 0 (0.0%) |
| 35 to 44 Years | 165 (54.6%) | 14 (8.5%) |
| 45 to 54 Years | 317 (77.7%) | 0 (0.0%) |
| 55 to 59 Years | 202 (80.2%) | 0 (0.0%) |
| 60 to 64 Years | 161 (59.9%) | 18 (11.2%) |
| 65 to 74 Years | 85 (17.2%) | 0 (0.0%) |
| 75 Years and over | 68 (14.7%) | 14 (20.6%) |
| Total | 1,369 (48.6%) | 49 (3.6%) |
Employment Status by Educational Attainment in Pine Hills
According to labor force statistics for Pine Hills, 68.3% of individuals (1,102) out of the total population between 25 and 64 years of age (1,614) are in the labor force, with 2.9% or 32 of them being unemployed. The group with the highest labor force participation rate are those with the educational attainment of bachelor's degree or higher, with 85.1% or 423 individuals in the labor force. Within the labor force, individuals with less than high school education have the highest percentage of unemployment, with 13.0% or 18 of them being unemployed.
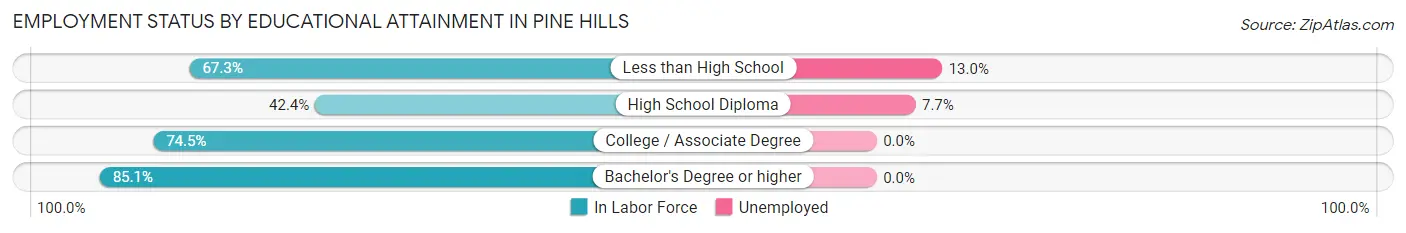
| Educational Attainment | In Labor Force | Unemployed |
| Less than High School | 138 (67.3%) | 27 (13.0%) |
| High School Diploma | 182 (42.4%) | 33 (7.7%) |
| College / Associate Degree | 360 (74.5%) | 0 (0.0%) |
| Bachelor's Degree or higher | 423 (85.1%) | 0 (0.0%) |
| Total | 1,102 (68.3%) | 47 (2.9%) |
Employment Occupations by Sex in Pine Hills
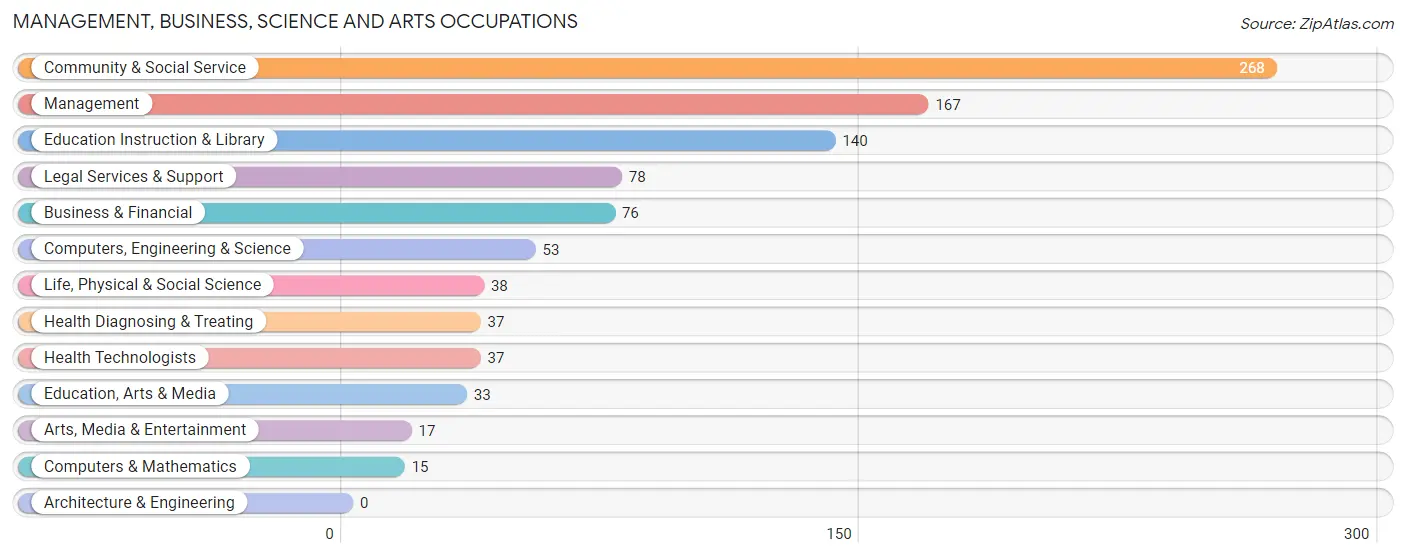
Management, Business, Science and Arts Occupations
The most common Management, Business, Science and Arts occupations in Pine Hills are Community & Social Service (268 | 20.3%), Management (167 | 12.7%), Education Instruction & Library (140 | 10.6%), Legal Services & Support (78 | 5.9%), and Business & Financial (76 | 5.8%).
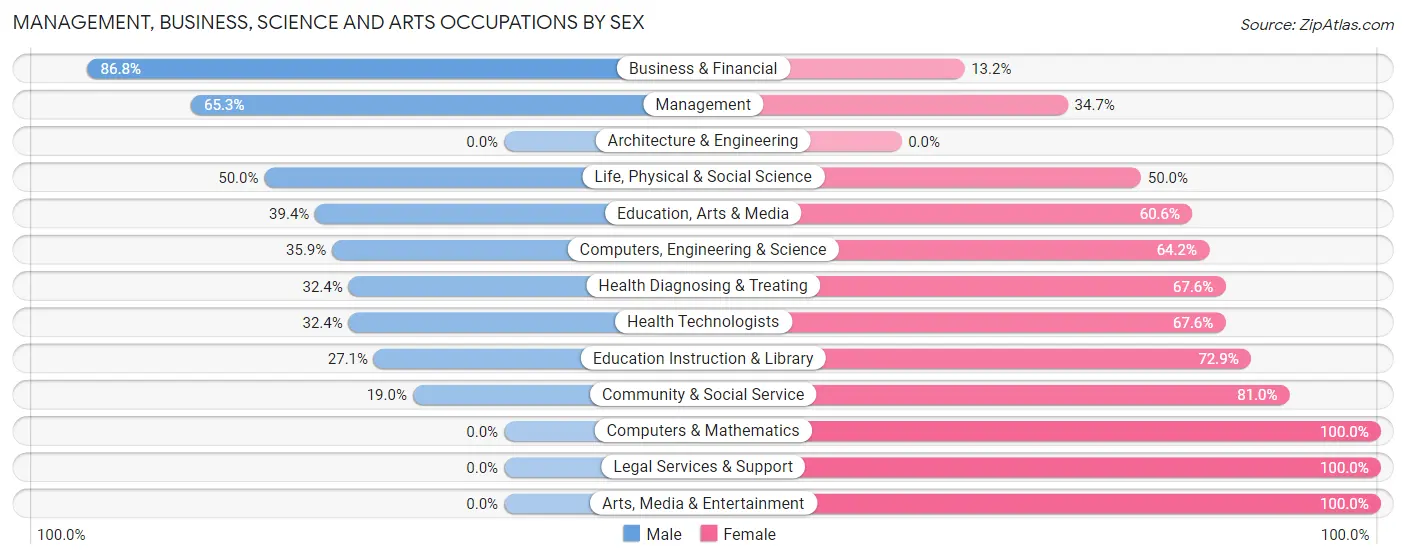
Management, Business, Science and Arts Occupations by Sex
Within the Management, Business, Science and Arts occupations in Pine Hills, the most male-oriented occupations are Business & Financial (86.8%), Management (65.3%), and Life, Physical & Social Science (50.0%), while the most female-oriented occupations are Computers & Mathematics (100.0%), Legal Services & Support (100.0%), and Arts, Media & Entertainment (100.0%).
| Occupation | Male | Female |
| Management | 109 (65.3%) | 58 (34.7%) |
| Business & Financial | 66 (86.8%) | 10 (13.2%) |
| Computers, Engineering & Science | 19 (35.8%) | 34 (64.1%) |
| Computers & Mathematics | 0 (0.0%) | 15 (100.0%) |
| Architecture & Engineering | 0 (0.0%) | 0 (0.0%) |
| Life, Physical & Social Science | 19 (50.0%) | 19 (50.0%) |
| Community & Social Service | 51 (19.0%) | 217 (81.0%) |
| Education, Arts & Media | 13 (39.4%) | 20 (60.6%) |
| Legal Services & Support | 0 (0.0%) | 78 (100.0%) |
| Education Instruction & Library | 38 (27.1%) | 102 (72.9%) |
| Arts, Media & Entertainment | 0 (0.0%) | 17 (100.0%) |
| Health Diagnosing & Treating | 12 (32.4%) | 25 (67.6%) |
| Health Technologists | 12 (32.4%) | 25 (67.6%) |
| Total (Category) | 257 (42.8%) | 344 (57.2%) |
| Total (Overall) | 674 (51.1%) | 645 (48.9%) |
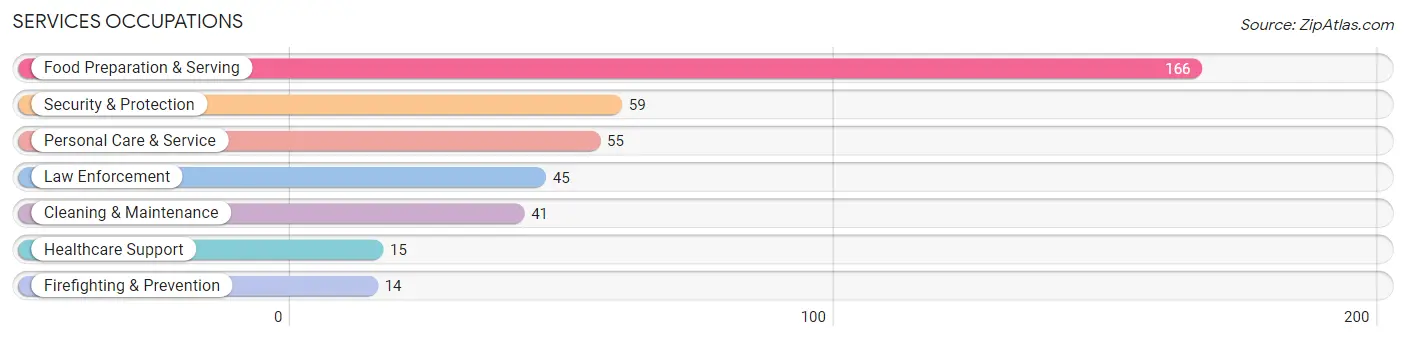
Services Occupations
The most common Services occupations in Pine Hills are Food Preparation & Serving (166 | 12.6%), Security & Protection (59 | 4.5%), Personal Care & Service (55 | 4.2%), Law Enforcement (45 | 3.4%), and Cleaning & Maintenance (41 | 3.1%).
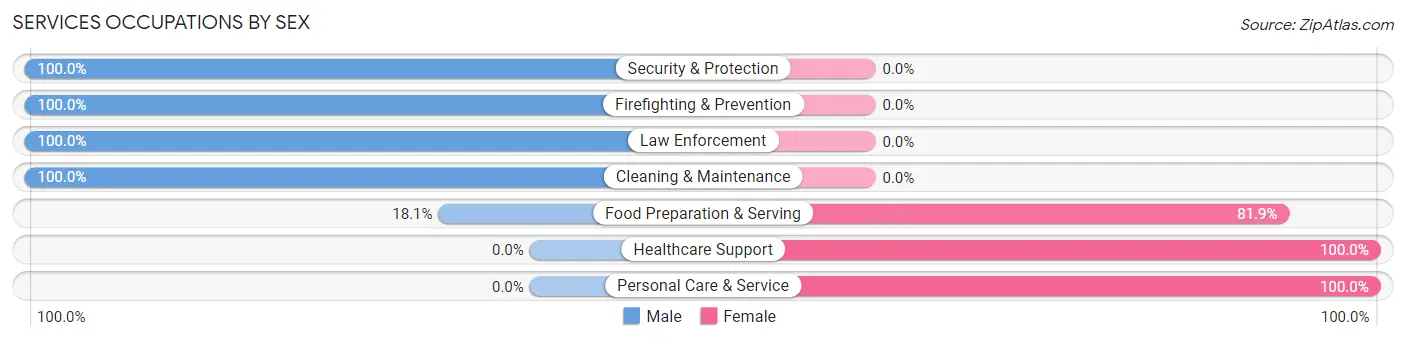
Services Occupations by Sex
Within the Services occupations in Pine Hills, the most male-oriented occupations are Security & Protection (100.0%), Firefighting & Prevention (100.0%), and Law Enforcement (100.0%), while the most female-oriented occupations are Healthcare Support (100.0%), Personal Care & Service (100.0%), and Food Preparation & Serving (81.9%).
| Occupation | Male | Female |
| Healthcare Support | 0 (0.0%) | 15 (100.0%) |
| Security & Protection | 59 (100.0%) | 0 (0.0%) |
| Firefighting & Prevention | 14 (100.0%) | 0 (0.0%) |
| Law Enforcement | 45 (100.0%) | 0 (0.0%) |
| Food Preparation & Serving | 30 (18.1%) | 136 (81.9%) |
| Cleaning & Maintenance | 41 (100.0%) | 0 (0.0%) |
| Personal Care & Service | 0 (0.0%) | 55 (100.0%) |
| Total (Category) | 130 (38.7%) | 206 (61.3%) |
| Total (Overall) | 674 (51.1%) | 645 (48.9%) |
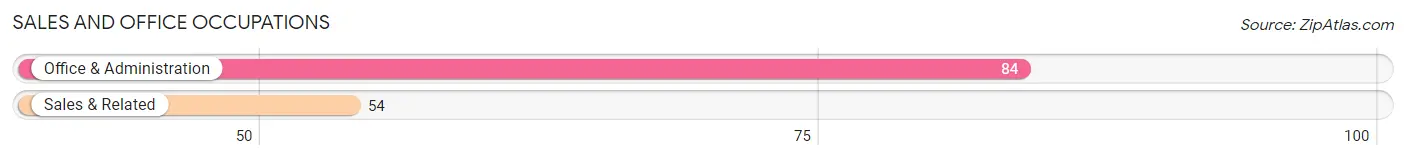
Sales and Office Occupations
The most common Sales and Office occupations in Pine Hills are Office & Administration (84 | 6.4%), and Sales & Related (54 | 4.1%).
Sales and Office Occupations by Sex
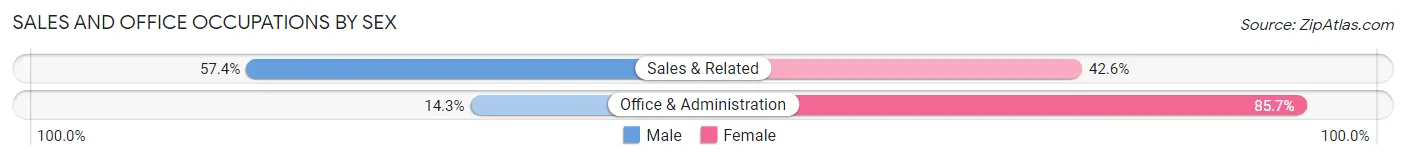
| Occupation | Male | Female |
| Sales & Related | 31 (57.4%) | 23 (42.6%) |
| Office & Administration | 12 (14.3%) | 72 (85.7%) |
| Total (Category) | 43 (31.2%) | 95 (68.8%) |
| Total (Overall) | 674 (51.1%) | 645 (48.9%) |
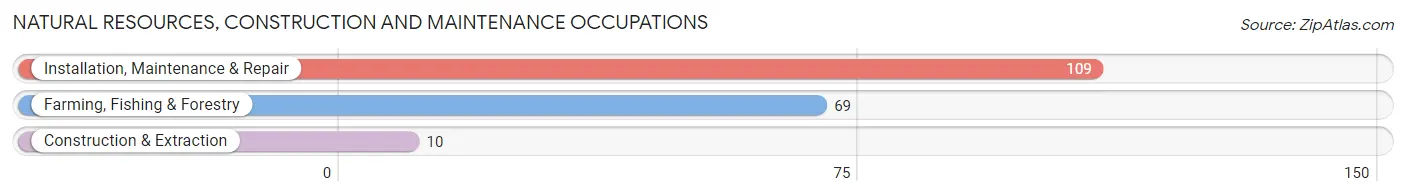
Natural Resources, Construction and Maintenance Occupations
The most common Natural Resources, Construction and Maintenance occupations in Pine Hills are Installation, Maintenance & Repair (109 | 8.3%), Farming, Fishing & Forestry (69 | 5.2%), and Construction & Extraction (10 | 0.8%).
Natural Resources, Construction and Maintenance Occupations by Sex
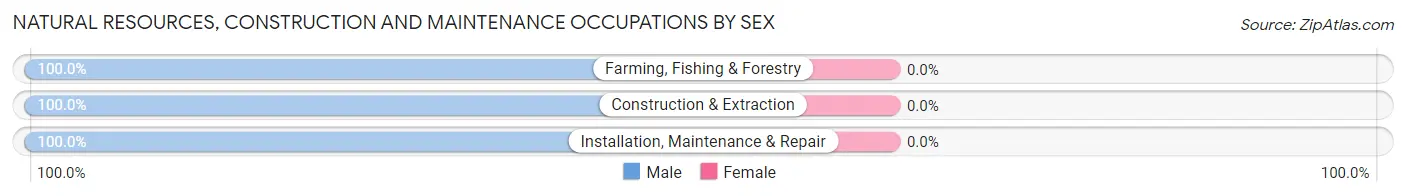
| Occupation | Male | Female |
| Farming, Fishing & Forestry | 69 (100.0%) | 0 (0.0%) |
| Construction & Extraction | 10 (100.0%) | 0 (0.0%) |
| Installation, Maintenance & Repair | 109 (100.0%) | 0 (0.0%) |
| Total (Category) | 188 (100.0%) | 0 (0.0%) |
| Total (Overall) | 674 (51.1%) | 645 (48.9%) |
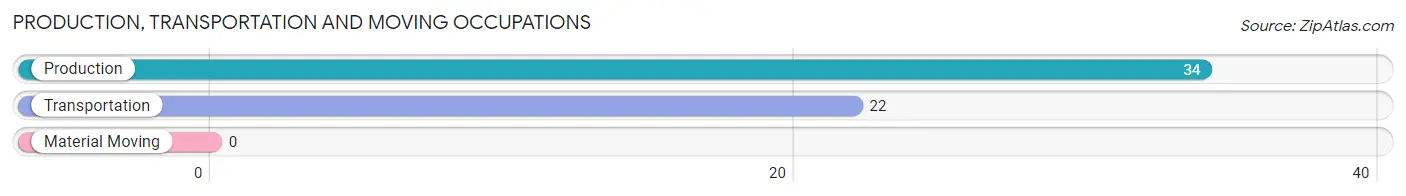
Production, Transportation and Moving Occupations
The most common Production, Transportation and Moving occupations in Pine Hills are Production (34 | 2.6%), and Transportation (22 | 1.7%).
Production, Transportation and Moving Occupations by Sex
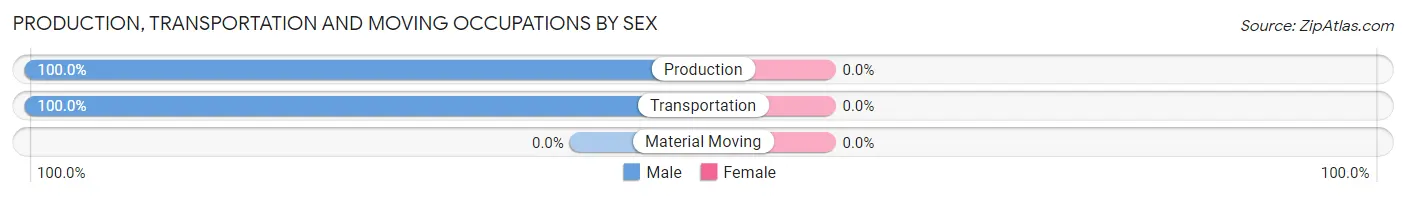
| Occupation | Male | Female |
| Production | 34 (100.0%) | 0 (0.0%) |
| Transportation | 22 (100.0%) | 0 (0.0%) |
| Material Moving | 0 (0.0%) | 0 (0.0%) |
| Total (Category) | 56 (100.0%) | 0 (0.0%) |
| Total (Overall) | 674 (51.1%) | 645 (48.9%) |
Employment Industries by Sex in Pine Hills
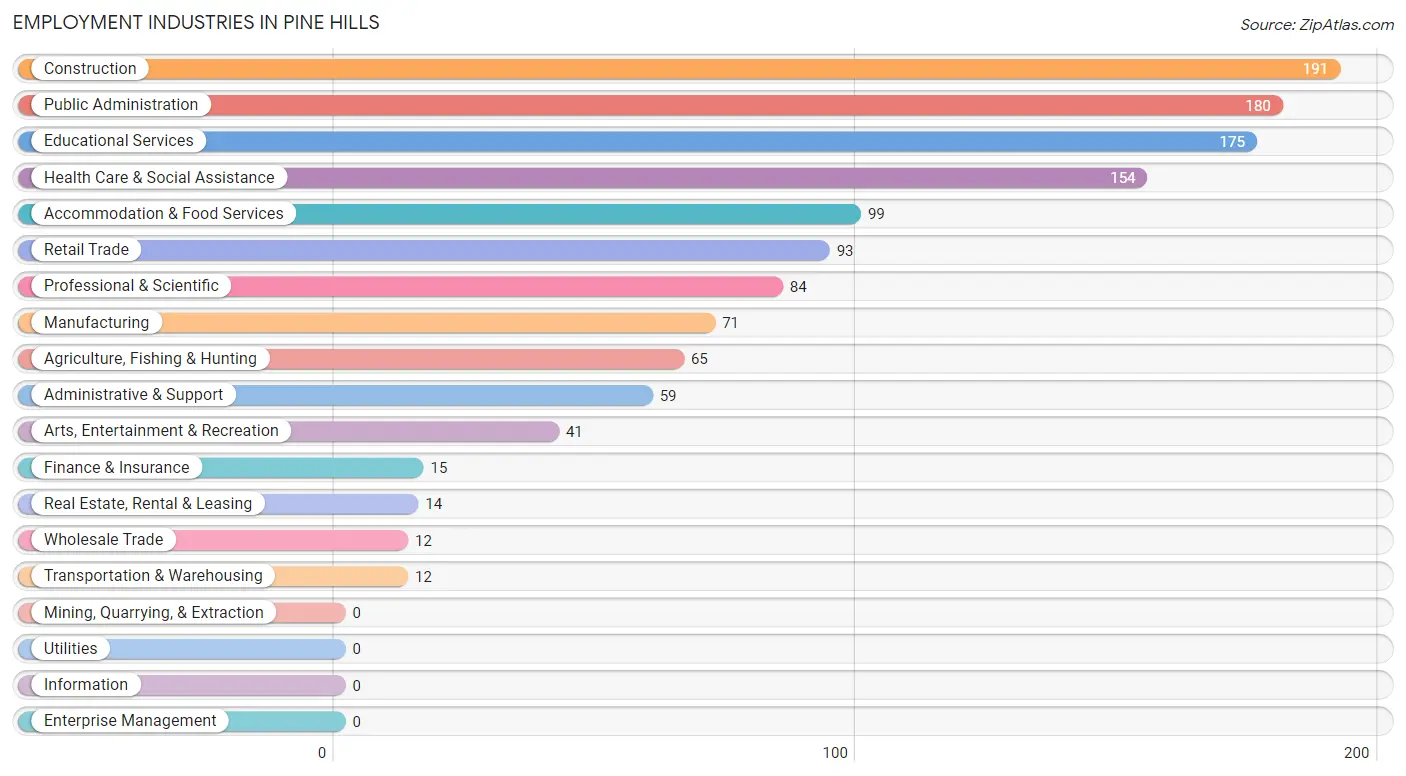
Employment Industries in Pine Hills
The major employment industries in Pine Hills include Construction (191 | 14.5%), Public Administration (180 | 13.7%), Educational Services (175 | 13.3%), Health Care & Social Assistance (154 | 11.7%), and Accommodation & Food Services (99 | 7.5%).
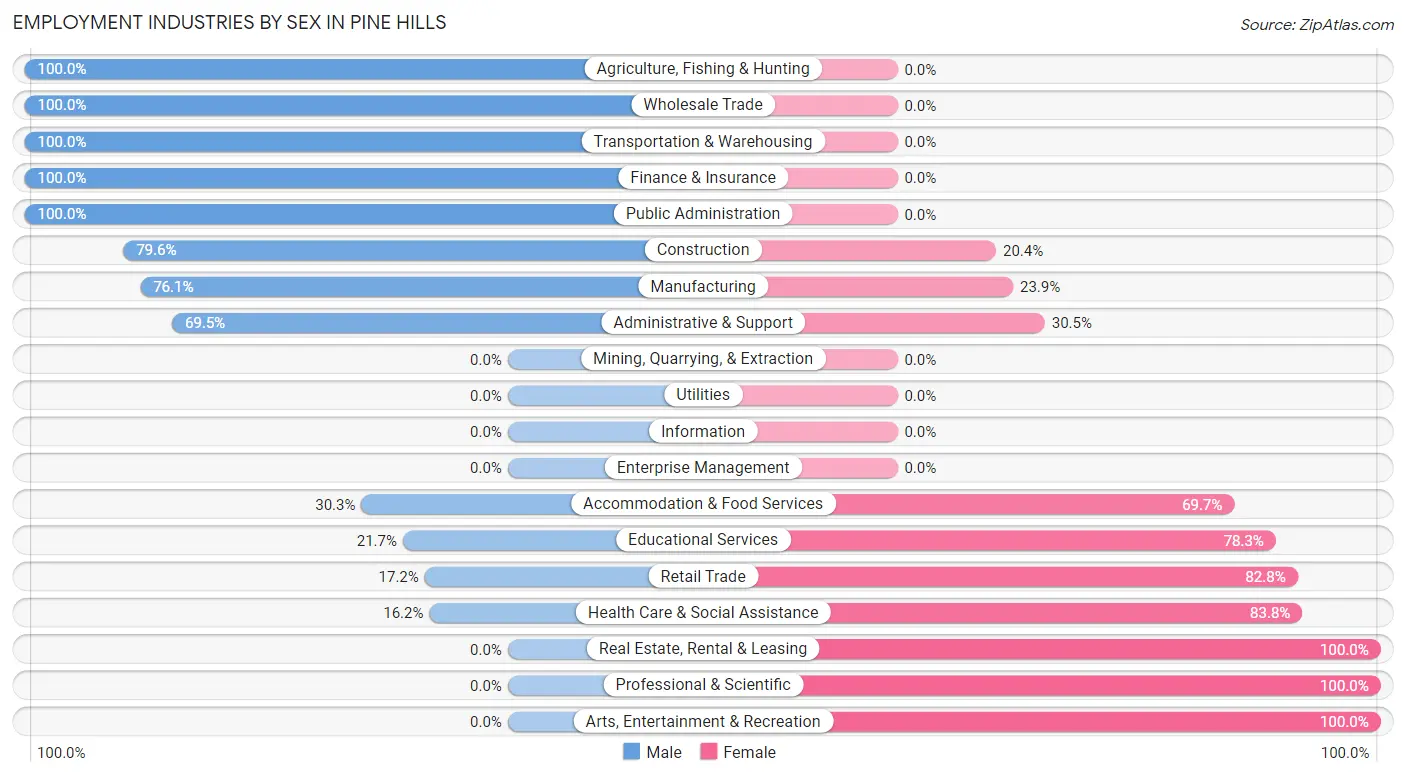
Employment Industries by Sex in Pine Hills
The Pine Hills industries that see more men than women are Agriculture, Fishing & Hunting (100.0%), Wholesale Trade (100.0%), and Transportation & Warehousing (100.0%), whereas the industries that tend to have a higher number of women are Real Estate, Rental & Leasing (100.0%), Professional & Scientific (100.0%), and Arts, Entertainment & Recreation (100.0%).
| Industry | Male | Female |
| Agriculture, Fishing & Hunting | 65 (100.0%) | 0 (0.0%) |
| Mining, Quarrying, & Extraction | 0 (0.0%) | 0 (0.0%) |
| Construction | 152 (79.6%) | 39 (20.4%) |
| Manufacturing | 54 (76.1%) | 17 (23.9%) |
| Wholesale Trade | 12 (100.0%) | 0 (0.0%) |
| Retail Trade | 16 (17.2%) | 77 (82.8%) |
| Transportation & Warehousing | 12 (100.0%) | 0 (0.0%) |
| Utilities | 0 (0.0%) | 0 (0.0%) |
| Information | 0 (0.0%) | 0 (0.0%) |
| Finance & Insurance | 15 (100.0%) | 0 (0.0%) |
| Real Estate, Rental & Leasing | 0 (0.0%) | 14 (100.0%) |
| Professional & Scientific | 0 (0.0%) | 84 (100.0%) |
| Enterprise Management | 0 (0.0%) | 0 (0.0%) |
| Administrative & Support | 41 (69.5%) | 18 (30.5%) |
| Educational Services | 38 (21.7%) | 137 (78.3%) |
| Health Care & Social Assistance | 25 (16.2%) | 129 (83.8%) |
| Arts, Entertainment & Recreation | 0 (0.0%) | 41 (100.0%) |
| Accommodation & Food Services | 30 (30.3%) | 69 (69.7%) |
| Public Administration | 180 (100.0%) | 0 (0.0%) |
| Total | 674 (51.1%) | 645 (48.9%) |
Education in Pine Hills
School Enrollment in Pine Hills
The most common levels of schooling among the 883 students in Pine Hills are elementary school (251 | 28.4%), high school (232 | 26.3%), and middle school (224 | 25.4%).
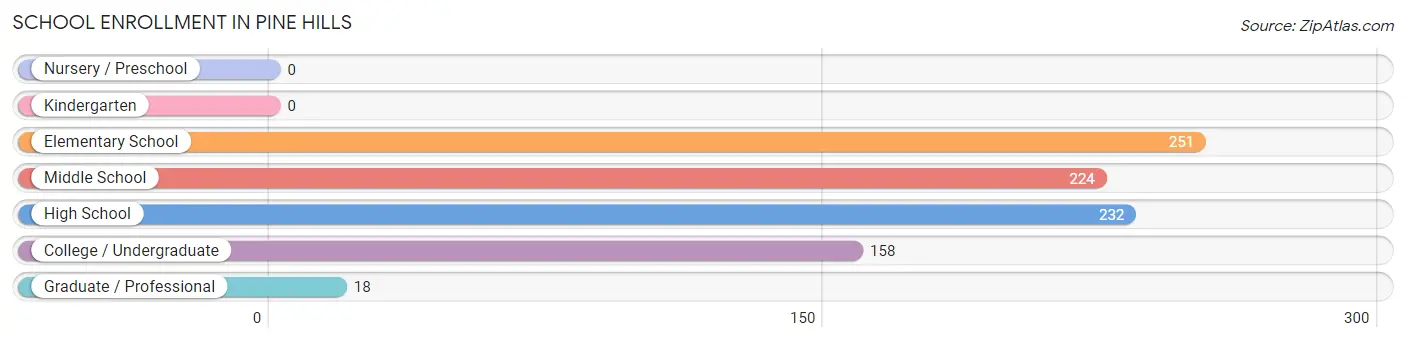
| School Level | # Students | % Students |
| Nursery / Preschool | 0 | 0.0% |
| Kindergarten | 0 | 0.0% |
| Elementary School | 251 | 28.4% |
| Middle School | 224 | 25.4% |
| High School | 232 | 26.3% |
| College / Undergraduate | 158 | 17.9% |
| Graduate / Professional | 18 | 2.0% |
| Total | 883 | 100.0% |
School Enrollment by Age by Funding Source in Pine Hills
Out of a total of 883 students who are enrolled in schools in Pine Hills, 149 (16.9%) attend a private institution, while the remaining 734 (83.1%) are enrolled in public schools. The age group of 15 to 17 year olds has the highest likelihood of being enrolled in private schools, with 149 (64.2% in the age bracket) enrolled. Conversely, the age group of 5 to 9 year old has the lowest likelihood of being enrolled in a private school, with 238 (100.0% in the age bracket) attending a public institution.
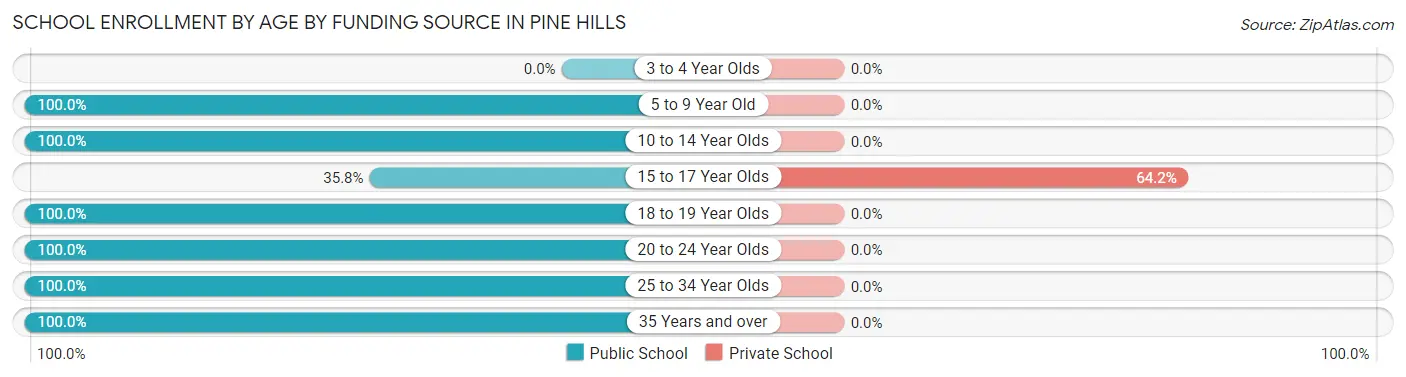
| Age Bracket | Public School | Private School |
| 3 to 4 Year Olds | 0 (0.0%) | 0 (0.0%) |
| 5 to 9 Year Old | 238 (100.0%) | 0 (0.0%) |
| 10 to 14 Year Olds | 237 (100.0%) | 0 (0.0%) |
| 15 to 17 Year Olds | 83 (35.8%) | 149 (64.2%) |
| 18 to 19 Year Olds | 18 (100.0%) | 0 (0.0%) |
| 20 to 24 Year Olds | 54 (100.0%) | 0 (0.0%) |
| 25 to 34 Year Olds | 69 (100.0%) | 0 (0.0%) |
| 35 Years and over | 35 (100.0%) | 0 (0.0%) |
| Total | 734 (83.1%) | 149 (16.9%) |
Educational Attainment by Field of Study in Pine Hills
Education (185 | 20.3%), liberal arts & history (165 | 18.1%), literature & languages (114 | 12.5%), bio, nature & agricultural (94 | 10.3%), and social sciences (70 | 7.7%) are the most common fields of study among 912 individuals in Pine Hills who have obtained a bachelor's degree or higher.
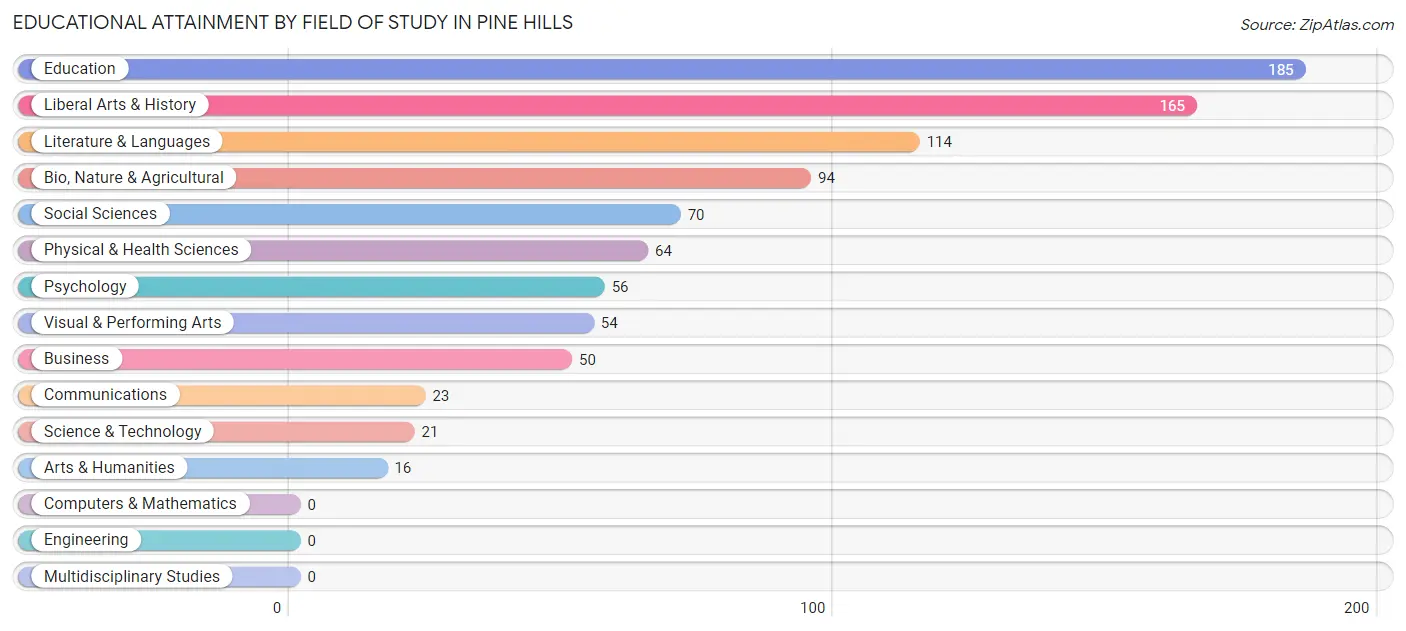
| Field of Study | # Graduates | % Graduates |
| Computers & Mathematics | 0 | 0.0% |
| Bio, Nature & Agricultural | 94 | 10.3% |
| Physical & Health Sciences | 64 | 7.0% |
| Psychology | 56 | 6.1% |
| Social Sciences | 70 | 7.7% |
| Engineering | 0 | 0.0% |
| Multidisciplinary Studies | 0 | 0.0% |
| Science & Technology | 21 | 2.3% |
| Business | 50 | 5.5% |
| Education | 185 | 20.3% |
| Literature & Languages | 114 | 12.5% |
| Liberal Arts & History | 165 | 18.1% |
| Visual & Performing Arts | 54 | 5.9% |
| Communications | 23 | 2.5% |
| Arts & Humanities | 16 | 1.8% |
| Total | 912 | 100.0% |
Transportation & Commute in Pine Hills
Vehicle Availability by Sex in Pine Hills
The most prevalent vehicle ownership categories in Pine Hills are males with 3 vehicles (264, accounting for 39.6%) and females with 3 vehicles (71, making up 45.5%).
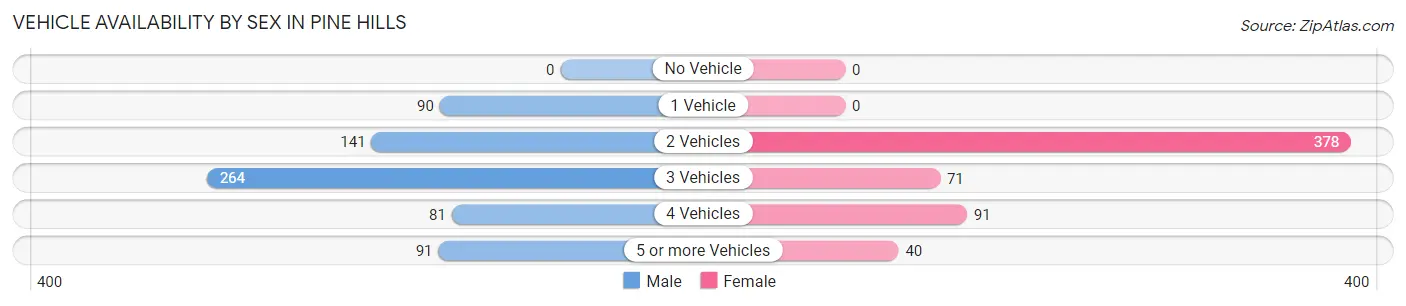
| Vehicles Available | Male | Female |
| No Vehicle | 0 (0.0%) | 0 (0.0%) |
| 1 Vehicle | 90 (13.5%) | 0 (0.0%) |
| 2 Vehicles | 141 (21.1%) | 378 (65.2%) |
| 3 Vehicles | 264 (39.6%) | 71 (12.2%) |
| 4 Vehicles | 81 (12.1%) | 91 (15.7%) |
| 5 or more Vehicles | 91 (13.6%) | 40 (6.9%) |
| Total | 667 (100.0%) | 580 (100.0%) |
Commute Time in Pine Hills
The most frequently occuring commute durations in Pine Hills are 10 to 14 minutes (406 commuters, 36.5%), 15 to 19 minutes (359 commuters, 32.3%), and 5 to 9 minutes (105 commuters, 9.5%).
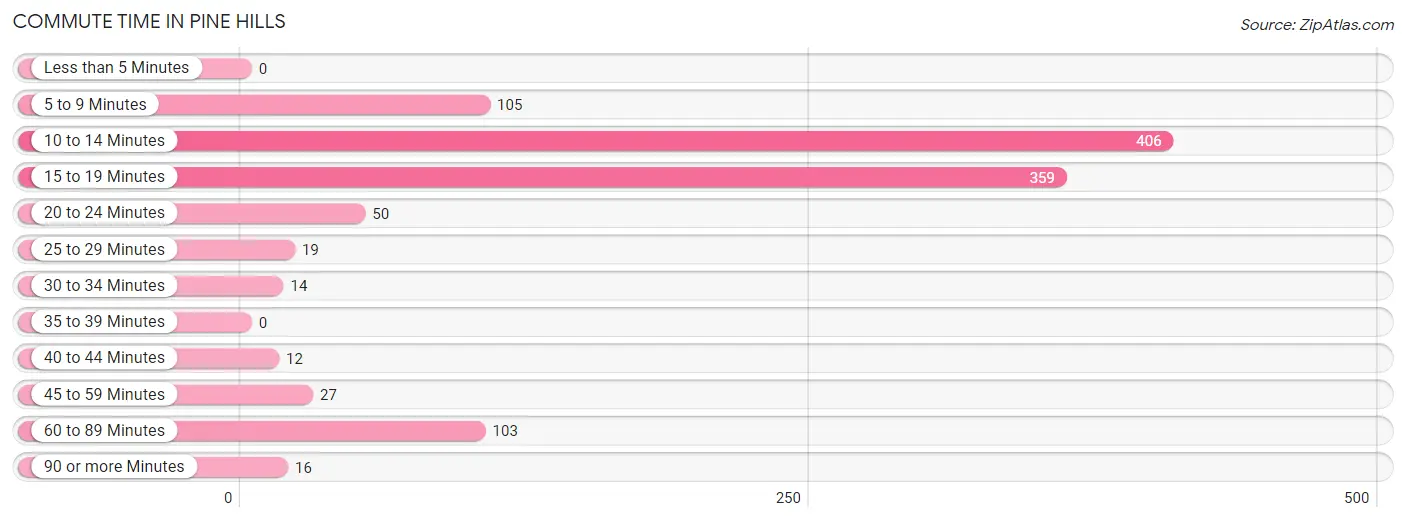
| Commute Time | # Commuters | % Commuters |
| Less than 5 Minutes | 0 | 0.0% |
| 5 to 9 Minutes | 105 | 9.5% |
| 10 to 14 Minutes | 406 | 36.5% |
| 15 to 19 Minutes | 359 | 32.3% |
| 20 to 24 Minutes | 50 | 4.5% |
| 25 to 29 Minutes | 19 | 1.7% |
| 30 to 34 Minutes | 14 | 1.3% |
| 35 to 39 Minutes | 0 | 0.0% |
| 40 to 44 Minutes | 12 | 1.1% |
| 45 to 59 Minutes | 27 | 2.4% |
| 60 to 89 Minutes | 103 | 9.3% |
| 90 or more Minutes | 16 | 1.4% |
Commute Time by Sex in Pine Hills
The most common commute times in Pine Hills are 15 to 19 minutes (229 commuters, 35.9%) for males and 10 to 14 minutes (222 commuters, 46.9%) for females.
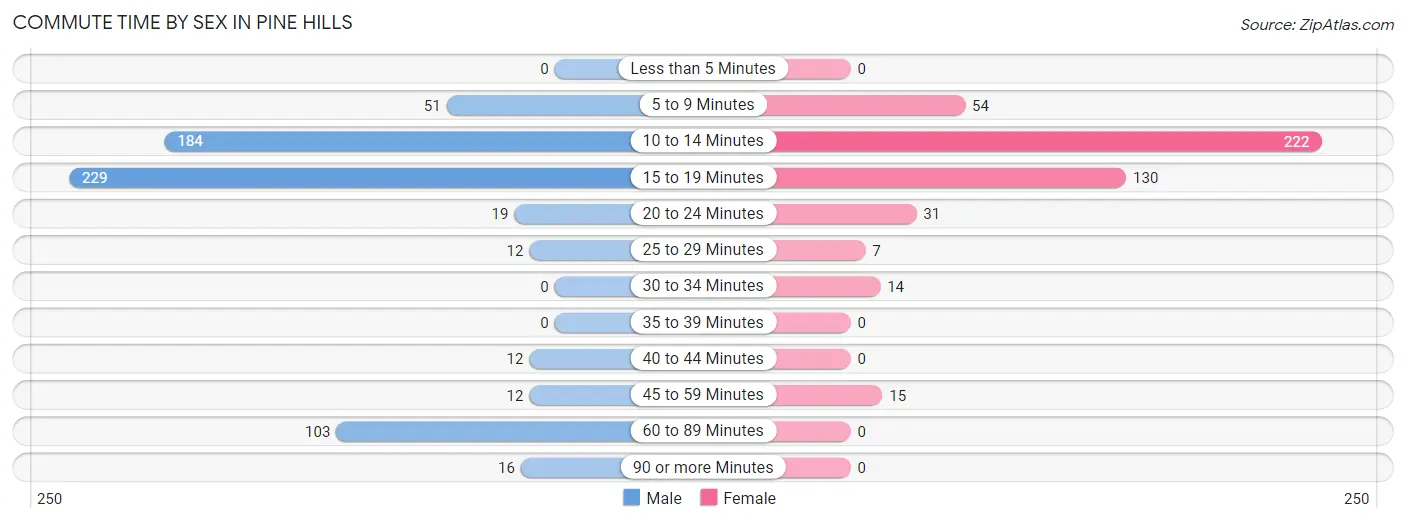
| Commute Time | Male | Female |
| Less than 5 Minutes | 0 (0.0%) | 0 (0.0%) |
| 5 to 9 Minutes | 51 (8.0%) | 54 (11.4%) |
| 10 to 14 Minutes | 184 (28.8%) | 222 (46.9%) |
| 15 to 19 Minutes | 229 (35.9%) | 130 (27.5%) |
| 20 to 24 Minutes | 19 (3.0%) | 31 (6.6%) |
| 25 to 29 Minutes | 12 (1.9%) | 7 (1.5%) |
| 30 to 34 Minutes | 0 (0.0%) | 14 (3.0%) |
| 35 to 39 Minutes | 0 (0.0%) | 0 (0.0%) |
| 40 to 44 Minutes | 12 (1.9%) | 0 (0.0%) |
| 45 to 59 Minutes | 12 (1.9%) | 15 (3.2%) |
| 60 to 89 Minutes | 103 (16.1%) | 0 (0.0%) |
| 90 or more Minutes | 16 (2.5%) | 0 (0.0%) |
Time of Departure to Work by Sex in Pine Hills
The most frequent times of departure to work in Pine Hills are 6:00 AM to 6:29 AM (174, 27.3%) for males and 8:00 AM to 8:29 AM (143, 30.2%) for females.
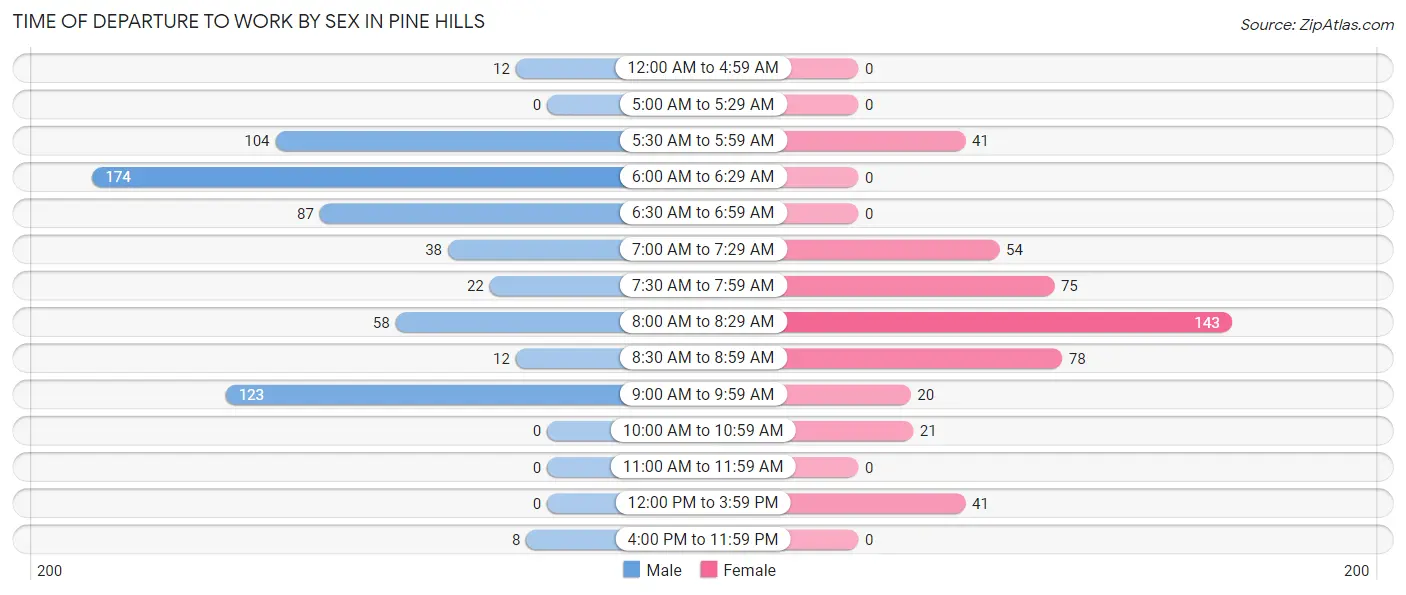
| Time of Departure | Male | Female |
| 12:00 AM to 4:59 AM | 12 (1.9%) | 0 (0.0%) |
| 5:00 AM to 5:29 AM | 0 (0.0%) | 0 (0.0%) |
| 5:30 AM to 5:59 AM | 104 (16.3%) | 41 (8.7%) |
| 6:00 AM to 6:29 AM | 174 (27.3%) | 0 (0.0%) |
| 6:30 AM to 6:59 AM | 87 (13.6%) | 0 (0.0%) |
| 7:00 AM to 7:29 AM | 38 (6.0%) | 54 (11.4%) |
| 7:30 AM to 7:59 AM | 22 (3.5%) | 75 (15.9%) |
| 8:00 AM to 8:29 AM | 58 (9.1%) | 143 (30.2%) |
| 8:30 AM to 8:59 AM | 12 (1.9%) | 78 (16.5%) |
| 9:00 AM to 9:59 AM | 123 (19.3%) | 20 (4.2%) |
| 10:00 AM to 10:59 AM | 0 (0.0%) | 21 (4.4%) |
| 11:00 AM to 11:59 AM | 0 (0.0%) | 0 (0.0%) |
| 12:00 PM to 3:59 PM | 0 (0.0%) | 41 (8.7%) |
| 4:00 PM to 11:59 PM | 8 (1.3%) | 0 (0.0%) |
| Total | 638 (100.0%) | 473 (100.0%) |
Housing Occupancy in Pine Hills
Occupancy by Ownership in Pine Hills
Of the total 1,228 dwellings in Pine Hills, owner-occupied units account for 1,048 (85.3%), while renter-occupied units make up 180 (14.7%).
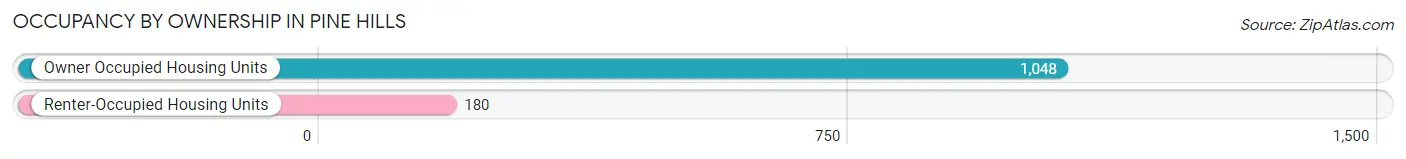
| Occupancy | # Housing Units | % Housing Units |
| Owner Occupied Housing Units | 1,048 | 85.3% |
| Renter-Occupied Housing Units | 180 | 14.7% |
| Total Occupied Housing Units | 1,228 | 100.0% |
Occupancy by Household Size in Pine Hills
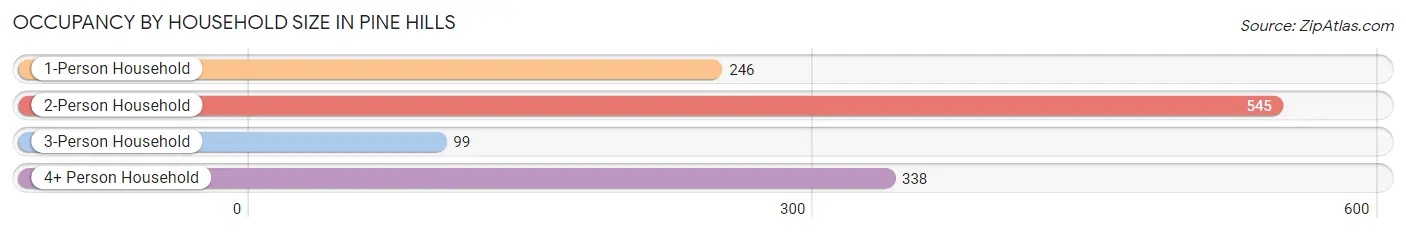
| Household Size | # Housing Units | % Housing Units |
| 1-Person Household | 246 | 20.0% |
| 2-Person Household | 545 | 44.4% |
| 3-Person Household | 99 | 8.1% |
| 4+ Person Household | 338 | 27.5% |
| Total Housing Units | 1,228 | 100.0% |
Occupancy by Ownership by Household Size in Pine Hills
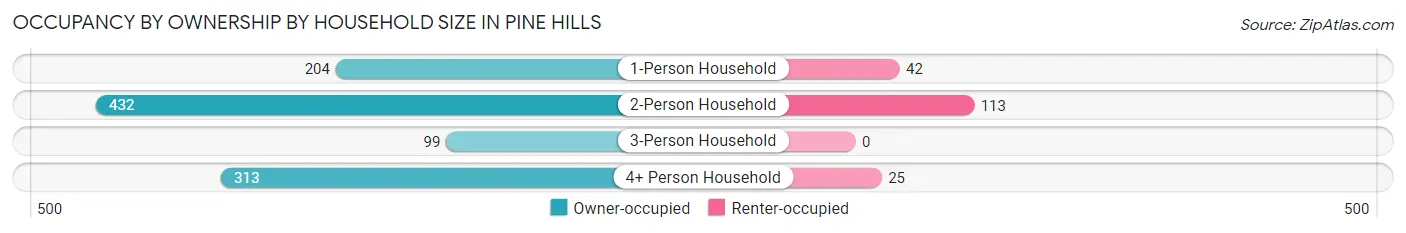
| Household Size | Owner-occupied | Renter-occupied |
| 1-Person Household | 204 (82.9%) | 42 (17.1%) |
| 2-Person Household | 432 (79.3%) | 113 (20.7%) |
| 3-Person Household | 99 (100.0%) | 0 (0.0%) |
| 4+ Person Household | 313 (92.6%) | 25 (7.4%) |
| Total Housing Units | 1,048 (85.3%) | 180 (14.7%) |
Occupancy by Educational Attainment in Pine Hills
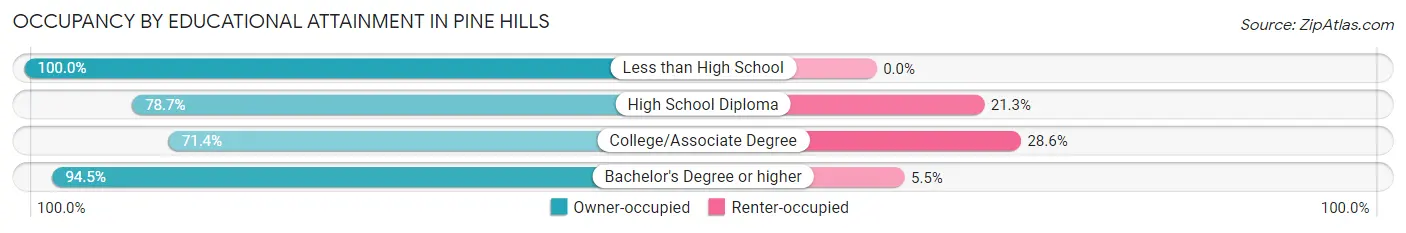
| Household Size | Owner-occupied | Renter-occupied |
| Less than High School | 159 (100.0%) | 0 (0.0%) |
| High School Diploma | 188 (78.7%) | 51 (21.3%) |
| College/Associate Degree | 257 (71.4%) | 103 (28.6%) |
| Bachelor's Degree or higher | 444 (94.5%) | 26 (5.5%) |
Occupancy by Age of Householder in Pine Hills
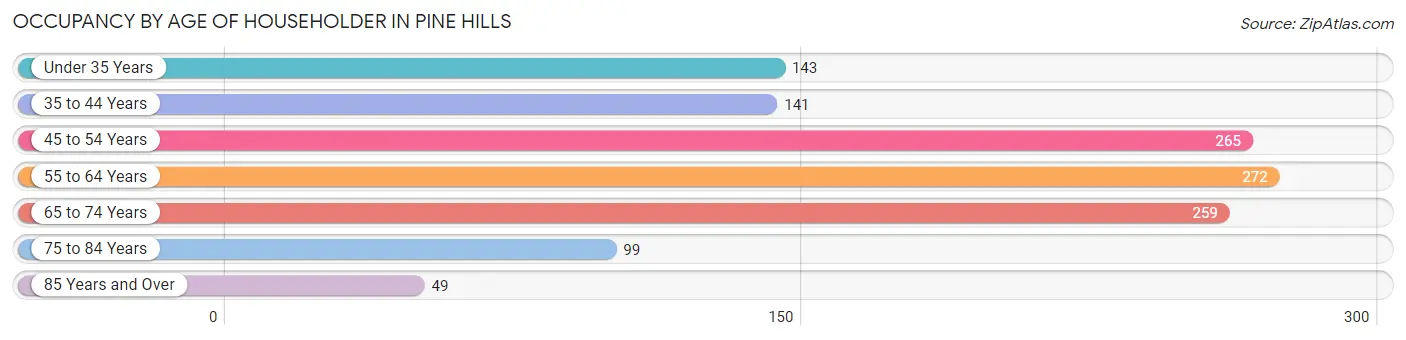
| Age Bracket | # Households | % Households |
| Under 35 Years | 143 | 11.6% |
| 35 to 44 Years | 141 | 11.5% |
| 45 to 54 Years | 265 | 21.6% |
| 55 to 64 Years | 272 | 22.2% |
| 65 to 74 Years | 259 | 21.1% |
| 75 to 84 Years | 99 | 8.1% |
| 85 Years and Over | 49 | 4.0% |
| Total | 1,228 | 100.0% |
Housing Finances in Pine Hills
Median Income by Occupancy in Pine Hills
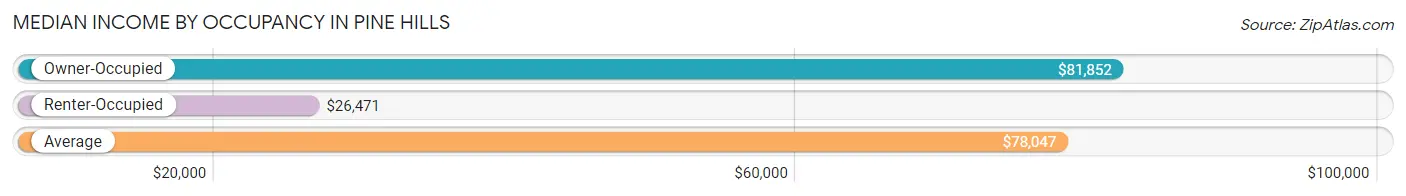
| Occupancy Type | # Households | Median Income |
| Owner-Occupied | 1,048 (85.3%) | $81,852 |
| Renter-Occupied | 180 (14.7%) | $26,471 |
| Average | 1,228 (100.0%) | $78,047 |
Occupancy by Householder Income Bracket in Pine Hills
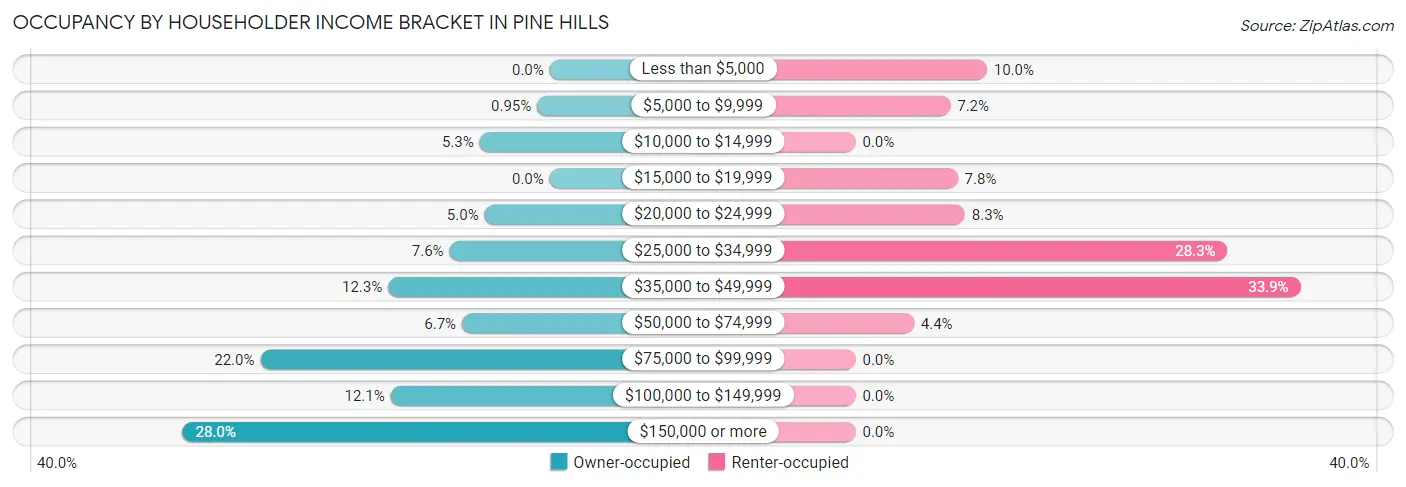
| Income Bracket | Owner-occupied | Renter-occupied |
| Less than $5,000 | 0 (0.0%) | 18 (10.0%) |
| $5,000 to $9,999 | 10 (0.9%) | 13 (7.2%) |
| $10,000 to $14,999 | 56 (5.3%) | 0 (0.0%) |
| $15,000 to $19,999 | 0 (0.0%) | 14 (7.8%) |
| $20,000 to $24,999 | 52 (5.0%) | 15 (8.3%) |
| $25,000 to $34,999 | 80 (7.6%) | 51 (28.3%) |
| $35,000 to $49,999 | 129 (12.3%) | 61 (33.9%) |
| $50,000 to $74,999 | 70 (6.7%) | 8 (4.4%) |
| $75,000 to $99,999 | 231 (22.0%) | 0 (0.0%) |
| $100,000 to $149,999 | 127 (12.1%) | 0 (0.0%) |
| $150,000 or more | 293 (28.0%) | 0 (0.0%) |
| Total | 1,048 (100.0%) | 180 (100.0%) |
Monthly Housing Cost Tiers in Pine Hills
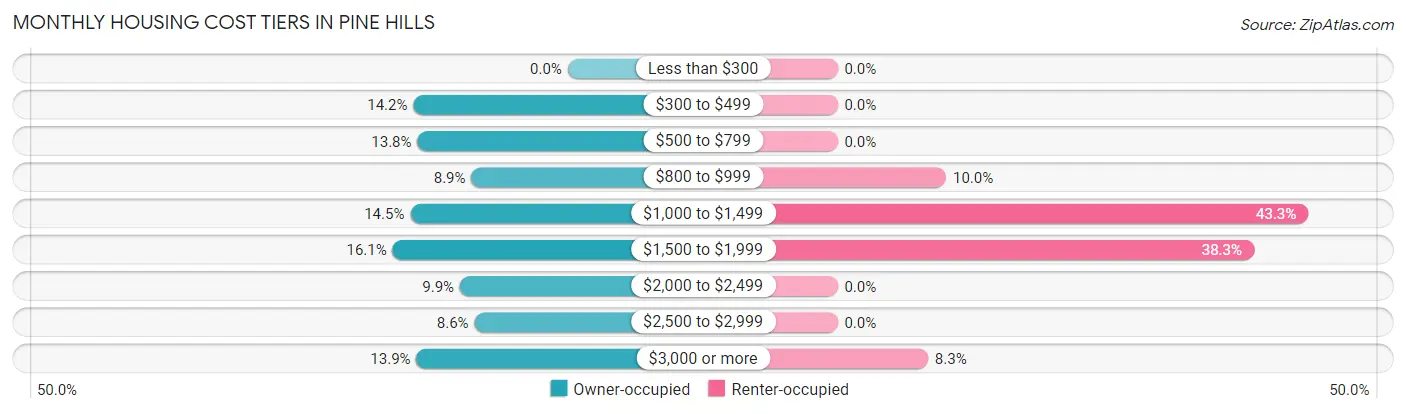
| Monthly Cost | Owner-occupied | Renter-occupied |
| Less than $300 | 0 (0.0%) | 0 (0.0%) |
| $300 to $499 | 149 (14.2%) | 0 (0.0%) |
| $500 to $799 | 145 (13.8%) | 0 (0.0%) |
| $800 to $999 | 93 (8.9%) | 18 (10.0%) |
| $1,000 to $1,499 | 152 (14.5%) | 78 (43.3%) |
| $1,500 to $1,999 | 169 (16.1%) | 69 (38.3%) |
| $2,000 to $2,499 | 104 (9.9%) | 0 (0.0%) |
| $2,500 to $2,999 | 90 (8.6%) | 0 (0.0%) |
| $3,000 or more | 146 (13.9%) | 15 (8.3%) |
| Total | 1,048 (100.0%) | 180 (100.0%) |
Physical Housing Characteristics in Pine Hills
Housing Structures in Pine Hills
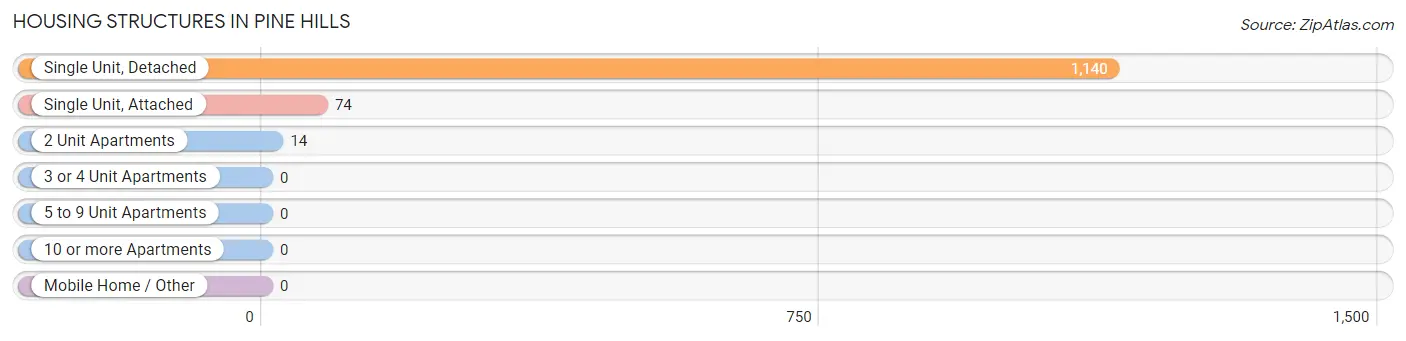
| Structure Type | # Housing Units | % Housing Units |
| Single Unit, Detached | 1,140 | 92.8% |
| Single Unit, Attached | 74 | 6.0% |
| 2 Unit Apartments | 14 | 1.1% |
| 3 or 4 Unit Apartments | 0 | 0.0% |
| 5 to 9 Unit Apartments | 0 | 0.0% |
| 10 or more Apartments | 0 | 0.0% |
| Mobile Home / Other | 0 | 0.0% |
| Total | 1,228 | 100.0% |
Housing Structures by Occupancy in Pine Hills
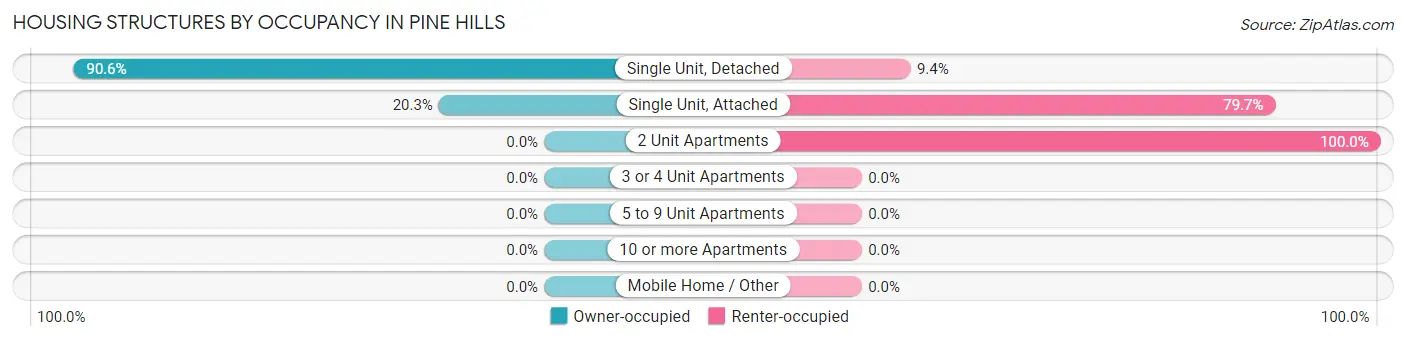
| Structure Type | Owner-occupied | Renter-occupied |
| Single Unit, Detached | 1,033 (90.6%) | 107 (9.4%) |
| Single Unit, Attached | 15 (20.3%) | 59 (79.7%) |
| 2 Unit Apartments | 0 (0.0%) | 14 (100.0%) |
| 3 or 4 Unit Apartments | 0 (0.0%) | 0 (0.0%) |
| 5 to 9 Unit Apartments | 0 (0.0%) | 0 (0.0%) |
| 10 or more Apartments | 0 (0.0%) | 0 (0.0%) |
| Mobile Home / Other | 0 (0.0%) | 0 (0.0%) |
| Total | 1,048 (85.3%) | 180 (14.7%) |
Housing Structures by Number of Rooms in Pine Hills
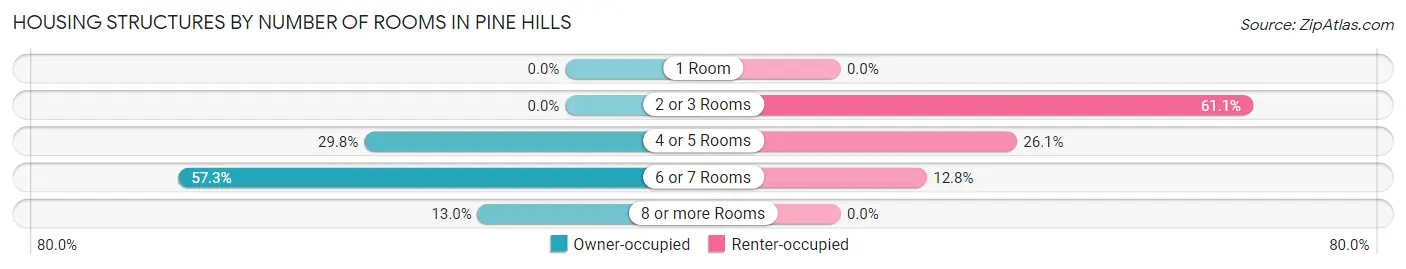
| Number of Rooms | Owner-occupied | Renter-occupied |
| 1 Room | 0 (0.0%) | 0 (0.0%) |
| 2 or 3 Rooms | 0 (0.0%) | 110 (61.1%) |
| 4 or 5 Rooms | 312 (29.8%) | 47 (26.1%) |
| 6 or 7 Rooms | 600 (57.3%) | 23 (12.8%) |
| 8 or more Rooms | 136 (13.0%) | 0 (0.0%) |
| Total | 1,048 (100.0%) | 180 (100.0%) |
Housing Structure by Heating Type in Pine Hills
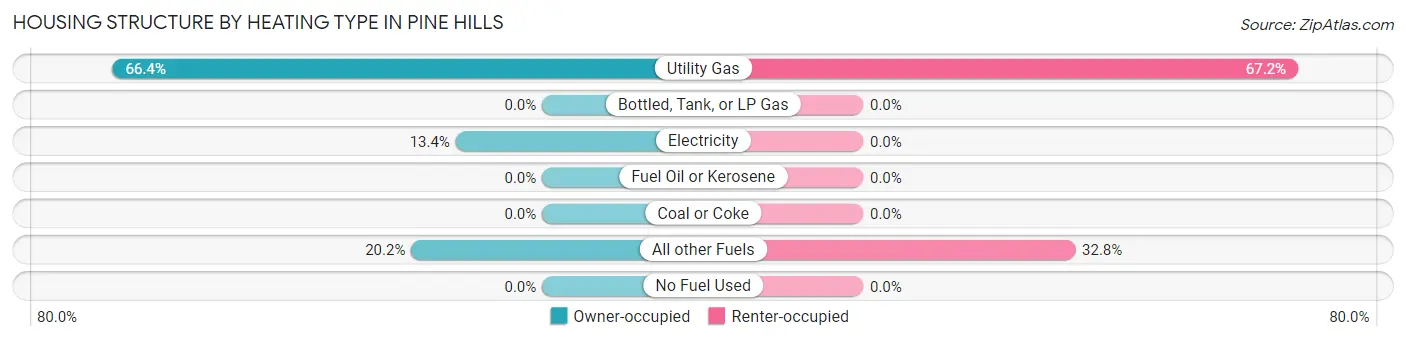
| Heating Type | Owner-occupied | Renter-occupied |
| Utility Gas | 696 (66.4%) | 121 (67.2%) |
| Bottled, Tank, or LP Gas | 0 (0.0%) | 0 (0.0%) |
| Electricity | 140 (13.4%) | 0 (0.0%) |
| Fuel Oil or Kerosene | 0 (0.0%) | 0 (0.0%) |
| Coal or Coke | 0 (0.0%) | 0 (0.0%) |
| All other Fuels | 212 (20.2%) | 59 (32.8%) |
| No Fuel Used | 0 (0.0%) | 0 (0.0%) |
| Total | 1,048 (100.0%) | 180 (100.0%) |
Household Vehicle Usage in Pine Hills
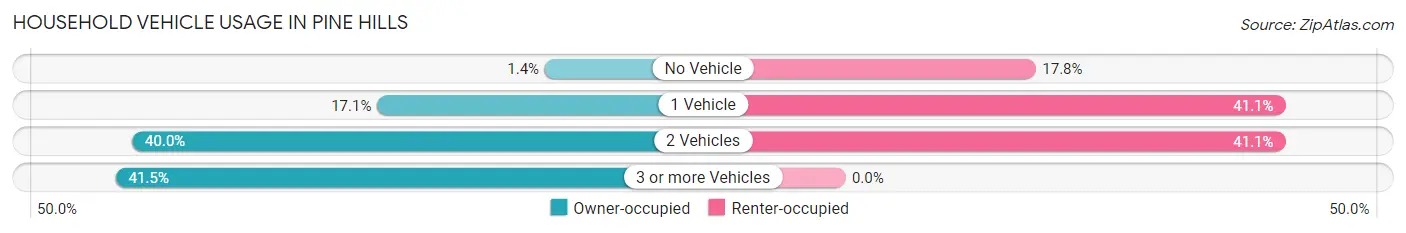
| Vehicles per Household | Owner-occupied | Renter-occupied |
| No Vehicle | 15 (1.4%) | 32 (17.8%) |
| 1 Vehicle | 179 (17.1%) | 74 (41.1%) |
| 2 Vehicles | 419 (40.0%) | 74 (41.1%) |
| 3 or more Vehicles | 435 (41.5%) | 0 (0.0%) |
| Total | 1,048 (100.0%) | 180 (100.0%) |
Real Estate & Mortgages in Pine Hills
Real Estate and Mortgage Overview in Pine Hills
| Characteristic | Without Mortgage | With Mortgage |
| Housing Units | 458 | 590 |
| Median Property Value | $423,400 | $409,500 |
| Median Household Income | $74,355 | $190 |
| Monthly Housing Costs | $649 | $146 |
| Real Estate Taxes | $2,627 | $0 |
Property Value by Mortgage Status in Pine Hills
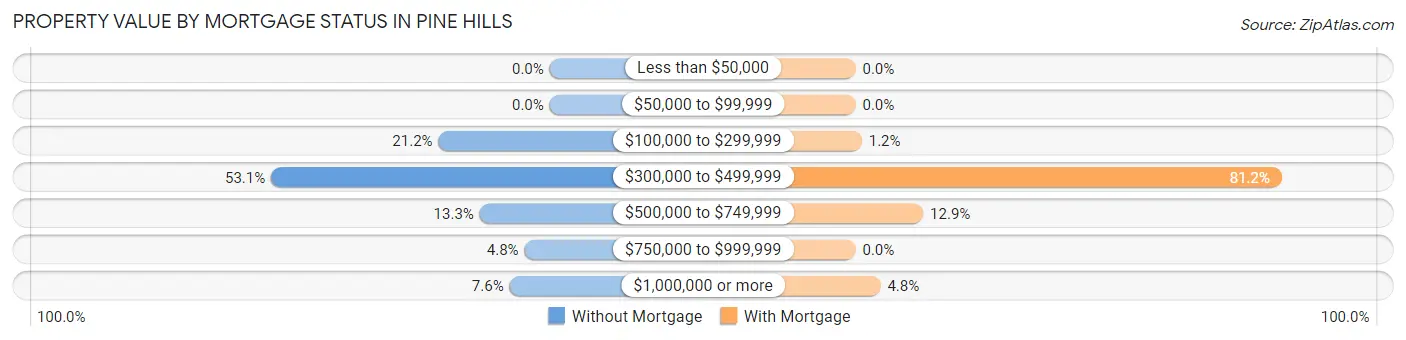
| Property Value | Without Mortgage | With Mortgage |
| Less than $50,000 | 0 (0.0%) | 0 (0.0%) |
| $50,000 to $99,999 | 0 (0.0%) | 0 (0.0%) |
| $100,000 to $299,999 | 97 (21.2%) | 7 (1.2%) |
| $300,000 to $499,999 | 243 (53.1%) | 479 (81.2%) |
| $500,000 to $749,999 | 61 (13.3%) | 76 (12.9%) |
| $750,000 to $999,999 | 22 (4.8%) | 0 (0.0%) |
| $1,000,000 or more | 35 (7.6%) | 28 (4.8%) |
| Total | 458 (100.0%) | 590 (100.0%) |
Household Income by Mortgage Status in Pine Hills
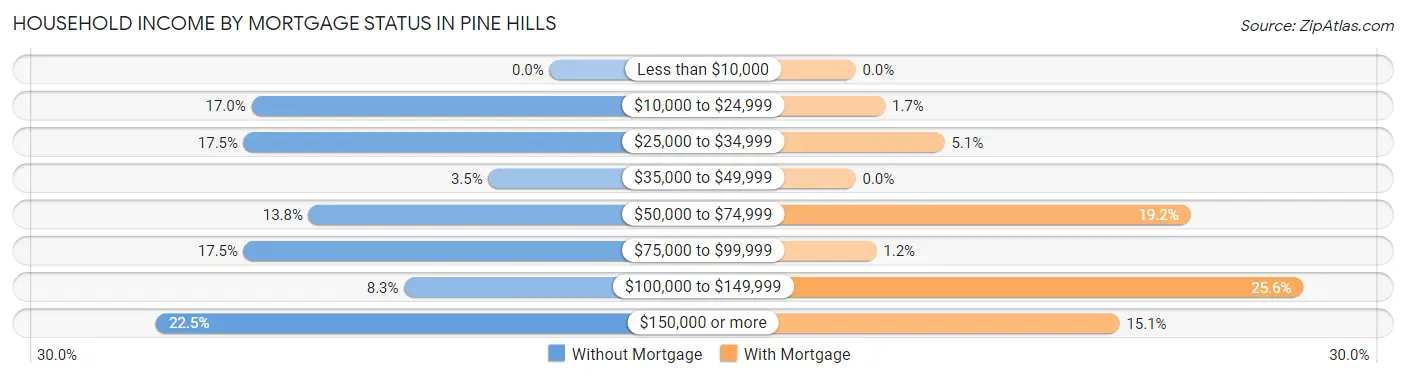
| Household Income | Without Mortgage | With Mortgage |
| Less than $10,000 | 0 (0.0%) | 0 (0.0%) |
| $10,000 to $24,999 | 78 (17.0%) | 10 (1.7%) |
| $25,000 to $34,999 | 80 (17.5%) | 30 (5.1%) |
| $35,000 to $49,999 | 16 (3.5%) | 0 (0.0%) |
| $50,000 to $74,999 | 63 (13.8%) | 113 (19.2%) |
| $75,000 to $99,999 | 80 (17.5%) | 7 (1.2%) |
| $100,000 to $149,999 | 38 (8.3%) | 151 (25.6%) |
| $150,000 or more | 103 (22.5%) | 89 (15.1%) |
| Total | 458 (100.0%) | 590 (100.0%) |
Property Value to Household Income Ratio in Pine Hills
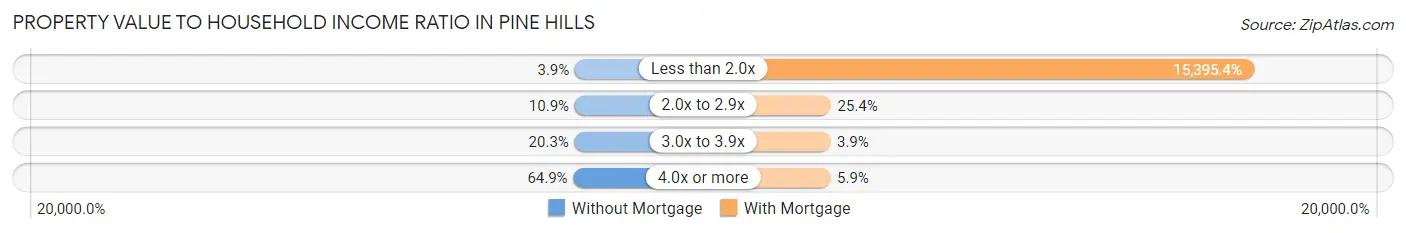
| Value-to-Income Ratio | Without Mortgage | With Mortgage |
| Less than 2.0x | 18 (3.9%) | 90,833 (15,395.4%) |
| 2.0x to 2.9x | 50 (10.9%) | 150 (25.4%) |
| 3.0x to 3.9x | 93 (20.3%) | 23 (3.9%) |
| 4.0x or more | 297 (64.8%) | 35 (5.9%) |
| Total | 458 (100.0%) | 590 (100.0%) |
Real Estate Taxes by Mortgage Status in Pine Hills
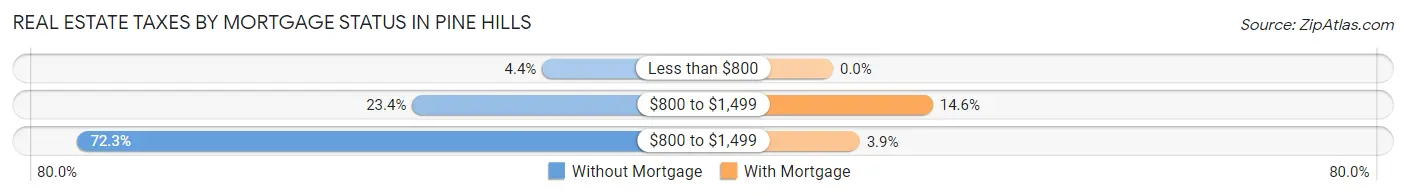
| Property Taxes | Without Mortgage | With Mortgage |
| Less than $800 | 20 (4.4%) | 0 (0.0%) |
| $800 to $1,499 | 107 (23.4%) | 86 (14.6%) |
| $800 to $1,499 | 331 (72.3%) | 23 (3.9%) |
| Total | 458 (100.0%) | 590 (100.0%) |
Health & Disability in Pine Hills
Health Insurance Coverage by Age in Pine Hills
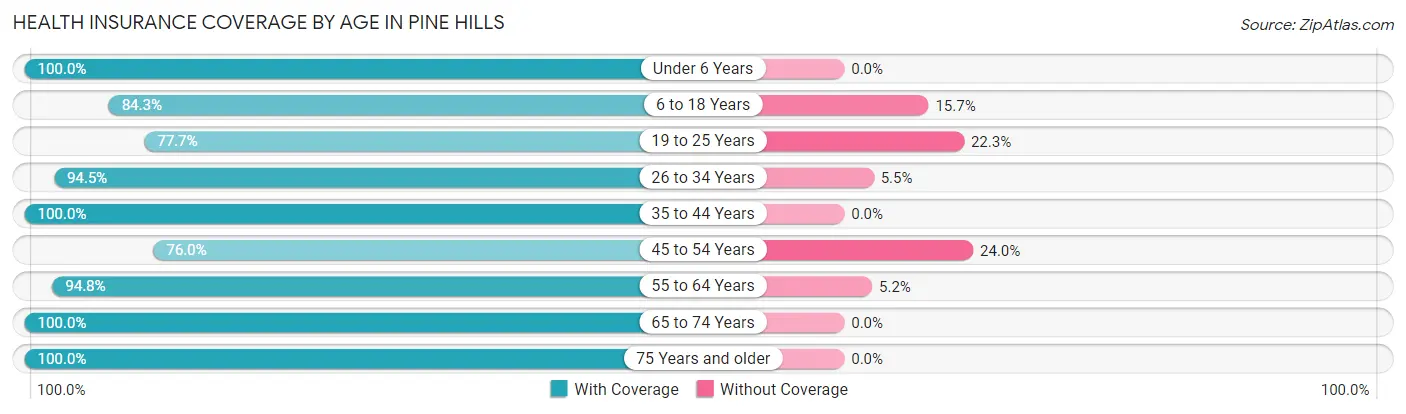
| Age Bracket | With Coverage | Without Coverage |
| Under 6 Years | 118 (100.0%) | 0 (0.0%) |
| 6 to 18 Years | 596 (84.3%) | 111 (15.7%) |
| 19 to 25 Years | 87 (77.7%) | 25 (22.3%) |
| 26 to 34 Years | 362 (94.5%) | 21 (5.5%) |
| 35 to 44 Years | 302 (100.0%) | 0 (0.0%) |
| 45 to 54 Years | 310 (76.0%) | 98 (24.0%) |
| 55 to 64 Years | 494 (94.8%) | 27 (5.2%) |
| 65 to 74 Years | 493 (100.0%) | 0 (0.0%) |
| 75 Years and older | 463 (100.0%) | 0 (0.0%) |
| Total | 3,225 (92.0%) | 282 (8.0%) |
Health Insurance Coverage by Citizenship Status in Pine Hills
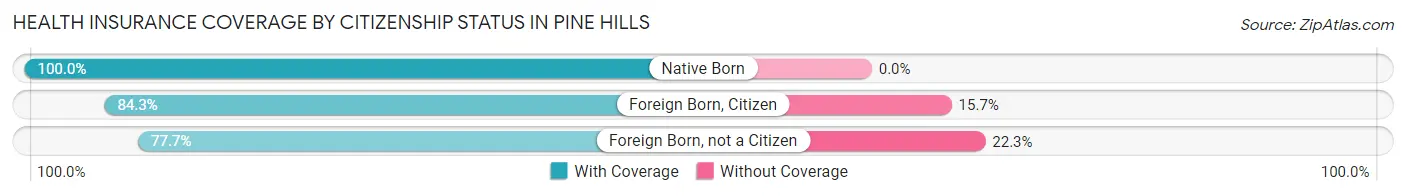
| Citizenship Status | With Coverage | Without Coverage |
| Native Born | 118 (100.0%) | 0 (0.0%) |
| Foreign Born, Citizen | 596 (84.3%) | 111 (15.7%) |
| Foreign Born, not a Citizen | 87 (77.7%) | 25 (22.3%) |
Health Insurance Coverage by Household Income in Pine Hills
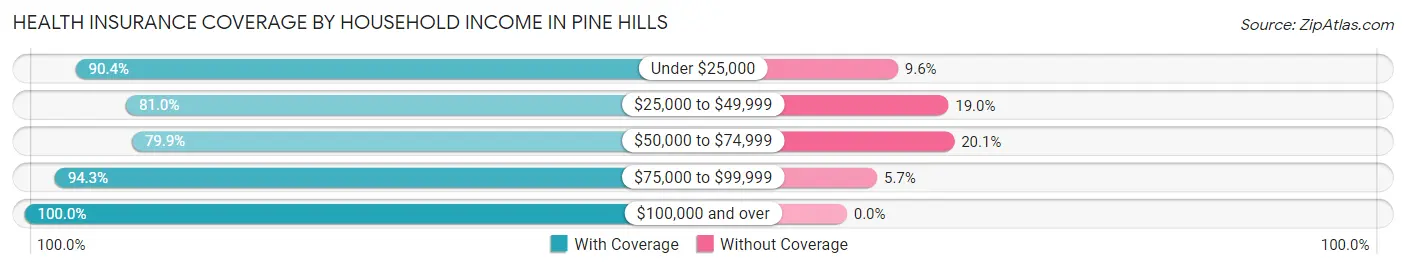
| Household Income | With Coverage | Without Coverage |
| Under $25,000 | 359 (90.4%) | 38 (9.6%) |
| $25,000 to $49,999 | 737 (81.0%) | 173 (19.0%) |
| $50,000 to $74,999 | 135 (79.9%) | 34 (20.1%) |
| $75,000 to $99,999 | 566 (94.3%) | 34 (5.7%) |
| $100,000 and over | 1,396 (100.0%) | 0 (0.0%) |
Public vs Private Health Insurance Coverage by Age in Pine Hills
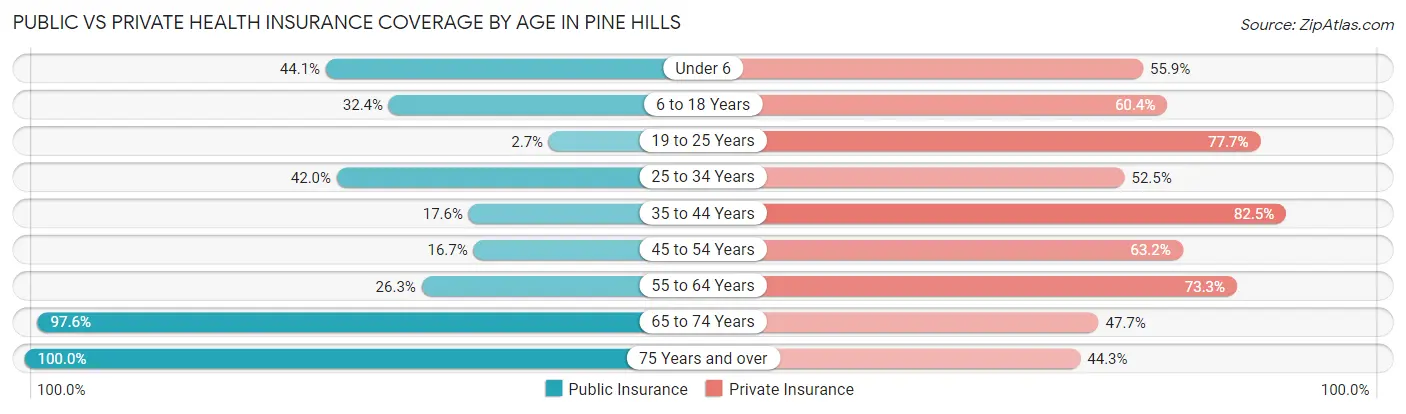
| Age Bracket | Public Insurance | Private Insurance |
| Under 6 | 52 (44.1%) | 66 (55.9%) |
| 6 to 18 Years | 229 (32.4%) | 427 (60.4%) |
| 19 to 25 Years | 3 (2.7%) | 87 (77.7%) |
| 25 to 34 Years | 161 (42.0%) | 201 (52.5%) |
| 35 to 44 Years | 53 (17.5%) | 249 (82.5%) |
| 45 to 54 Years | 68 (16.7%) | 258 (63.2%) |
| 55 to 64 Years | 137 (26.3%) | 382 (73.3%) |
| 65 to 74 Years | 481 (97.6%) | 235 (47.7%) |
| 75 Years and over | 463 (100.0%) | 205 (44.3%) |
| Total | 1,647 (47.0%) | 2,110 (60.2%) |
Disability Status by Sex by Age in Pine Hills
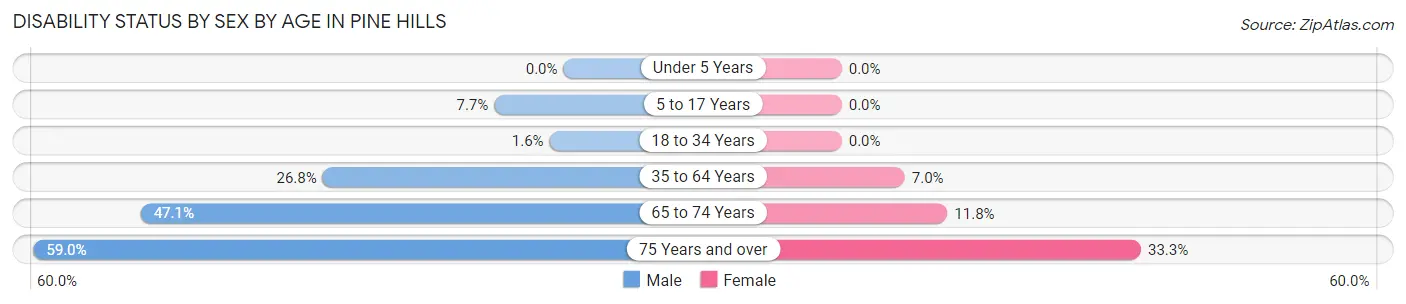
| Age Bracket | Male | Female |
| Under 5 Years | 0 (0.0%) | 0 (0.0%) |
| 5 to 17 Years | 29 (7.7%) | 0 (0.0%) |
| 18 to 34 Years | 3 (1.5%) | 0 (0.0%) |
| 35 to 64 Years | 162 (26.8%) | 44 (7.0%) |
| 65 to 74 Years | 120 (47.1%) | 28 (11.8%) |
| 75 Years and over | 121 (59.0%) | 86 (33.3%) |
Disability Class by Sex by Age in Pine Hills
Disability Class: Hearing Difficulty
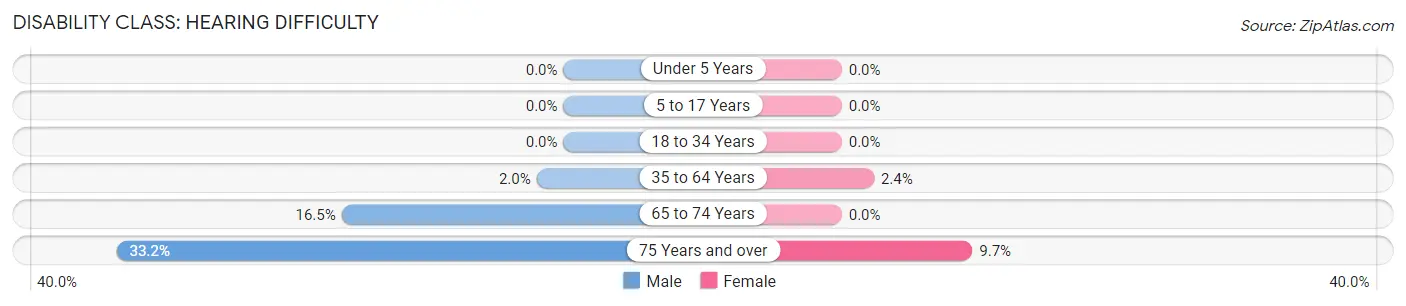
| Age Bracket | Male | Female |
| Under 5 Years | 0 (0.0%) | 0 (0.0%) |
| 5 to 17 Years | 0 (0.0%) | 0 (0.0%) |
| 18 to 34 Years | 0 (0.0%) | 0 (0.0%) |
| 35 to 64 Years | 12 (2.0%) | 15 (2.4%) |
| 65 to 74 Years | 42 (16.5%) | 0 (0.0%) |
| 75 Years and over | 68 (33.2%) | 25 (9.7%) |
Disability Class: Vision Difficulty
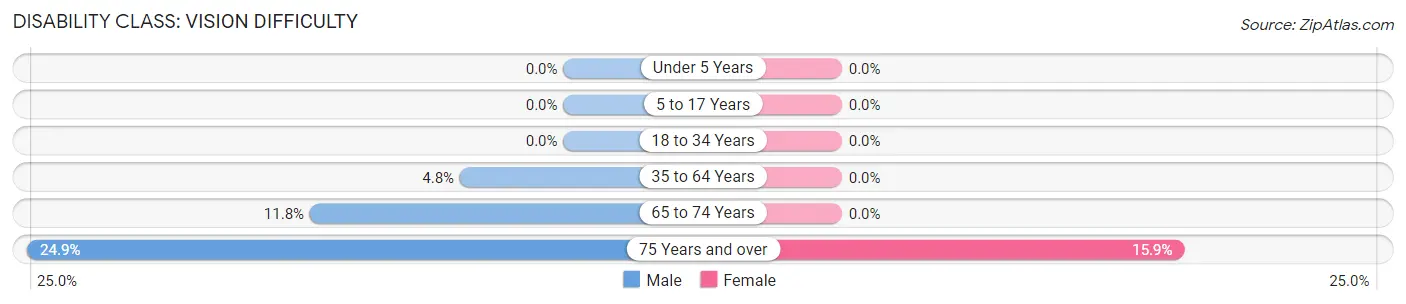
| Age Bracket | Male | Female |
| Under 5 Years | 0 (0.0%) | 0 (0.0%) |
| 5 to 17 Years | 0 (0.0%) | 0 (0.0%) |
| 18 to 34 Years | 0 (0.0%) | 0 (0.0%) |
| 35 to 64 Years | 29 (4.8%) | 0 (0.0%) |
| 65 to 74 Years | 30 (11.8%) | 0 (0.0%) |
| 75 Years and over | 51 (24.9%) | 41 (15.9%) |
Disability Class: Cognitive Difficulty
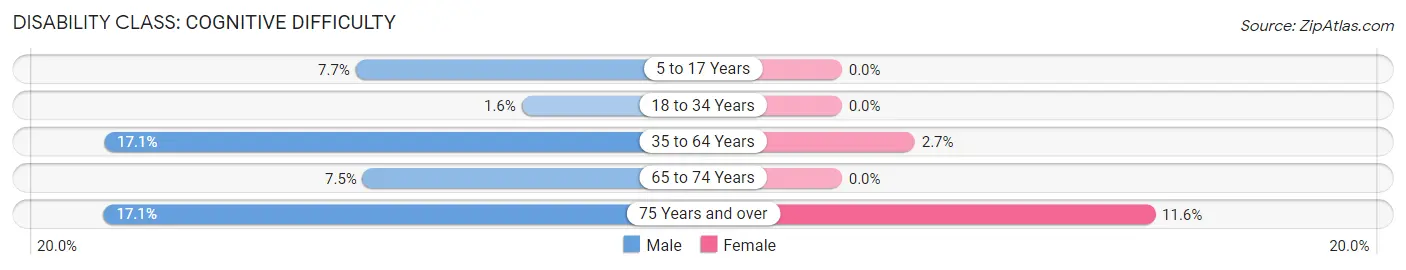
| Age Bracket | Male | Female |
| 5 to 17 Years | 29 (7.7%) | 0 (0.0%) |
| 18 to 34 Years | 3 (1.5%) | 0 (0.0%) |
| 35 to 64 Years | 103 (17.1%) | 17 (2.7%) |
| 65 to 74 Years | 19 (7.4%) | 0 (0.0%) |
| 75 Years and over | 35 (17.1%) | 30 (11.6%) |
Disability Class: Ambulatory Difficulty
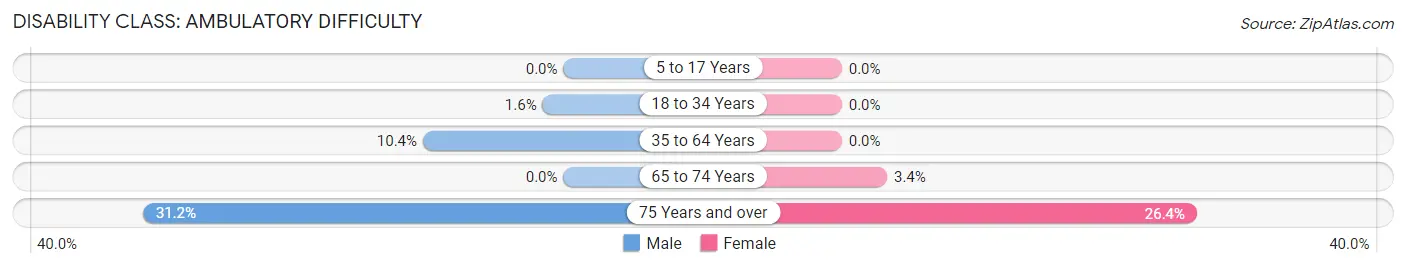
| Age Bracket | Male | Female |
| 5 to 17 Years | 0 (0.0%) | 0 (0.0%) |
| 18 to 34 Years | 3 (1.5%) | 0 (0.0%) |
| 35 to 64 Years | 63 (10.4%) | 0 (0.0%) |
| 65 to 74 Years | 0 (0.0%) | 8 (3.4%) |
| 75 Years and over | 64 (31.2%) | 68 (26.4%) |
Disability Class: Self-Care Difficulty
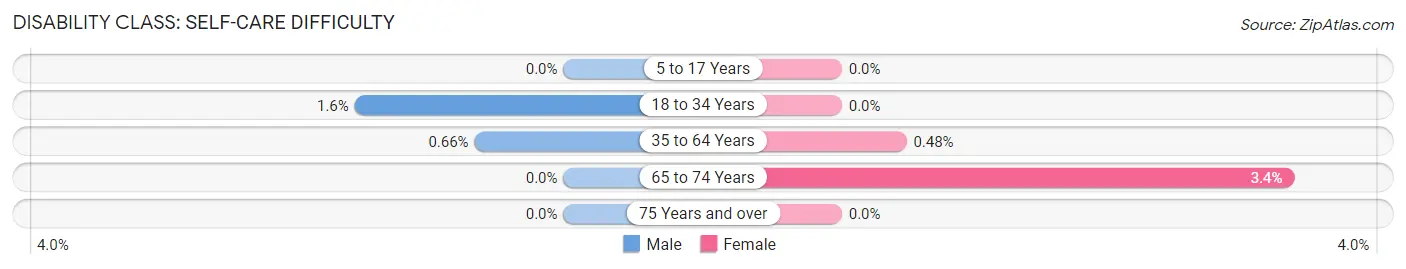
| Age Bracket | Male | Female |
| 5 to 17 Years | 0 (0.0%) | 0 (0.0%) |
| 18 to 34 Years | 3 (1.5%) | 0 (0.0%) |
| 35 to 64 Years | 4 (0.7%) | 3 (0.5%) |
| 65 to 74 Years | 0 (0.0%) | 8 (3.4%) |
| 75 Years and over | 0 (0.0%) | 0 (0.0%) |
Technology Access in Pine Hills
Computing Device Access in Pine Hills
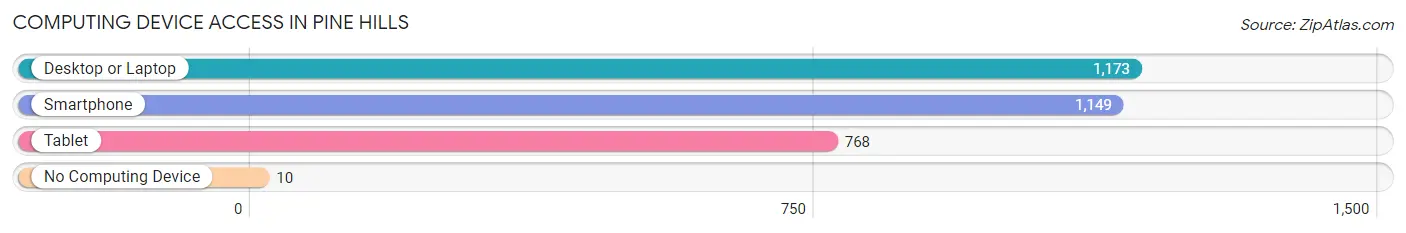
| Device Type | # Households | % Households |
| Desktop or Laptop | 1,173 | 95.5% |
| Smartphone | 1,149 | 93.6% |
| Tablet | 768 | 62.5% |
| No Computing Device | 10 | 0.8% |
| Total | 1,228 | 100.0% |
Internet Access in Pine Hills
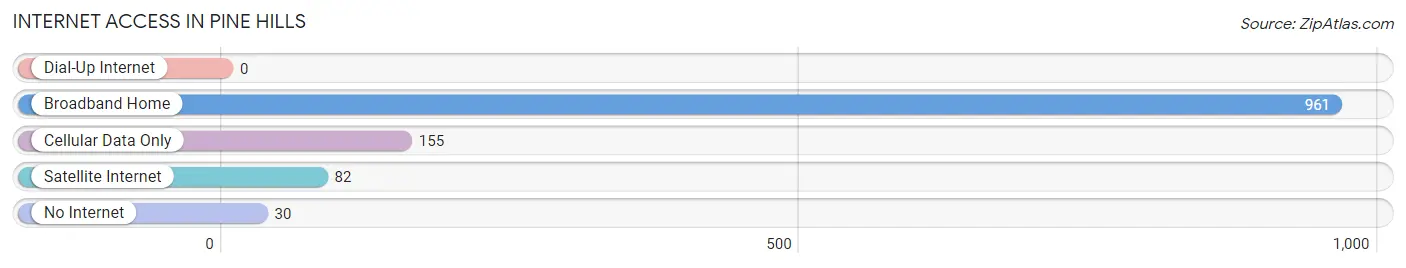
| Internet Type | # Households | % Households |
| Dial-Up Internet | 0 | 0.0% |
| Broadband Home | 961 | 78.3% |
| Cellular Data Only | 155 | 12.6% |
| Satellite Internet | 82 | 6.7% |
| No Internet | 30 | 2.4% |
| Total | 1,228 | 100.0% |
Pine Hills Summary
Pine Hills is a small unincorporated community located in the Sierra Nevada foothills of El Dorado County, California. It is situated in the western part of the county, approximately 25 miles east of Placerville and 40 miles northeast of Sacramento. The community is located in the foothills of the Sierra Nevada Mountains, at an elevation of 2,400 feet.
History
The area now known as Pine Hills was originally inhabited by the Miwok and Maidu Native American tribes. The first European settlers arrived in the area in the mid-1800s, and the community was officially established in 1854. The town was named after the abundance of pine trees in the area.
In the late 1800s, the area was a popular destination for gold miners, and the town grew rapidly. By the early 1900s, the town had a post office, a general store, a school, and several churches.
Geography
Pine Hills is located in the western part of El Dorado County, approximately 25 miles east of Placerville and 40 miles northeast of Sacramento. The community is situated in the foothills of the Sierra Nevada Mountains, at an elevation of 2,400 feet. The area is characterized by rolling hills, dense forests, and numerous creeks and streams.
The climate in Pine Hills is mild and temperate, with hot summers and cool winters. The average annual temperature is around 60 degrees Fahrenheit, and the average annual precipitation is around 30 inches.
Economy
The economy of Pine Hills is largely based on tourism and recreation. The area is a popular destination for outdoor activities such as camping, fishing, hiking, and mountain biking. The nearby El Dorado National Forest provides a variety of recreational opportunities, including camping, fishing, and hunting.
The town also has a few small businesses, including a general store, a cafe, and a few restaurants. The town is also home to a few wineries and vineyards, which produce a variety of wines.
Demographics
As of the 2010 census, the population of Pine Hills was 1,845. The racial makeup of the town was 94.3% White, 0.7% African American, 0.7% Native American, 0.7% Asian, 0.2% Pacific Islander, and 2.6% from other races. The median household income was $50,000, and the median age was 44.
Conclusion
Pine Hills is a small unincorporated community located in the Sierra Nevada foothills of El Dorado County, California. It is situated in the western part of the county, approximately 25 miles east of Placerville and 40 miles northeast of Sacramento. The community is located in the foothills of the Sierra Nevada Mountains, at an elevation of 2,400 feet. The area is characterized by rolling hills, dense forests, and numerous creeks and streams. The economy of Pine Hills is largely based on tourism and recreation, and the town is home to a few small businesses. As of the 2010 census, the population of Pine Hills was 1,845. The racial makeup of the town was 94.3% White, 0.7% African American, 0.7% Native American, 0.7% Asian, 0.2% Pacific Islander, and 2.6% from other races. The median household income was $50,000, and the median age was 44.
Common Questions
What is Per Capita Income in Pine Hills?
Per Capita income in Pine Hills is $36,055.
What is the Median Family Income in Pine Hills?
Median Family Income in Pine Hills is $81,435.
What is the Median Household income in Pine Hills?
Median Household Income in Pine Hills is $78,047.
What is Income or Wage Gap in Pine Hills?
Income or Wage Gap in Pine Hills is 54.3%.
Women in Pine Hills earn 45.7 cents for every dollar earned by a man.
What is Inequality or Gini Index in Pine Hills?
Inequality or Gini Index in Pine Hills is 0.48.
What is the Total Population of Pine Hills?
Total Population of Pine Hills is 3,508.
What is the Total Male Population of Pine Hills?
Total Male Population of Pine Hills is 1,679.
What is the Total Female Population of Pine Hills?
Total Female Population of Pine Hills is 1,829.
What is the Ratio of Males per 100 Females in Pine Hills?
There are 91.80 Males per 100 Females in Pine Hills.
What is the Ratio of Females per 100 Males in Pine Hills?
There are 108.93 Females per 100 Males in Pine Hills.
What is the Median Population Age in Pine Hills?
Median Population Age in Pine Hills is 47.8 Years.
What is the Average Family Size in Pine Hills
Average Family Size in Pine Hills is 3.1 People.
What is the Average Household Size in Pine Hills
Average Household Size in Pine Hills is 2.8 People.
How Large is the Labor Force in Pine Hills?
There are 1,369 People in the Labor Forcein in Pine Hills.
What is the Percentage of People in the Labor Force in Pine Hills?
48.6% of People are in the Labor Force in Pine Hills.
What is the Unemployment Rate in Pine Hills?
Unemployment Rate in Pine Hills is 3.6%.