Desert Palms, CA Map & Demographics
Desert Palms Map
Desert Palms Overview
$66,950
PER CAPITA INCOME
$99,042
AVG FAMILY INCOME
$73,697
AVG HOUSEHOLD INCOME
53.3%
WAGE / INCOME GAP [ % ]
46.7¢/ $1
WAGE / INCOME GAP [ $ ]
$8,964
FAMILY INCOME DEFICIT
0.51
INEQUALITY / GINI INDEX
6,414
TOTAL POPULATION
2,893
MALE POPULATION
3,521
FEMALE POPULATION
82.16
MALES / 100 FEMALES
121.71
FEMALES / 100 MALES
76.1
MEDIAN AGE
2.1
AVG FAMILY SIZE
1.7
AVG HOUSEHOLD SIZE
1,152
LABOR FORCE [ PEOPLE ]
18.0%
PERCENT IN LABOR FORCE
6.3%
UNEMPLOYMENT RATE
Income in Desert Palms
Income Overview in Desert Palms
Per Capita Income in Desert Palms is $66,950, while median incomes of families and households are $99,042 and $73,697 respectively.
| Characteristic | Number | Measure |
| Per Capita Income | 6,414 | $66,950 |
| Median Family Income | 2,059 | $99,042 |
| Mean Family Income | 2,059 | $148,666 |
| Median Household Income | 3,749 | $73,697 |
| Mean Household Income | 3,749 | $112,271 |
| Income Deficit | 2,059 | $8,964 |
| Wage / Income Gap (%) | 6,414 | 53.26% |
| Wage / Income Gap ($) | 6,414 | 46.74¢ per $1 |
| Gini / Inequality Index | 6,414 | 0.51 |
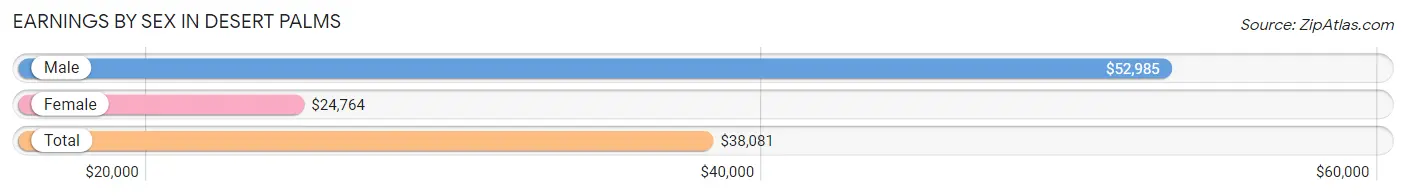
Earnings by Sex in Desert Palms
Average Earnings in Desert Palms are $38,081, $52,985 for men and $24,764 for women, a difference of 53.3%.
| Sex | Number | Average Earnings |
| Male | 669 (50.2%) | $52,985 |
| Female | 663 (49.8%) | $24,764 |
| Total | 1,332 (100.0%) | $38,081 |
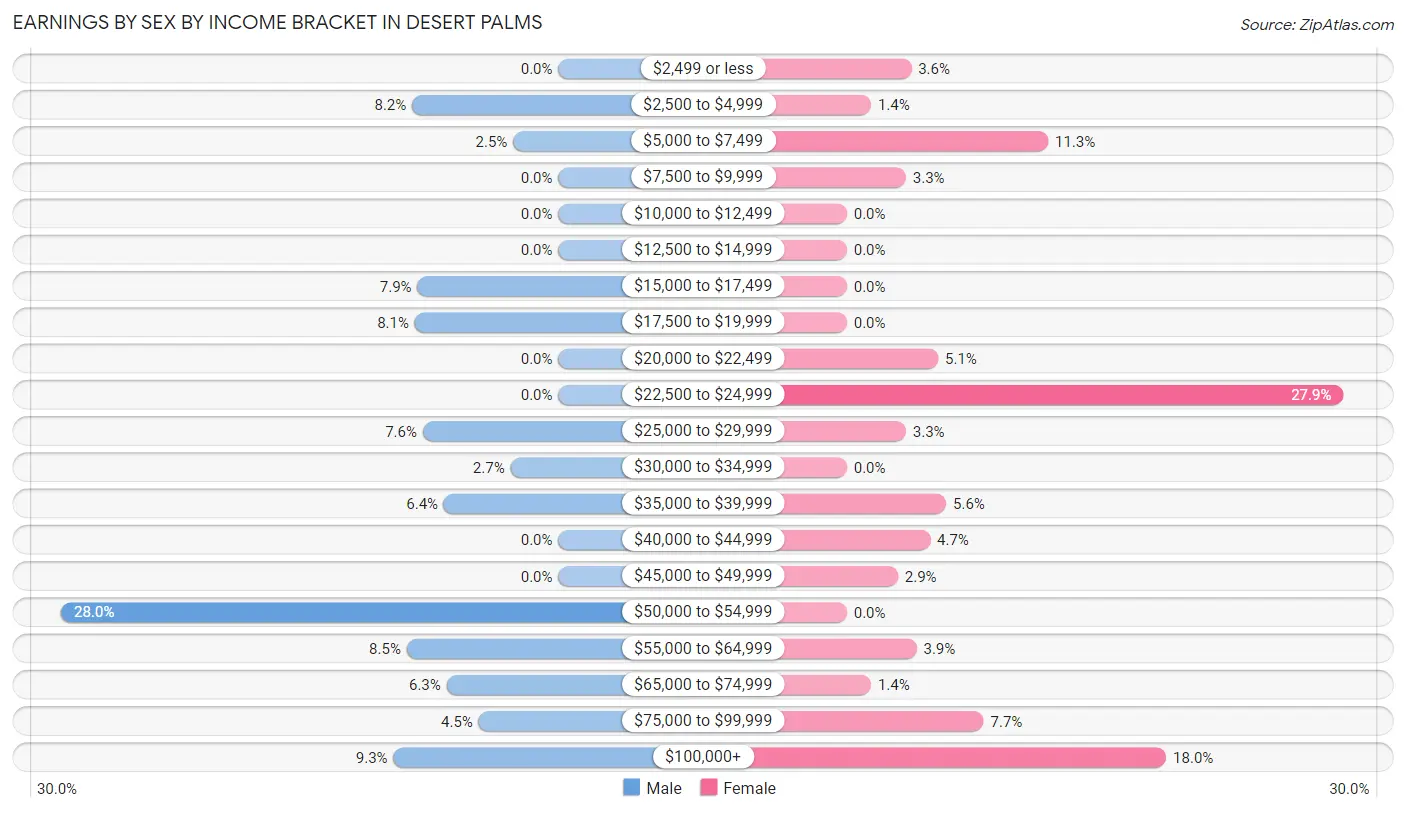
Earnings by Sex by Income Bracket in Desert Palms
The most common earnings brackets in Desert Palms are $50,000 to $54,999 for men (187 | 28.0%) and $22,500 to $24,999 for women (185 | 27.9%).
| Income | Male | Female |
| $2,499 or less | 0 (0.0%) | 24 (3.6%) |
| $2,500 to $4,999 | 55 (8.2%) | 9 (1.4%) |
| $5,000 to $7,499 | 17 (2.5%) | 75 (11.3%) |
| $7,500 to $9,999 | 0 (0.0%) | 22 (3.3%) |
| $10,000 to $12,499 | 0 (0.0%) | 0 (0.0%) |
| $12,500 to $14,999 | 0 (0.0%) | 0 (0.0%) |
| $15,000 to $17,499 | 53 (7.9%) | 0 (0.0%) |
| $17,500 to $19,999 | 54 (8.1%) | 0 (0.0%) |
| $20,000 to $22,499 | 0 (0.0%) | 34 (5.1%) |
| $22,500 to $24,999 | 0 (0.0%) | 185 (27.9%) |
| $25,000 to $29,999 | 51 (7.6%) | 22 (3.3%) |
| $30,000 to $34,999 | 18 (2.7%) | 0 (0.0%) |
| $35,000 to $39,999 | 43 (6.4%) | 37 (5.6%) |
| $40,000 to $44,999 | 0 (0.0%) | 31 (4.7%) |
| $45,000 to $49,999 | 0 (0.0%) | 19 (2.9%) |
| $50,000 to $54,999 | 187 (28.0%) | 0 (0.0%) |
| $55,000 to $64,999 | 57 (8.5%) | 26 (3.9%) |
| $65,000 to $74,999 | 42 (6.3%) | 9 (1.4%) |
| $75,000 to $99,999 | 30 (4.5%) | 51 (7.7%) |
| $100,000+ | 62 (9.3%) | 119 (17.9%) |
| Total | 669 (100.0%) | 663 (100.0%) |
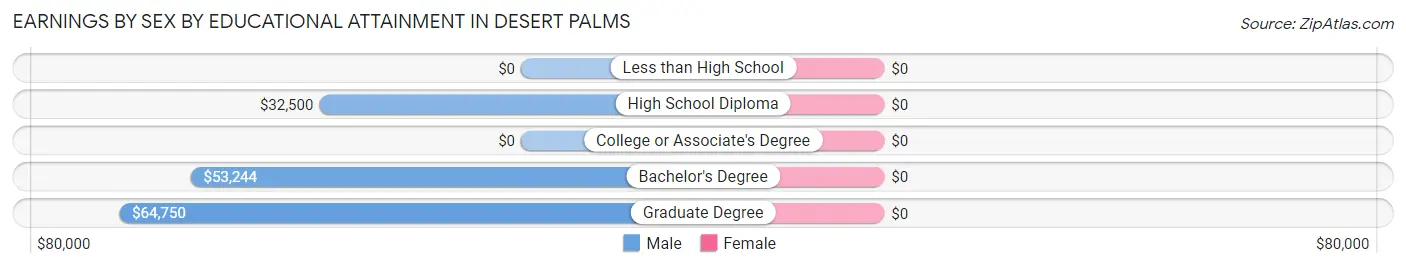
Earnings by Sex by Educational Attainment in Desert Palms
| Educational Attainment | Male Income | Female Income |
| Less than High School | - | - |
| High School Diploma | $32,500 | $0 |
| College or Associate's Degree | - | - |
| Bachelor's Degree | $53,244 | $0 |
| Graduate Degree | $64,750 | $0 |
| Total | $52,985 | $24,764 |
Family Income in Desert Palms
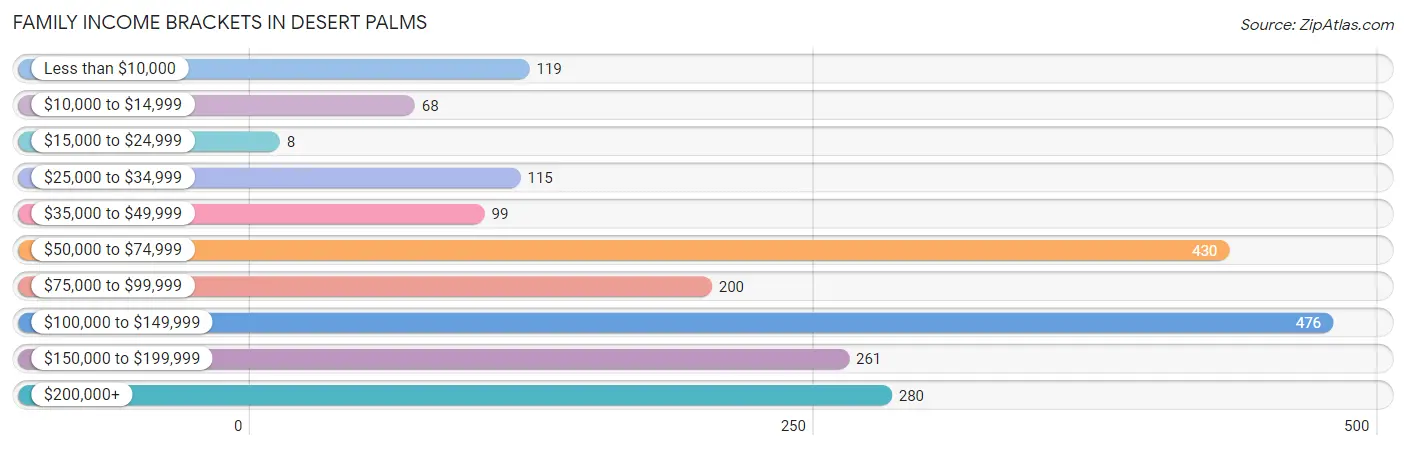
Family Income Brackets in Desert Palms
According to the Desert Palms family income data, there are 476 families falling into the $100,000 to $149,999 income range, which is the most common income bracket and makes up 23.1% of all families. Conversely, the $15,000 to $24,999 income bracket is the least frequent group with only 8 families (0.4%) belonging to this category.
| Income Bracket | # Families | % Families |
| Less than $10,000 | 119 | 5.8% |
| $10,000 to $14,999 | 68 | 3.3% |
| $15,000 to $24,999 | 8 | 0.4% |
| $25,000 to $34,999 | 115 | 5.6% |
| $35,000 to $49,999 | 99 | 4.8% |
| $50,000 to $74,999 | 430 | 20.9% |
| $75,000 to $99,999 | 200 | 9.7% |
| $100,000 to $149,999 | 476 | 23.1% |
| $150,000 to $199,999 | 261 | 12.7% |
| $200,000+ | 280 | 13.6% |
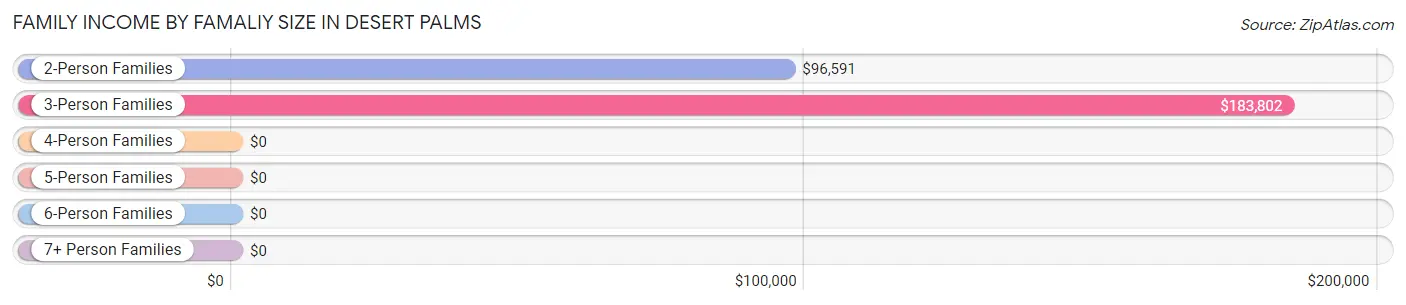
Family Income by Famaliy Size in Desert Palms
3-person families (67 | 3.3%) account for the highest median family income in Desert Palms with $183,802 per family, while 3-person families (67 | 3.3%) have the highest median income of $61,267 per family member.
| Income Bracket | # Families | Median Income |
| 2-Person Families | 1,982 (96.3%) | $96,591 |
| 3-Person Families | 67 (3.3%) | $183,802 |
| 4-Person Families | 0 (0.0%) | $0 |
| 5-Person Families | 10 (0.5%) | $0 |
| 6-Person Families | 0 (0.0%) | $0 |
| 7+ Person Families | 0 (0.0%) | $0 |
| Total | 2,059 (100.0%) | $99,042 |
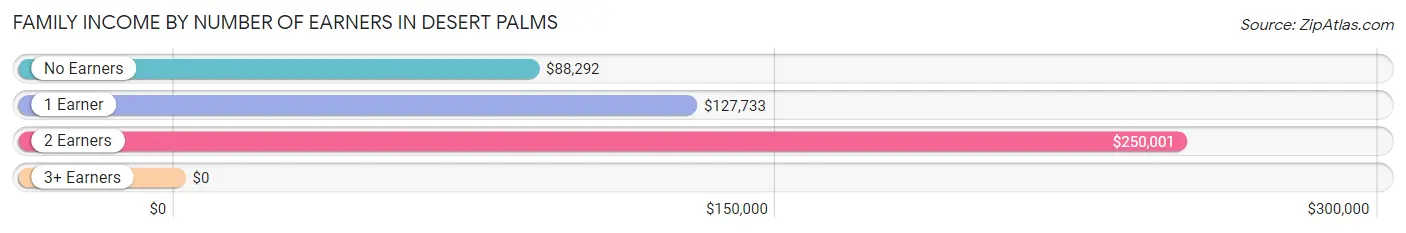
Family Income by Number of Earners in Desert Palms
| Number of Earners | # Families | Median Income |
| No Earners | 1,569 (76.2%) | $88,292 |
| 1 Earner | 350 (17.0%) | $127,733 |
| 2 Earners | 130 (6.3%) | $250,001 |
| 3+ Earners | 10 (0.5%) | $0 |
| Total | 2,059 (100.0%) | $99,042 |
Household Income in Desert Palms
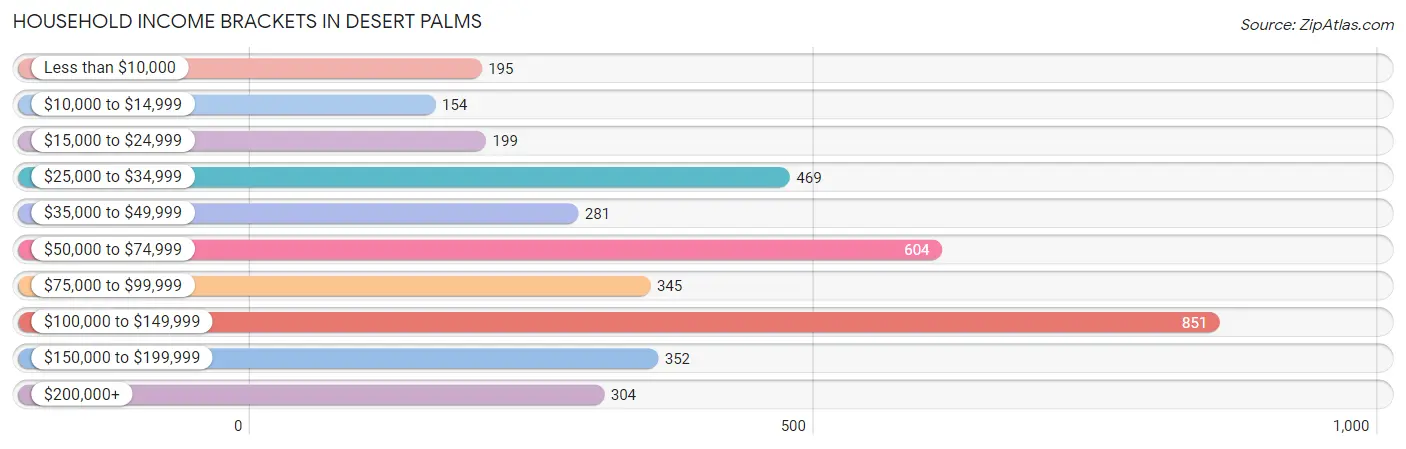
Household Income Brackets in Desert Palms
With 851 households falling in the category, the $100,000 to $149,999 income range is the most frequent in Desert Palms, accounting for 22.7% of all households. In contrast, only 154 households (4.1%) fall into the $10,000 to $14,999 income bracket, making it the least populous group.
| Income Bracket | # Households | % Households |
| Less than $10,000 | 195 | 5.2% |
| $10,000 to $14,999 | 154 | 4.1% |
| $15,000 to $24,999 | 199 | 5.3% |
| $25,000 to $34,999 | 469 | 12.5% |
| $35,000 to $49,999 | 281 | 7.5% |
| $50,000 to $74,999 | 604 | 16.1% |
| $75,000 to $99,999 | 345 | 9.2% |
| $100,000 to $149,999 | 851 | 22.7% |
| $150,000 to $199,999 | 352 | 9.4% |
| $200,000+ | 304 | 8.1% |
Household Income by Householder Age in Desert Palms
The median household income in Desert Palms is $73,697, with the highest median household income of $118,808 found in the 45 to 64 years age bracket for the primary householder. A total of 421 households (11.2%) fall into this category.
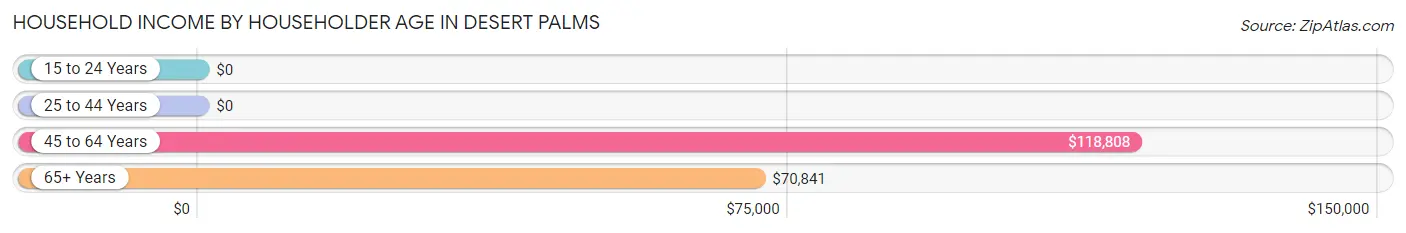
| Income Bracket | # Households | Median Income |
| 15 to 24 Years | 0 (0.0%) | $0 |
| 25 to 44 Years | 0 (0.0%) | $0 |
| 45 to 64 Years | 421 (11.2%) | $118,808 |
| 65+ Years | 3,328 (88.8%) | $70,841 |
| Total | 3,749 (100.0%) | $73,697 |
Poverty in Desert Palms
Income Below Poverty by Sex and Age in Desert Palms
With 9.3% poverty level for males and 9.9% for females among the residents of Desert Palms, 75 year old and over males and 45 to 54 year old females are the most vulnerable to poverty, with 190 males (12.1%) and 15 females (30.6%) in their respective age groups living below the poverty level.
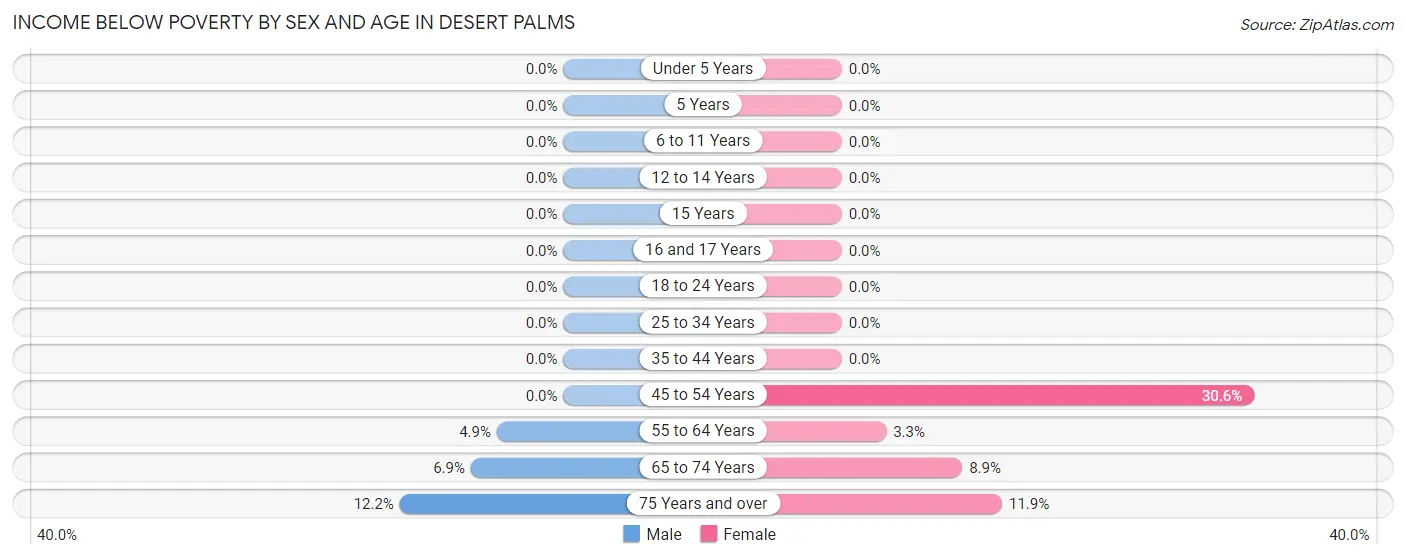
| Age Bracket | Male | Female |
| Under 5 Years | 0 (0.0%) | 0 (0.0%) |
| 5 Years | 0 (0.0%) | 0 (0.0%) |
| 6 to 11 Years | 0 (0.0%) | 0 (0.0%) |
| 12 to 14 Years | 0 (0.0%) | 0 (0.0%) |
| 15 Years | 0 (0.0%) | 0 (0.0%) |
| 16 and 17 Years | 0 (0.0%) | 0 (0.0%) |
| 18 to 24 Years | 0 (0.0%) | 0 (0.0%) |
| 25 to 34 Years | 0 (0.0%) | 0 (0.0%) |
| 35 to 44 Years | 0 (0.0%) | 0 (0.0%) |
| 45 to 54 Years | 0 (0.0%) | 15 (30.6%) |
| 55 to 64 Years | 17 (4.9%) | 18 (3.3%) |
| 65 to 74 Years | 61 (6.9%) | 99 (8.9%) |
| 75 Years and over | 190 (12.1%) | 215 (11.9%) |
| Total | 268 (9.3%) | 347 (9.9%) |
Income Above Poverty by Sex and Age in Desert Palms
According to the poverty statistics in Desert Palms, males aged under 5 years and females aged 35 to 44 years are the age groups that are most secure financially, with 100.0% of males and 100.0% of females in these age groups living above the poverty line.
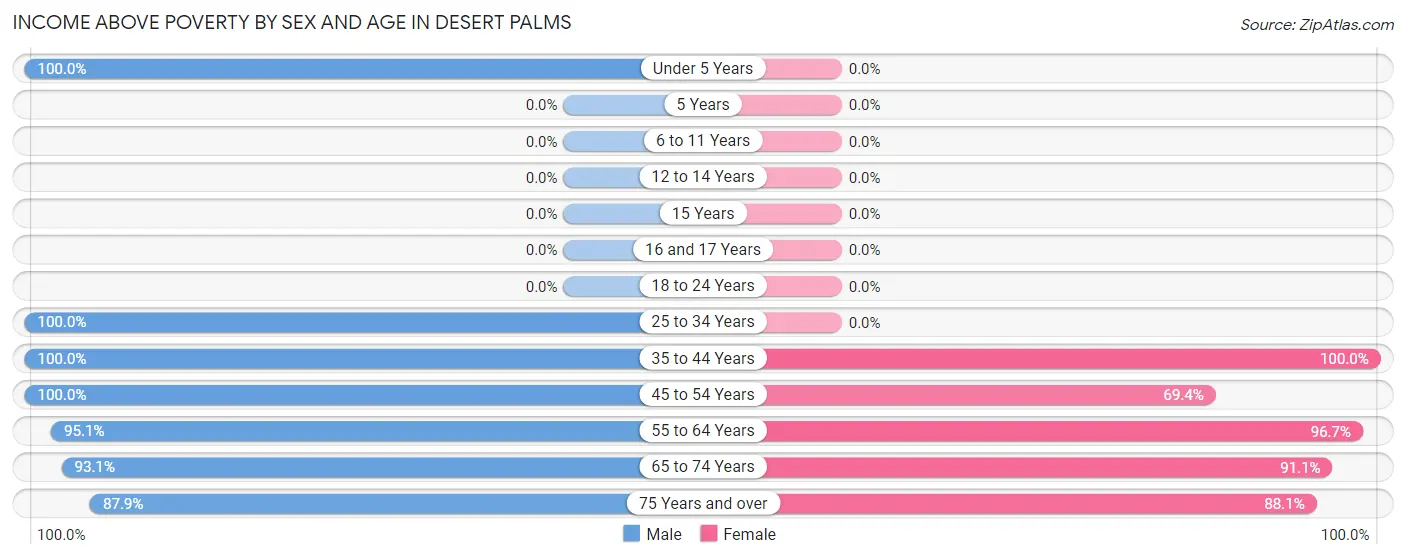
| Age Bracket | Male | Female |
| Under 5 Years | 13 (100.0%) | 0 (0.0%) |
| 5 Years | 0 (0.0%) | 0 (0.0%) |
| 6 to 11 Years | 0 (0.0%) | 0 (0.0%) |
| 12 to 14 Years | 0 (0.0%) | 0 (0.0%) |
| 15 Years | 0 (0.0%) | 0 (0.0%) |
| 16 and 17 Years | 0 (0.0%) | 0 (0.0%) |
| 18 to 24 Years | 0 (0.0%) | 0 (0.0%) |
| 25 to 34 Years | 14 (100.0%) | 0 (0.0%) |
| 35 to 44 Years | 16 (100.0%) | 13 (100.0%) |
| 45 to 54 Years | 54 (100.0%) | 34 (69.4%) |
| 55 to 64 Years | 327 (95.1%) | 527 (96.7%) |
| 65 to 74 Years | 827 (93.1%) | 1,008 (91.1%) |
| 75 Years and over | 1,374 (87.8%) | 1,592 (88.1%) |
| Total | 2,625 (90.7%) | 3,174 (90.1%) |
Income Below Poverty Among Married-Couple Families in Desert Palms
The poverty statistics for married-couple families in Desert Palms show that 10.1% or 197 of the total 1,943 families live below the poverty line. Families with no children have the highest poverty rate of 10.1%, comprising of 197 families. On the other hand, families with no children have the lowest poverty rate of 10.1%, which includes 197 families.
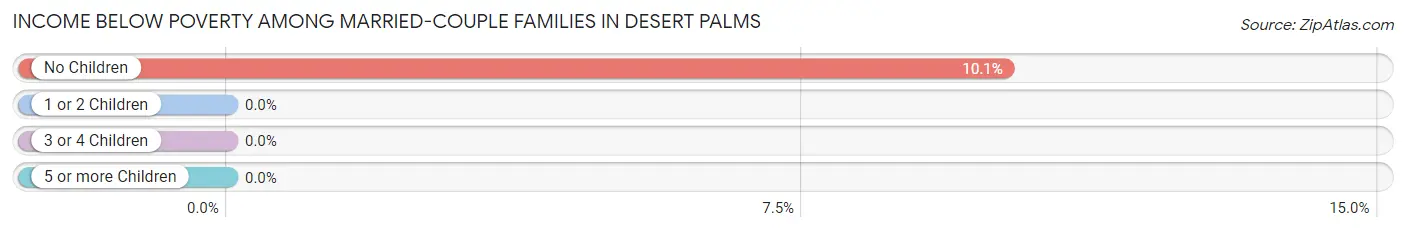
| Children | Above Poverty | Below Poverty |
| No Children | 1,746 (89.9%) | 197 (10.1%) |
| 1 or 2 Children | 0 (0.0%) | 0 (0.0%) |
| 3 or 4 Children | 0 (0.0%) | 0 (0.0%) |
| 5 or more Children | 0 (0.0%) | 0 (0.0%) |
| Total | 1,746 (89.9%) | 197 (10.1%) |
Income Below Poverty Among Single-Parent Households in Desert Palms
| Children | Single Father | Single Mother |
| No Children | 0 (0.0%) | 0 (0.0%) |
| 1 or 2 Children | 0 (0.0%) | 0 (0.0%) |
| 3 or 4 Children | 0 (0.0%) | 0 (0.0%) |
| 5 or more Children | 0 (0.0%) | 0 (0.0%) |
| Total | 0 (0.0%) | 0 (0.0%) |
Income Below Poverty Among Married-Couple vs Single-Parent Households in Desert Palms
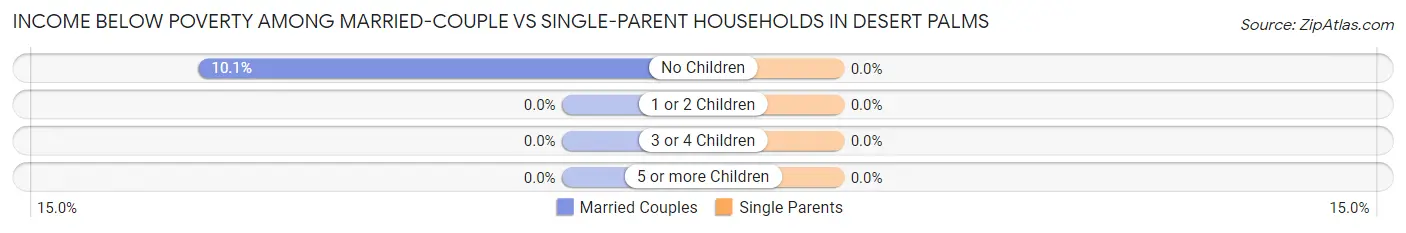
| Children | Married-Couple Families | Single-Parent Households |
| No Children | 197 (10.1%) | 0 (0.0%) |
| 1 or 2 Children | 0 (0.0%) | 0 (0.0%) |
| 3 or 4 Children | 0 (0.0%) | 0 (0.0%) |
| 5 or more Children | 0 (0.0%) | 0 (0.0%) |
| Total | 197 (10.1%) | 0 (0.0%) |
Race in Desert Palms
The most populous races in Desert Palms are White / Caucasian (6,032 | 94.0%), Hispanic or Latino (378 | 5.9%), and Two or more Races (151 | 2.4%).
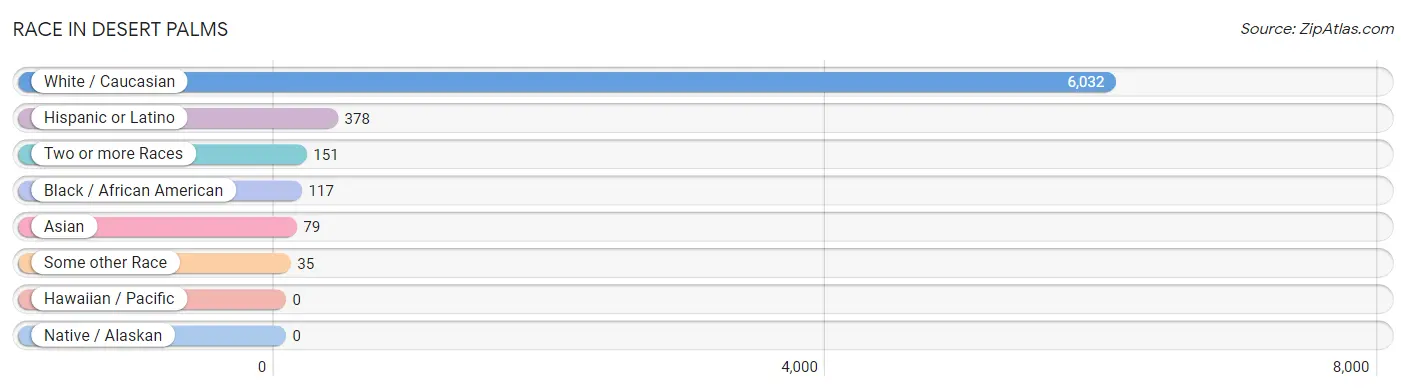
| Race | # Population | % Population |
| Asian | 79 | 1.2% |
| Black / African American | 117 | 1.8% |
| Hawaiian / Pacific | 0 | 0.0% |
| Hispanic or Latino | 378 | 5.9% |
| Native / Alaskan | 0 | 0.0% |
| White / Caucasian | 6,032 | 94.0% |
| Two or more Races | 151 | 2.4% |
| Some other Race | 35 | 0.5% |
| Total | 6,414 | 100.0% |
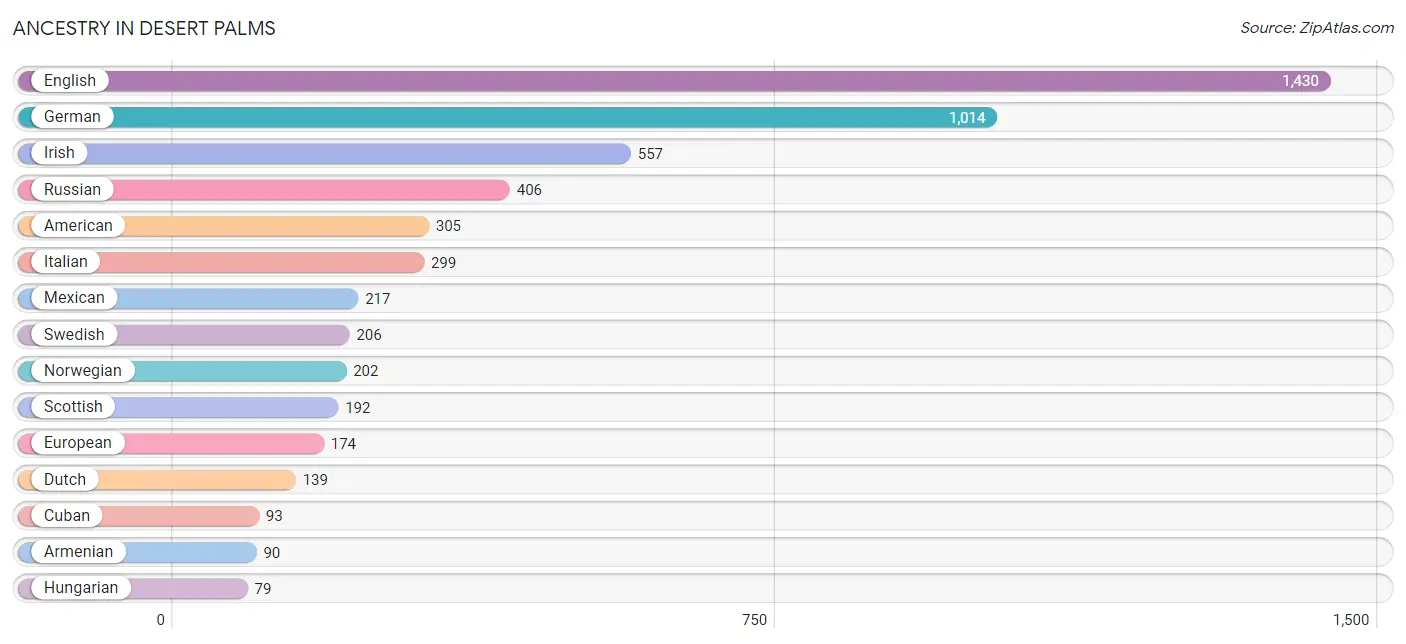
Ancestry in Desert Palms
The most populous ancestries reported in Desert Palms are English (1,430 | 22.3%), German (1,014 | 15.8%), Irish (557 | 8.7%), Russian (406 | 6.3%), and American (305 | 4.8%), together accounting for 57.9% of all Desert Palms residents.
| Ancestry | # Population | % Population |
| American | 305 | 4.8% |
| Arab | 24 | 0.4% |
| Argentinean | 12 | 0.2% |
| Armenian | 90 | 1.4% |
| Austrian | 38 | 0.6% |
| Bhutanese | 42 | 0.6% |
| Canadian | 44 | 0.7% |
| Central American | 28 | 0.4% |
| Costa Rican | 28 | 0.4% |
| Cree | 6 | 0.1% |
| Croatian | 24 | 0.4% |
| Cuban | 93 | 1.5% |
| Czech | 23 | 0.4% |
| Czechoslovakian | 23 | 0.4% |
| Danish | 55 | 0.9% |
| Dutch | 139 | 2.2% |
| Eastern European | 10 | 0.2% |
| English | 1,430 | 22.3% |
| European | 174 | 2.7% |
| Finnish | 16 | 0.3% |
| French | 73 | 1.1% |
| French Canadian | 59 | 0.9% |
| German | 1,014 | 15.8% |
| Hungarian | 79 | 1.2% |
| Indian (Asian) | 18 | 0.3% |
| Iranian | 73 | 1.1% |
| Irish | 557 | 8.7% |
| Italian | 299 | 4.7% |
| Korean | 19 | 0.3% |
| Lebanese | 24 | 0.4% |
| Maltese | 26 | 0.4% |
| Mexican | 217 | 3.4% |
| Northern European | 44 | 0.7% |
| Norwegian | 202 | 3.2% |
| Polish | 75 | 1.2% |
| Romanian | 42 | 0.6% |
| Russian | 406 | 6.3% |
| Scandinavian | 15 | 0.2% |
| Scotch-Irish | 24 | 0.4% |
| Scottish | 192 | 3.0% |
| Serbian | 19 | 0.3% |
| South American | 12 | 0.2% |
| Spaniard | 28 | 0.4% |
| Swedish | 206 | 3.2% |
| Swiss | 17 | 0.3% |
| Ukrainian | 48 | 0.7% |
| Welsh | 57 | 0.9% | View All 47 Rows |
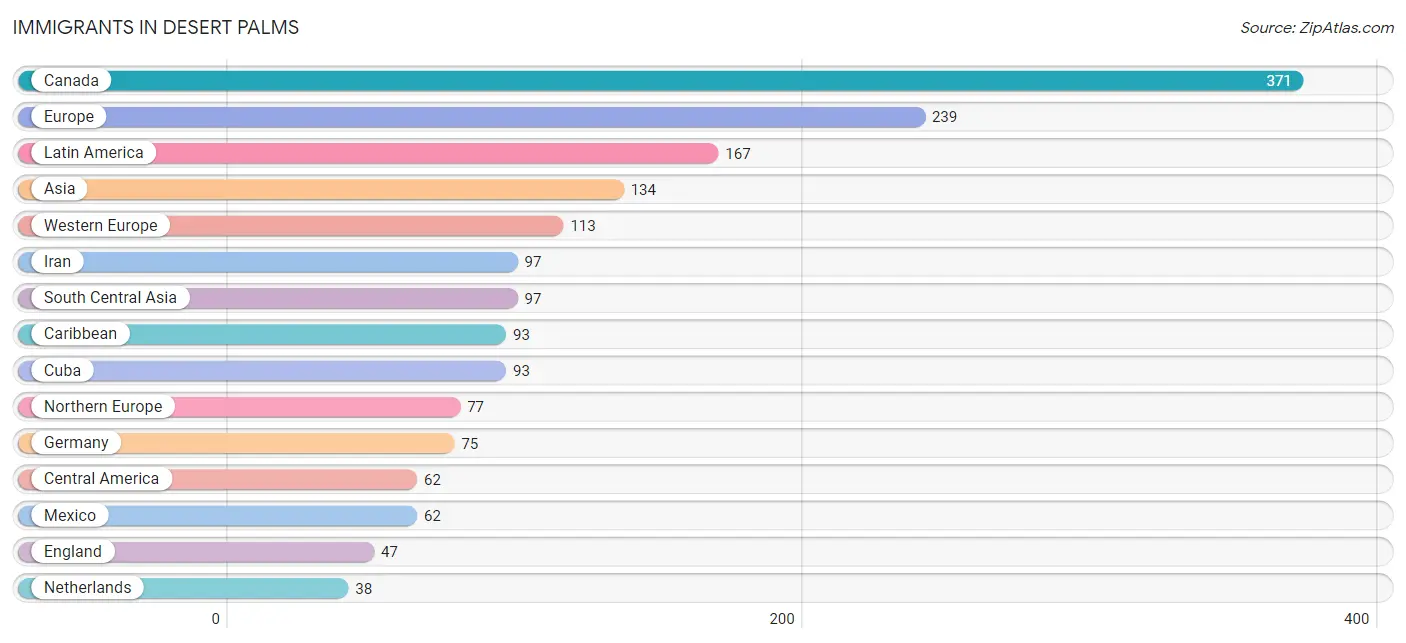
Immigrants in Desert Palms
The most numerous immigrant groups reported in Desert Palms came from Canada (371 | 5.8%), Europe (239 | 3.7%), Latin America (167 | 2.6%), Asia (134 | 2.1%), and Western Europe (113 | 1.8%), together accounting for 16.0% of all Desert Palms residents.
| Immigration Origin | # Population | % Population |
| Argentina | 12 | 0.2% |
| Asia | 134 | 2.1% |
| Canada | 371 | 5.8% |
| Caribbean | 93 | 1.5% |
| Central America | 62 | 1.0% |
| Croatia | 24 | 0.4% |
| Cuba | 93 | 1.5% |
| Eastern Europe | 24 | 0.4% |
| England | 47 | 0.7% |
| Europe | 239 | 3.7% |
| Germany | 75 | 1.2% |
| Indonesia | 18 | 0.3% |
| Iran | 97 | 1.5% |
| Italy | 25 | 0.4% |
| Latin America | 167 | 2.6% |
| Mexico | 62 | 1.0% |
| Netherlands | 38 | 0.6% |
| Northern Europe | 77 | 1.2% |
| Philippines | 19 | 0.3% |
| South America | 12 | 0.2% |
| South Central Asia | 97 | 1.5% |
| South Eastern Asia | 37 | 0.6% |
| Southern Europe | 25 | 0.4% |
| Western Europe | 113 | 1.8% | View All 24 Rows |
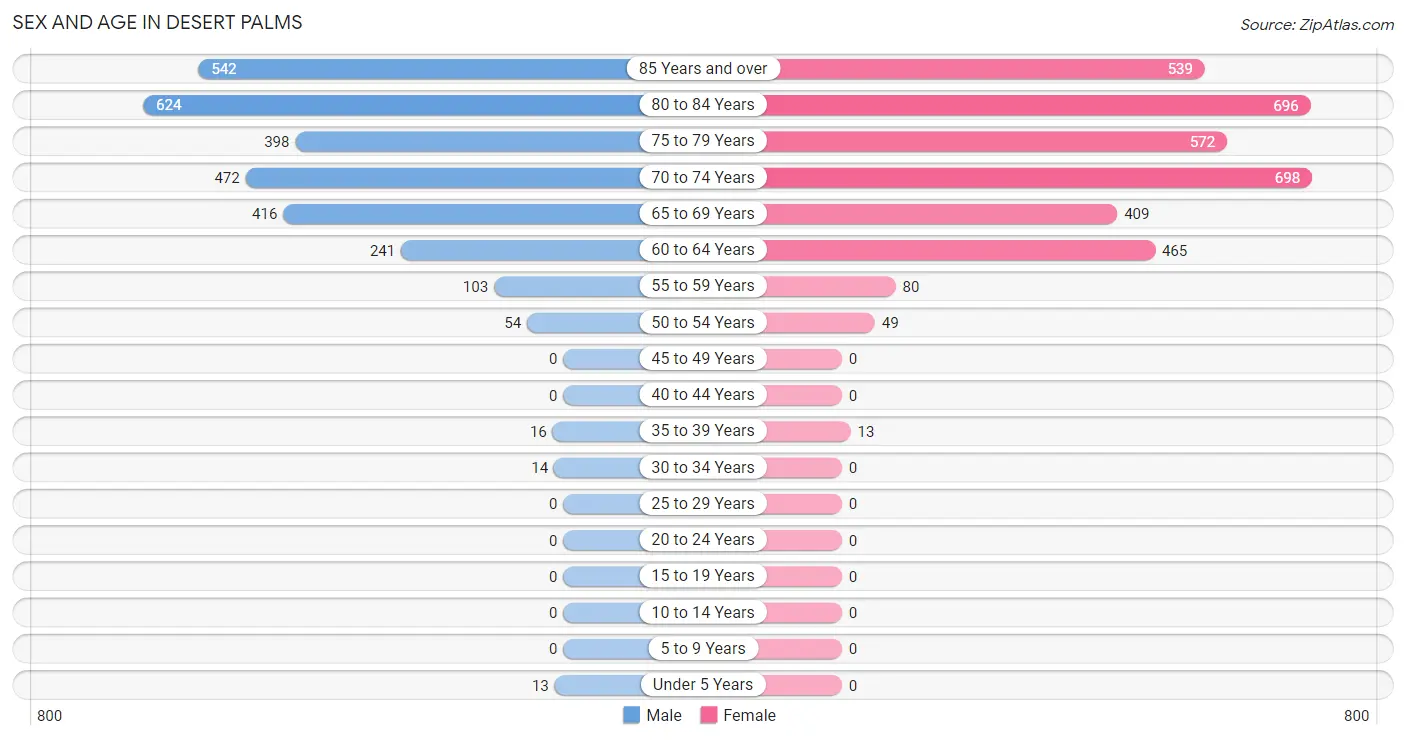
Sex and Age in Desert Palms
Sex and Age in Desert Palms
The most populous age groups in Desert Palms are 80 to 84 Years (624 | 21.6%) for men and 70 to 74 Years (698 | 19.8%) for women.
| Age Bracket | Male | Female |
| Under 5 Years | 13 (0.4%) | 0 (0.0%) |
| 5 to 9 Years | 0 (0.0%) | 0 (0.0%) |
| 10 to 14 Years | 0 (0.0%) | 0 (0.0%) |
| 15 to 19 Years | 0 (0.0%) | 0 (0.0%) |
| 20 to 24 Years | 0 (0.0%) | 0 (0.0%) |
| 25 to 29 Years | 0 (0.0%) | 0 (0.0%) |
| 30 to 34 Years | 14 (0.5%) | 0 (0.0%) |
| 35 to 39 Years | 16 (0.5%) | 13 (0.4%) |
| 40 to 44 Years | 0 (0.0%) | 0 (0.0%) |
| 45 to 49 Years | 0 (0.0%) | 0 (0.0%) |
| 50 to 54 Years | 54 (1.9%) | 49 (1.4%) |
| 55 to 59 Years | 103 (3.6%) | 80 (2.3%) |
| 60 to 64 Years | 241 (8.3%) | 465 (13.2%) |
| 65 to 69 Years | 416 (14.4%) | 409 (11.6%) |
| 70 to 74 Years | 472 (16.3%) | 698 (19.8%) |
| 75 to 79 Years | 398 (13.8%) | 572 (16.3%) |
| 80 to 84 Years | 624 (21.6%) | 696 (19.8%) |
| 85 Years and over | 542 (18.7%) | 539 (15.3%) |
| Total | 2,893 (100.0%) | 3,521 (100.0%) |
Families and Households in Desert Palms
Median Family Size in Desert Palms
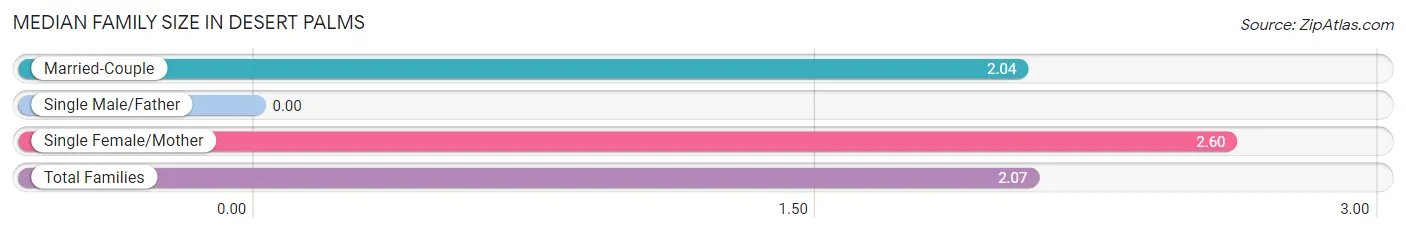
| Family Type | # Families | Family Size |
| Married-Couple | 1,943 (94.4%) | 2.04 |
| Single Male/Father | 0 (0.0%) | - |
| Single Female/Mother | 116 (5.6%) | 2.60 |
| Total Families | 2,059 (100.0%) | 2.07 |
Median Household Size in Desert Palms
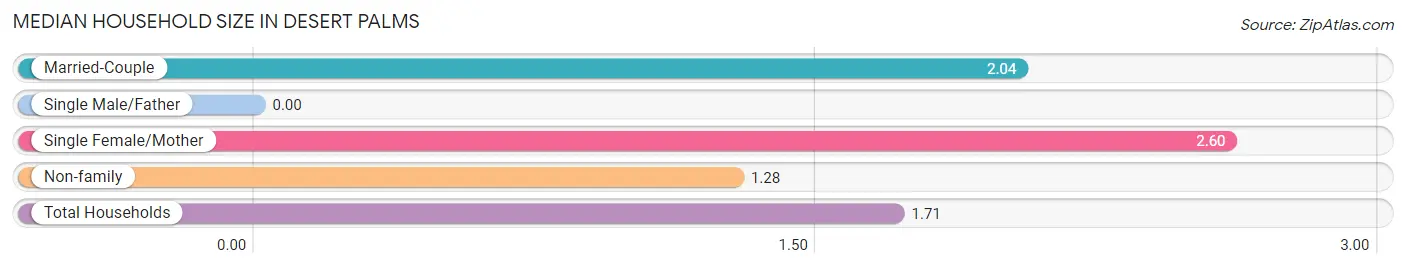
| Household Type | # Households | Household Size |
| Married-Couple | 1,943 (51.8%) | 2.04 |
| Single Male/Father | 0 (0.0%) | - |
| Single Female/Mother | 116 (3.1%) | 2.60 |
| Non-family | 1,690 (45.1%) | 1.28 |
| Total Households | 3,749 (100.0%) | 1.71 |
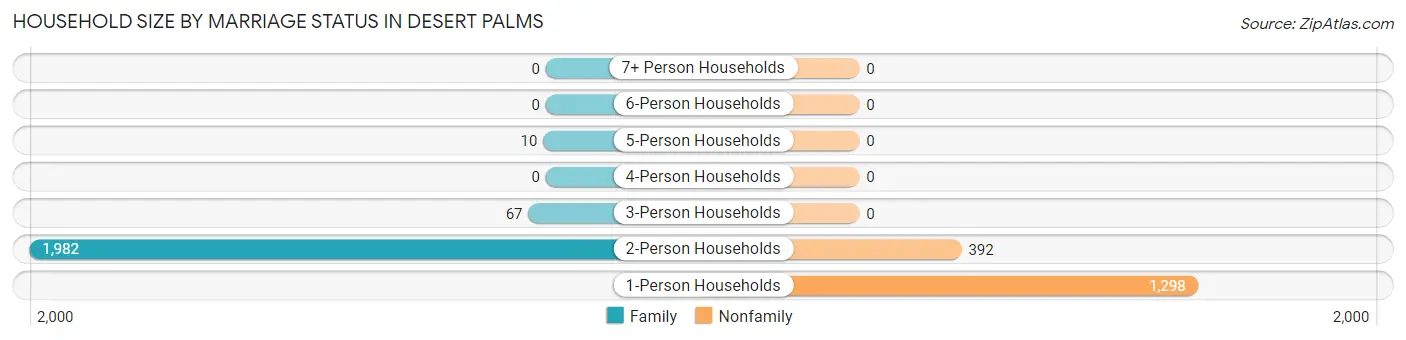
Household Size by Marriage Status in Desert Palms
Out of a total of 3,749 households in Desert Palms, 2,059 (54.9%) are family households, while 1,690 (45.1%) are nonfamily households. The most numerous type of family households are 2-person households, comprising 1,982, and the most common type of nonfamily households are 1-person households, comprising 1,298.
| Household Size | Family Households | Nonfamily Households |
| 1-Person Households | - | 1,298 (34.6%) |
| 2-Person Households | 1,982 (52.9%) | 392 (10.5%) |
| 3-Person Households | 67 (1.8%) | 0 (0.0%) |
| 4-Person Households | 0 (0.0%) | 0 (0.0%) |
| 5-Person Households | 10 (0.3%) | 0 (0.0%) |
| 6-Person Households | 0 (0.0%) | 0 (0.0%) |
| 7+ Person Households | 0 (0.0%) | 0 (0.0%) |
| Total | 2,059 (54.9%) | 1,690 (45.1%) |
Female Fertility in Desert Palms
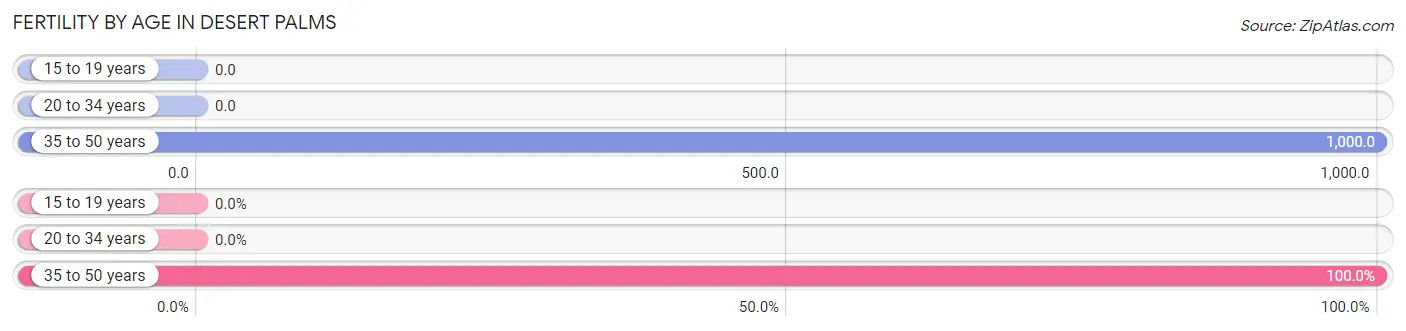
Fertility by Age in Desert Palms
Average fertility rate in Desert Palms is 1,000.0 births per 1,000 women. Women in the age bracket of 35 to 50 years have the highest fertility rate with 1,000.0 births per 1,000 women. Women in the age bracket of 35 to 50 years acount for 100.0% of all women with births.
| Age Bracket | Women with Births | Births / 1,000 Women |
| 15 to 19 years | 0 (0.0%) | 0.0 |
| 20 to 34 years | 0 (0.0%) | 0.0 |
| 35 to 50 years | 13 (100.0%) | 1,000.0 |
| Total | 13 (100.0%) | 1,000.0 |
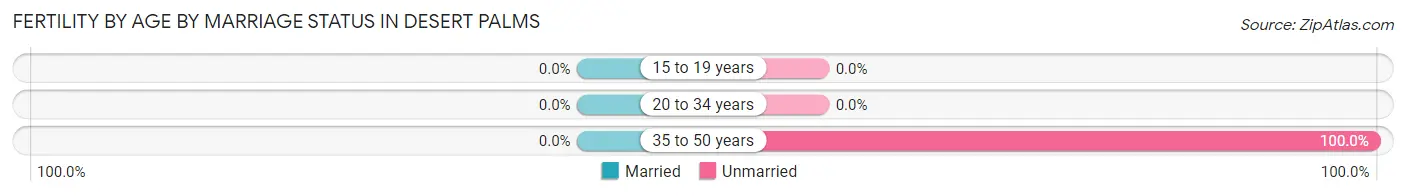
Fertility by Age by Marriage Status in Desert Palms
| Age Bracket | Married | Unmarried |
| 15 to 19 years | 0 (0.0%) | 0 (0.0%) |
| 20 to 34 years | 0 (0.0%) | 0 (0.0%) |
| 35 to 50 years | 0 (0.0%) | 13 (100.0%) |
| Total | 0 (0.0%) | 13 (100.0%) |
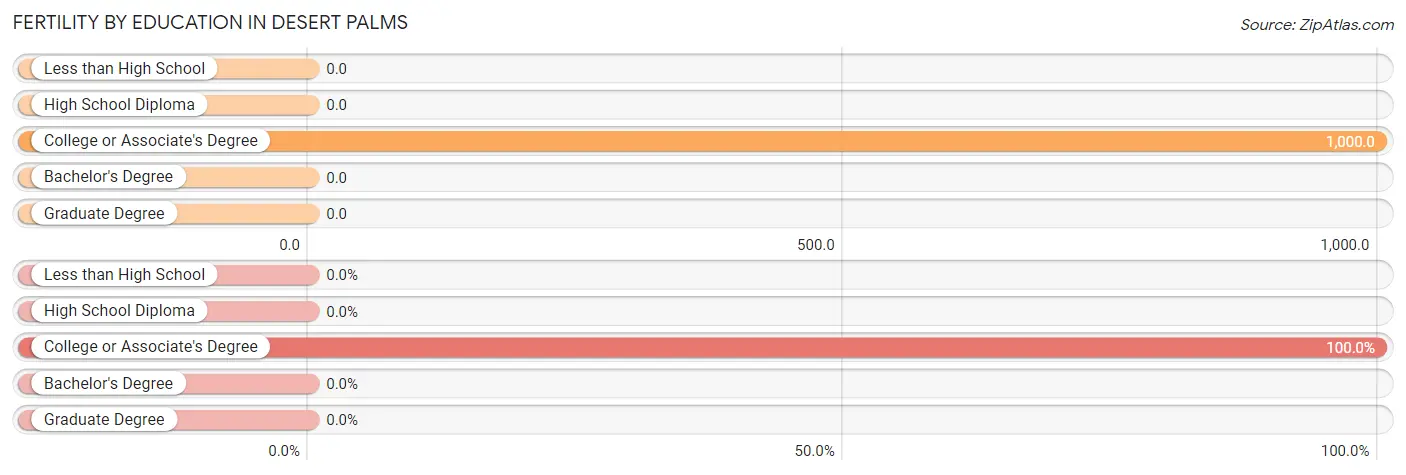
Fertility by Education in Desert Palms
| Educational Attainment | Women with Births | Births / 1,000 Women |
| Less than High School | 0 (0.0%) | 0.0 |
| High School Diploma | 0 (0.0%) | 0.0 |
| College or Associate's Degree | 13 (100.0%) | 1,000.0 |
| Bachelor's Degree | 0 (0.0%) | 0.0 |
| Graduate Degree | 0 (0.0%) | 0.0 |
| Total | 13 (100.0%) | 1,000.0 |
Fertility by Education by Marriage Status in Desert Palms
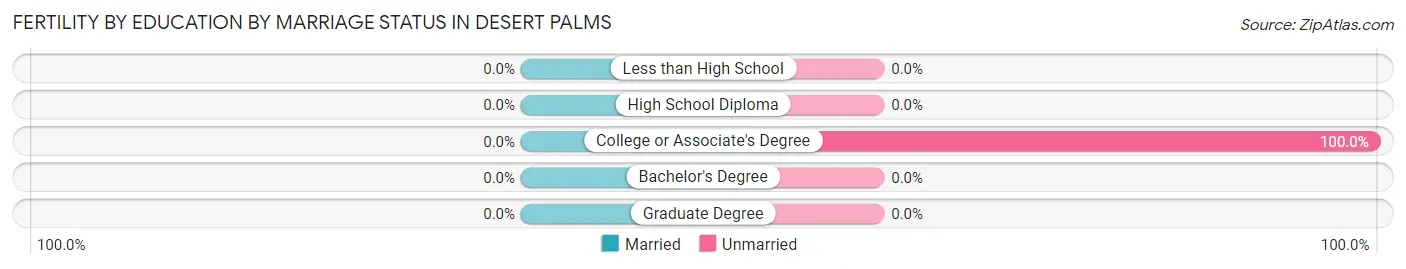
| Educational Attainment | Married | Unmarried |
| Less than High School | 0 (0.0%) | 0 (0.0%) |
| High School Diploma | 0 (0.0%) | 0 (0.0%) |
| College or Associate's Degree | 0 (0.0%) | 13 (100.0%) |
| Bachelor's Degree | 0 (0.0%) | 0 (0.0%) |
| Graduate Degree | 0 (0.0%) | 0 (0.0%) |
| Total | 0 (0.0%) | 13 (100.0%) |
Employment Characteristics in Desert Palms
Employment by Class of Employer in Desert Palms
Among the 1,053 employed individuals in Desert Palms, private company employees (494 | 46.9%), self-employed (not incorporated) (203 | 19.3%), and not-for-profit organizations (190 | 18.0%) make up the most common classes of employment.
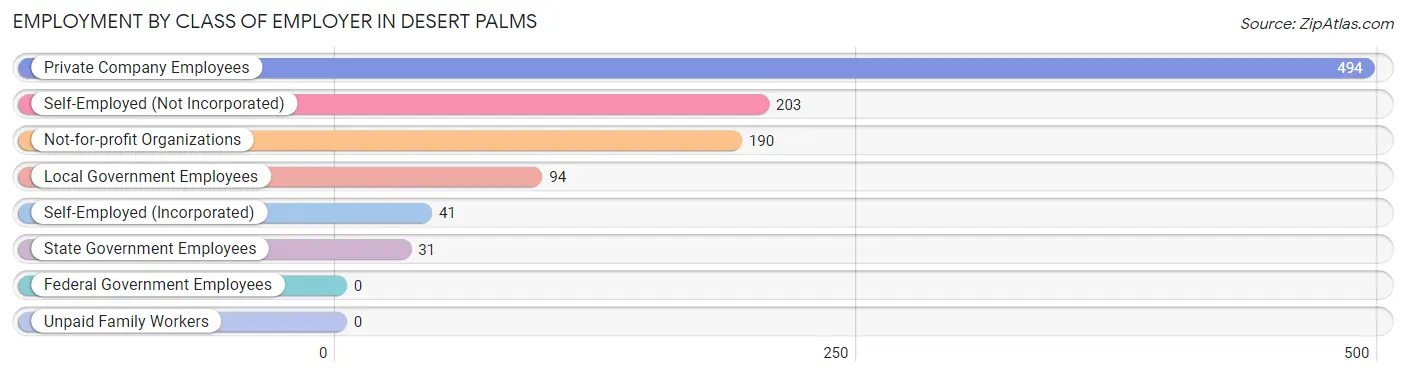
| Employer Class | # Employees | % Employees |
| Private Company Employees | 494 | 46.9% |
| Self-Employed (Incorporated) | 41 | 3.9% |
| Self-Employed (Not Incorporated) | 203 | 19.3% |
| Not-for-profit Organizations | 190 | 18.0% |
| Local Government Employees | 94 | 8.9% |
| State Government Employees | 31 | 2.9% |
| Federal Government Employees | 0 | 0.0% |
| Unpaid Family Workers | 0 | 0.0% |
| Total | 1,053 | 100.0% |
Employment Status by Age in Desert Palms
According to the labor force statistics for Desert Palms, out of the total population over 16 years of age (6,401), 18.0% or 1,152 individuals are in the labor force, with 6.3% or 73 of them unemployed. The age group with the highest labor force participation rate is 30 to 34 years, with 100.0% or 14 individuals in the labor force. Within the labor force, the 45 to 54 years age range has the highest percentage of unemployed individuals, with 42.4% or 28 of them being unemployed.
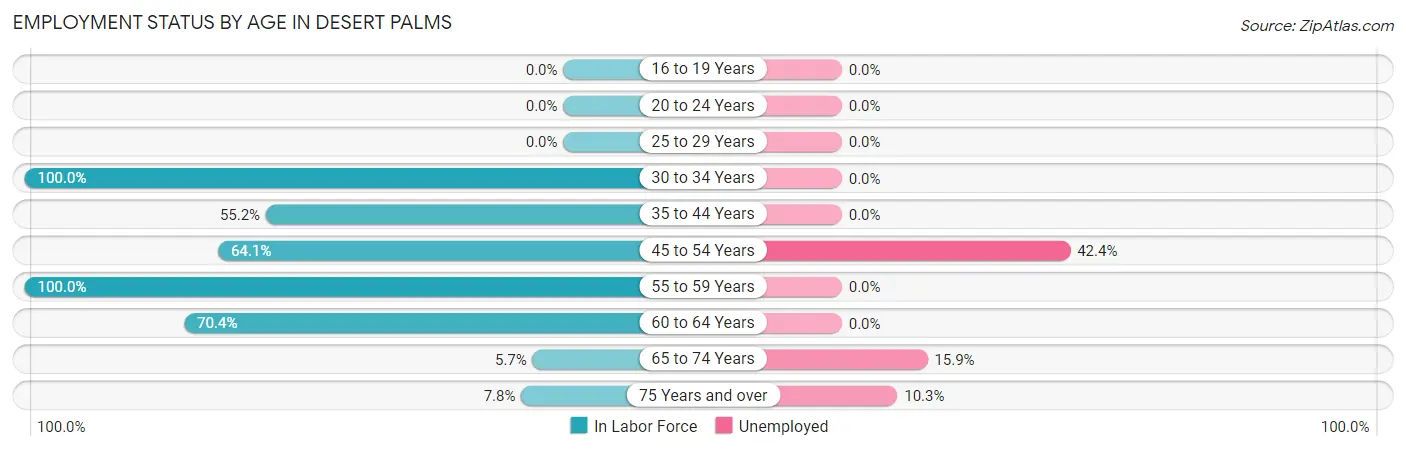
| Age Bracket | In Labor Force | Unemployed |
| 16 to 19 Years | 0 (0.0%) | 0 (0.0%) |
| 20 to 24 Years | 0 (0.0%) | 0 (0.0%) |
| 25 to 29 Years | 0 (0.0%) | 0 (0.0%) |
| 30 to 34 Years | 14 (100.0%) | 0 (0.0%) |
| 35 to 44 Years | 16 (55.2%) | 0 (0.0%) |
| 45 to 54 Years | 66 (64.1%) | 28 (42.4%) |
| 55 to 59 Years | 183 (100.0%) | 0 (0.0%) |
| 60 to 64 Years | 497 (70.4%) | 0 (0.0%) |
| 65 to 74 Years | 114 (5.7%) | 18 (15.9%) |
| 75 Years and over | 263 (7.8%) | 27 (10.3%) |
| Total | 1,152 (18.0%) | 73 (6.3%) |
Employment Status by Educational Attainment in Desert Palms
According to labor force statistics for Desert Palms, 75.0% of individuals (776) out of the total population between 25 and 64 years of age (1,035) are in the labor force, with 3.6% or 28 of them being unemployed. The group with the highest labor force participation rate are those with the educational attainment of bachelor's degree or higher, with 88.3% or 515 individuals in the labor force. Within the labor force, individuals with bachelor's degree or higher education have the highest percentage of unemployment, with 5.4% or 28 of them being unemployed.
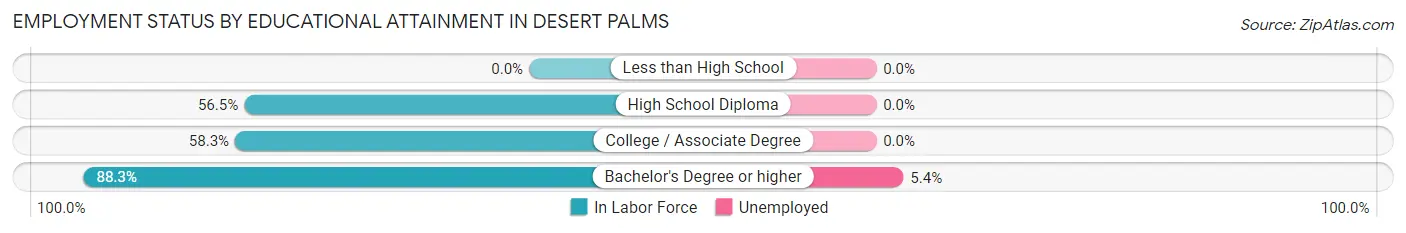
| Educational Attainment | In Labor Force | Unemployed |
| Less than High School | 0 (0.0%) | 0 (0.0%) |
| High School Diploma | 78 (56.5%) | 0 (0.0%) |
| College / Associate Degree | 183 (58.3%) | 0 (0.0%) |
| Bachelor's Degree or higher | 515 (88.3%) | 31 (5.4%) |
| Total | 776 (75.0%) | 37 (3.6%) |
Employment Occupations by Sex in Desert Palms
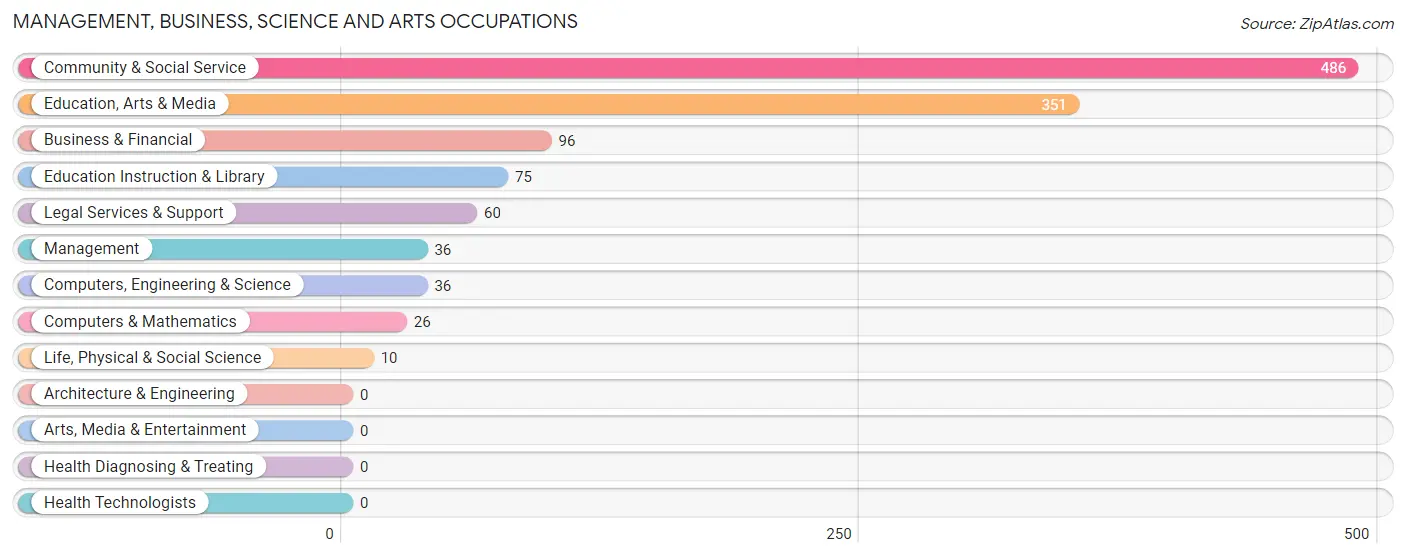
Management, Business, Science and Arts Occupations
The most common Management, Business, Science and Arts occupations in Desert Palms are Community & Social Service (486 | 45.1%), Education, Arts & Media (351 | 32.6%), Business & Financial (96 | 8.9%), Education Instruction & Library (75 | 7.0%), and Legal Services & Support (60 | 5.6%).
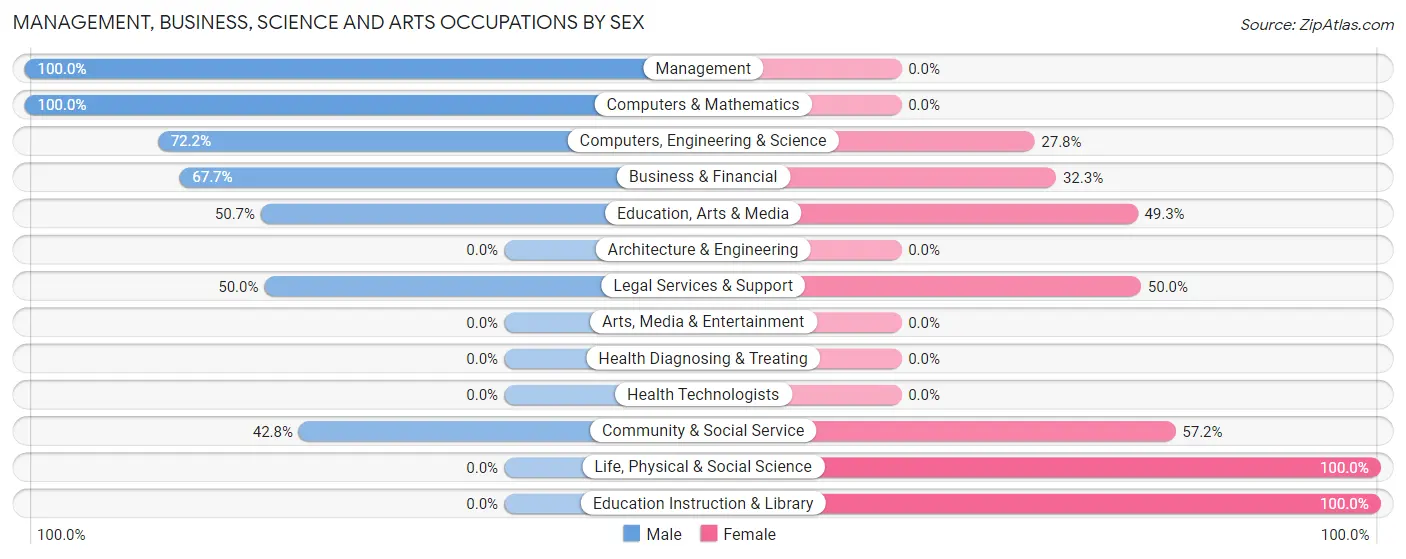
Management, Business, Science and Arts Occupations by Sex
Within the Management, Business, Science and Arts occupations in Desert Palms, the most male-oriented occupations are Management (100.0%), Computers & Mathematics (100.0%), and Computers, Engineering & Science (72.2%), while the most female-oriented occupations are Life, Physical & Social Science (100.0%), Education Instruction & Library (100.0%), and Community & Social Service (57.2%).
| Occupation | Male | Female |
| Management | 36 (100.0%) | 0 (0.0%) |
| Business & Financial | 65 (67.7%) | 31 (32.3%) |
| Computers, Engineering & Science | 26 (72.2%) | 10 (27.8%) |
| Computers & Mathematics | 26 (100.0%) | 0 (0.0%) |
| Architecture & Engineering | 0 (0.0%) | 0 (0.0%) |
| Life, Physical & Social Science | 0 (0.0%) | 10 (100.0%) |
| Community & Social Service | 208 (42.8%) | 278 (57.2%) |
| Education, Arts & Media | 178 (50.7%) | 173 (49.3%) |
| Legal Services & Support | 30 (50.0%) | 30 (50.0%) |
| Education Instruction & Library | 0 (0.0%) | 75 (100.0%) |
| Arts, Media & Entertainment | 0 (0.0%) | 0 (0.0%) |
| Health Diagnosing & Treating | 0 (0.0%) | 0 (0.0%) |
| Health Technologists | 0 (0.0%) | 0 (0.0%) |
| Total (Category) | 335 (51.2%) | 319 (48.8%) |
| Total (Overall) | 511 (47.4%) | 567 (52.6%) |
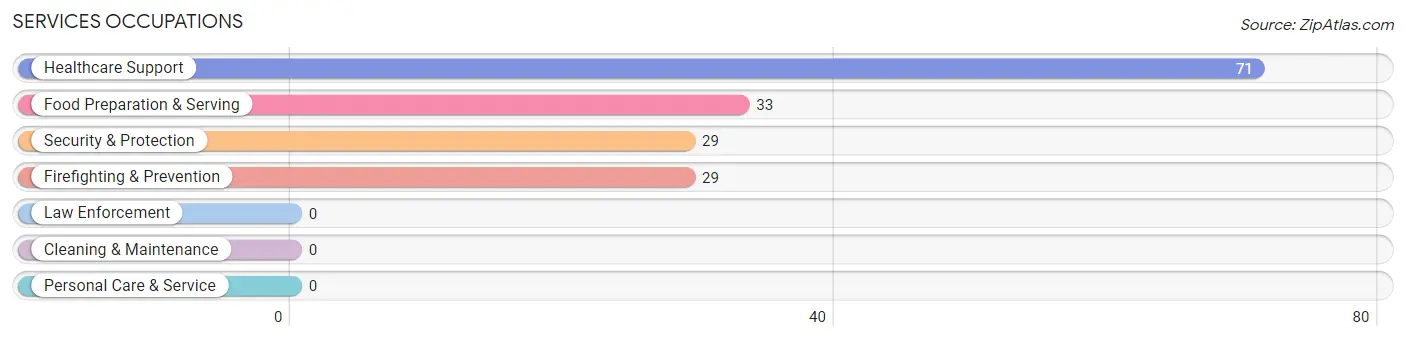
Services Occupations
The most common Services occupations in Desert Palms are Healthcare Support (71 | 6.6%), Food Preparation & Serving (33 | 3.1%), Security & Protection (29 | 2.7%), and Firefighting & Prevention (29 | 2.7%).
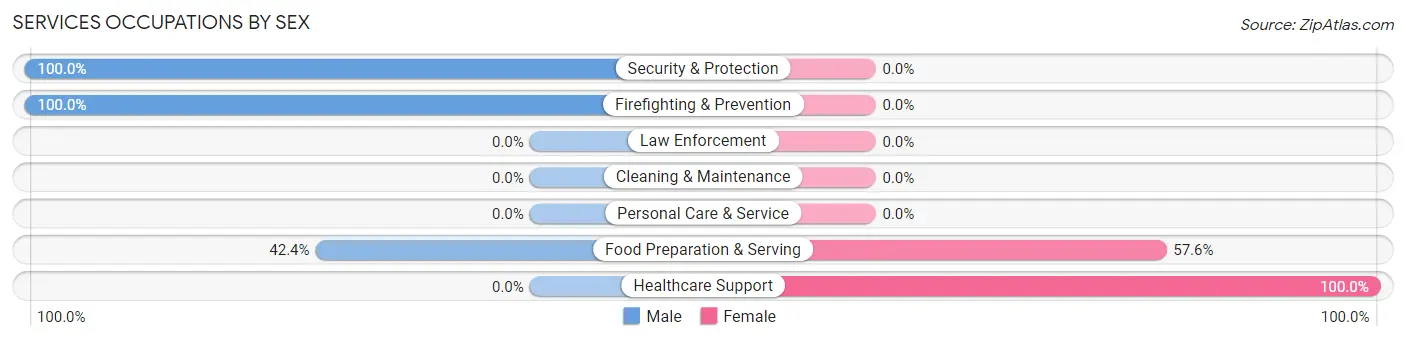
Services Occupations by Sex
Within the Services occupations in Desert Palms, the most male-oriented occupations are Security & Protection (100.0%), Firefighting & Prevention (100.0%), and Food Preparation & Serving (42.4%), while the most female-oriented occupations are Healthcare Support (100.0%), and Food Preparation & Serving (57.6%).
| Occupation | Male | Female |
| Healthcare Support | 0 (0.0%) | 71 (100.0%) |
| Security & Protection | 29 (100.0%) | 0 (0.0%) |
| Firefighting & Prevention | 29 (100.0%) | 0 (0.0%) |
| Law Enforcement | 0 (0.0%) | 0 (0.0%) |
| Food Preparation & Serving | 14 (42.4%) | 19 (57.6%) |
| Cleaning & Maintenance | 0 (0.0%) | 0 (0.0%) |
| Personal Care & Service | 0 (0.0%) | 0 (0.0%) |
| Total (Category) | 43 (32.3%) | 90 (67.7%) |
| Total (Overall) | 511 (47.4%) | 567 (52.6%) |
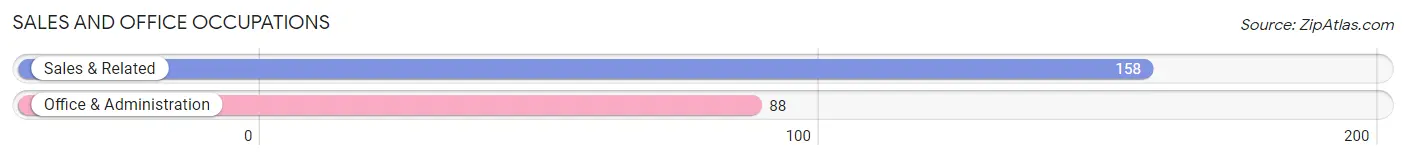
Sales and Office Occupations
The most common Sales and Office occupations in Desert Palms are Sales & Related (158 | 14.7%), and Office & Administration (88 | 8.2%).
Sales and Office Occupations by Sex
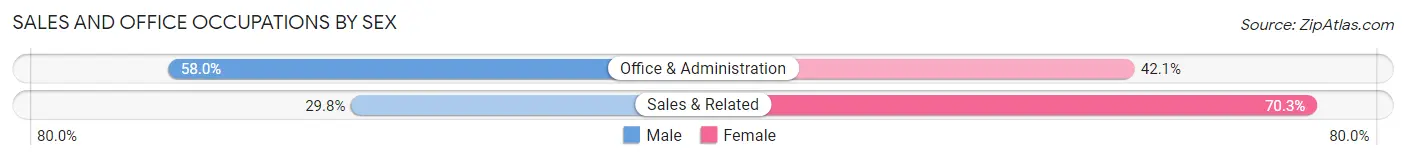
| Occupation | Male | Female |
| Sales & Related | 47 (29.7%) | 111 (70.3%) |
| Office & Administration | 51 (58.0%) | 37 (42.0%) |
| Total (Category) | 98 (39.8%) | 148 (60.2%) |
| Total (Overall) | 511 (47.4%) | 567 (52.6%) |
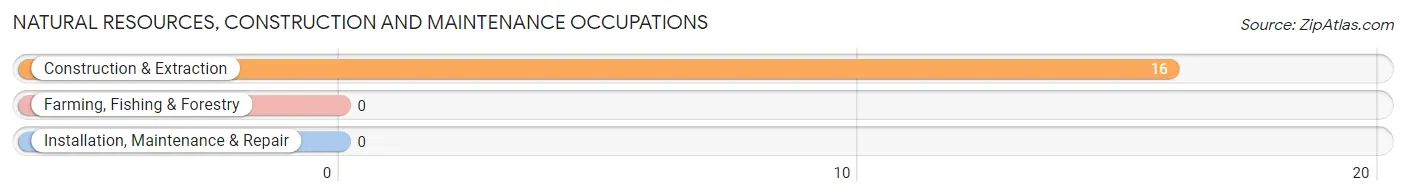
Natural Resources, Construction and Maintenance Occupations
The most common Natural Resources, Construction and Maintenance occupations in Desert Palms are , and Construction & Extraction (16 | 1.5%).
Natural Resources, Construction and Maintenance Occupations by Sex
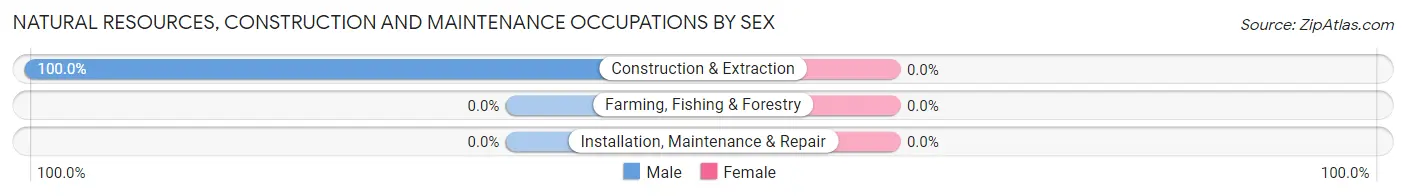
| Occupation | Male | Female |
| Farming, Fishing & Forestry | 0 (0.0%) | 0 (0.0%) |
| Construction & Extraction | 16 (100.0%) | 0 (0.0%) |
| Installation, Maintenance & Repair | 0 (0.0%) | 0 (0.0%) |
| Total (Category) | 16 (100.0%) | 0 (0.0%) |
| Total (Overall) | 511 (47.4%) | 567 (52.6%) |
Production, Transportation and Moving Occupations
The most common Production, Transportation and Moving occupations in Desert Palms are Material Moving (19 | 1.8%), and Production (10 | 0.9%).
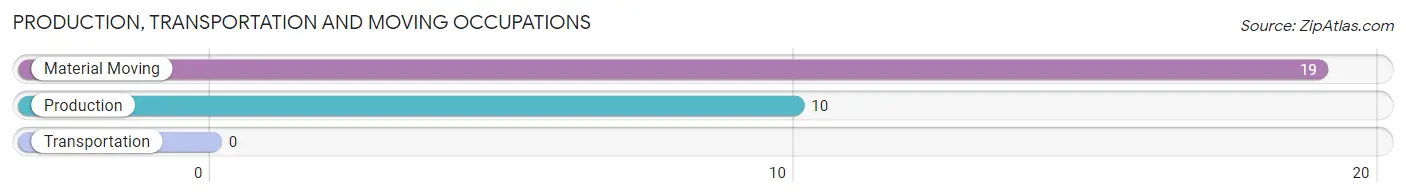
Production, Transportation and Moving Occupations by Sex
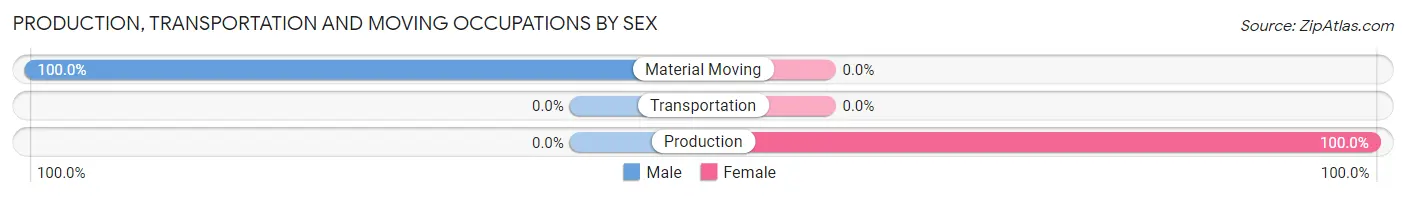
| Occupation | Male | Female |
| Production | 0 (0.0%) | 10 (100.0%) |
| Transportation | 0 (0.0%) | 0 (0.0%) |
| Material Moving | 19 (100.0%) | 0 (0.0%) |
| Total (Category) | 19 (65.5%) | 10 (34.5%) |
| Total (Overall) | 511 (47.4%) | 567 (52.6%) |
Employment Industries by Sex in Desert Palms
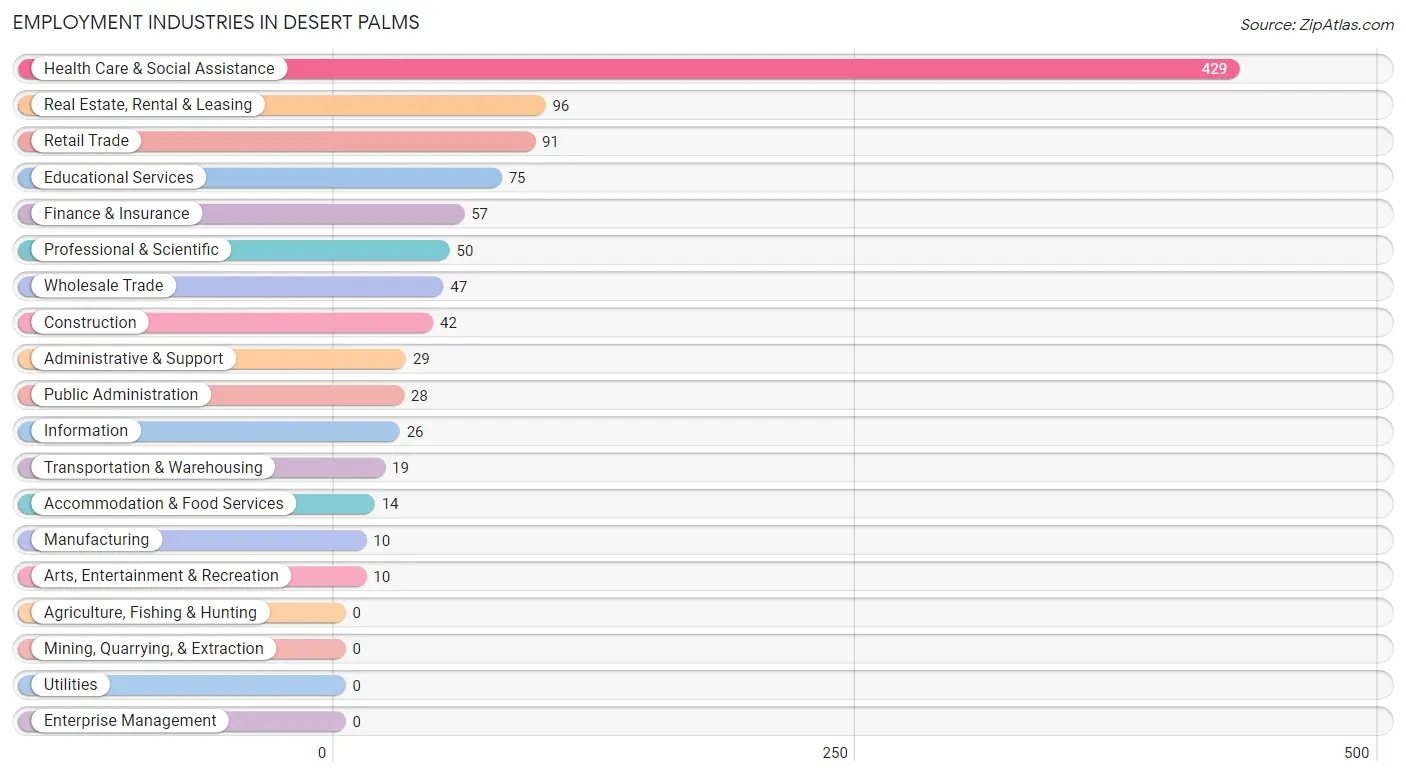
Employment Industries in Desert Palms
The major employment industries in Desert Palms include Health Care & Social Assistance (429 | 39.8%), Real Estate, Rental & Leasing (96 | 8.9%), Retail Trade (91 | 8.4%), Educational Services (75 | 7.0%), and Finance & Insurance (57 | 5.3%).
Employment Industries by Sex in Desert Palms
The Desert Palms industries that see more men than women are Construction (100.0%), Wholesale Trade (100.0%), and Transportation & Warehousing (100.0%), whereas the industries that tend to have a higher number of women are Manufacturing (100.0%), Retail Trade (100.0%), and Real Estate, Rental & Leasing (100.0%).
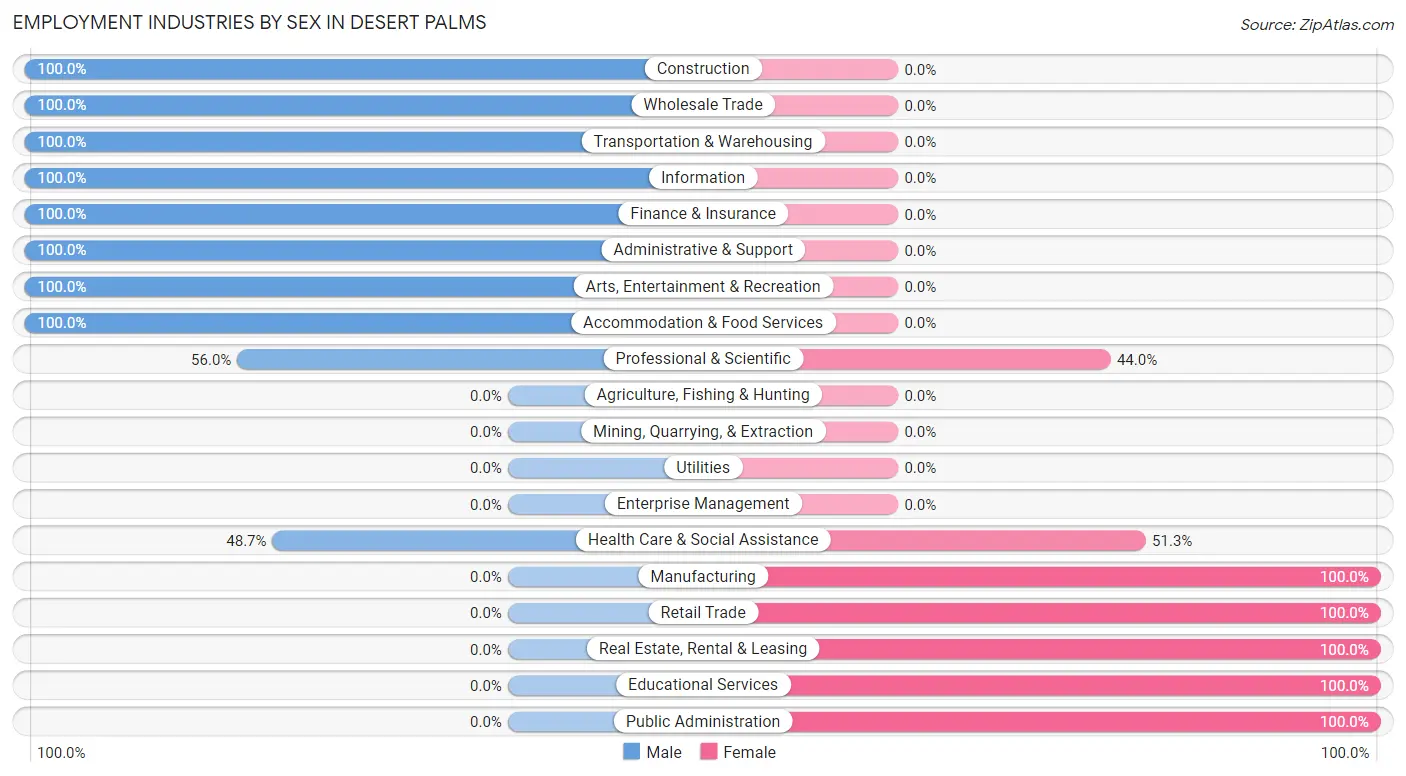
| Industry | Male | Female |
| Agriculture, Fishing & Hunting | 0 (0.0%) | 0 (0.0%) |
| Mining, Quarrying, & Extraction | 0 (0.0%) | 0 (0.0%) |
| Construction | 42 (100.0%) | 0 (0.0%) |
| Manufacturing | 0 (0.0%) | 10 (100.0%) |
| Wholesale Trade | 47 (100.0%) | 0 (0.0%) |
| Retail Trade | 0 (0.0%) | 91 (100.0%) |
| Transportation & Warehousing | 19 (100.0%) | 0 (0.0%) |
| Utilities | 0 (0.0%) | 0 (0.0%) |
| Information | 26 (100.0%) | 0 (0.0%) |
| Finance & Insurance | 57 (100.0%) | 0 (0.0%) |
| Real Estate, Rental & Leasing | 0 (0.0%) | 96 (100.0%) |
| Professional & Scientific | 28 (56.0%) | 22 (44.0%) |
| Enterprise Management | 0 (0.0%) | 0 (0.0%) |
| Administrative & Support | 29 (100.0%) | 0 (0.0%) |
| Educational Services | 0 (0.0%) | 75 (100.0%) |
| Health Care & Social Assistance | 209 (48.7%) | 220 (51.3%) |
| Arts, Entertainment & Recreation | 10 (100.0%) | 0 (0.0%) |
| Accommodation & Food Services | 14 (100.0%) | 0 (0.0%) |
| Public Administration | 0 (0.0%) | 28 (100.0%) |
| Total | 511 (47.4%) | 567 (52.6%) |
Education in Desert Palms
School Enrollment in Desert Palms
The most common levels of schooling among the 78 students in Desert Palms are college / undergraduate (43 | 55.1%), and graduate / professional (35 | 44.9%).
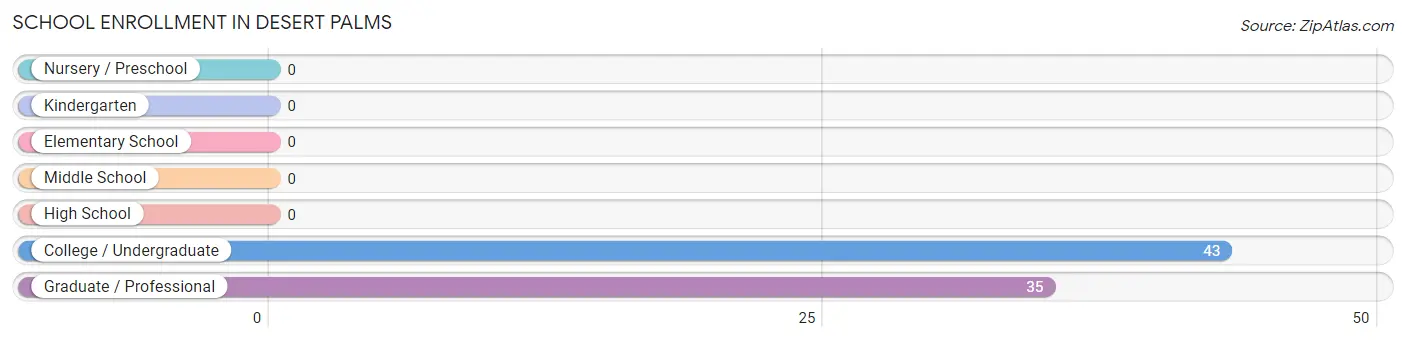
| School Level | # Students | % Students |
| Nursery / Preschool | 0 | 0.0% |
| Kindergarten | 0 | 0.0% |
| Elementary School | 0 | 0.0% |
| Middle School | 0 | 0.0% |
| High School | 0 | 0.0% |
| College / Undergraduate | 43 | 55.1% |
| Graduate / Professional | 35 | 44.9% |
| Total | 78 | 100.0% |
School Enrollment by Age by Funding Source in Desert Palms
Out of a total of 78 students who are enrolled in schools in Desert Palms, 57 (73.1%) attend a private institution, while the remaining 21 (26.9%) are enrolled in public schools. The age group of 35 years and over has the highest likelihood of being enrolled in private schools, with 57 (73.1% in the age bracket) enrolled. Conversely, the age group of 35 years and over has the lowest likelihood of being enrolled in a private school, with 21 (26.9% in the age bracket) attending a public institution.

| Age Bracket | Public School | Private School |
| 3 to 4 Year Olds | 0 (0.0%) | 0 (0.0%) |
| 5 to 9 Year Old | 0 (0.0%) | 0 (0.0%) |
| 10 to 14 Year Olds | 0 (0.0%) | 0 (0.0%) |
| 15 to 17 Year Olds | 0 (0.0%) | 0 (0.0%) |
| 18 to 19 Year Olds | 0 (0.0%) | 0 (0.0%) |
| 20 to 24 Year Olds | 0 (0.0%) | 0 (0.0%) |
| 25 to 34 Year Olds | 0 (0.0%) | 0 (0.0%) |
| 35 Years and over | 21 (26.9%) | 57 (73.1%) |
| Total | 21 (26.9%) | 57 (73.1%) |
Educational Attainment by Field of Study in Desert Palms
Education (630 | 20.1%), business (502 | 16.0%), communications (467 | 14.9%), social sciences (380 | 12.1%), and engineering (158 | 5.1%) are the most common fields of study among 3,130 individuals in Desert Palms who have obtained a bachelor's degree or higher.
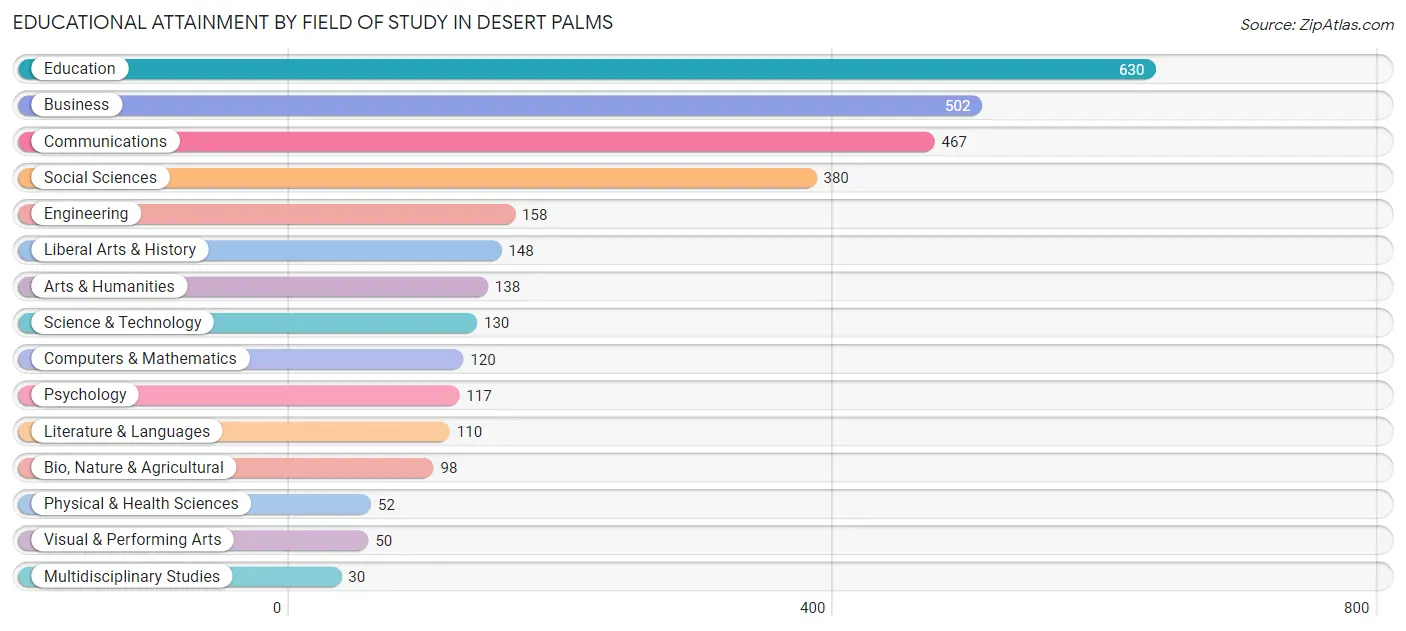
| Field of Study | # Graduates | % Graduates |
| Computers & Mathematics | 120 | 3.8% |
| Bio, Nature & Agricultural | 98 | 3.1% |
| Physical & Health Sciences | 52 | 1.7% |
| Psychology | 117 | 3.7% |
| Social Sciences | 380 | 12.1% |
| Engineering | 158 | 5.1% |
| Multidisciplinary Studies | 30 | 1.0% |
| Science & Technology | 130 | 4.2% |
| Business | 502 | 16.0% |
| Education | 630 | 20.1% |
| Literature & Languages | 110 | 3.5% |
| Liberal Arts & History | 148 | 4.7% |
| Visual & Performing Arts | 50 | 1.6% |
| Communications | 467 | 14.9% |
| Arts & Humanities | 138 | 4.4% |
| Total | 3,130 | 100.0% |
Transportation & Commute in Desert Palms
Vehicle Availability by Sex in Desert Palms
The most prevalent vehicle ownership categories in Desert Palms are males with 2 vehicles (323, accounting for 63.2%) and females with 2 vehicles (397, making up 59.6%).
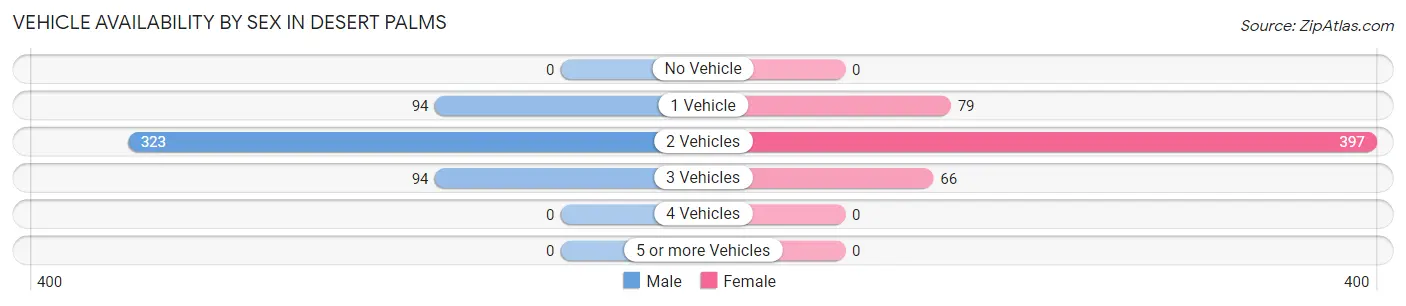
| Vehicles Available | Male | Female |
| No Vehicle | 0 (0.0%) | 0 (0.0%) |
| 1 Vehicle | 94 (18.4%) | 79 (14.6%) |
| 2 Vehicles | 323 (63.2%) | 397 (73.3%) |
| 3 Vehicles | 94 (18.4%) | 66 (12.2%) |
| 4 Vehicles | 0 (0.0%) | 0 (0.0%) |
| 5 or more Vehicles | 0 (0.0%) | 0 (0.0%) |
| Total | 511 (100.0%) | 542 (100.0%) |
Commute Time in Desert Palms
The most frequently occuring commute durations in Desert Palms are 10 to 14 minutes (272 commuters, 41.0%), 15 to 19 minutes (107 commuters, 16.1%), and 5 to 9 minutes (101 commuters, 15.2%).
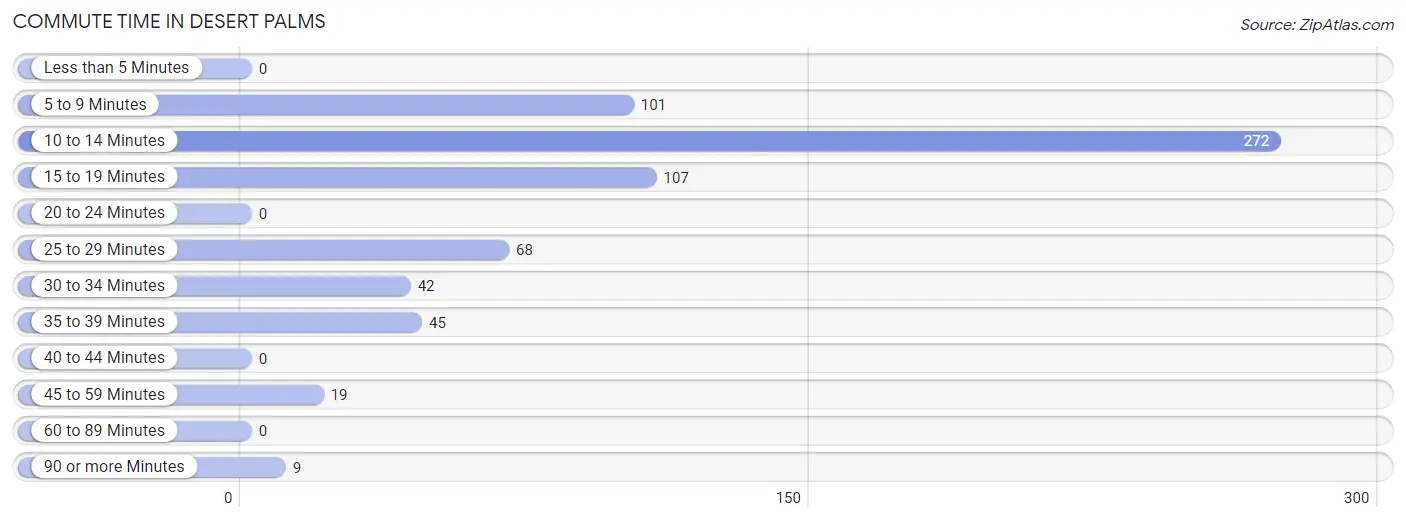
| Commute Time | # Commuters | % Commuters |
| Less than 5 Minutes | 0 | 0.0% |
| 5 to 9 Minutes | 101 | 15.2% |
| 10 to 14 Minutes | 272 | 41.0% |
| 15 to 19 Minutes | 107 | 16.1% |
| 20 to 24 Minutes | 0 | 0.0% |
| 25 to 29 Minutes | 68 | 10.3% |
| 30 to 34 Minutes | 42 | 6.3% |
| 35 to 39 Minutes | 45 | 6.8% |
| 40 to 44 Minutes | 0 | 0.0% |
| 45 to 59 Minutes | 19 | 2.9% |
| 60 to 89 Minutes | 0 | 0.0% |
| 90 or more Minutes | 9 | 1.4% |
Commute Time by Sex in Desert Palms
The most common commute times in Desert Palms are 10 to 14 minutes (225 commuters, 56.8%) for males and 5 to 9 minutes (75 commuters, 28.1%) for females.
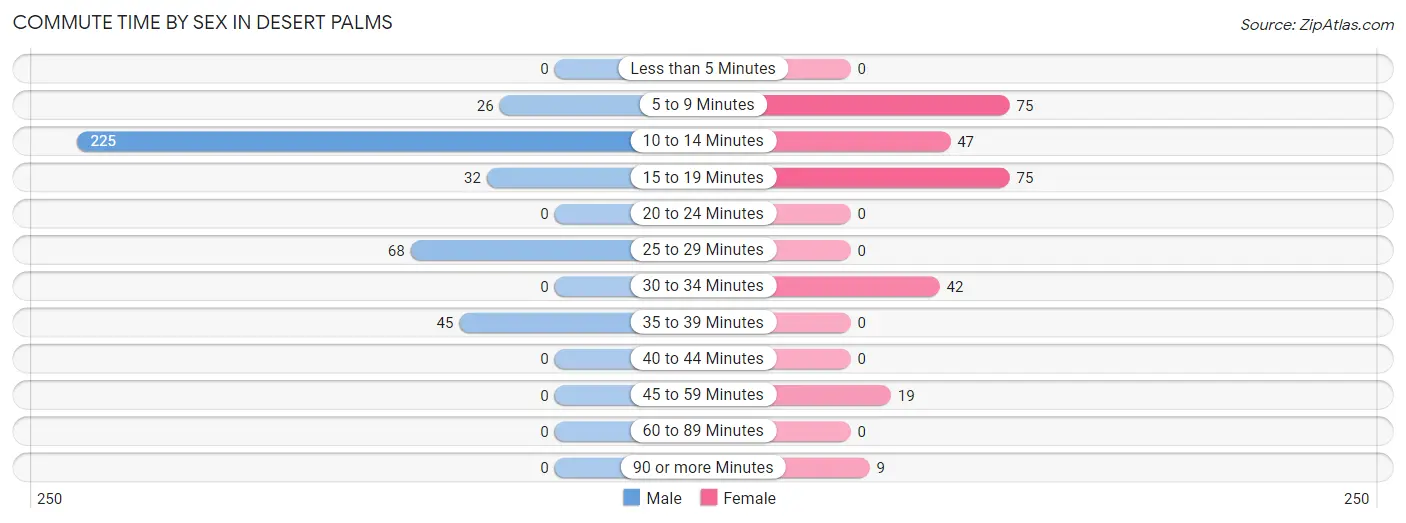
| Commute Time | Male | Female |
| Less than 5 Minutes | 0 (0.0%) | 0 (0.0%) |
| 5 to 9 Minutes | 26 (6.6%) | 75 (28.1%) |
| 10 to 14 Minutes | 225 (56.8%) | 47 (17.6%) |
| 15 to 19 Minutes | 32 (8.1%) | 75 (28.1%) |
| 20 to 24 Minutes | 0 (0.0%) | 0 (0.0%) |
| 25 to 29 Minutes | 68 (17.2%) | 0 (0.0%) |
| 30 to 34 Minutes | 0 (0.0%) | 42 (15.7%) |
| 35 to 39 Minutes | 45 (11.4%) | 0 (0.0%) |
| 40 to 44 Minutes | 0 (0.0%) | 0 (0.0%) |
| 45 to 59 Minutes | 0 (0.0%) | 19 (7.1%) |
| 60 to 89 Minutes | 0 (0.0%) | 0 (0.0%) |
| 90 or more Minutes | 0 (0.0%) | 9 (3.4%) |
Time of Departure to Work by Sex in Desert Palms
The most frequent times of departure to work in Desert Palms are 6:30 AM to 6:59 AM (178, 45.0%) for males and 7:30 AM to 7:59 AM (92, 34.5%) for females.
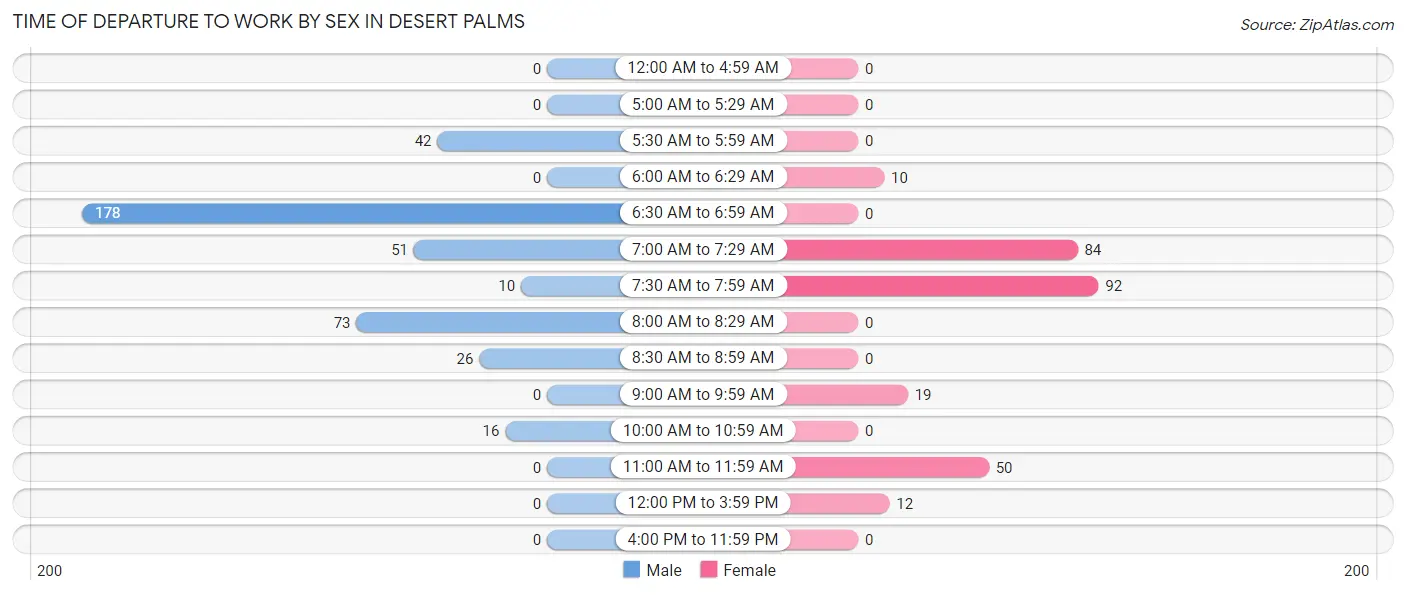
| Time of Departure | Male | Female |
| 12:00 AM to 4:59 AM | 0 (0.0%) | 0 (0.0%) |
| 5:00 AM to 5:29 AM | 0 (0.0%) | 0 (0.0%) |
| 5:30 AM to 5:59 AM | 42 (10.6%) | 0 (0.0%) |
| 6:00 AM to 6:29 AM | 0 (0.0%) | 10 (3.7%) |
| 6:30 AM to 6:59 AM | 178 (45.0%) | 0 (0.0%) |
| 7:00 AM to 7:29 AM | 51 (12.9%) | 84 (31.5%) |
| 7:30 AM to 7:59 AM | 10 (2.5%) | 92 (34.5%) |
| 8:00 AM to 8:29 AM | 73 (18.4%) | 0 (0.0%) |
| 8:30 AM to 8:59 AM | 26 (6.6%) | 0 (0.0%) |
| 9:00 AM to 9:59 AM | 0 (0.0%) | 19 (7.1%) |
| 10:00 AM to 10:59 AM | 16 (4.0%) | 0 (0.0%) |
| 11:00 AM to 11:59 AM | 0 (0.0%) | 50 (18.7%) |
| 12:00 PM to 3:59 PM | 0 (0.0%) | 12 (4.5%) |
| 4:00 PM to 11:59 PM | 0 (0.0%) | 0 (0.0%) |
| Total | 396 (100.0%) | 267 (100.0%) |
Housing Occupancy in Desert Palms
Occupancy by Ownership in Desert Palms
Of the total 3,749 dwellings in Desert Palms, owner-occupied units account for 3,127 (83.4%), while renter-occupied units make up 622 (16.6%).
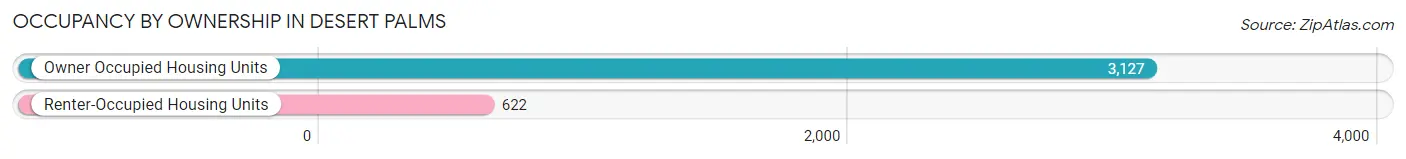
| Occupancy | # Housing Units | % Housing Units |
| Owner Occupied Housing Units | 3,127 | 83.4% |
| Renter-Occupied Housing Units | 622 | 16.6% |
| Total Occupied Housing Units | 3,749 | 100.0% |
Occupancy by Household Size in Desert Palms
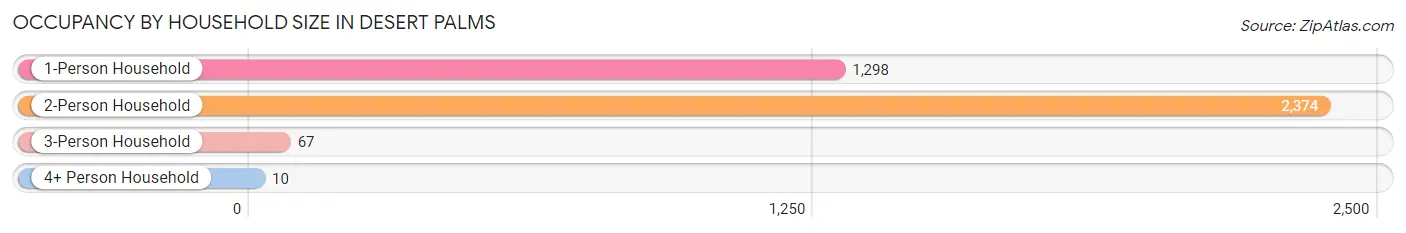
| Household Size | # Housing Units | % Housing Units |
| 1-Person Household | 1,298 | 34.6% |
| 2-Person Household | 2,374 | 63.3% |
| 3-Person Household | 67 | 1.8% |
| 4+ Person Household | 10 | 0.3% |
| Total Housing Units | 3,749 | 100.0% |
Occupancy by Ownership by Household Size in Desert Palms
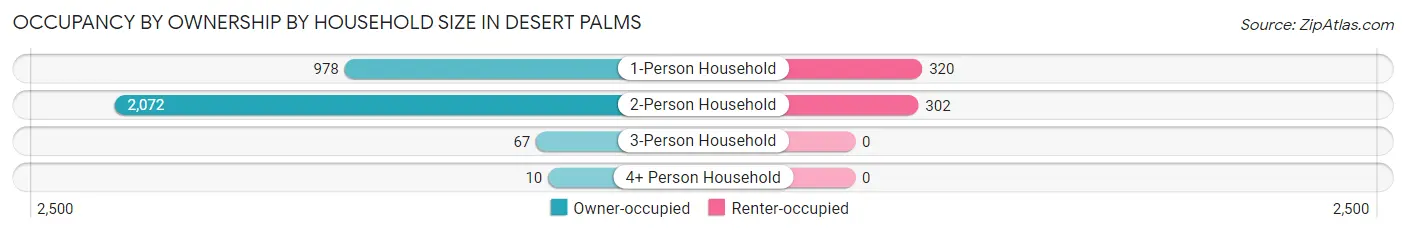
| Household Size | Owner-occupied | Renter-occupied |
| 1-Person Household | 978 (75.3%) | 320 (24.6%) |
| 2-Person Household | 2,072 (87.3%) | 302 (12.7%) |
| 3-Person Household | 67 (100.0%) | 0 (0.0%) |
| 4+ Person Household | 10 (100.0%) | 0 (0.0%) |
| Total Housing Units | 3,127 (83.4%) | 622 (16.6%) |
Occupancy by Educational Attainment in Desert Palms
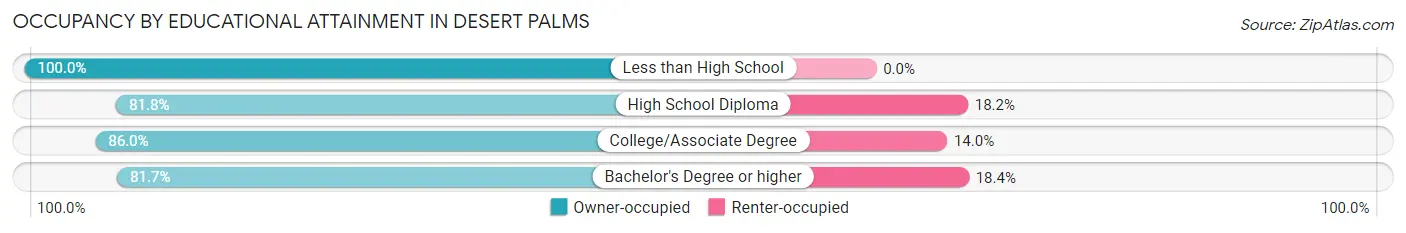
| Household Size | Owner-occupied | Renter-occupied |
| Less than High School | 54 (100.0%) | 0 (0.0%) |
| High School Diploma | 437 (81.8%) | 97 (18.2%) |
| College/Associate Degree | 1,096 (86.0%) | 179 (14.0%) |
| Bachelor's Degree or higher | 1,540 (81.7%) | 346 (18.3%) |
Occupancy by Age of Householder in Desert Palms
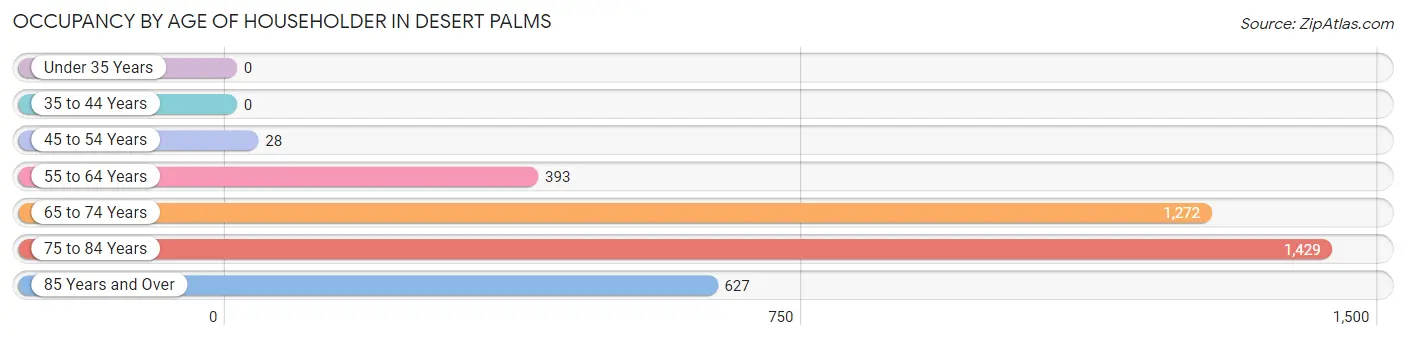
| Age Bracket | # Households | % Households |
| Under 35 Years | 0 | 0.0% |
| 35 to 44 Years | 0 | 0.0% |
| 45 to 54 Years | 28 | 0.7% |
| 55 to 64 Years | 393 | 10.5% |
| 65 to 74 Years | 1,272 | 33.9% |
| 75 to 84 Years | 1,429 | 38.1% |
| 85 Years and Over | 627 | 16.7% |
| Total | 3,749 | 100.0% |
Housing Finances in Desert Palms
Median Income by Occupancy in Desert Palms
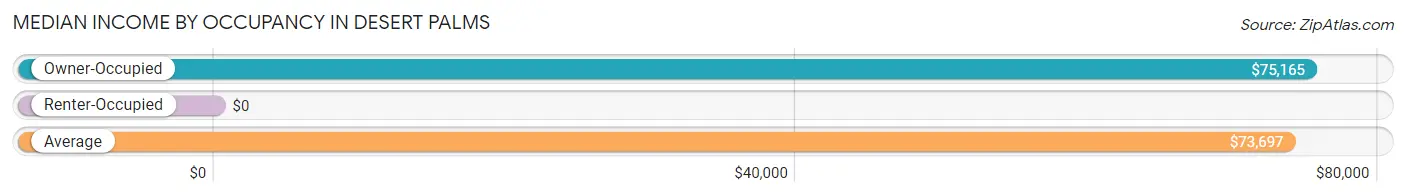
| Occupancy Type | # Households | Median Income |
| Owner-Occupied | 3,127 (83.4%) | $75,165 |
| Renter-Occupied | 622 (16.6%) | $0 |
| Average | 3,749 (100.0%) | $73,697 |
Occupancy by Householder Income Bracket in Desert Palms
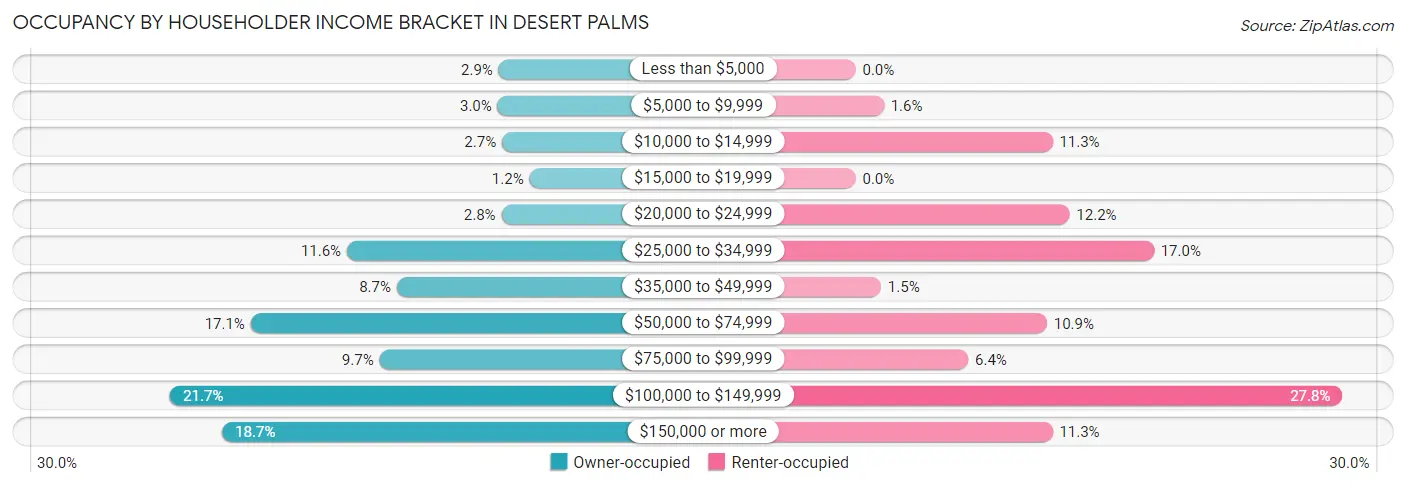
| Income Bracket | Owner-occupied | Renter-occupied |
| Less than $5,000 | 91 (2.9%) | 0 (0.0%) |
| $5,000 to $9,999 | 93 (3.0%) | 10 (1.6%) |
| $10,000 to $14,999 | 85 (2.7%) | 70 (11.3%) |
| $15,000 to $19,999 | 36 (1.1%) | 0 (0.0%) |
| $20,000 to $24,999 | 86 (2.8%) | 76 (12.2%) |
| $25,000 to $34,999 | 362 (11.6%) | 106 (17.0%) |
| $35,000 to $49,999 | 273 (8.7%) | 9 (1.5%) |
| $50,000 to $74,999 | 534 (17.1%) | 68 (10.9%) |
| $75,000 to $99,999 | 304 (9.7%) | 40 (6.4%) |
| $100,000 to $149,999 | 678 (21.7%) | 173 (27.8%) |
| $150,000 or more | 585 (18.7%) | 70 (11.3%) |
| Total | 3,127 (100.0%) | 622 (100.0%) |
Monthly Housing Cost Tiers in Desert Palms
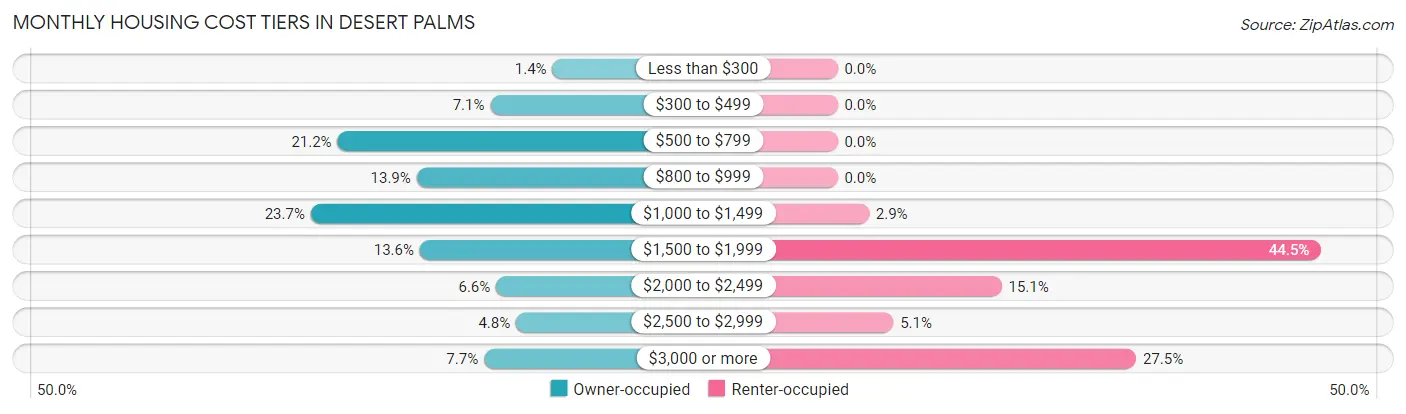
| Monthly Cost | Owner-occupied | Renter-occupied |
| Less than $300 | 44 (1.4%) | 0 (0.0%) |
| $300 to $499 | 223 (7.1%) | 0 (0.0%) |
| $500 to $799 | 663 (21.2%) | 0 (0.0%) |
| $800 to $999 | 435 (13.9%) | 0 (0.0%) |
| $1,000 to $1,499 | 740 (23.7%) | 18 (2.9%) |
| $1,500 to $1,999 | 426 (13.6%) | 277 (44.5%) |
| $2,000 to $2,499 | 206 (6.6%) | 94 (15.1%) |
| $2,500 to $2,999 | 149 (4.8%) | 32 (5.1%) |
| $3,000 or more | 241 (7.7%) | 171 (27.5%) |
| Total | 3,127 (100.0%) | 622 (100.0%) |
Physical Housing Characteristics in Desert Palms
Housing Structures in Desert Palms
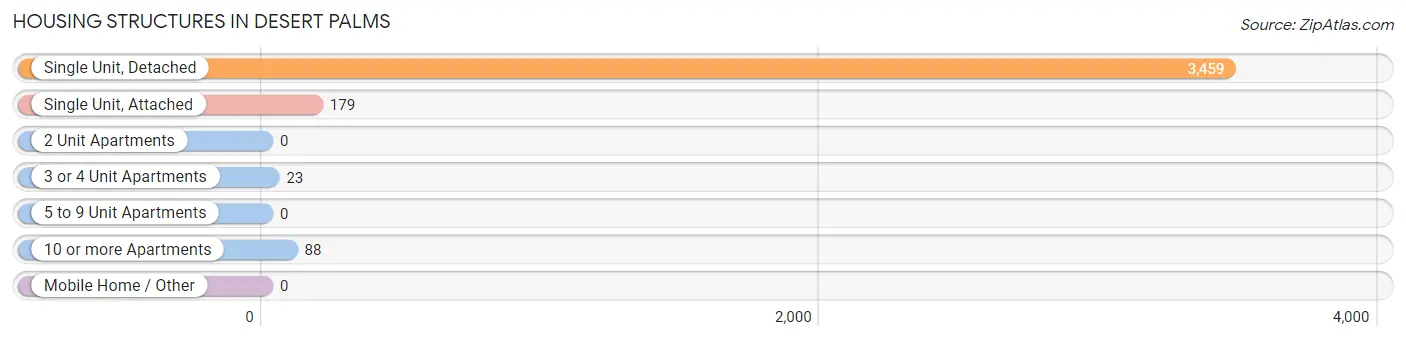
| Structure Type | # Housing Units | % Housing Units |
| Single Unit, Detached | 3,459 | 92.3% |
| Single Unit, Attached | 179 | 4.8% |
| 2 Unit Apartments | 0 | 0.0% |
| 3 or 4 Unit Apartments | 23 | 0.6% |
| 5 to 9 Unit Apartments | 0 | 0.0% |
| 10 or more Apartments | 88 | 2.4% |
| Mobile Home / Other | 0 | 0.0% |
| Total | 3,749 | 100.0% |
Housing Structures by Occupancy in Desert Palms
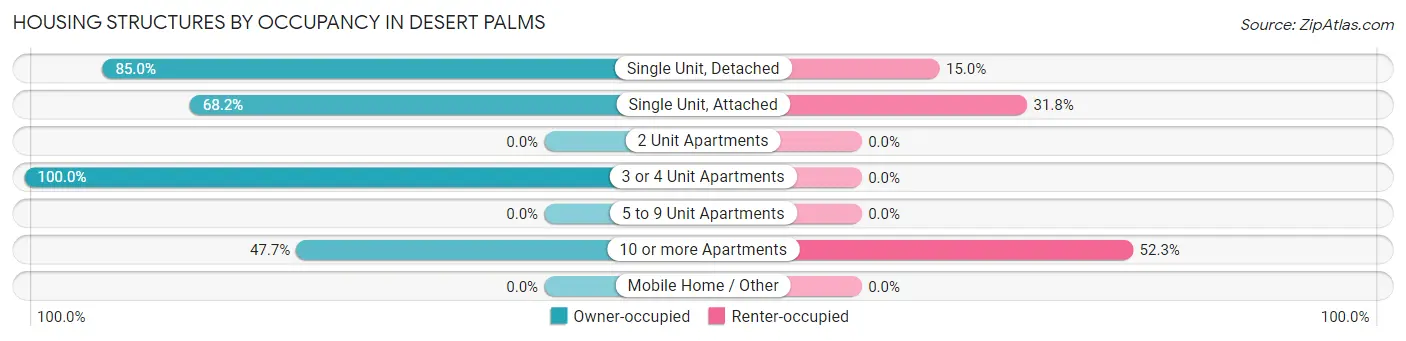
| Structure Type | Owner-occupied | Renter-occupied |
| Single Unit, Detached | 2,940 (85.0%) | 519 (15.0%) |
| Single Unit, Attached | 122 (68.2%) | 57 (31.8%) |
| 2 Unit Apartments | 0 (0.0%) | 0 (0.0%) |
| 3 or 4 Unit Apartments | 23 (100.0%) | 0 (0.0%) |
| 5 to 9 Unit Apartments | 0 (0.0%) | 0 (0.0%) |
| 10 or more Apartments | 42 (47.7%) | 46 (52.3%) |
| Mobile Home / Other | 0 (0.0%) | 0 (0.0%) |
| Total | 3,127 (83.4%) | 622 (16.6%) |
Housing Structures by Number of Rooms in Desert Palms
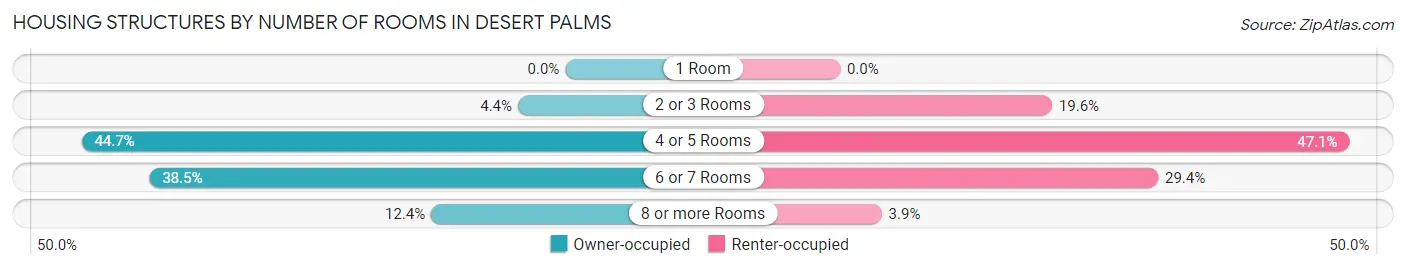
| Number of Rooms | Owner-occupied | Renter-occupied |
| 1 Room | 0 (0.0%) | 0 (0.0%) |
| 2 or 3 Rooms | 137 (4.4%) | 122 (19.6%) |
| 4 or 5 Rooms | 1,399 (44.7%) | 293 (47.1%) |
| 6 or 7 Rooms | 1,203 (38.5%) | 183 (29.4%) |
| 8 or more Rooms | 388 (12.4%) | 24 (3.9%) |
| Total | 3,127 (100.0%) | 622 (100.0%) |
Housing Structure by Heating Type in Desert Palms
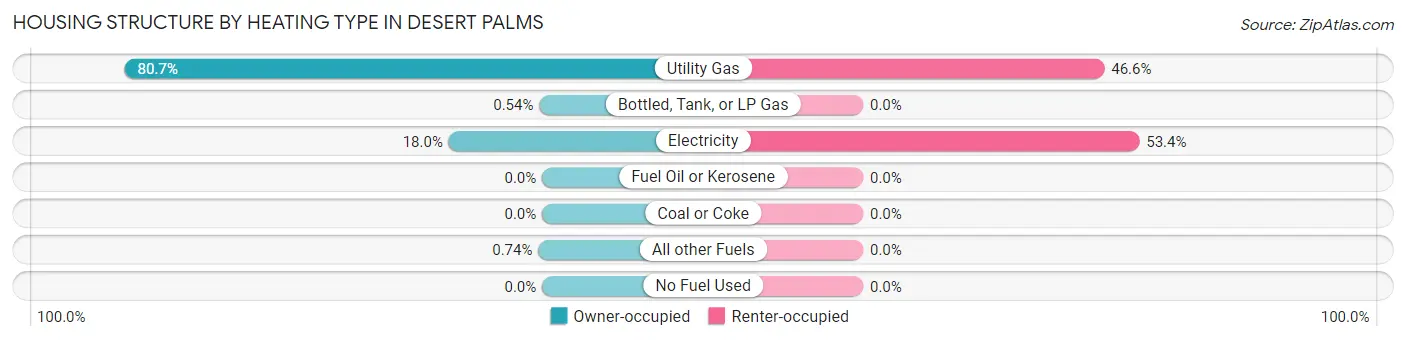
| Heating Type | Owner-occupied | Renter-occupied |
| Utility Gas | 2,523 (80.7%) | 290 (46.6%) |
| Bottled, Tank, or LP Gas | 17 (0.5%) | 0 (0.0%) |
| Electricity | 564 (18.0%) | 332 (53.4%) |
| Fuel Oil or Kerosene | 0 (0.0%) | 0 (0.0%) |
| Coal or Coke | 0 (0.0%) | 0 (0.0%) |
| All other Fuels | 23 (0.7%) | 0 (0.0%) |
| No Fuel Used | 0 (0.0%) | 0 (0.0%) |
| Total | 3,127 (100.0%) | 622 (100.0%) |
Household Vehicle Usage in Desert Palms
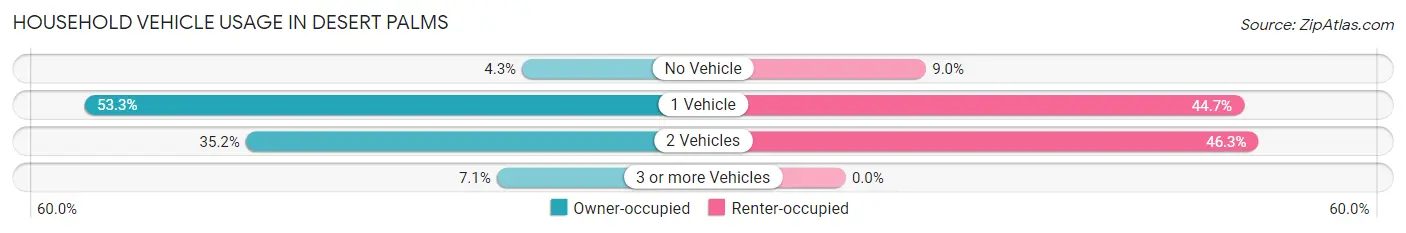
| Vehicles per Household | Owner-occupied | Renter-occupied |
| No Vehicle | 134 (4.3%) | 56 (9.0%) |
| 1 Vehicle | 1,668 (53.3%) | 278 (44.7%) |
| 2 Vehicles | 1,102 (35.2%) | 288 (46.3%) |
| 3 or more Vehicles | 223 (7.1%) | 0 (0.0%) |
| Total | 3,127 (100.0%) | 622 (100.0%) |
Real Estate & Mortgages in Desert Palms
Real Estate and Mortgage Overview in Desert Palms
| Characteristic | Without Mortgage | With Mortgage |
| Housing Units | 1,838 | 1,289 |
| Median Property Value | $470,300 | $460,600 |
| Median Household Income | $70,660 | $188 |
| Monthly Housing Costs | $812 | $216 |
| Real Estate Taxes | $4,948 | $25 |
Property Value by Mortgage Status in Desert Palms
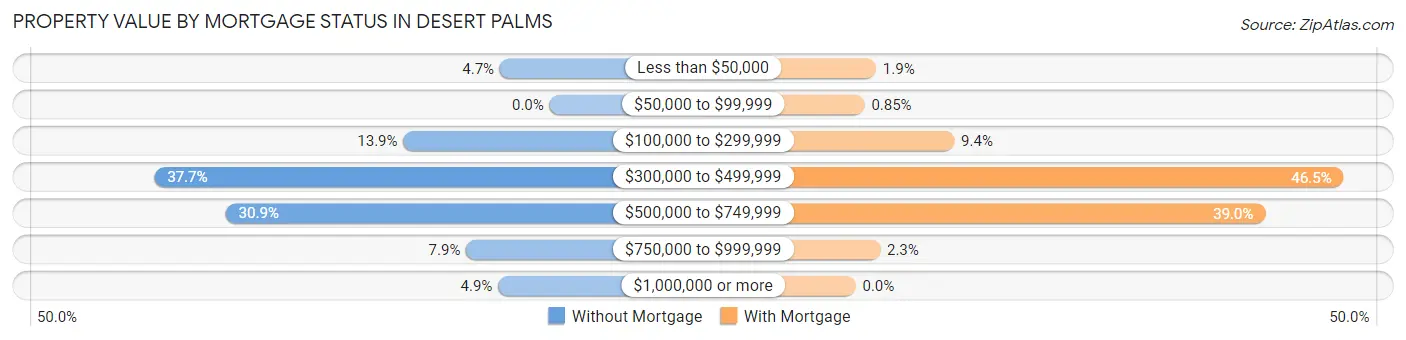
| Property Value | Without Mortgage | With Mortgage |
| Less than $50,000 | 87 (4.7%) | 25 (1.9%) |
| $50,000 to $99,999 | 0 (0.0%) | 11 (0.9%) |
| $100,000 to $299,999 | 256 (13.9%) | 121 (9.4%) |
| $300,000 to $499,999 | 692 (37.7%) | 599 (46.5%) |
| $500,000 to $749,999 | 567 (30.8%) | 503 (39.0%) |
| $750,000 to $999,999 | 146 (7.9%) | 30 (2.3%) |
| $1,000,000 or more | 90 (4.9%) | 0 (0.0%) |
| Total | 1,838 (100.0%) | 1,289 (100.0%) |
Household Income by Mortgage Status in Desert Palms
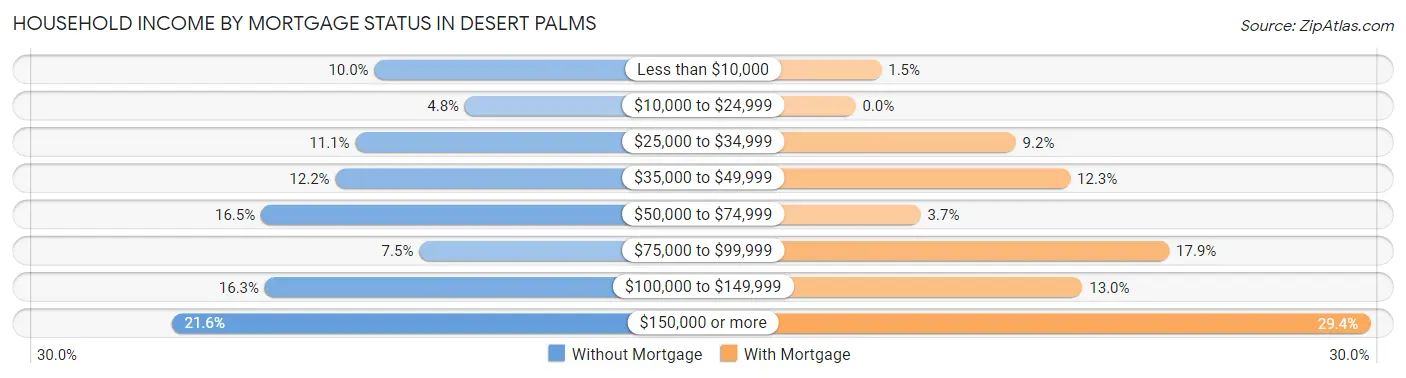
| Household Income | Without Mortgage | With Mortgage |
| Less than $10,000 | 184 (10.0%) | 19 (1.5%) |
| $10,000 to $24,999 | 89 (4.8%) | 0 (0.0%) |
| $25,000 to $34,999 | 204 (11.1%) | 118 (9.1%) |
| $35,000 to $49,999 | 225 (12.2%) | 158 (12.3%) |
| $50,000 to $74,999 | 303 (16.5%) | 48 (3.7%) |
| $75,000 to $99,999 | 137 (7.4%) | 231 (17.9%) |
| $100,000 to $149,999 | 299 (16.3%) | 167 (13.0%) |
| $150,000 or more | 397 (21.6%) | 379 (29.4%) |
| Total | 1,838 (100.0%) | 1,289 (100.0%) |
Property Value to Household Income Ratio in Desert Palms
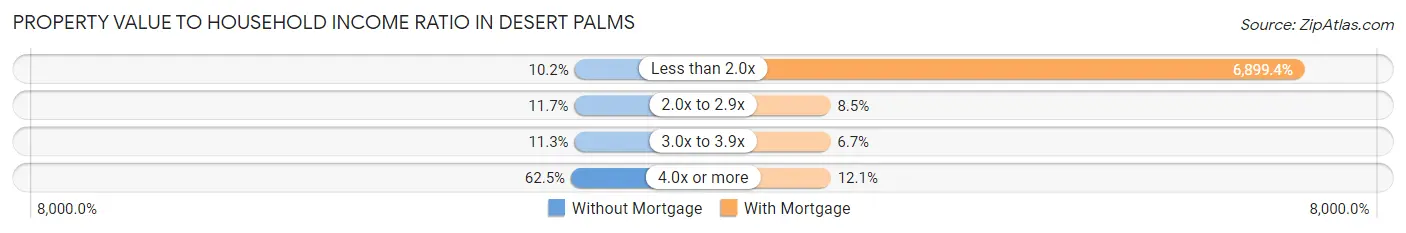
| Value-to-Income Ratio | Without Mortgage | With Mortgage |
| Less than 2.0x | 187 (10.2%) | 88,933 (6,899.4%) |
| 2.0x to 2.9x | 215 (11.7%) | 109 (8.5%) |
| 3.0x to 3.9x | 207 (11.3%) | 86 (6.7%) |
| 4.0x or more | 1,149 (62.5%) | 156 (12.1%) |
| Total | 1,838 (100.0%) | 1,289 (100.0%) |
Real Estate Taxes by Mortgage Status in Desert Palms
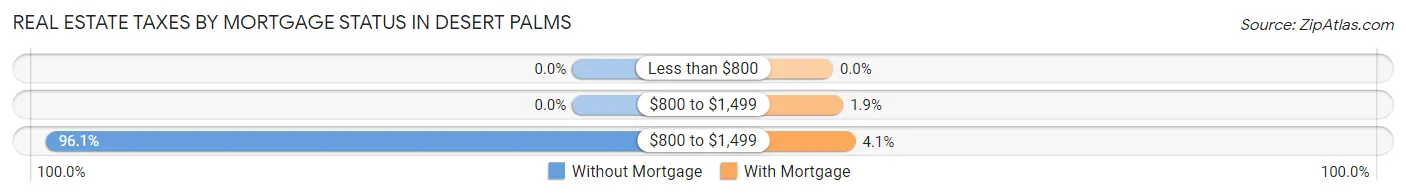
| Property Taxes | Without Mortgage | With Mortgage |
| Less than $800 | 0 (0.0%) | 0 (0.0%) |
| $800 to $1,499 | 0 (0.0%) | 24 (1.9%) |
| $800 to $1,499 | 1,767 (96.1%) | 53 (4.1%) |
| Total | 1,838 (100.0%) | 1,289 (100.0%) |
Health & Disability in Desert Palms
Health Insurance Coverage by Age in Desert Palms
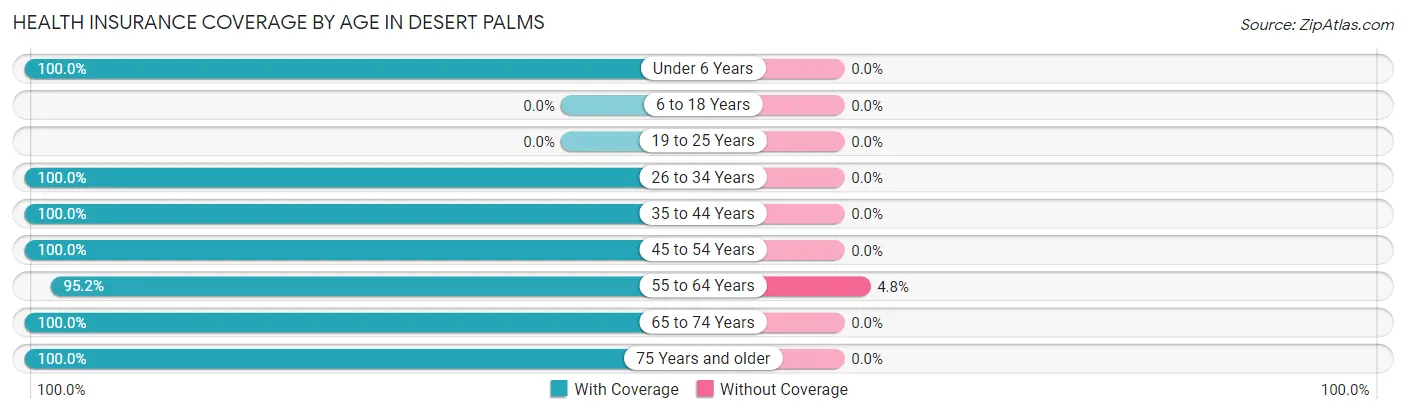
| Age Bracket | With Coverage | Without Coverage |
| Under 6 Years | 13 (100.0%) | 0 (0.0%) |
| 6 to 18 Years | 0 (0.0%) | 0 (0.0%) |
| 19 to 25 Years | 0 (0.0%) | 0 (0.0%) |
| 26 to 34 Years | 14 (100.0%) | 0 (0.0%) |
| 35 to 44 Years | 29 (100.0%) | 0 (0.0%) |
| 45 to 54 Years | 103 (100.0%) | 0 (0.0%) |
| 55 to 64 Years | 846 (95.2%) | 43 (4.8%) |
| 65 to 74 Years | 1,995 (100.0%) | 0 (0.0%) |
| 75 Years and older | 3,371 (100.0%) | 0 (0.0%) |
| Total | 6,371 (99.3%) | 43 (0.7%) |
Health Insurance Coverage by Citizenship Status in Desert Palms
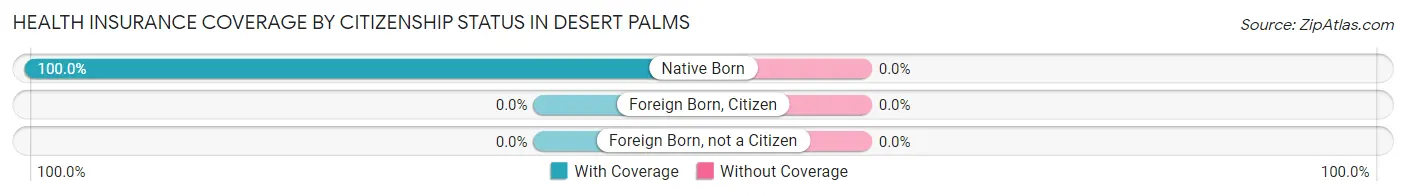
| Citizenship Status | With Coverage | Without Coverage |
| Native Born | 13 (100.0%) | 0 (0.0%) |
| Foreign Born, Citizen | 0 (0.0%) | 0 (0.0%) |
| Foreign Born, not a Citizen | 0 (0.0%) | 0 (0.0%) |
Health Insurance Coverage by Household Income in Desert Palms
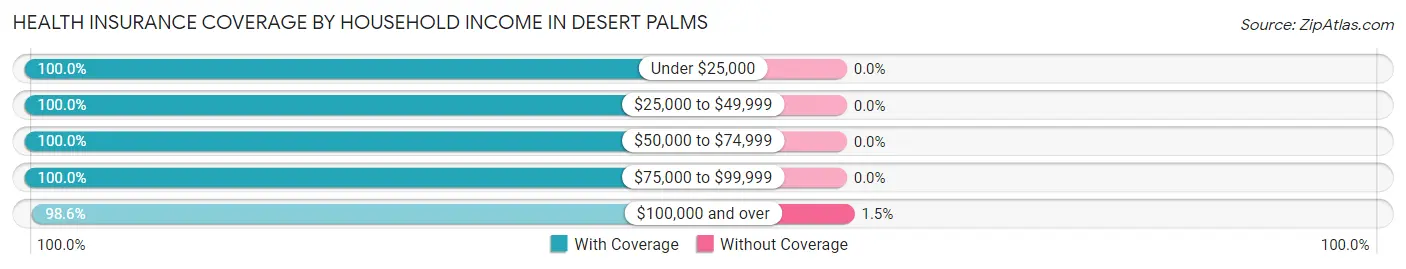
| Household Income | With Coverage | Without Coverage |
| Under $25,000 | 751 (100.0%) | 0 (0.0%) |
| $25,000 to $49,999 | 1,013 (100.0%) | 0 (0.0%) |
| $50,000 to $74,999 | 1,034 (100.0%) | 0 (0.0%) |
| $75,000 to $99,999 | 645 (100.0%) | 0 (0.0%) |
| $100,000 and over | 2,928 (98.6%) | 43 (1.5%) |
Public vs Private Health Insurance Coverage by Age in Desert Palms
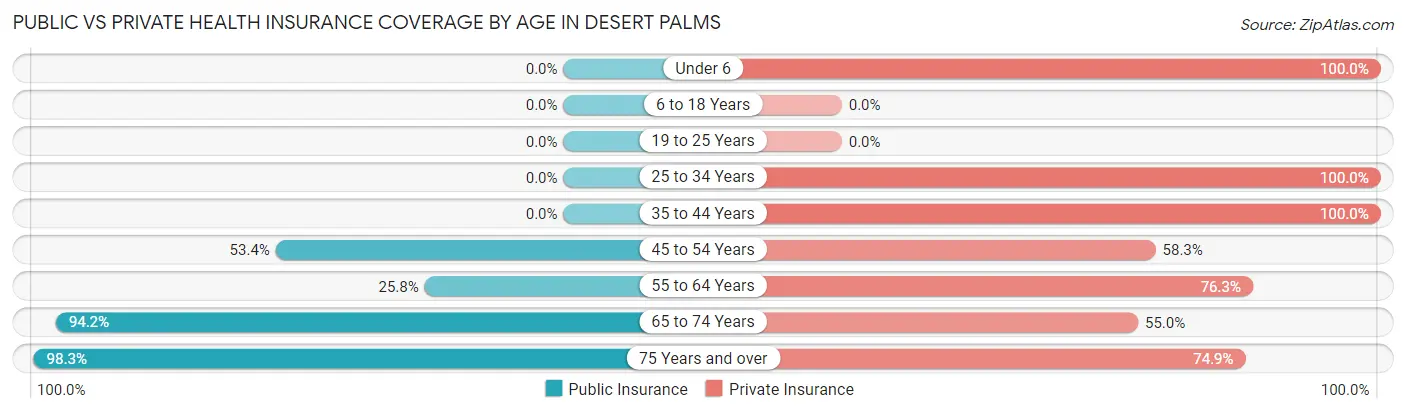
| Age Bracket | Public Insurance | Private Insurance |
| Under 6 | 0 (0.0%) | 13 (100.0%) |
| 6 to 18 Years | 0 (0.0%) | 0 (0.0%) |
| 19 to 25 Years | 0 (0.0%) | 0 (0.0%) |
| 25 to 34 Years | 0 (0.0%) | 14 (100.0%) |
| 35 to 44 Years | 0 (0.0%) | 29 (100.0%) |
| 45 to 54 Years | 55 (53.4%) | 60 (58.3%) |
| 55 to 64 Years | 229 (25.8%) | 678 (76.3%) |
| 65 to 74 Years | 1,879 (94.2%) | 1,097 (55.0%) |
| 75 Years and over | 3,314 (98.3%) | 2,525 (74.9%) |
| Total | 5,477 (85.4%) | 4,416 (68.9%) |
Disability Status by Sex by Age in Desert Palms
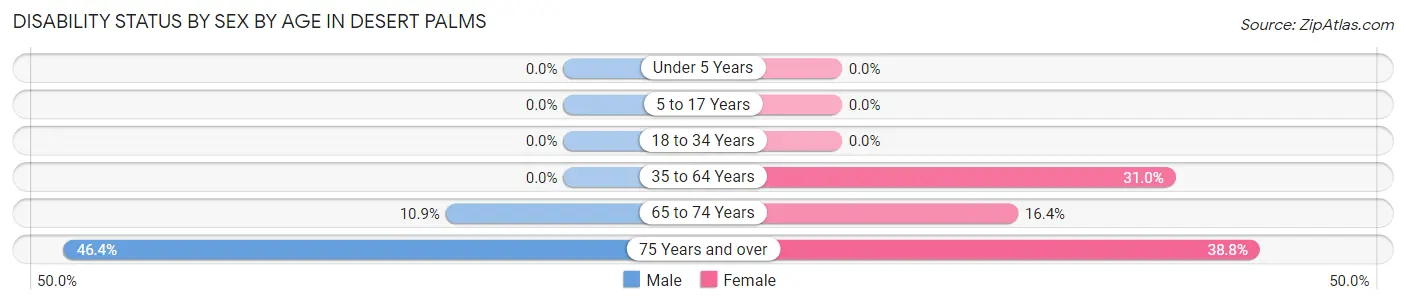
| Age Bracket | Male | Female |
| Under 5 Years | 0 (0.0%) | 0 (0.0%) |
| 5 to 17 Years | 0 (0.0%) | 0 (0.0%) |
| 18 to 34 Years | 0 (0.0%) | 0 (0.0%) |
| 35 to 64 Years | 0 (0.0%) | 188 (31.0%) |
| 65 to 74 Years | 97 (10.9%) | 181 (16.4%) |
| 75 Years and over | 725 (46.4%) | 701 (38.8%) |
Disability Class by Sex by Age in Desert Palms
Disability Class: Hearing Difficulty
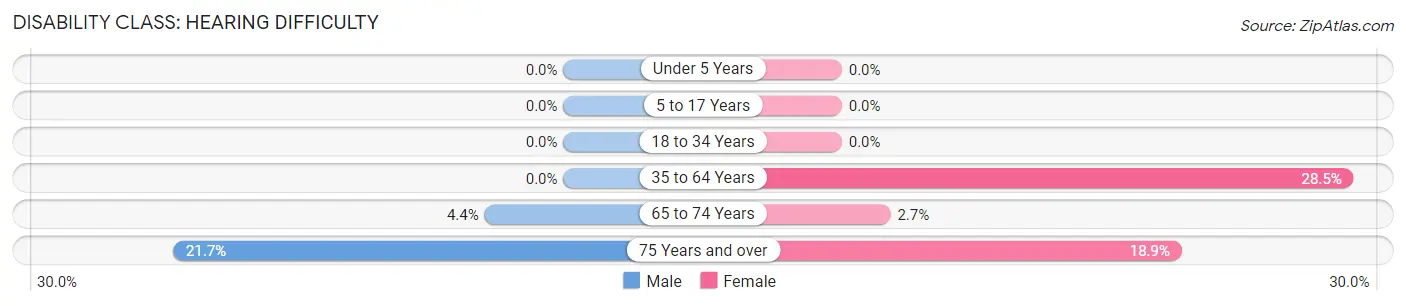
| Age Bracket | Male | Female |
| Under 5 Years | 0 (0.0%) | 0 (0.0%) |
| 5 to 17 Years | 0 (0.0%) | 0 (0.0%) |
| 18 to 34 Years | 0 (0.0%) | 0 (0.0%) |
| 35 to 64 Years | 0 (0.0%) | 173 (28.5%) |
| 65 to 74 Years | 39 (4.4%) | 30 (2.7%) |
| 75 Years and over | 340 (21.7%) | 342 (18.9%) |
Disability Class: Vision Difficulty
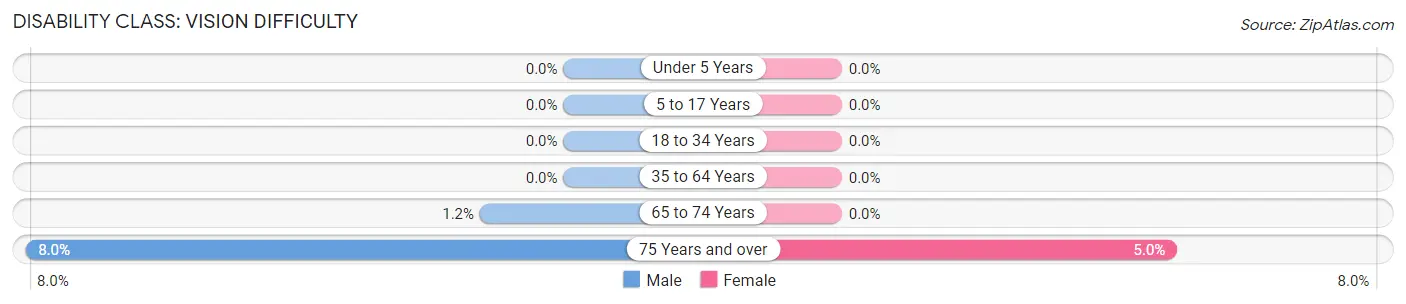
| Age Bracket | Male | Female |
| Under 5 Years | 0 (0.0%) | 0 (0.0%) |
| 5 to 17 Years | 0 (0.0%) | 0 (0.0%) |
| 18 to 34 Years | 0 (0.0%) | 0 (0.0%) |
| 35 to 64 Years | 0 (0.0%) | 0 (0.0%) |
| 65 to 74 Years | 11 (1.2%) | 0 (0.0%) |
| 75 Years and over | 125 (8.0%) | 90 (5.0%) |
Disability Class: Cognitive Difficulty
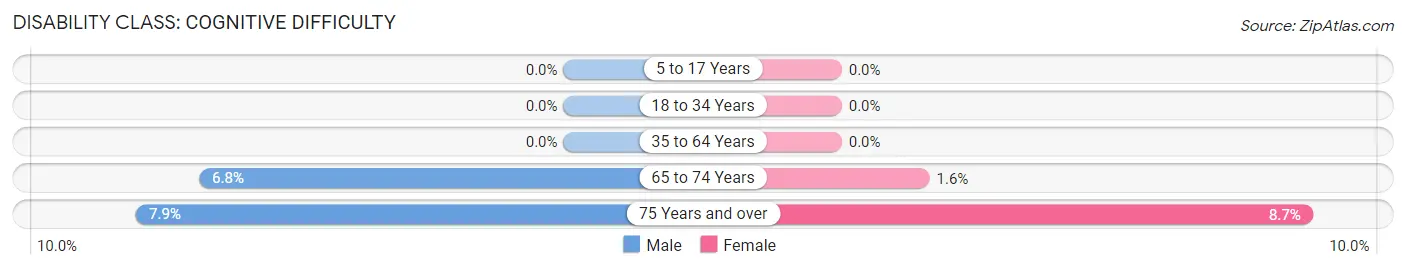
| Age Bracket | Male | Female |
| 5 to 17 Years | 0 (0.0%) | 0 (0.0%) |
| 18 to 34 Years | 0 (0.0%) | 0 (0.0%) |
| 35 to 64 Years | 0 (0.0%) | 0 (0.0%) |
| 65 to 74 Years | 60 (6.8%) | 18 (1.6%) |
| 75 Years and over | 124 (7.9%) | 158 (8.7%) |
Disability Class: Ambulatory Difficulty
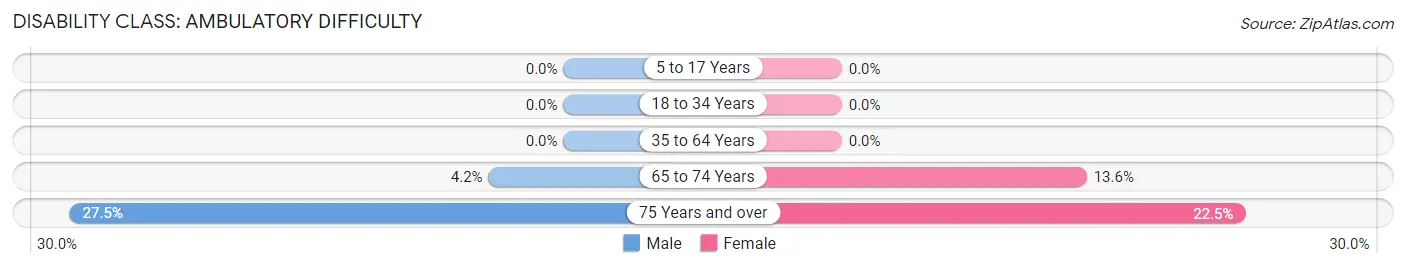
| Age Bracket | Male | Female |
| 5 to 17 Years | 0 (0.0%) | 0 (0.0%) |
| 18 to 34 Years | 0 (0.0%) | 0 (0.0%) |
| 35 to 64 Years | 0 (0.0%) | 0 (0.0%) |
| 65 to 74 Years | 37 (4.2%) | 151 (13.6%) |
| 75 Years and over | 430 (27.5%) | 406 (22.5%) |
Disability Class: Self-Care Difficulty
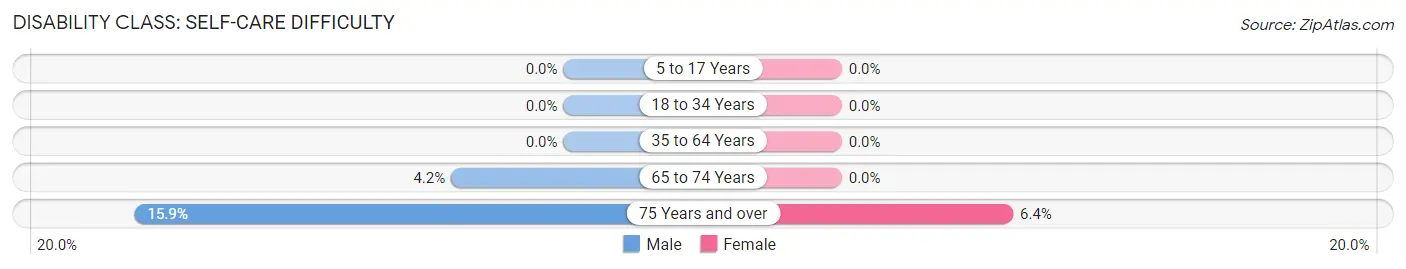
| Age Bracket | Male | Female |
| 5 to 17 Years | 0 (0.0%) | 0 (0.0%) |
| 18 to 34 Years | 0 (0.0%) | 0 (0.0%) |
| 35 to 64 Years | 0 (0.0%) | 0 (0.0%) |
| 65 to 74 Years | 37 (4.2%) | 0 (0.0%) |
| 75 Years and over | 249 (15.9%) | 115 (6.4%) |
Technology Access in Desert Palms
Computing Device Access in Desert Palms
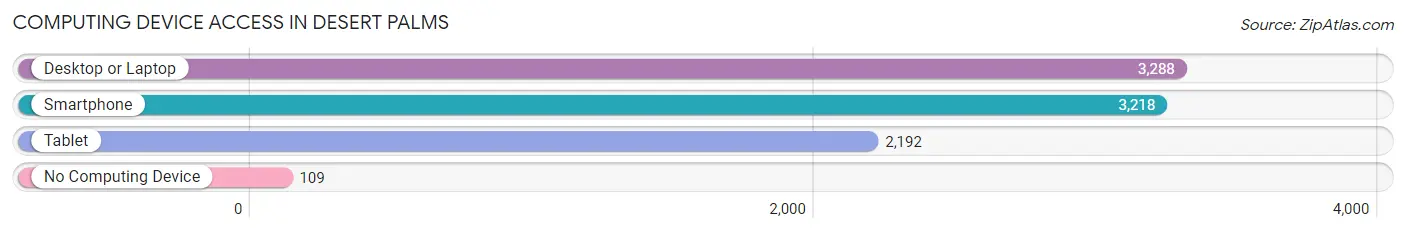
| Device Type | # Households | % Households |
| Desktop or Laptop | 3,288 | 87.7% |
| Smartphone | 3,218 | 85.8% |
| Tablet | 2,192 | 58.5% |
| No Computing Device | 109 | 2.9% |
| Total | 3,749 | 100.0% |
Internet Access in Desert Palms
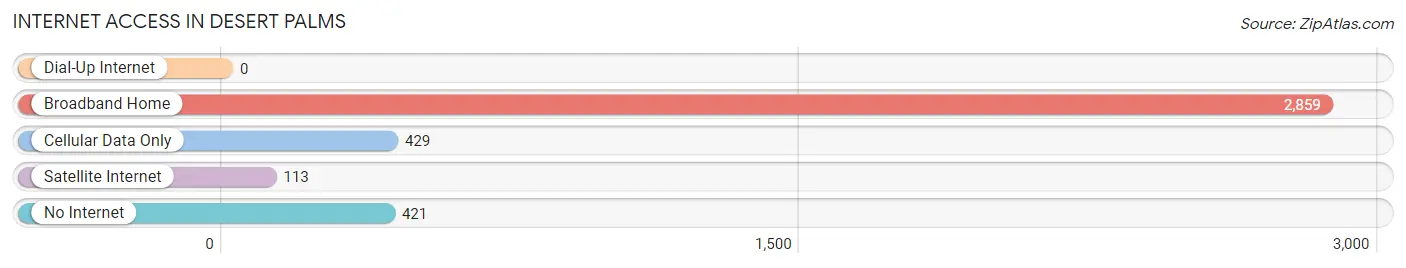
| Internet Type | # Households | % Households |
| Dial-Up Internet | 0 | 0.0% |
| Broadband Home | 2,859 | 76.3% |
| Cellular Data Only | 429 | 11.4% |
| Satellite Internet | 113 | 3.0% |
| No Internet | 421 | 11.2% |
| Total | 3,749 | 100.0% |
Desert Palms Summary
Desert Palms is a small unincorporated community located in Riverside County, California. It is situated in the Coachella Valley, approximately 25 miles east of Palm Springs. The community is surrounded by the Santa Rosa and San Jacinto Mountains, and is home to a population of approximately 1,000 people.
History
The area that is now Desert Palms was originally inhabited by the Cahuilla Indians, who lived in the area for centuries before the arrival of Europeans. The first Europeans to settle in the area were the Spanish, who established the Mission San Luis Rey de Francia in 1798. The mission was abandoned in 1834, and the area was subsequently settled by ranchers and farmers.
In the late 19th century, the area was developed as a resort destination, and the first hotel was built in 1891. The area was known as “Desert Palms” due to the abundance of palm trees in the area. The town was officially incorporated in 1925, and the population grew steadily throughout the 20th century.
Geography
Desert Palms is located in the Coachella Valley, which is part of the Sonoran Desert. The area is characterized by hot, dry summers and mild winters. The average annual temperature is 75°F, and the average annual precipitation is 4.5 inches.
The community is surrounded by the Santa Rosa and San Jacinto Mountains, which provide a stunning backdrop to the area. The area is also home to a variety of wildlife, including coyotes, bobcats, and desert tortoises.
Economy
The economy of Desert Palms is largely based on tourism and agriculture. The area is home to a variety of resorts, hotels, and restaurants, which attract visitors from all over the world. The area is also home to a number of farms, which produce a variety of fruits and vegetables.
The area is also home to a number of manufacturing and technology companies, which provide employment opportunities for local residents.
Demographics
As of the 2010 census, the population of Desert Palms was 1,000. The racial makeup of the community was 75.2% White, 0.7% African American, 0.7% Native American, 0.7% Asian, 0.7% Pacific Islander, and 21.7% from other races. The median household income was $37,500, and the median age was 37.
Conclusion
Desert Palms is a small unincorporated community located in Riverside County, California. It is situated in the Coachella Valley, and is home to a population of approximately 1,000 people. The area is characterized by hot, dry summers and mild winters, and is surrounded by the Santa Rosa and San Jacinto Mountains. The economy of Desert Palms is largely based on tourism and agriculture, and the area is home to a variety of resorts, hotels, and restaurants. The population of Desert Palms is largely White, with a median household income of $37,500 and a median age of 37.
Common Questions
What is Per Capita Income in Desert Palms?
Per Capita income in Desert Palms is $66,950.
What is the Median Family Income in Desert Palms?
Median Family Income in Desert Palms is $99,042.
What is the Median Household income in Desert Palms?
Median Household Income in Desert Palms is $73,697.
What is Income or Wage Gap in Desert Palms?
Income or Wage Gap in Desert Palms is 53.3%.
Women in Desert Palms earn 46.7 cents for every dollar earned by a man.
What is Family Income Deficit in Desert Palms?
Family Income Deficit in Desert Palms is $8,964.
Families that are below poverty line in Desert Palms earn $8,964 less on average than the poverty threshold level.
What is Inequality or Gini Index in Desert Palms?
Inequality or Gini Index in Desert Palms is 0.51.
What is the Total Population of Desert Palms?
Total Population of Desert Palms is 6,414.
What is the Total Male Population of Desert Palms?
Total Male Population of Desert Palms is 2,893.
What is the Total Female Population of Desert Palms?
Total Female Population of Desert Palms is 3,521.
What is the Ratio of Males per 100 Females in Desert Palms?
There are 82.16 Males per 100 Females in Desert Palms.
What is the Ratio of Females per 100 Males in Desert Palms?
There are 121.71 Females per 100 Males in Desert Palms.
What is the Median Population Age in Desert Palms?
Median Population Age in Desert Palms is 76.1 Years.
What is the Average Family Size in Desert Palms
Average Family Size in Desert Palms is 2.1 People.
What is the Average Household Size in Desert Palms
Average Household Size in Desert Palms is 1.7 People.
How Large is the Labor Force in Desert Palms?
There are 1,152 People in the Labor Forcein in Desert Palms.
What is the Percentage of People in the Labor Force in Desert Palms?
18.0% of People are in the Labor Force in Desert Palms.
What is the Unemployment Rate in Desert Palms?
Unemployment Rate in Desert Palms is 6.3%.