Rolling Hills, CA Map & Demographics
Rolling Hills Map
Rolling Hills Overview
$58,290
PER CAPITA INCOME
$137,778
AVG FAMILY INCOME
$109,688
AVG HOUSEHOLD INCOME
32.6%
WAGE / INCOME GAP [ % ]
67.4¢/ $1
WAGE / INCOME GAP [ $ ]
0.41
INEQUALITY / GINI INDEX
539
TOTAL POPULATION
257
MALE POPULATION
282
FEMALE POPULATION
91.13
MALES / 100 FEMALES
109.73
FEMALES / 100 MALES
62.0
MEDIAN AGE
2.5
AVG FAMILY SIZE
2.2
AVG HOUSEHOLD SIZE
284
LABOR FORCE [ PEOPLE ]
56.0%
PERCENT IN LABOR FORCE
9.9%
UNEMPLOYMENT RATE
Rolling Hills Area Codes
Income in Rolling Hills
Income Overview in Rolling Hills
Per Capita Income in Rolling Hills is $58,290, while median incomes of families and households are $137,778 and $109,688 respectively.
| Characteristic | Number | Measure |
| Per Capita Income | 539 | $58,290 |
| Median Family Income | 182 | $137,778 |
| Mean Family Income | 182 | $160,504 |
| Median Household Income | 249 | $109,688 |
| Mean Household Income | 249 | $128,539 |
| Income Deficit | 182 | $0 |
| Wage / Income Gap (%) | 539 | 32.60% |
| Wage / Income Gap ($) | 539 | 67.40¢ per $1 |
| Gini / Inequality Index | 539 | 0.41 |
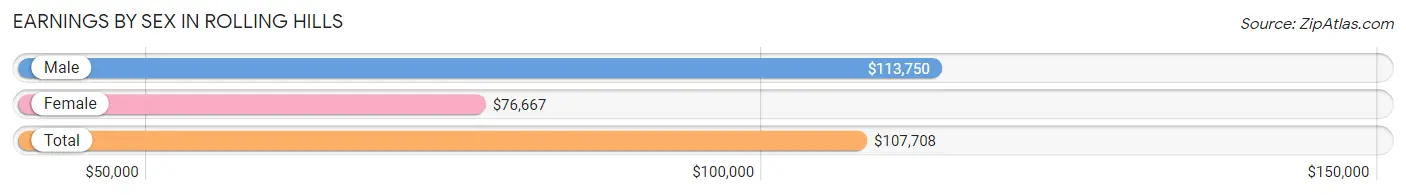
Earnings by Sex in Rolling Hills
Average Earnings in Rolling Hills are $107,708, $113,750 for men and $76,667 for women, a difference of 32.6%.
| Sex | Number | Average Earnings |
| Male | 146 (55.5%) | $113,750 |
| Female | 117 (44.5%) | $76,667 |
| Total | 263 (100.0%) | $107,708 |
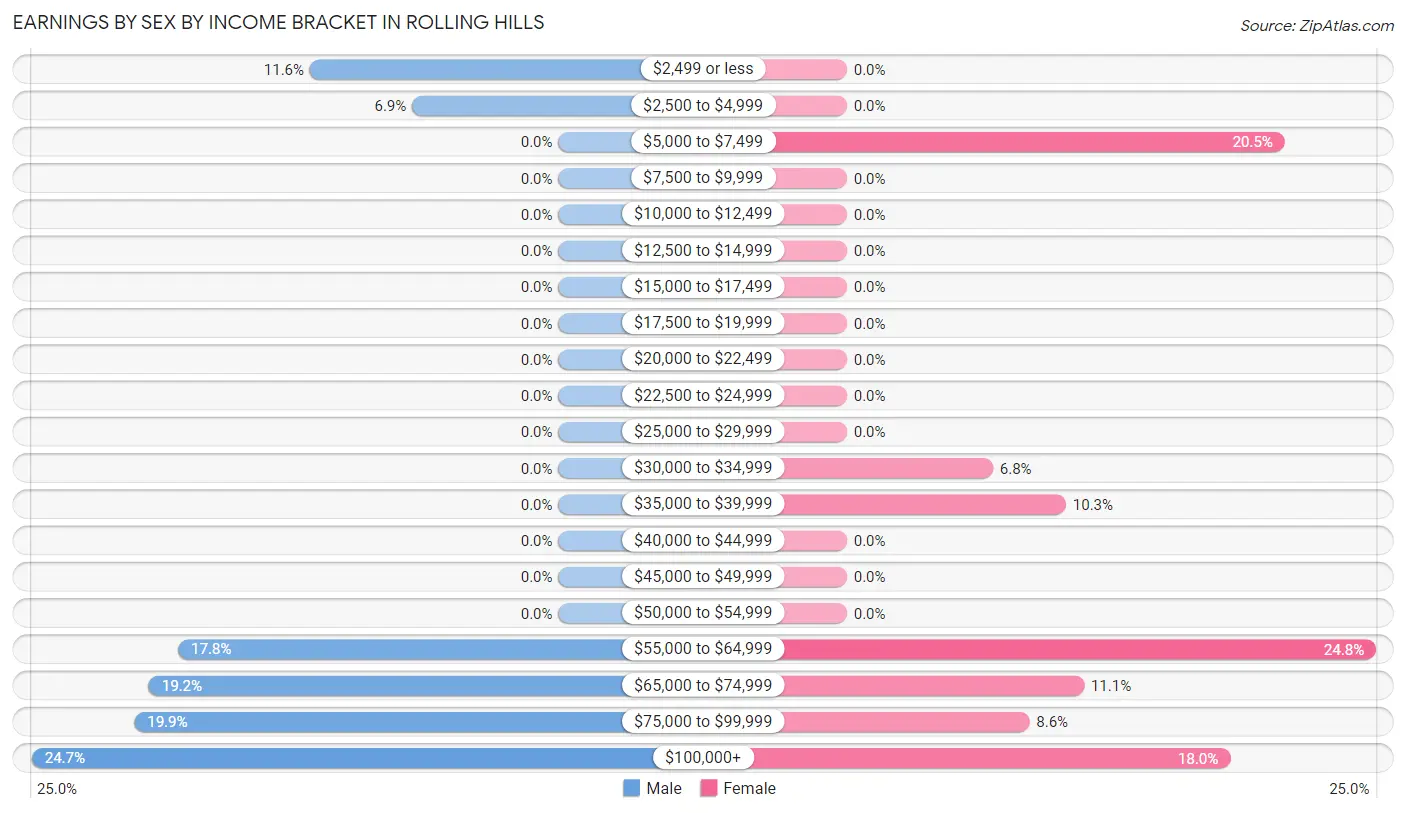
Earnings by Sex by Income Bracket in Rolling Hills
The most common earnings brackets in Rolling Hills are $100,000+ for men (36 | 24.7%) and $55,000 to $64,999 for women (29 | 24.8%).
| Income | Male | Female |
| $2,499 or less | 17 (11.6%) | 0 (0.0%) |
| $2,500 to $4,999 | 10 (6.9%) | 0 (0.0%) |
| $5,000 to $7,499 | 0 (0.0%) | 24 (20.5%) |
| $7,500 to $9,999 | 0 (0.0%) | 0 (0.0%) |
| $10,000 to $12,499 | 0 (0.0%) | 0 (0.0%) |
| $12,500 to $14,999 | 0 (0.0%) | 0 (0.0%) |
| $15,000 to $17,499 | 0 (0.0%) | 0 (0.0%) |
| $17,500 to $19,999 | 0 (0.0%) | 0 (0.0%) |
| $20,000 to $22,499 | 0 (0.0%) | 0 (0.0%) |
| $22,500 to $24,999 | 0 (0.0%) | 0 (0.0%) |
| $25,000 to $29,999 | 0 (0.0%) | 0 (0.0%) |
| $30,000 to $34,999 | 0 (0.0%) | 8 (6.8%) |
| $35,000 to $39,999 | 0 (0.0%) | 12 (10.3%) |
| $40,000 to $44,999 | 0 (0.0%) | 0 (0.0%) |
| $45,000 to $49,999 | 0 (0.0%) | 0 (0.0%) |
| $50,000 to $54,999 | 0 (0.0%) | 0 (0.0%) |
| $55,000 to $64,999 | 26 (17.8%) | 29 (24.8%) |
| $65,000 to $74,999 | 28 (19.2%) | 13 (11.1%) |
| $75,000 to $99,999 | 29 (19.9%) | 10 (8.6%) |
| $100,000+ | 36 (24.7%) | 21 (17.9%) |
| Total | 146 (100.0%) | 117 (100.0%) |
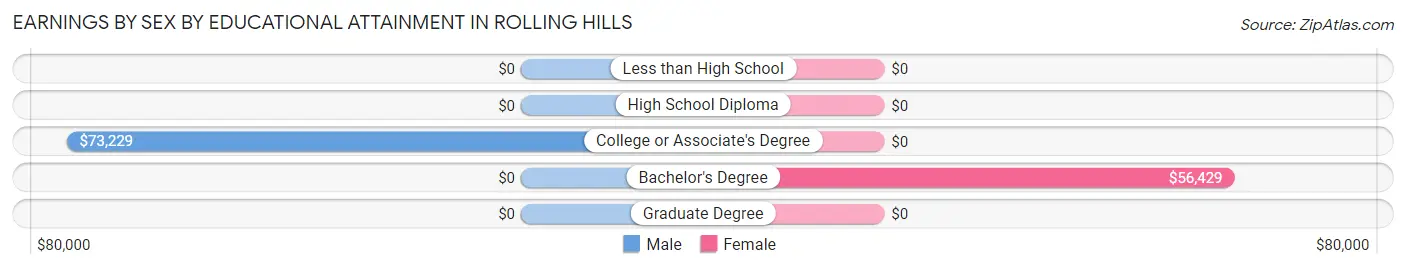
Earnings by Sex by Educational Attainment in Rolling Hills
Average earnings in Rolling Hills are $82,614 for men and $57,583 for women, a difference of 30.3%. Men with an educational attainment of college or associate's degree enjoy the highest average annual earnings of $73,229, while those with college or associate's degree education earn the least with $73,229. Women with an educational attainment of bachelor's degree earn the most with the average annual earnings of $56,429, while those with bachelor's degree education have the smallest earnings of $56,429.
| Educational Attainment | Male Income | Female Income |
| Less than High School | - | - |
| High School Diploma | - | - |
| College or Associate's Degree | $73,229 | $0 |
| Bachelor's Degree | - | - |
| Graduate Degree | - | - |
| Total | $82,614 | $57,583 |
Family Income in Rolling Hills
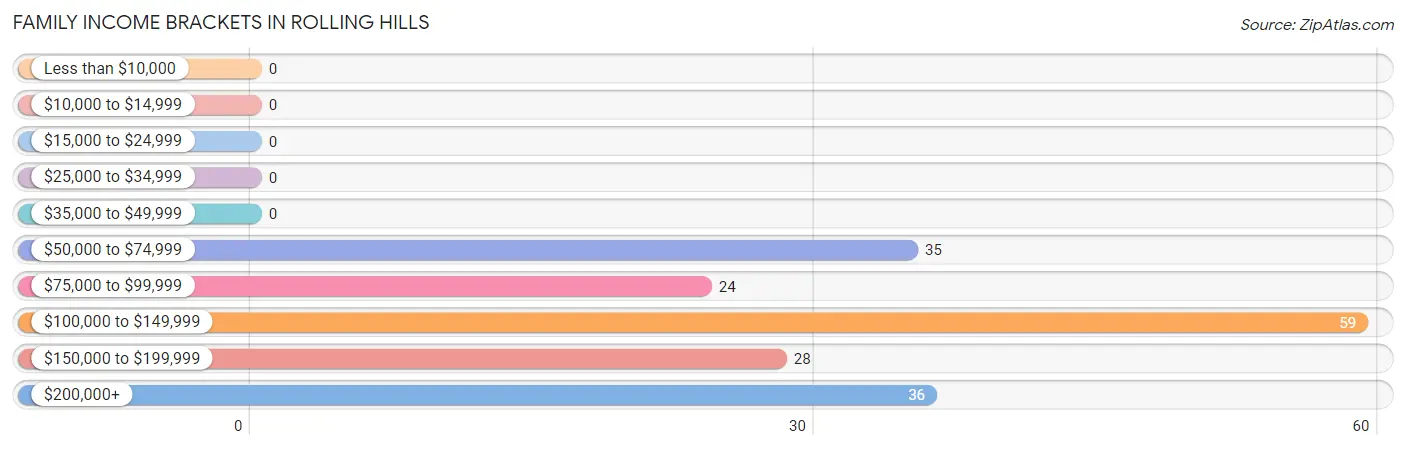
Family Income Brackets in Rolling Hills
According to the Rolling Hills family income data, there are 59 families falling into the $100,000 to $149,999 income range, which is the most common income bracket and makes up 32.4% of all families.
| Income Bracket | # Families | % Families |
| Less than $10,000 | 0 | 0.0% |
| $10,000 to $14,999 | 0 | 0.0% |
| $15,000 to $24,999 | 0 | 0.0% |
| $25,000 to $34,999 | 0 | 0.0% |
| $35,000 to $49,999 | 0 | 0.0% |
| $50,000 to $74,999 | 35 | 19.2% |
| $75,000 to $99,999 | 24 | 13.2% |
| $100,000 to $149,999 | 59 | 32.4% |
| $150,000 to $199,999 | 28 | 15.4% |
| $200,000+ | 36 | 19.8% |
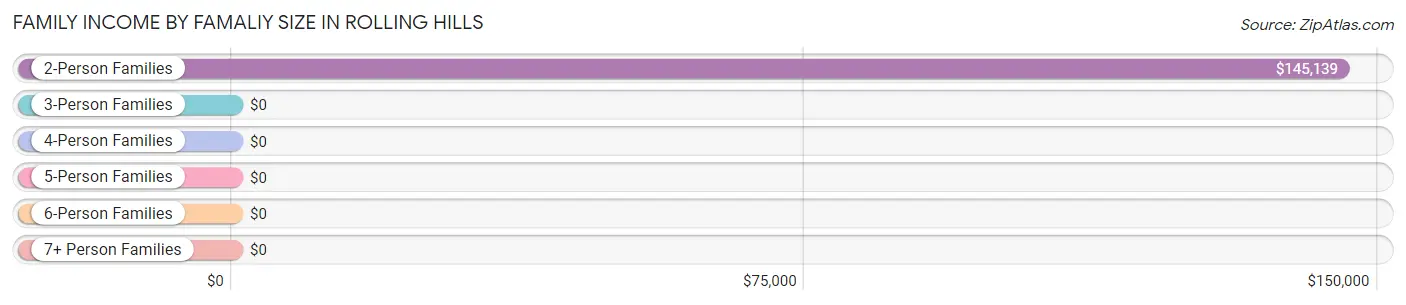
Family Income by Famaliy Size in Rolling Hills
2-person families (125 | 68.7%) account for the highest median family income in Rolling Hills with $145,139 per family, while 2-person families (125 | 68.7%) have the highest median income of $72,570 per family member.
| Income Bracket | # Families | Median Income |
| 2-Person Families | 125 (68.7%) | $145,139 |
| 3-Person Families | 33 (18.1%) | $0 |
| 4-Person Families | 24 (13.2%) | $0 |
| 5-Person Families | 0 (0.0%) | $0 |
| 6-Person Families | 0 (0.0%) | $0 |
| 7+ Person Families | 0 (0.0%) | $0 |
| Total | 182 (100.0%) | $137,778 |
Family Income by Number of Earners in Rolling Hills
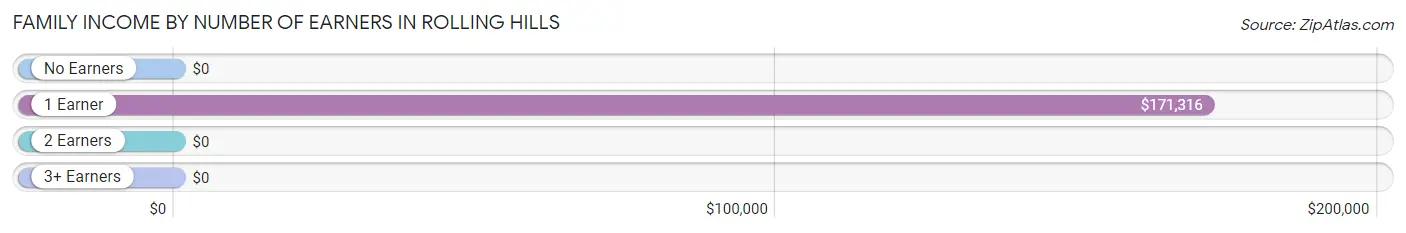
| Number of Earners | # Families | Median Income |
| No Earners | 54 (29.7%) | $0 |
| 1 Earner | 38 (20.9%) | $171,316 |
| 2 Earners | 79 (43.4%) | $0 |
| 3+ Earners | 11 (6.0%) | $0 |
| Total | 182 (100.0%) | $137,778 |
Household Income in Rolling Hills
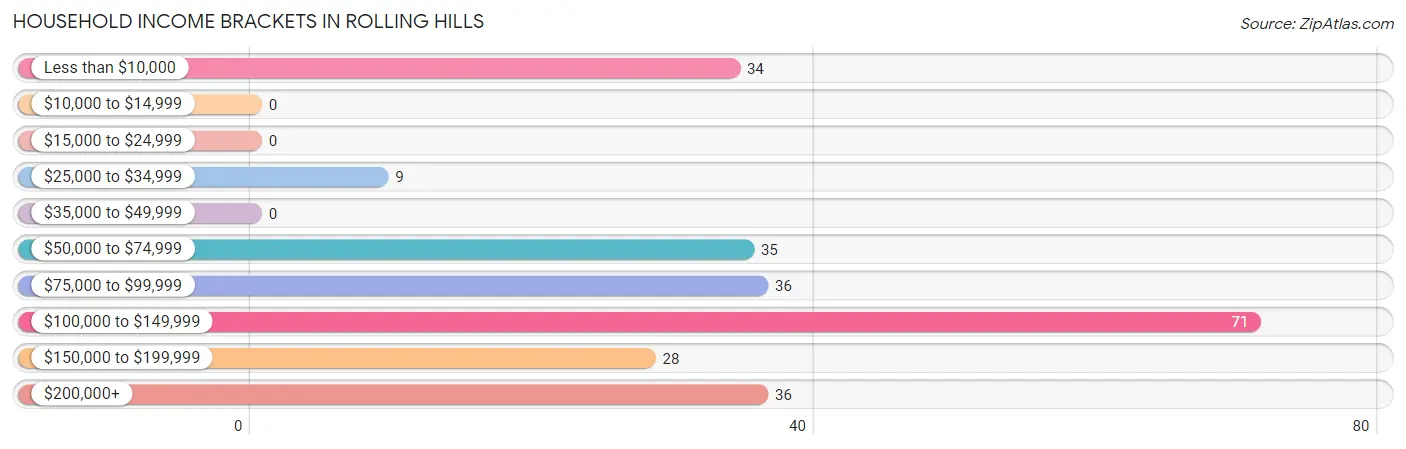
Household Income Brackets in Rolling Hills
With 71 households falling in the category, the $100,000 to $149,999 income range is the most frequent in Rolling Hills, accounting for 28.5% of all households.
| Income Bracket | # Households | % Households |
| Less than $10,000 | 34 | 13.7% |
| $10,000 to $14,999 | 0 | 0.0% |
| $15,000 to $24,999 | 0 | 0.0% |
| $25,000 to $34,999 | 9 | 3.6% |
| $35,000 to $49,999 | 0 | 0.0% |
| $50,000 to $74,999 | 35 | 14.1% |
| $75,000 to $99,999 | 36 | 14.5% |
| $100,000 to $149,999 | 71 | 28.5% |
| $150,000 to $199,999 | 28 | 11.2% |
| $200,000+ | 36 | 14.5% |
Household Income by Householder Age in Rolling Hills
The median household income in Rolling Hills is $109,688, with the highest median household income of $138,194 found in the 45 to 64 years age bracket for the primary householder. A total of 77 households (30.9%) fall into this category.
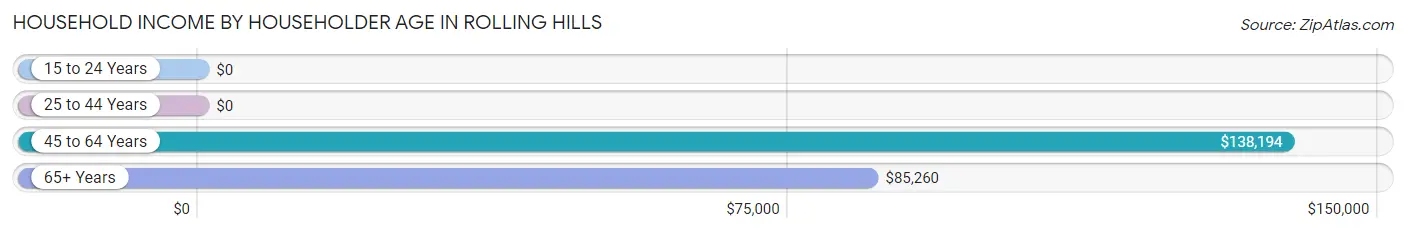
| Income Bracket | # Households | Median Income |
| 15 to 24 Years | 0 (0.0%) | $0 |
| 25 to 44 Years | 29 (11.7%) | $0 |
| 45 to 64 Years | 77 (30.9%) | $138,194 |
| 65+ Years | 143 (57.4%) | $85,260 |
| Total | 249 (100.0%) | $109,688 |
Poverty in Rolling Hills
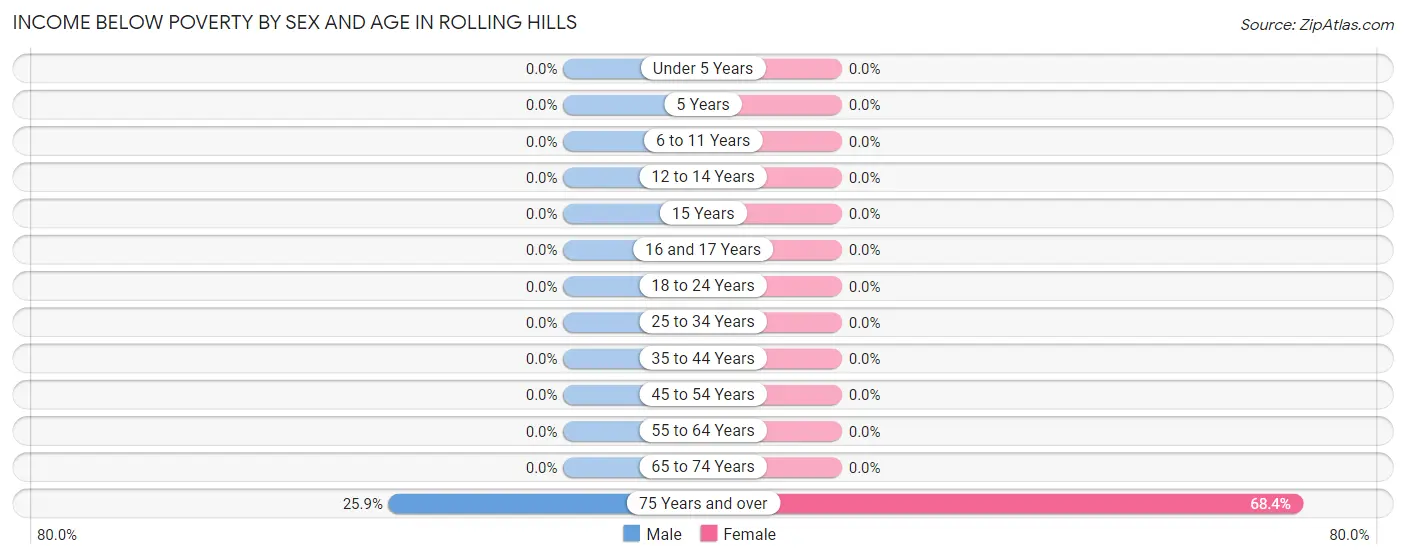
Income Below Poverty by Sex and Age in Rolling Hills
With 2.7% poverty level for males and 13.8% for females among the residents of Rolling Hills, 75 year old and over males and 75 year old and over females are the most vulnerable to poverty, with 7 males (25.9%) and 39 females (68.4%) in their respective age groups living below the poverty level.
| Age Bracket | Male | Female |
| Under 5 Years | 0 (0.0%) | 0 (0.0%) |
| 5 Years | 0 (0.0%) | 0 (0.0%) |
| 6 to 11 Years | 0 (0.0%) | 0 (0.0%) |
| 12 to 14 Years | 0 (0.0%) | 0 (0.0%) |
| 15 Years | 0 (0.0%) | 0 (0.0%) |
| 16 and 17 Years | 0 (0.0%) | 0 (0.0%) |
| 18 to 24 Years | 0 (0.0%) | 0 (0.0%) |
| 25 to 34 Years | 0 (0.0%) | 0 (0.0%) |
| 35 to 44 Years | 0 (0.0%) | 0 (0.0%) |
| 45 to 54 Years | 0 (0.0%) | 0 (0.0%) |
| 55 to 64 Years | 0 (0.0%) | 0 (0.0%) |
| 65 to 74 Years | 0 (0.0%) | 0 (0.0%) |
| 75 Years and over | 7 (25.9%) | 39 (68.4%) |
| Total | 7 (2.7%) | 39 (13.8%) |
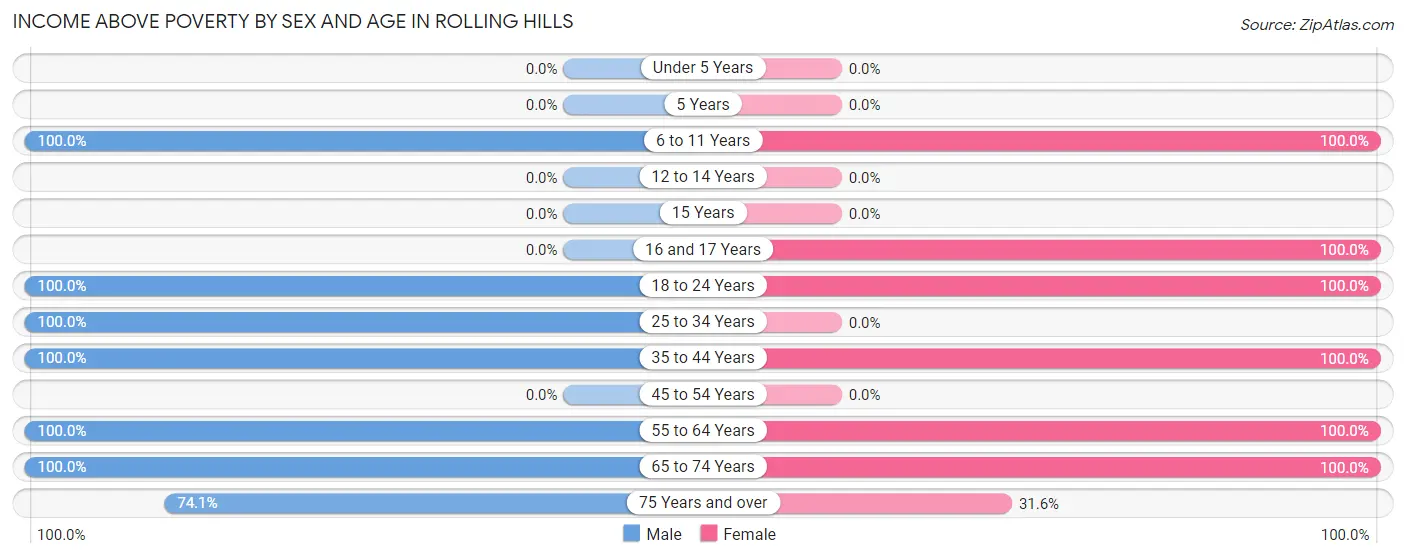
Income Above Poverty by Sex and Age in Rolling Hills
According to the poverty statistics in Rolling Hills, males aged 6 to 11 years and females aged 6 to 11 years are the age groups that are most secure financially, with 100.0% of males and 100.0% of females in these age groups living above the poverty line.
| Age Bracket | Male | Female |
| Under 5 Years | 0 (0.0%) | 0 (0.0%) |
| 5 Years | 0 (0.0%) | 0 (0.0%) |
| 6 to 11 Years | 13 (100.0%) | 19 (100.0%) |
| 12 to 14 Years | 0 (0.0%) | 0 (0.0%) |
| 15 Years | 0 (0.0%) | 0 (0.0%) |
| 16 and 17 Years | 0 (0.0%) | 17 (100.0%) |
| 18 to 24 Years | 17 (100.0%) | 9 (100.0%) |
| 25 to 34 Years | 28 (100.0%) | 0 (0.0%) |
| 35 to 44 Years | 29 (100.0%) | 29 (100.0%) |
| 45 to 54 Years | 0 (0.0%) | 0 (0.0%) |
| 55 to 64 Years | 98 (100.0%) | 73 (100.0%) |
| 65 to 74 Years | 45 (100.0%) | 78 (100.0%) |
| 75 Years and over | 20 (74.1%) | 18 (31.6%) |
| Total | 250 (97.3%) | 243 (86.2%) |
Income Below Poverty Among Married-Couple Families in Rolling Hills
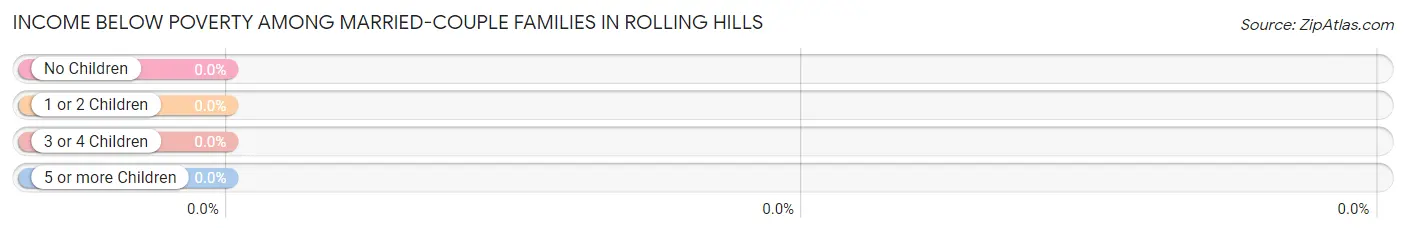
| Children | Above Poverty | Below Poverty |
| No Children | 152 (100.0%) | 0 (0.0%) |
| 1 or 2 Children | 24 (100.0%) | 0 (0.0%) |
| 3 or 4 Children | 0 (0.0%) | 0 (0.0%) |
| 5 or more Children | 0 (0.0%) | 0 (0.0%) |
| Total | 176 (100.0%) | 0 (0.0%) |
Income Below Poverty Among Single-Parent Households in Rolling Hills
| Children | Single Father | Single Mother |
| No Children | 0 (0.0%) | 0 (0.0%) |
| 1 or 2 Children | 0 (0.0%) | 0 (0.0%) |
| 3 or 4 Children | 0 (0.0%) | 0 (0.0%) |
| 5 or more Children | 0 (0.0%) | 0 (0.0%) |
| Total | 0 (0.0%) | 0 (0.0%) |
Income Below Poverty Among Married-Couple vs Single-Parent Households in Rolling Hills
| Children | Married-Couple Families | Single-Parent Households |
| No Children | 0 (0.0%) | 0 (0.0%) |
| 1 or 2 Children | 0 (0.0%) | 0 (0.0%) |
| 3 or 4 Children | 0 (0.0%) | 0 (0.0%) |
| 5 or more Children | 0 (0.0%) | 0 (0.0%) |
| Total | 0 (0.0%) | 0 (0.0%) |
Race in Rolling Hills
The most populous races in Rolling Hills are White / Caucasian (434 | 80.5%), Hispanic or Latino (46 | 8.5%), and Some other Race (46 | 8.5%).
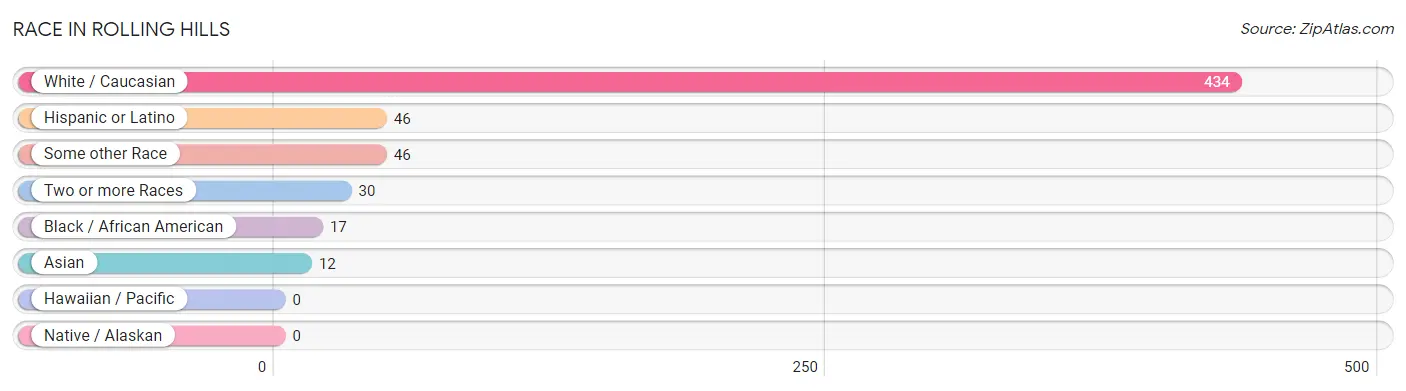
| Race | # Population | % Population |
| Asian | 12 | 2.2% |
| Black / African American | 17 | 3.2% |
| Hawaiian / Pacific | 0 | 0.0% |
| Hispanic or Latino | 46 | 8.5% |
| Native / Alaskan | 0 | 0.0% |
| White / Caucasian | 434 | 80.5% |
| Two or more Races | 30 | 5.6% |
| Some other Race | 46 | 8.5% |
| Total | 539 | 100.0% |
Ancestry in Rolling Hills
The most populous ancestries reported in Rolling Hills are German (129 | 23.9%), English (119 | 22.1%), Irish (64 | 11.9%), Mexican (46 | 8.5%), and Portuguese (37 | 6.9%), together accounting for 73.3% of all Rolling Hills residents.
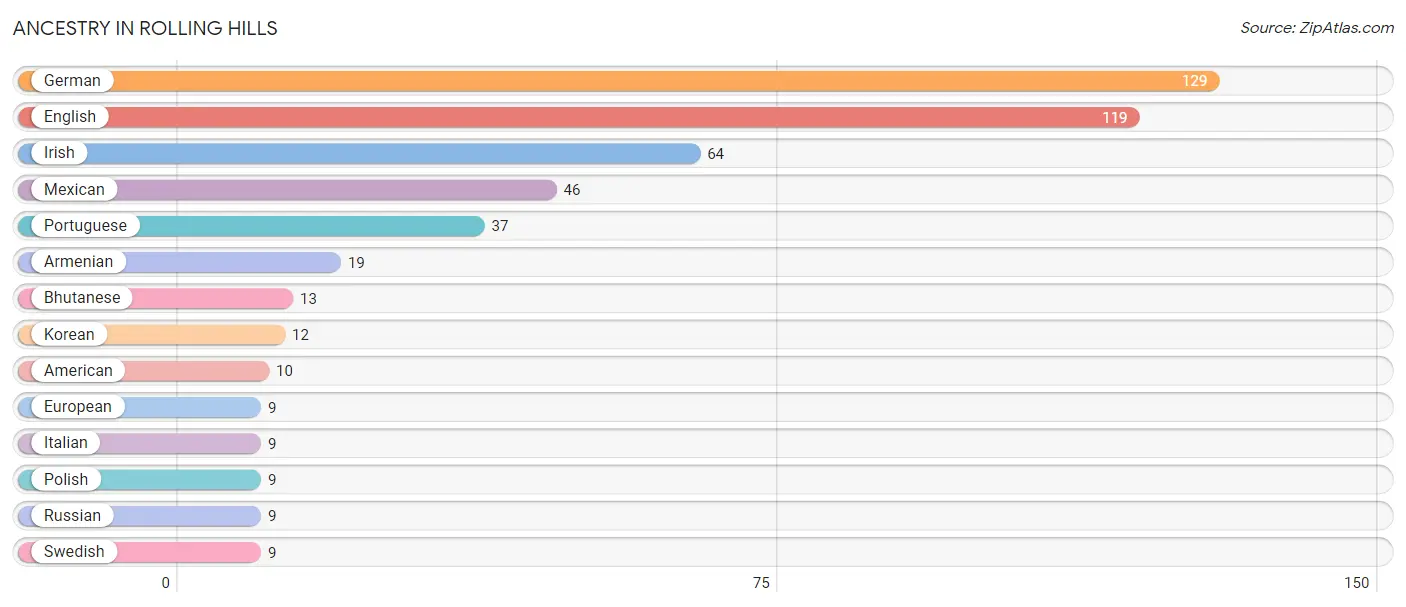
| Ancestry | # Population | % Population |
| American | 10 | 1.9% |
| Armenian | 19 | 3.5% |
| Bhutanese | 13 | 2.4% |
| English | 119 | 22.1% |
| European | 9 | 1.7% |
| German | 129 | 23.9% |
| Irish | 64 | 11.9% |
| Italian | 9 | 1.7% |
| Korean | 12 | 2.2% |
| Mexican | 46 | 8.5% |
| Polish | 9 | 1.7% |
| Portuguese | 37 | 6.9% |
| Russian | 9 | 1.7% |
| Swedish | 9 | 1.7% | View All 14 Rows |
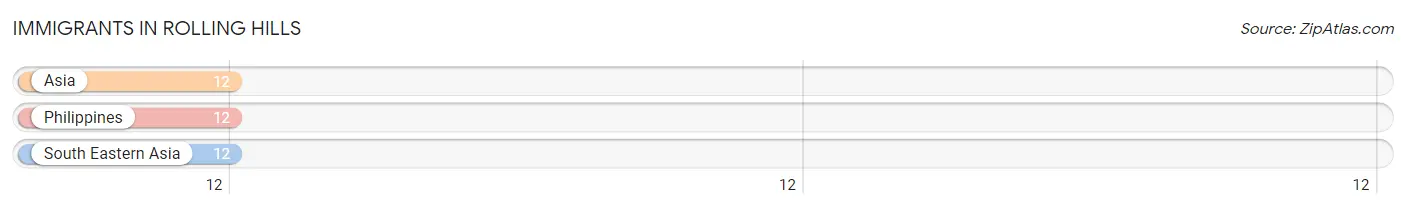
Immigrants in Rolling Hills
The most numerous immigrant groups reported in Rolling Hills came from Asia (12 | 2.2%), Philippines (12 | 2.2%), and South Eastern Asia (12 | 2.2%), together accounting for 6.7% of all Rolling Hills residents.
| Immigration Origin | # Population | % Population |
| Asia | 12 | 2.2% |
| Philippines | 12 | 2.2% |
| South Eastern Asia | 12 | 2.2% | View All 3 Rows |
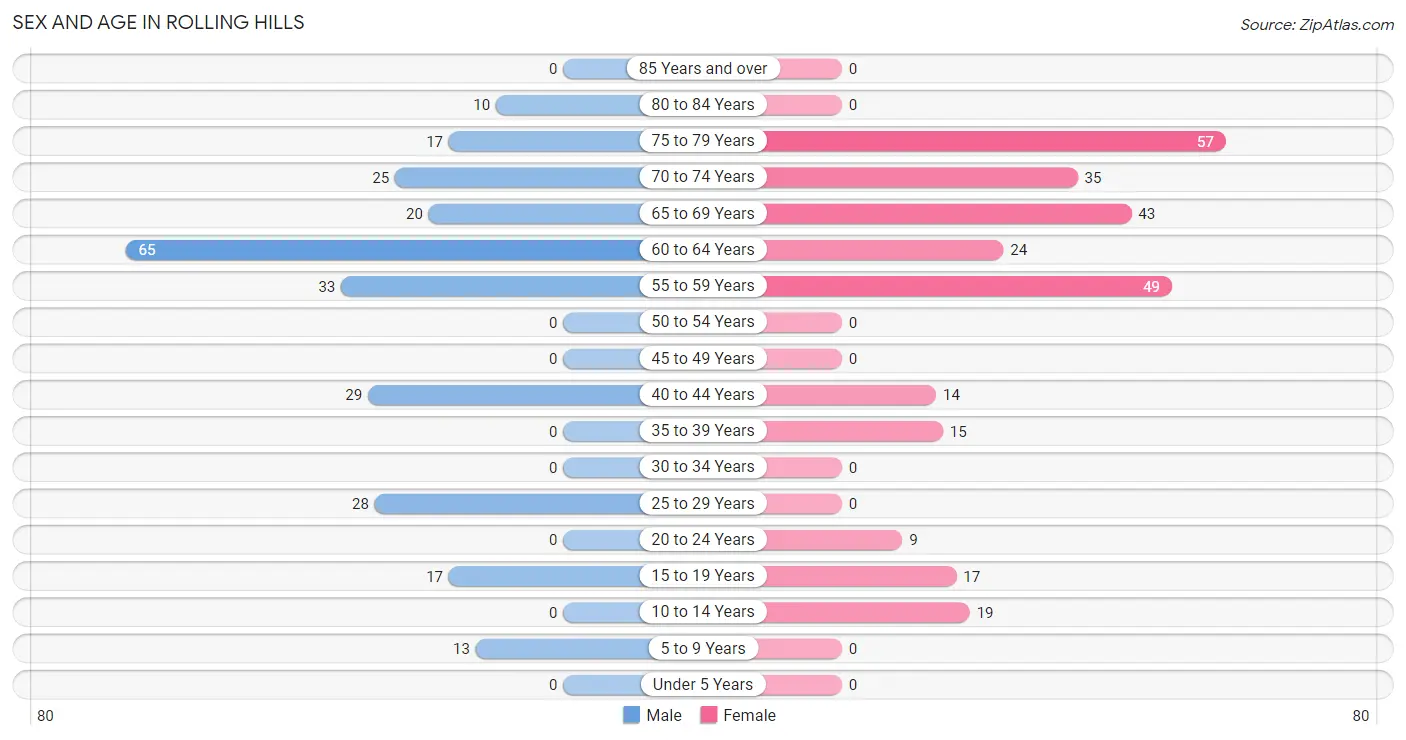
Sex and Age in Rolling Hills
Sex and Age in Rolling Hills
The most populous age groups in Rolling Hills are 60 to 64 Years (65 | 25.3%) for men and 75 to 79 Years (57 | 20.2%) for women.
| Age Bracket | Male | Female |
| Under 5 Years | 0 (0.0%) | 0 (0.0%) |
| 5 to 9 Years | 13 (5.1%) | 0 (0.0%) |
| 10 to 14 Years | 0 (0.0%) | 19 (6.7%) |
| 15 to 19 Years | 17 (6.6%) | 17 (6.0%) |
| 20 to 24 Years | 0 (0.0%) | 9 (3.2%) |
| 25 to 29 Years | 28 (10.9%) | 0 (0.0%) |
| 30 to 34 Years | 0 (0.0%) | 0 (0.0%) |
| 35 to 39 Years | 0 (0.0%) | 15 (5.3%) |
| 40 to 44 Years | 29 (11.3%) | 14 (5.0%) |
| 45 to 49 Years | 0 (0.0%) | 0 (0.0%) |
| 50 to 54 Years | 0 (0.0%) | 0 (0.0%) |
| 55 to 59 Years | 33 (12.8%) | 49 (17.4%) |
| 60 to 64 Years | 65 (25.3%) | 24 (8.5%) |
| 65 to 69 Years | 20 (7.8%) | 43 (15.2%) |
| 70 to 74 Years | 25 (9.7%) | 35 (12.4%) |
| 75 to 79 Years | 17 (6.6%) | 57 (20.2%) |
| 80 to 84 Years | 10 (3.9%) | 0 (0.0%) |
| 85 Years and over | 0 (0.0%) | 0 (0.0%) |
| Total | 257 (100.0%) | 282 (100.0%) |
Families and Households in Rolling Hills
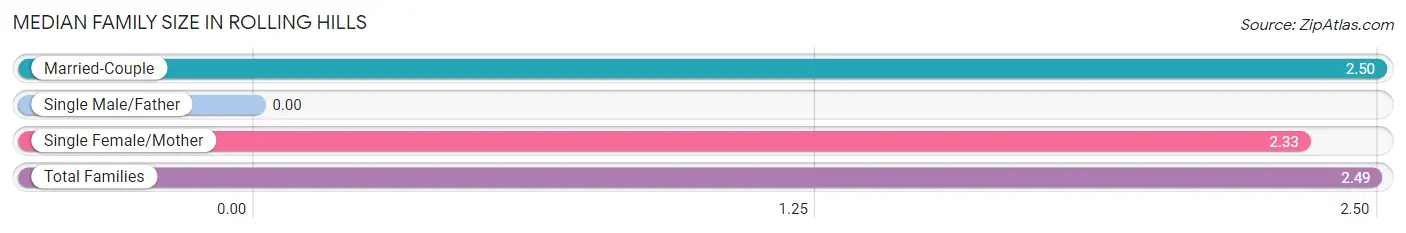
Median Family Size in Rolling Hills
| Family Type | # Families | Family Size |
| Married-Couple | 176 (96.7%) | 2.50 |
| Single Male/Father | 0 (0.0%) | - |
| Single Female/Mother | 6 (3.3%) | 2.33 |
| Total Families | 182 (100.0%) | 2.49 |
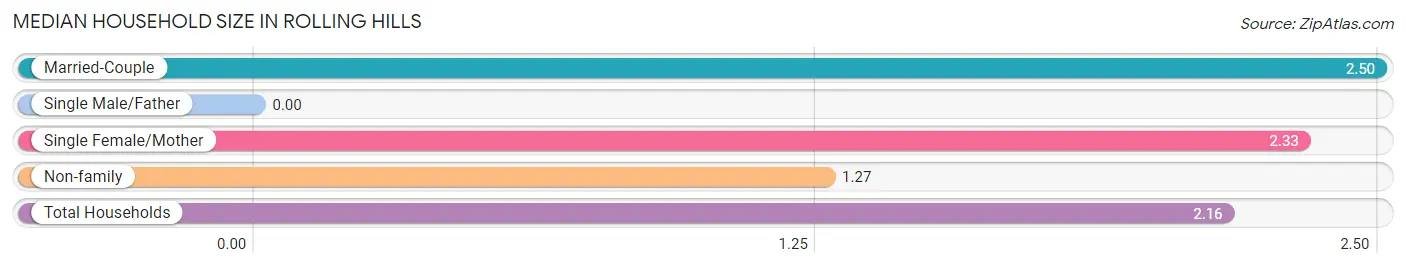
Median Household Size in Rolling Hills
| Household Type | # Households | Household Size |
| Married-Couple | 176 (70.7%) | 2.50 |
| Single Male/Father | 0 (0.0%) | - |
| Single Female/Mother | 6 (2.4%) | 2.33 |
| Non-family | 67 (26.9%) | 1.27 |
| Total Households | 249 (100.0%) | 2.16 |
Household Size by Marriage Status in Rolling Hills
Out of a total of 249 households in Rolling Hills, 182 (73.1%) are family households, while 67 (26.9%) are nonfamily households. The most numerous type of family households are 2-person households, comprising 125, and the most common type of nonfamily households are 1-person households, comprising 55.
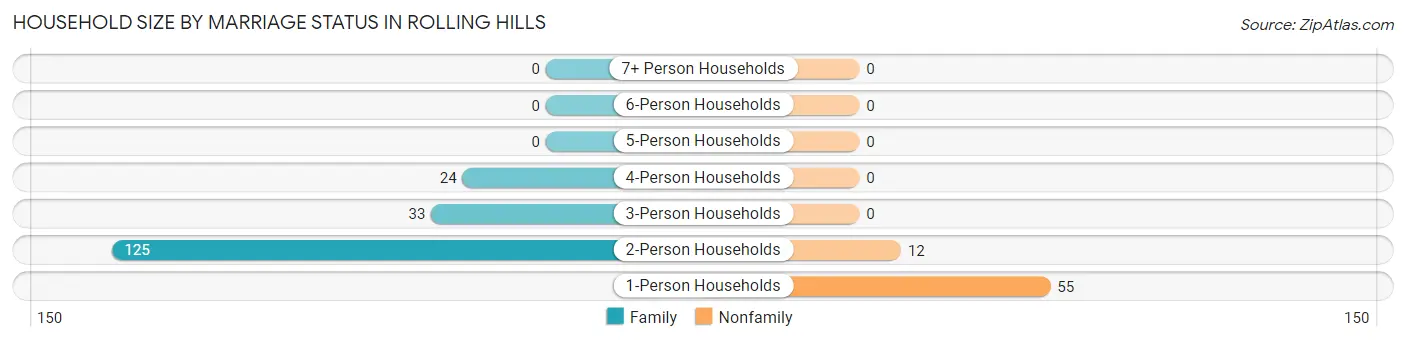
| Household Size | Family Households | Nonfamily Households |
| 1-Person Households | - | 55 (22.1%) |
| 2-Person Households | 125 (50.2%) | 12 (4.8%) |
| 3-Person Households | 33 (13.3%) | 0 (0.0%) |
| 4-Person Households | 24 (9.6%) | 0 (0.0%) |
| 5-Person Households | 0 (0.0%) | 0 (0.0%) |
| 6-Person Households | 0 (0.0%) | 0 (0.0%) |
| 7+ Person Households | 0 (0.0%) | 0 (0.0%) |
| Total | 182 (73.1%) | 67 (26.9%) |
Female Fertility in Rolling Hills
Fertility by Age in Rolling Hills
| Age Bracket | Women with Births | Births / 1,000 Women |
| 15 to 19 years | 0 (0.0%) | 0.0 |
| 20 to 34 years | 0 (0.0%) | 0.0 |
| 35 to 50 years | 0 (0.0%) | 0.0 |
| Total | 0 (0.0%) | 0.0 |
Fertility by Age by Marriage Status in Rolling Hills
| Age Bracket | Married | Unmarried |
| 15 to 19 years | 0 (0.0%) | 0 (0.0%) |
| 20 to 34 years | 0 (0.0%) | 0 (0.0%) |
| 35 to 50 years | 0 (0.0%) | 0 (0.0%) |
| Total | 0 (0.0%) | 0 (0.0%) |
Fertility by Education in Rolling Hills
| Educational Attainment | Women with Births | Births / 1,000 Women |
| Less than High School | 0 (0.0%) | 0.0 |
| High School Diploma | 0 (0.0%) | 0.0 |
| College or Associate's Degree | 0 (0.0%) | 0.0 |
| Bachelor's Degree | 0 (0.0%) | 0.0 |
| Graduate Degree | 0 (0.0%) | 0.0 |
| Total | 0 (0.0%) | 0.0 |
Fertility by Education by Marriage Status in Rolling Hills
| Educational Attainment | Married | Unmarried |
| Less than High School | 0 (0.0%) | 0 (0.0%) |
| High School Diploma | 0 (0.0%) | 0 (0.0%) |
| College or Associate's Degree | 0 (0.0%) | 0 (0.0%) |
| Bachelor's Degree | 0 (0.0%) | 0 (0.0%) |
| Graduate Degree | 0 (0.0%) | 0 (0.0%) |
| Total | 0 (0.0%) | 0 (0.0%) |
Employment Characteristics in Rolling Hills
Employment by Class of Employer in Rolling Hills
Among the 232 employed individuals in Rolling Hills, private company employees (74 | 31.9%), local government employees (62 | 26.7%), and self-employed (not incorporated) (49 | 21.1%) make up the most common classes of employment.
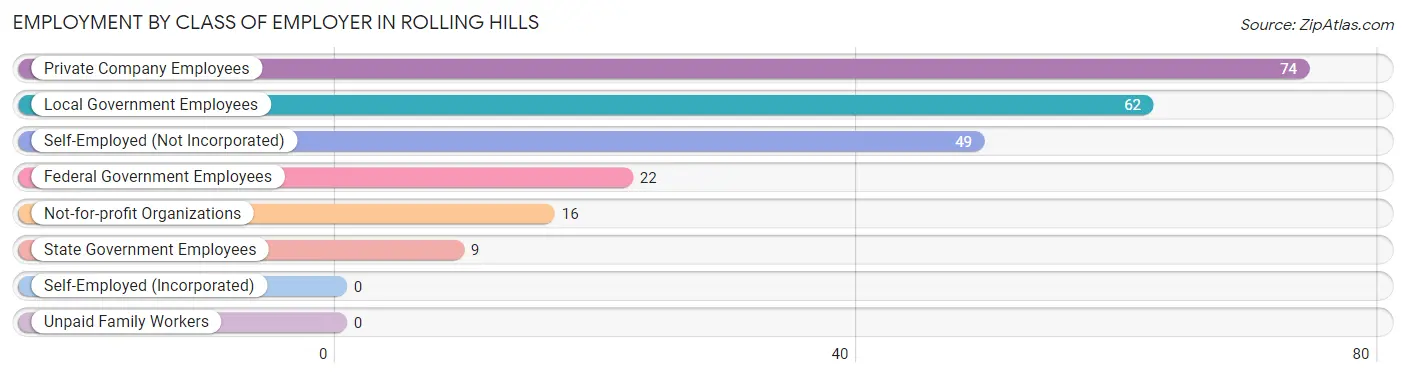
| Employer Class | # Employees | % Employees |
| Private Company Employees | 74 | 31.9% |
| Self-Employed (Incorporated) | 0 | 0.0% |
| Self-Employed (Not Incorporated) | 49 | 21.1% |
| Not-for-profit Organizations | 16 | 6.9% |
| Local Government Employees | 62 | 26.7% |
| State Government Employees | 9 | 3.9% |
| Federal Government Employees | 22 | 9.5% |
| Unpaid Family Workers | 0 | 0.0% |
| Total | 232 | 100.0% |
Employment Status by Age in Rolling Hills
According to the labor force statistics for Rolling Hills, out of the total population over 16 years of age (507), 56.0% or 284 individuals are in the labor force, with 9.9% or 28 of them unemployed. The age group with the highest labor force participation rate is 25 to 29 years, with 100.0% or 28 individuals in the labor force. Within the labor force, the 25 to 29 years age range has the highest percentage of unemployed individuals, with 100.0% or 28 of them being unemployed.
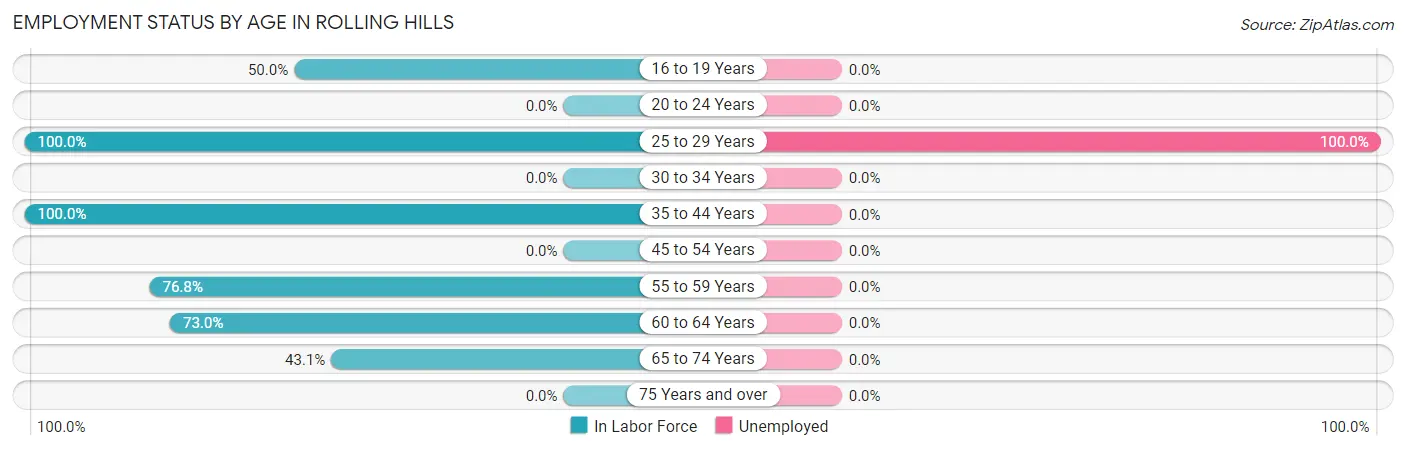
| Age Bracket | In Labor Force | Unemployed |
| 16 to 19 Years | 17 (50.0%) | 0 (0.0%) |
| 20 to 24 Years | 0 (0.0%) | 0 (0.0%) |
| 25 to 29 Years | 28 (100.0%) | 28 (100.0%) |
| 30 to 34 Years | 0 (0.0%) | 0 (0.0%) |
| 35 to 44 Years | 58 (100.0%) | 0 (0.0%) |
| 45 to 54 Years | 0 (0.0%) | 0 (0.0%) |
| 55 to 59 Years | 63 (76.8%) | 0 (0.0%) |
| 60 to 64 Years | 65 (73.0%) | 0 (0.0%) |
| 65 to 74 Years | 53 (43.1%) | 0 (0.0%) |
| 75 Years and over | 0 (0.0%) | 0 (0.0%) |
| Total | 284 (56.0%) | 28 (9.9%) |
Employment Status by Educational Attainment in Rolling Hills
According to labor force statistics for Rolling Hills, 83.3% of individuals (214) out of the total population between 25 and 64 years of age (257) are in the labor force, with 13.1% or 28 of them being unemployed. The group with the highest labor force participation rate are those with the educational attainment of less than high school, with 100.0% or 4 individuals in the labor force. Within the labor force, individuals with high school diploma education have the highest percentage of unemployment, with 87.5% or 28 of them being unemployed.
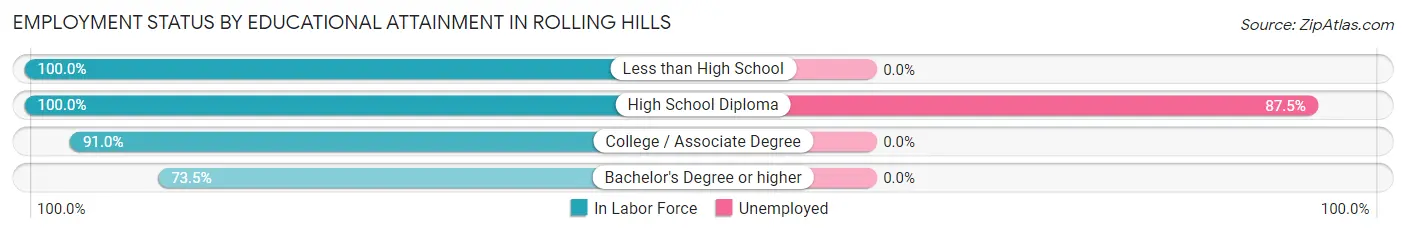
| Educational Attainment | In Labor Force | Unemployed |
| Less than High School | 4 (100.0%) | 0 (0.0%) |
| High School Diploma | 32 (100.0%) | 28 (87.5%) |
| College / Associate Degree | 81 (91.0%) | 0 (0.0%) |
| Bachelor's Degree or higher | 97 (73.5%) | 0 (0.0%) |
| Total | 214 (83.3%) | 34 (13.1%) |
Employment Occupations by Sex in Rolling Hills
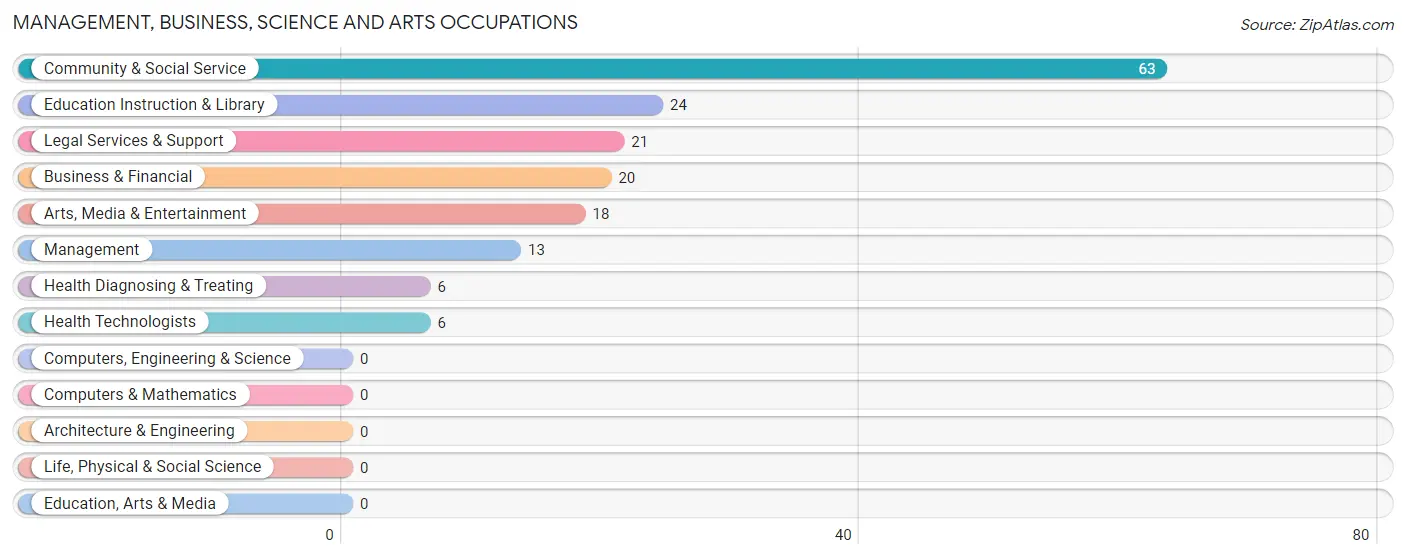
Management, Business, Science and Arts Occupations
The most common Management, Business, Science and Arts occupations in Rolling Hills are Community & Social Service (63 | 24.6%), Education Instruction & Library (24 | 9.4%), Legal Services & Support (21 | 8.2%), Business & Financial (20 | 7.8%), and Arts, Media & Entertainment (18 | 7.0%).
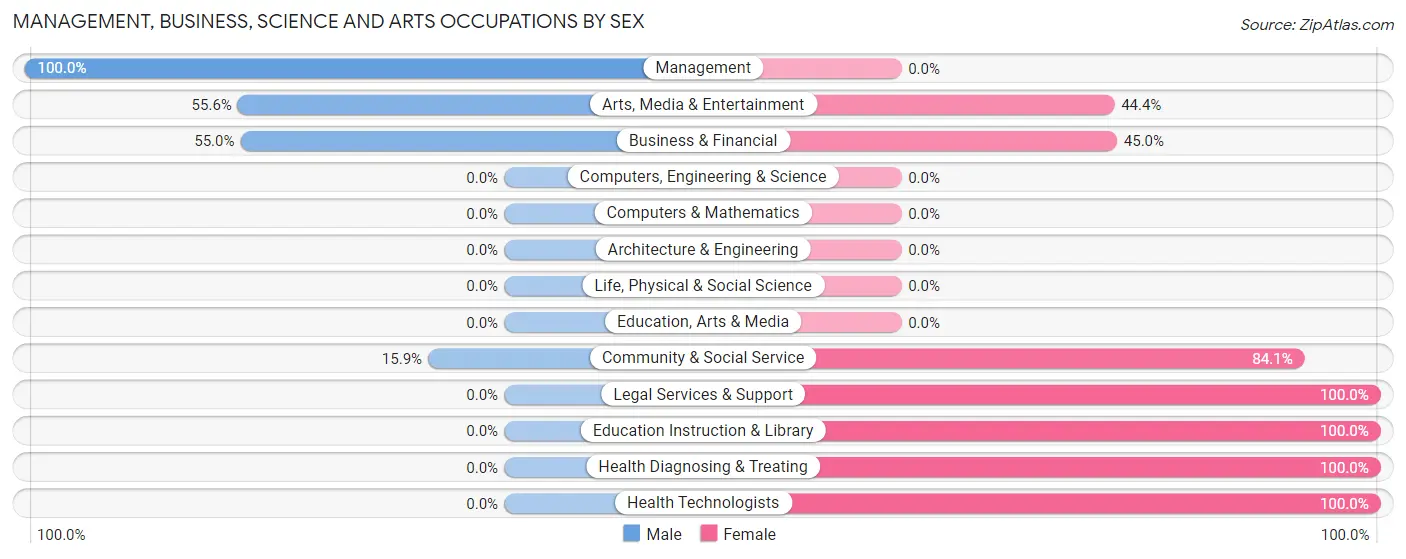
Management, Business, Science and Arts Occupations by Sex
Within the Management, Business, Science and Arts occupations in Rolling Hills, the most male-oriented occupations are Management (100.0%), Arts, Media & Entertainment (55.6%), and Business & Financial (55.0%), while the most female-oriented occupations are Legal Services & Support (100.0%), Education Instruction & Library (100.0%), and Health Diagnosing & Treating (100.0%).
| Occupation | Male | Female |
| Management | 13 (100.0%) | 0 (0.0%) |
| Business & Financial | 11 (55.0%) | 9 (45.0%) |
| Computers, Engineering & Science | 0 (0.0%) | 0 (0.0%) |
| Computers & Mathematics | 0 (0.0%) | 0 (0.0%) |
| Architecture & Engineering | 0 (0.0%) | 0 (0.0%) |
| Life, Physical & Social Science | 0 (0.0%) | 0 (0.0%) |
| Community & Social Service | 10 (15.9%) | 53 (84.1%) |
| Education, Arts & Media | 0 (0.0%) | 0 (0.0%) |
| Legal Services & Support | 0 (0.0%) | 21 (100.0%) |
| Education Instruction & Library | 0 (0.0%) | 24 (100.0%) |
| Arts, Media & Entertainment | 10 (55.6%) | 8 (44.4%) |
| Health Diagnosing & Treating | 0 (0.0%) | 6 (100.0%) |
| Health Technologists | 0 (0.0%) | 6 (100.0%) |
| Total (Category) | 34 (33.3%) | 68 (66.7%) |
| Total (Overall) | 139 (54.3%) | 117 (45.7%) |
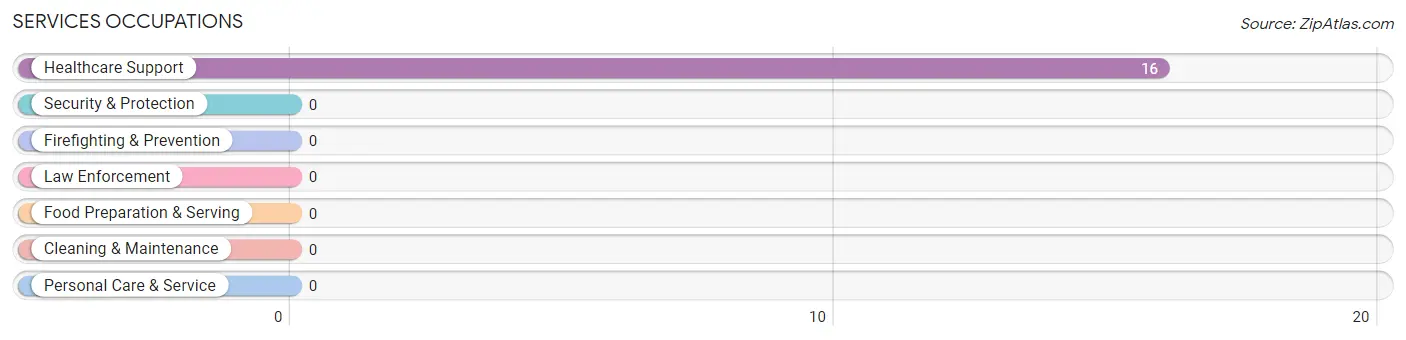
Services Occupations
The most common Services occupations in Rolling Hills are , and Healthcare Support (16 | 6.2%).
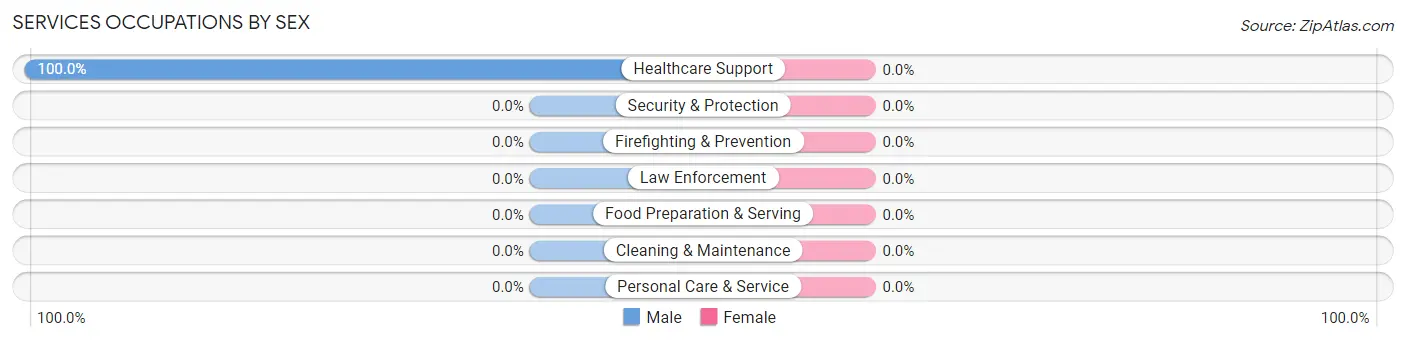
Services Occupations by Sex
| Occupation | Male | Female |
| Healthcare Support | 16 (100.0%) | 0 (0.0%) |
| Security & Protection | 0 (0.0%) | 0 (0.0%) |
| Firefighting & Prevention | 0 (0.0%) | 0 (0.0%) |
| Law Enforcement | 0 (0.0%) | 0 (0.0%) |
| Food Preparation & Serving | 0 (0.0%) | 0 (0.0%) |
| Cleaning & Maintenance | 0 (0.0%) | 0 (0.0%) |
| Personal Care & Service | 0 (0.0%) | 0 (0.0%) |
| Total (Category) | 16 (100.0%) | 0 (0.0%) |
| Total (Overall) | 139 (54.3%) | 117 (45.7%) |
Sales and Office Occupations
The most common Sales and Office occupations in Rolling Hills are Office & Administration (40 | 15.6%), and Sales & Related (9 | 3.5%).
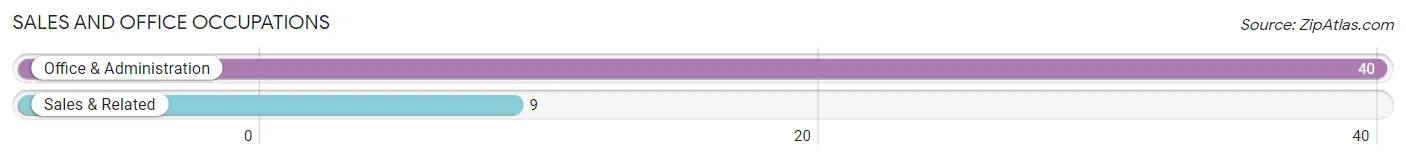
Sales and Office Occupations by Sex
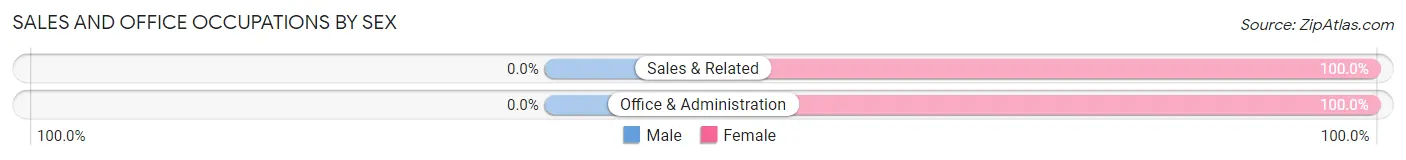
| Occupation | Male | Female |
| Sales & Related | 0 (0.0%) | 9 (100.0%) |
| Office & Administration | 0 (0.0%) | 40 (100.0%) |
| Total (Category) | 0 (0.0%) | 49 (100.0%) |
| Total (Overall) | 139 (54.3%) | 117 (45.7%) |
Natural Resources, Construction and Maintenance Occupations
The most common Natural Resources, Construction and Maintenance occupations in Rolling Hills are Farming, Fishing & Forestry (16 | 6.2%), Installation, Maintenance & Repair (12 | 4.7%), and Construction & Extraction (4 | 1.6%).
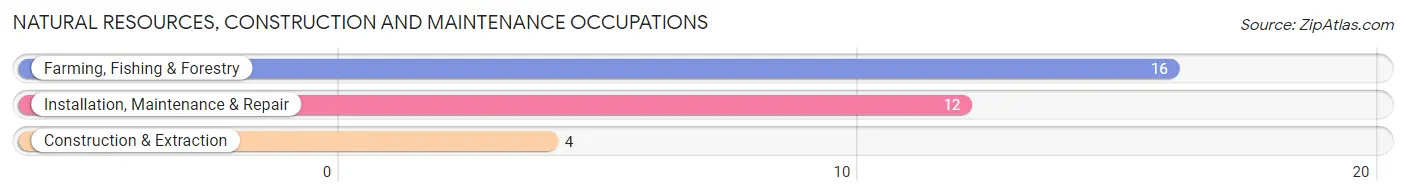
Natural Resources, Construction and Maintenance Occupations by Sex
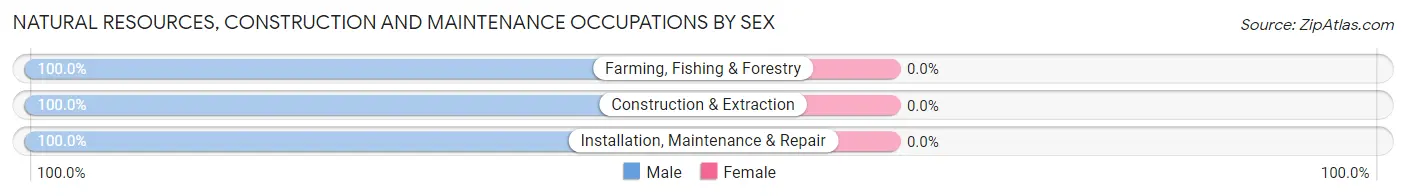
| Occupation | Male | Female |
| Farming, Fishing & Forestry | 16 (100.0%) | 0 (0.0%) |
| Construction & Extraction | 4 (100.0%) | 0 (0.0%) |
| Installation, Maintenance & Repair | 12 (100.0%) | 0 (0.0%) |
| Total (Category) | 32 (100.0%) | 0 (0.0%) |
| Total (Overall) | 139 (54.3%) | 117 (45.7%) |
Production, Transportation and Moving Occupations
The most common Production, Transportation and Moving occupations in Rolling Hills are Transportation (40 | 15.6%), and Material Moving (17 | 6.6%).
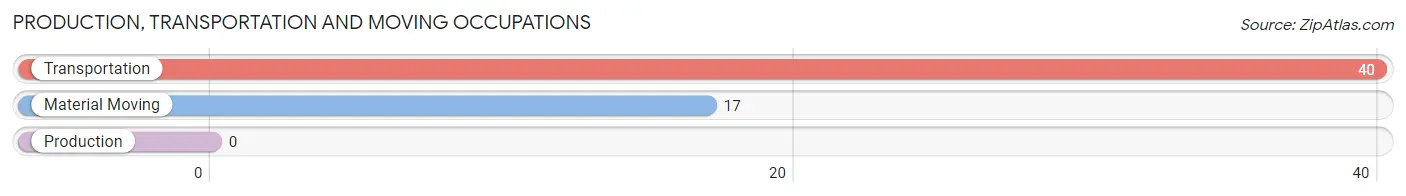
Production, Transportation and Moving Occupations by Sex
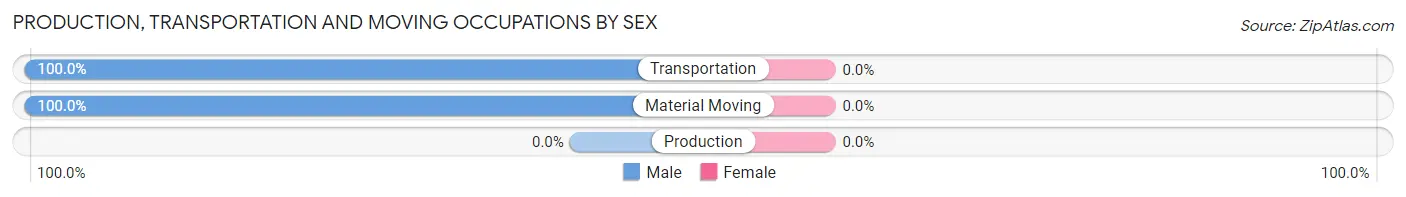
| Occupation | Male | Female |
| Production | 0 (0.0%) | 0 (0.0%) |
| Transportation | 40 (100.0%) | 0 (0.0%) |
| Material Moving | 17 (100.0%) | 0 (0.0%) |
| Total (Category) | 57 (100.0%) | 0 (0.0%) |
| Total (Overall) | 139 (54.3%) | 117 (45.7%) |
Employment Industries by Sex in Rolling Hills
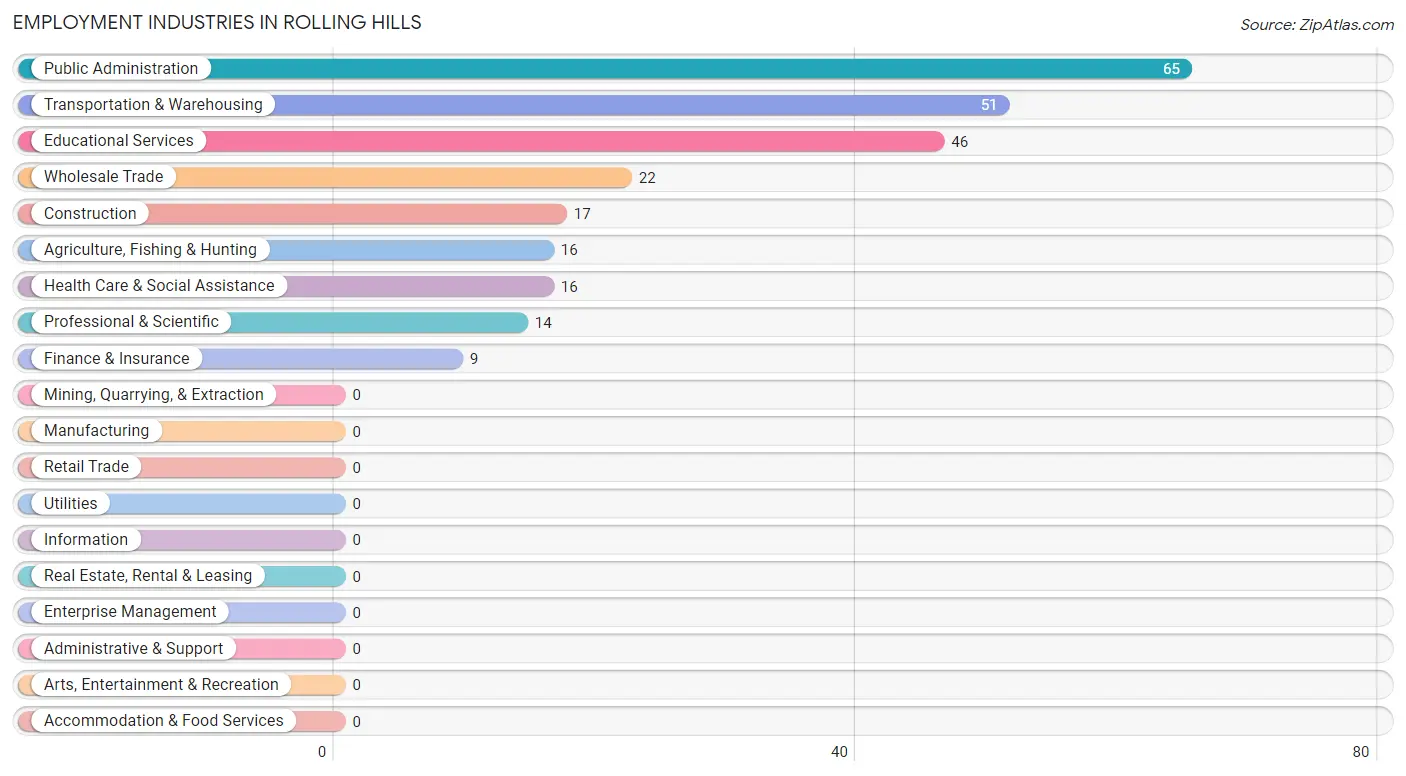
Employment Industries in Rolling Hills
The major employment industries in Rolling Hills include Public Administration (65 | 25.4%), Transportation & Warehousing (51 | 19.9%), Educational Services (46 | 18.0%), Wholesale Trade (22 | 8.6%), and Construction (17 | 6.6%).
Employment Industries by Sex in Rolling Hills
The Rolling Hills industries that see more men than women are Agriculture, Fishing & Hunting (100.0%), Construction (100.0%), and Wholesale Trade (100.0%), whereas the industries that tend to have a higher number of women are Finance & Insurance (100.0%), Professional & Scientific (100.0%), and Public Administration (83.1%).
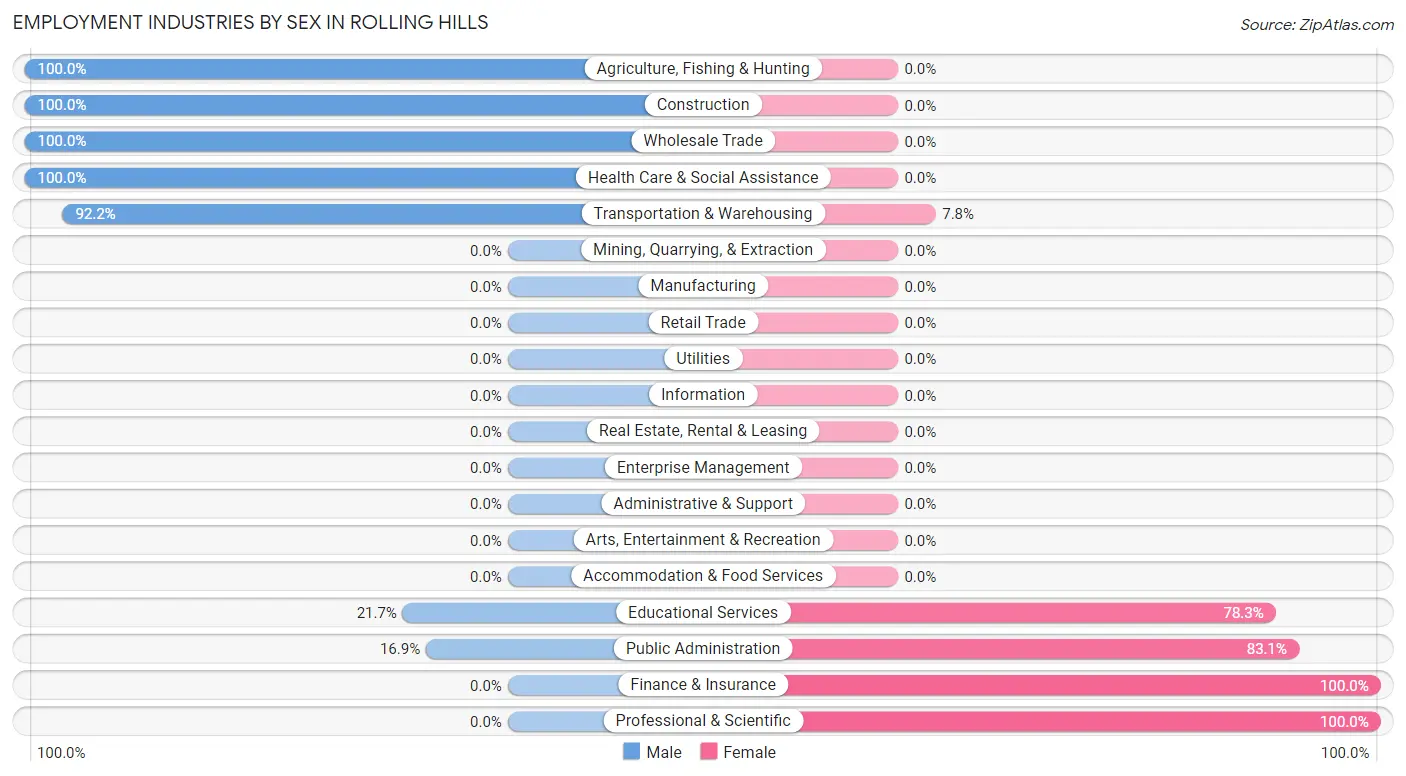
| Industry | Male | Female |
| Agriculture, Fishing & Hunting | 16 (100.0%) | 0 (0.0%) |
| Mining, Quarrying, & Extraction | 0 (0.0%) | 0 (0.0%) |
| Construction | 17 (100.0%) | 0 (0.0%) |
| Manufacturing | 0 (0.0%) | 0 (0.0%) |
| Wholesale Trade | 22 (100.0%) | 0 (0.0%) |
| Retail Trade | 0 (0.0%) | 0 (0.0%) |
| Transportation & Warehousing | 47 (92.2%) | 4 (7.8%) |
| Utilities | 0 (0.0%) | 0 (0.0%) |
| Information | 0 (0.0%) | 0 (0.0%) |
| Finance & Insurance | 0 (0.0%) | 9 (100.0%) |
| Real Estate, Rental & Leasing | 0 (0.0%) | 0 (0.0%) |
| Professional & Scientific | 0 (0.0%) | 14 (100.0%) |
| Enterprise Management | 0 (0.0%) | 0 (0.0%) |
| Administrative & Support | 0 (0.0%) | 0 (0.0%) |
| Educational Services | 10 (21.7%) | 36 (78.3%) |
| Health Care & Social Assistance | 16 (100.0%) | 0 (0.0%) |
| Arts, Entertainment & Recreation | 0 (0.0%) | 0 (0.0%) |
| Accommodation & Food Services | 0 (0.0%) | 0 (0.0%) |
| Public Administration | 11 (16.9%) | 54 (83.1%) |
| Total | 139 (54.3%) | 117 (45.7%) |
Education in Rolling Hills
School Enrollment in Rolling Hills
The most common levels of schooling among the 72 students in Rolling Hills are elementary school (32 | 44.4%), college / undergraduate (23 | 31.9%), and high school (17 | 23.6%).
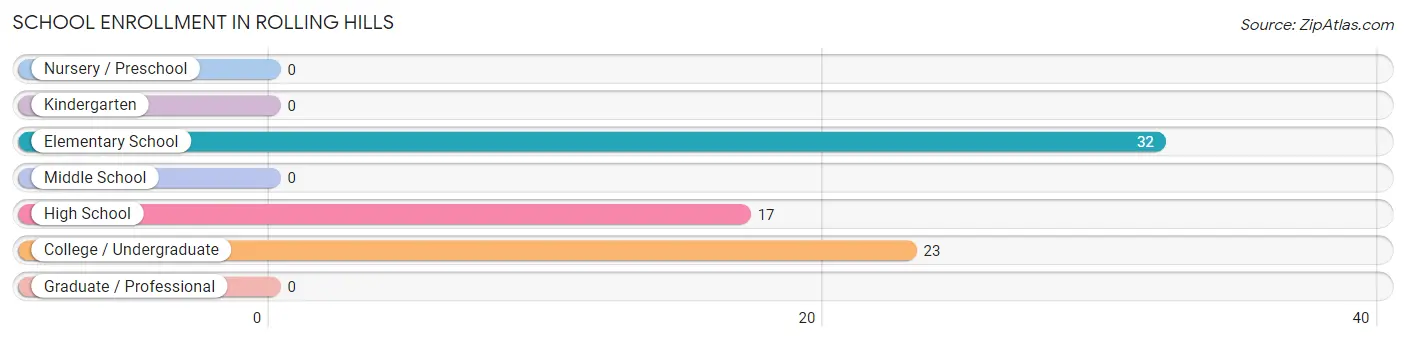
| School Level | # Students | % Students |
| Nursery / Preschool | 0 | 0.0% |
| Kindergarten | 0 | 0.0% |
| Elementary School | 32 | 44.4% |
| Middle School | 0 | 0.0% |
| High School | 17 | 23.6% |
| College / Undergraduate | 23 | 31.9% |
| Graduate / Professional | 0 | 0.0% |
| Total | 72 | 100.0% |
School Enrollment by Age by Funding Source in Rolling Hills
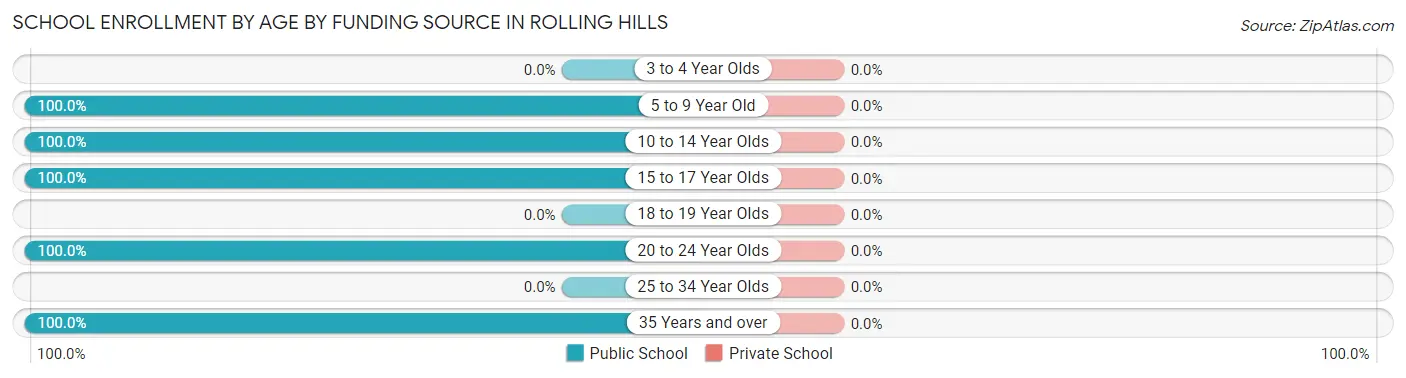
| Age Bracket | Public School | Private School |
| 3 to 4 Year Olds | 0 (0.0%) | 0 (0.0%) |
| 5 to 9 Year Old | 13 (100.0%) | 0 (0.0%) |
| 10 to 14 Year Olds | 19 (100.0%) | 0 (0.0%) |
| 15 to 17 Year Olds | 17 (100.0%) | 0 (0.0%) |
| 18 to 19 Year Olds | 0 (0.0%) | 0 (0.0%) |
| 20 to 24 Year Olds | 9 (100.0%) | 0 (0.0%) |
| 25 to 34 Year Olds | 0 (0.0%) | 0 (0.0%) |
| 35 Years and over | 14 (100.0%) | 0 (0.0%) |
| Total | 72 (100.0%) | 0 (0.0%) |
Educational Attainment by Field of Study in Rolling Hills
Science & technology (38 | 20.3%), liberal arts & history (38 | 20.3%), business (27 | 14.4%), education (24 | 12.8%), and bio, nature & agricultural (23 | 12.3%) are the most common fields of study among 187 individuals in Rolling Hills who have obtained a bachelor's degree or higher.
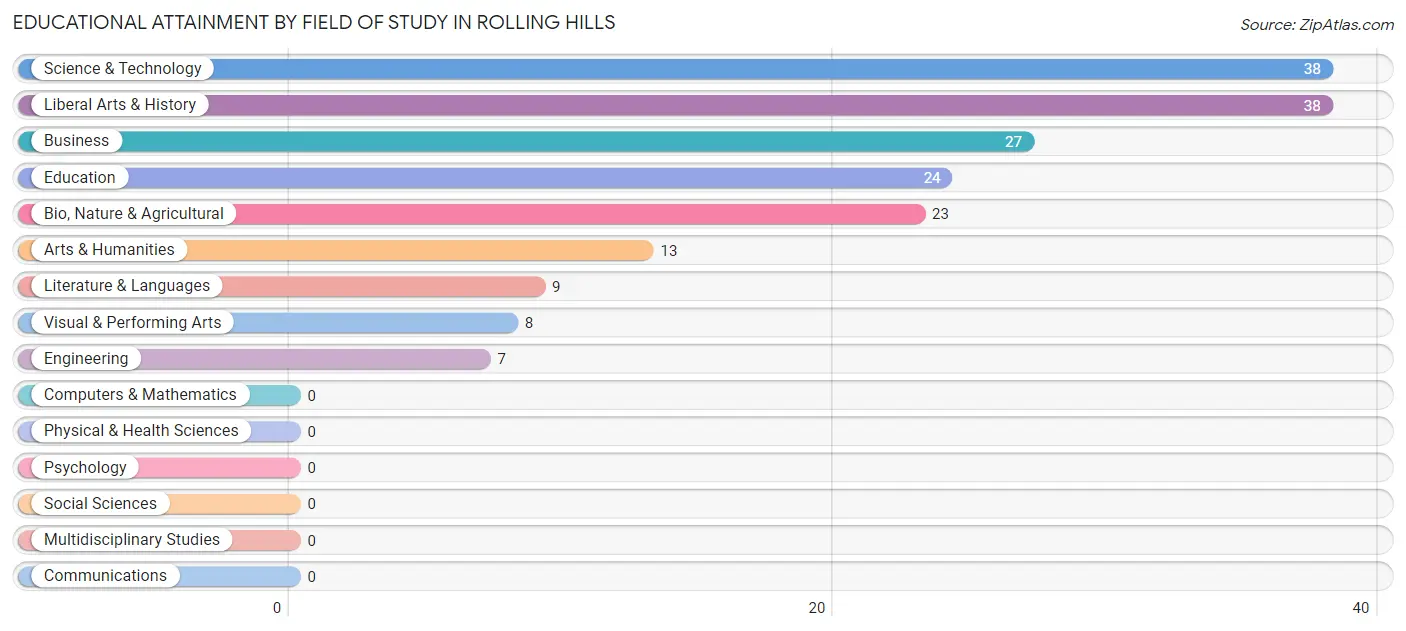
| Field of Study | # Graduates | % Graduates |
| Computers & Mathematics | 0 | 0.0% |
| Bio, Nature & Agricultural | 23 | 12.3% |
| Physical & Health Sciences | 0 | 0.0% |
| Psychology | 0 | 0.0% |
| Social Sciences | 0 | 0.0% |
| Engineering | 7 | 3.7% |
| Multidisciplinary Studies | 0 | 0.0% |
| Science & Technology | 38 | 20.3% |
| Business | 27 | 14.4% |
| Education | 24 | 12.8% |
| Literature & Languages | 9 | 4.8% |
| Liberal Arts & History | 38 | 20.3% |
| Visual & Performing Arts | 8 | 4.3% |
| Communications | 0 | 0.0% |
| Arts & Humanities | 13 | 7.0% |
| Total | 187 | 100.0% |
Transportation & Commute in Rolling Hills
Vehicle Availability by Sex in Rolling Hills
The most prevalent vehicle ownership categories in Rolling Hills are males with 2 vehicles (73, accounting for 52.5%) and females with 2 vehicles (27, making up 78.5%).
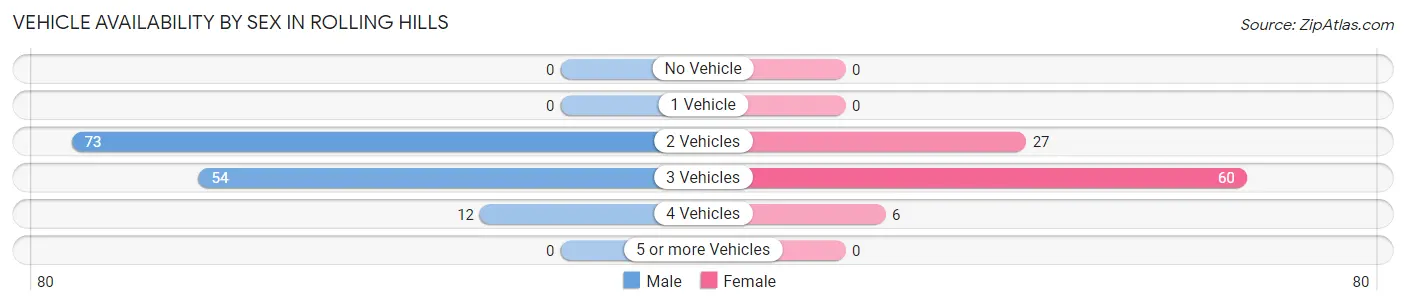
| Vehicles Available | Male | Female |
| No Vehicle | 0 (0.0%) | 0 (0.0%) |
| 1 Vehicle | 0 (0.0%) | 0 (0.0%) |
| 2 Vehicles | 73 (52.5%) | 27 (29.0%) |
| 3 Vehicles | 54 (38.9%) | 60 (64.5%) |
| 4 Vehicles | 12 (8.6%) | 6 (6.5%) |
| 5 or more Vehicles | 0 (0.0%) | 0 (0.0%) |
| Total | 139 (100.0%) | 93 (100.0%) |
Commute Time in Rolling Hills
The most frequently occuring commute durations in Rolling Hills are 20 to 24 minutes (84 commuters, 41.8%), 25 to 29 minutes (34 commuters, 16.9%), and 10 to 14 minutes (26 commuters, 12.9%).
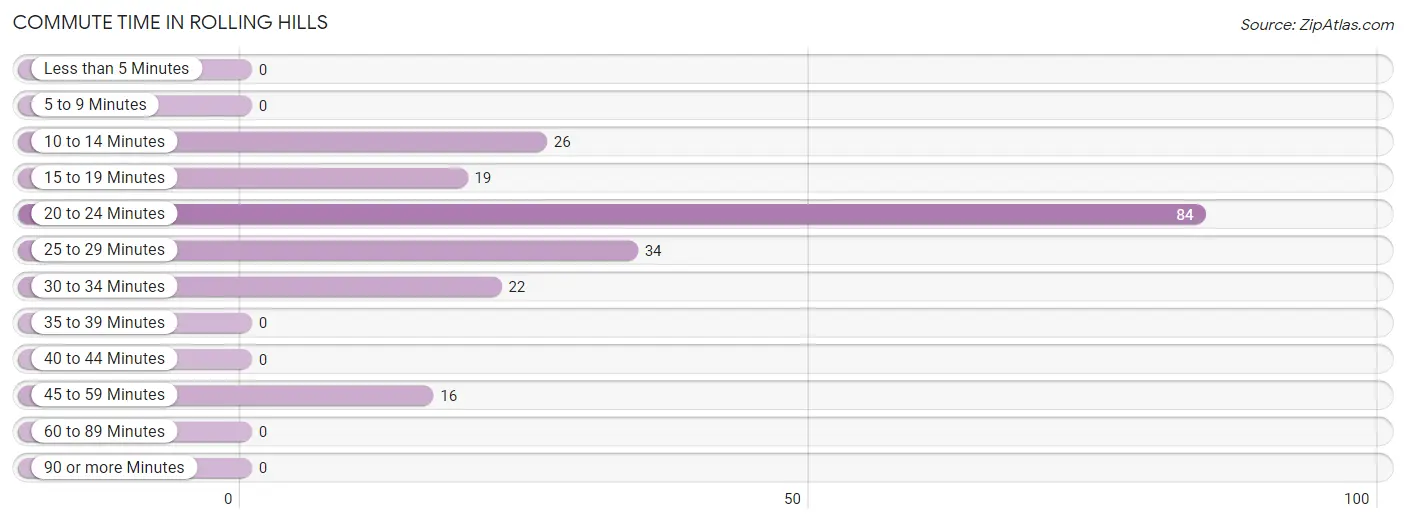
| Commute Time | # Commuters | % Commuters |
| Less than 5 Minutes | 0 | 0.0% |
| 5 to 9 Minutes | 0 | 0.0% |
| 10 to 14 Minutes | 26 | 12.9% |
| 15 to 19 Minutes | 19 | 9.5% |
| 20 to 24 Minutes | 84 | 41.8% |
| 25 to 29 Minutes | 34 | 16.9% |
| 30 to 34 Minutes | 22 | 11.0% |
| 35 to 39 Minutes | 0 | 0.0% |
| 40 to 44 Minutes | 0 | 0.0% |
| 45 to 59 Minutes | 16 | 8.0% |
| 60 to 89 Minutes | 0 | 0.0% |
| 90 or more Minutes | 0 | 0.0% |
Commute Time by Sex in Rolling Hills
The most common commute times in Rolling Hills are 20 to 24 minutes (59 commuters, 47.2%) for males and 10 to 14 minutes (26 commuters, 34.2%) for females.
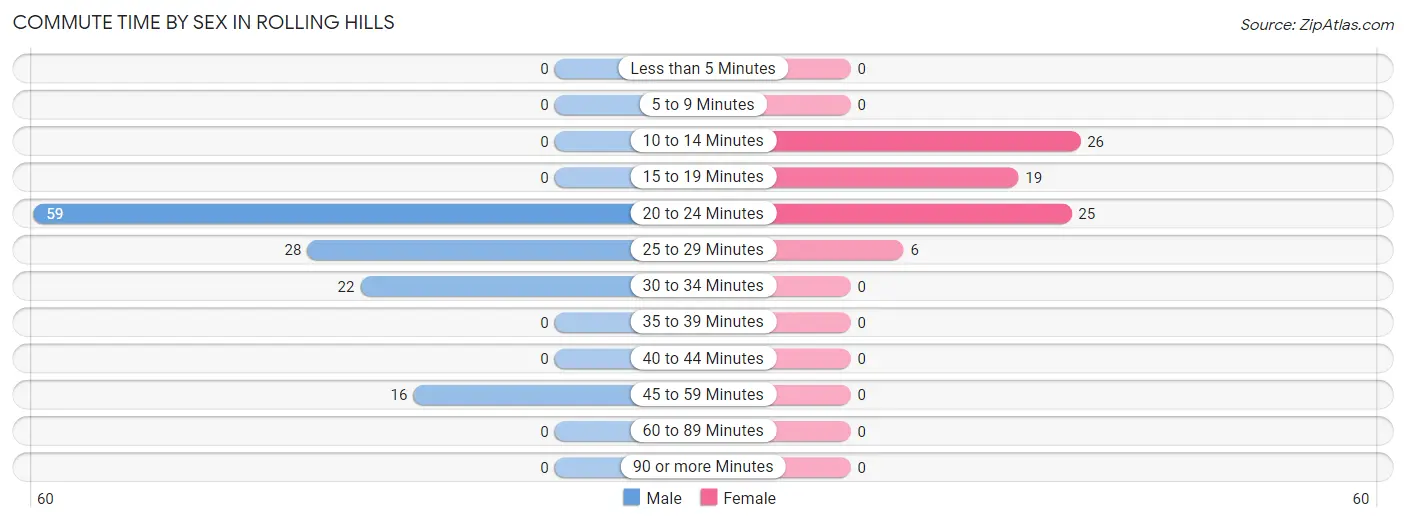
| Commute Time | Male | Female |
| Less than 5 Minutes | 0 (0.0%) | 0 (0.0%) |
| 5 to 9 Minutes | 0 (0.0%) | 0 (0.0%) |
| 10 to 14 Minutes | 0 (0.0%) | 26 (34.2%) |
| 15 to 19 Minutes | 0 (0.0%) | 19 (25.0%) |
| 20 to 24 Minutes | 59 (47.2%) | 25 (32.9%) |
| 25 to 29 Minutes | 28 (22.4%) | 6 (7.9%) |
| 30 to 34 Minutes | 22 (17.6%) | 0 (0.0%) |
| 35 to 39 Minutes | 0 (0.0%) | 0 (0.0%) |
| 40 to 44 Minutes | 0 (0.0%) | 0 (0.0%) |
| 45 to 59 Minutes | 16 (12.8%) | 0 (0.0%) |
| 60 to 89 Minutes | 0 (0.0%) | 0 (0.0%) |
| 90 or more Minutes | 0 (0.0%) | 0 (0.0%) |
Time of Departure to Work by Sex in Rolling Hills
The most frequent times of departure to work in Rolling Hills are 12:00 AM to 4:59 AM (39, 31.2%) for males and 7:30 AM to 7:59 AM (33, 43.4%) for females.
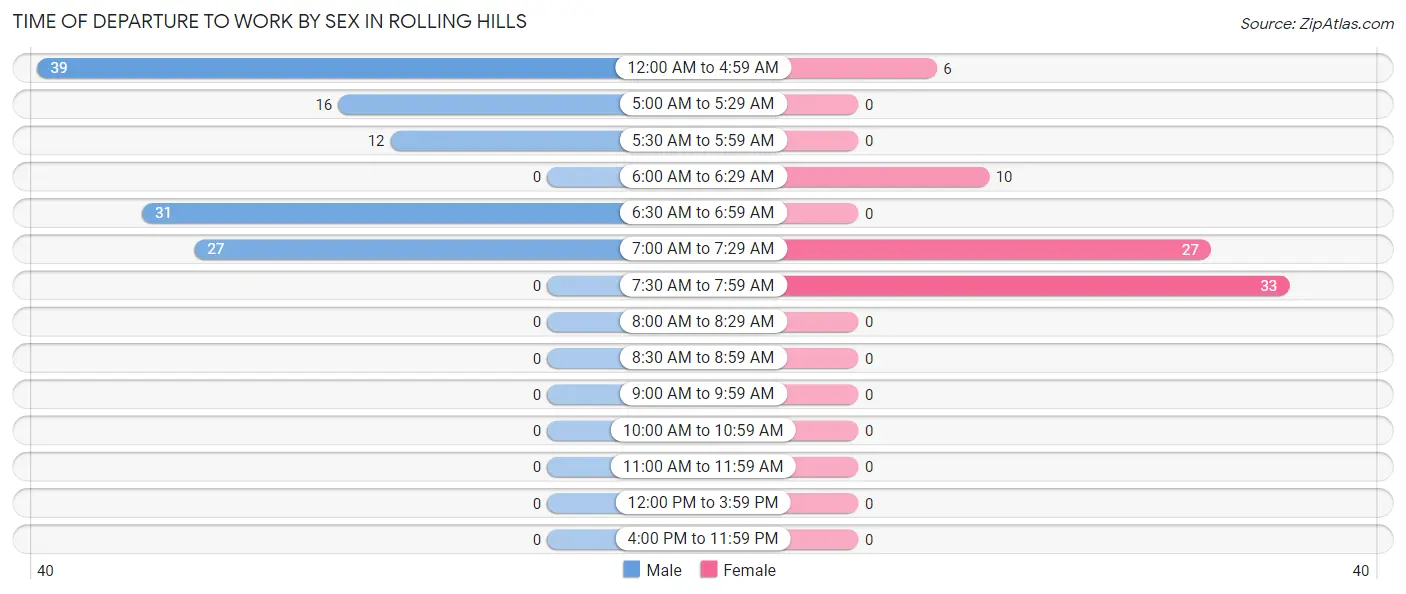
| Time of Departure | Male | Female |
| 12:00 AM to 4:59 AM | 39 (31.2%) | 6 (7.9%) |
| 5:00 AM to 5:29 AM | 16 (12.8%) | 0 (0.0%) |
| 5:30 AM to 5:59 AM | 12 (9.6%) | 0 (0.0%) |
| 6:00 AM to 6:29 AM | 0 (0.0%) | 10 (13.2%) |
| 6:30 AM to 6:59 AM | 31 (24.8%) | 0 (0.0%) |
| 7:00 AM to 7:29 AM | 27 (21.6%) | 27 (35.5%) |
| 7:30 AM to 7:59 AM | 0 (0.0%) | 33 (43.4%) |
| 8:00 AM to 8:29 AM | 0 (0.0%) | 0 (0.0%) |
| 8:30 AM to 8:59 AM | 0 (0.0%) | 0 (0.0%) |
| 9:00 AM to 9:59 AM | 0 (0.0%) | 0 (0.0%) |
| 10:00 AM to 10:59 AM | 0 (0.0%) | 0 (0.0%) |
| 11:00 AM to 11:59 AM | 0 (0.0%) | 0 (0.0%) |
| 12:00 PM to 3:59 PM | 0 (0.0%) | 0 (0.0%) |
| 4:00 PM to 11:59 PM | 0 (0.0%) | 0 (0.0%) |
| Total | 125 (100.0%) | 76 (100.0%) |
Housing Occupancy in Rolling Hills
Occupancy by Ownership in Rolling Hills
Of the total 570 dwellings in Rolling Hills, owner-occupied units account for 525 (92.1%), while renter-occupied units make up 45 (7.9%).
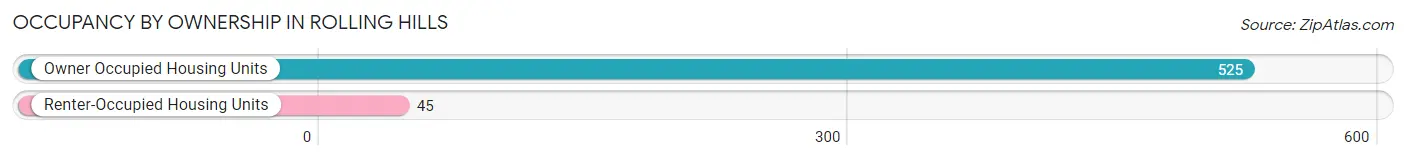
| Occupancy | # Housing Units | % Housing Units |
| Owner Occupied Housing Units | 525 | 92.1% |
| Renter-Occupied Housing Units | 45 | 7.9% |
| Total Occupied Housing Units | 570 | 100.0% |
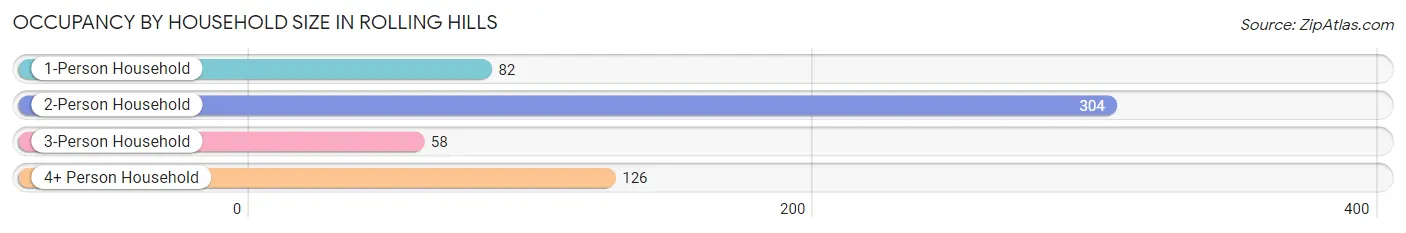
Occupancy by Household Size in Rolling Hills
| Household Size | # Housing Units | % Housing Units |
| 1-Person Household | 82 | 14.4% |
| 2-Person Household | 304 | 53.3% |
| 3-Person Household | 58 | 10.2% |
| 4+ Person Household | 126 | 22.1% |
| Total Housing Units | 570 | 100.0% |
Occupancy by Ownership by Household Size in Rolling Hills
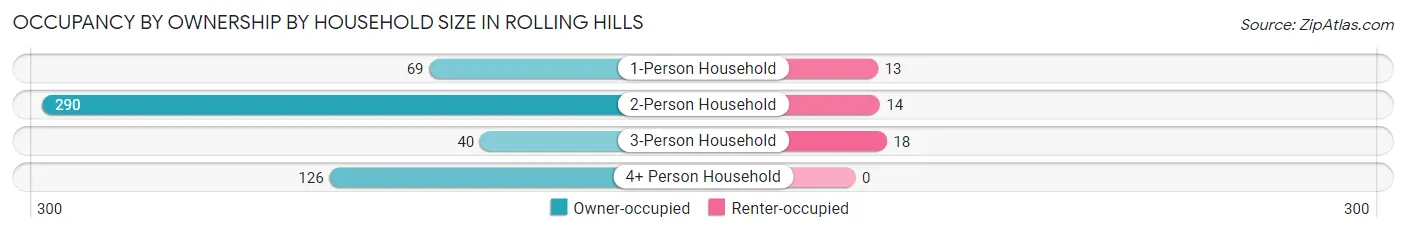
| Household Size | Owner-occupied | Renter-occupied |
| 1-Person Household | 69 (84.2%) | 13 (15.9%) |
| 2-Person Household | 290 (95.4%) | 14 (4.6%) |
| 3-Person Household | 40 (69.0%) | 18 (31.0%) |
| 4+ Person Household | 126 (100.0%) | 0 (0.0%) |
| Total Housing Units | 525 (92.1%) | 45 (7.9%) |
Occupancy by Educational Attainment in Rolling Hills
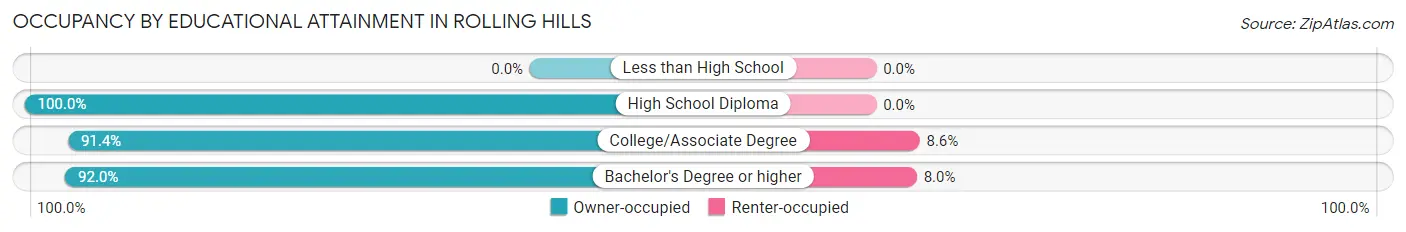
| Household Size | Owner-occupied | Renter-occupied |
| Less than High School | 0 (0.0%) | 0 (0.0%) |
| High School Diploma | 17 (100.0%) | 0 (0.0%) |
| College/Associate Degree | 85 (91.4%) | 8 (8.6%) |
| Bachelor's Degree or higher | 423 (92.0%) | 37 (8.0%) |
Occupancy by Age of Householder in Rolling Hills
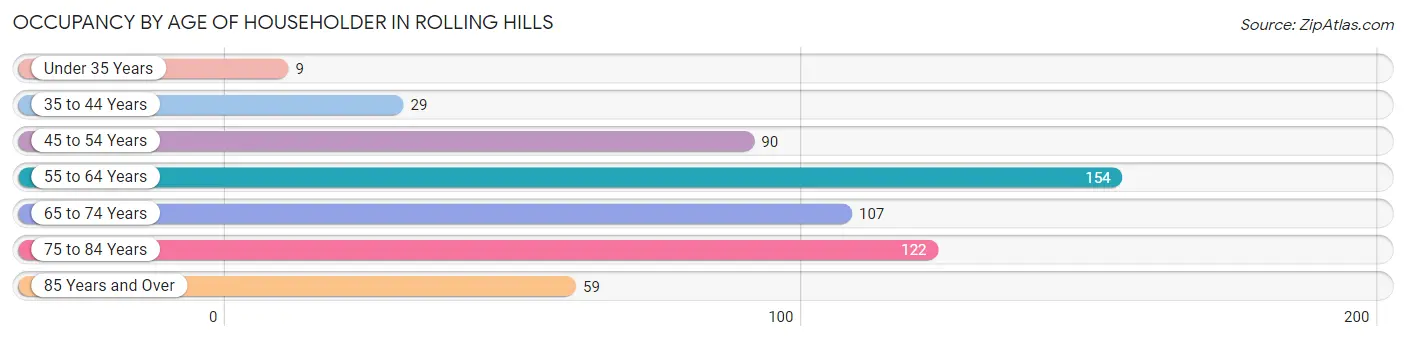
| Age Bracket | # Households | % Households |
| Under 35 Years | 9 | 1.6% |
| 35 to 44 Years | 29 | 5.1% |
| 45 to 54 Years | 90 | 15.8% |
| 55 to 64 Years | 154 | 27.0% |
| 65 to 74 Years | 107 | 18.8% |
| 75 to 84 Years | 122 | 21.4% |
| 85 Years and Over | 59 | 10.3% |
| Total | 570 | 100.0% |
Housing Finances in Rolling Hills
Median Income by Occupancy in Rolling Hills
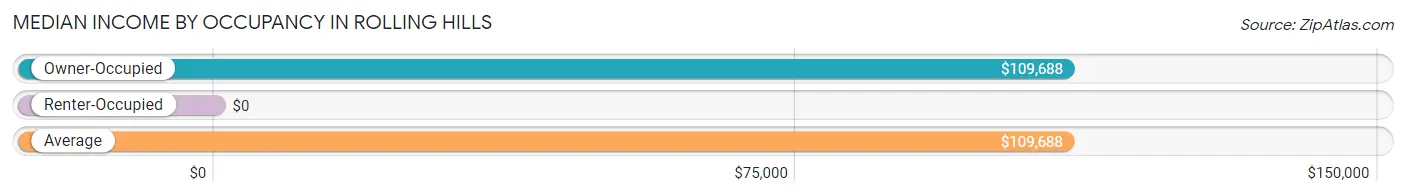
| Occupancy Type | # Households | Median Income |
| Owner-Occupied | 249 (100.0%) | $109,688 |
| Renter-Occupied | 0 (0.0%) | $0 |
| Average | 249 (100.0%) | $109,688 |
Occupancy by Householder Income Bracket in Rolling Hills
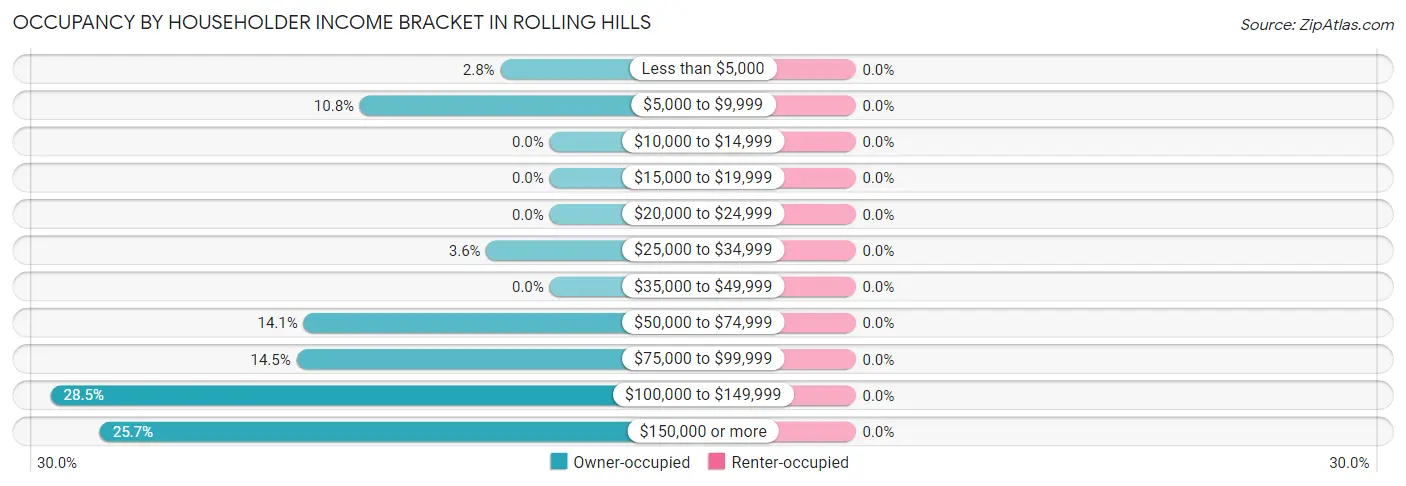
| Income Bracket | Owner-occupied | Renter-occupied |
| Less than $5,000 | 7 (2.8%) | 0 (0.0%) |
| $5,000 to $9,999 | 27 (10.8%) | 0 (0.0%) |
| $10,000 to $14,999 | 0 (0.0%) | 0 (0.0%) |
| $15,000 to $19,999 | 0 (0.0%) | 0 (0.0%) |
| $20,000 to $24,999 | 0 (0.0%) | 0 (0.0%) |
| $25,000 to $34,999 | 9 (3.6%) | 0 (0.0%) |
| $35,000 to $49,999 | 0 (0.0%) | 0 (0.0%) |
| $50,000 to $74,999 | 35 (14.1%) | 0 (0.0%) |
| $75,000 to $99,999 | 36 (14.5%) | 0 (0.0%) |
| $100,000 to $149,999 | 71 (28.5%) | 0 (0.0%) |
| $150,000 or more | 64 (25.7%) | 0 (0.0%) |
| Total | 249 (100.0%) | 0 (0.0%) |
Monthly Housing Cost Tiers in Rolling Hills
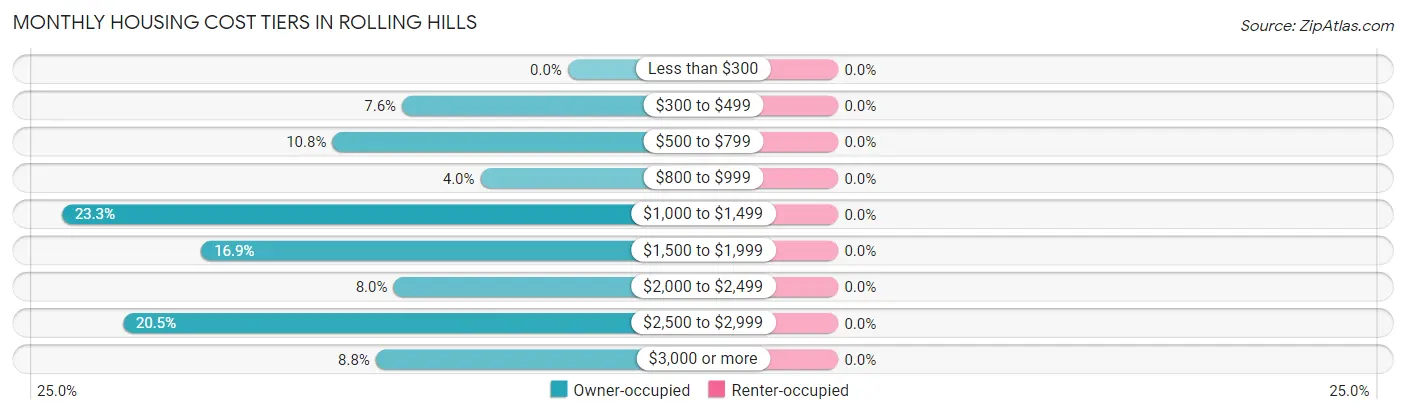
| Monthly Cost | Owner-occupied | Renter-occupied |
| Less than $300 | 0 (0.0%) | 0 (0.0%) |
| $300 to $499 | 19 (7.6%) | 0 (0.0%) |
| $500 to $799 | 27 (10.8%) | 0 (0.0%) |
| $800 to $999 | 10 (4.0%) | 0 (0.0%) |
| $1,000 to $1,499 | 58 (23.3%) | 0 (0.0%) |
| $1,500 to $1,999 | 42 (16.9%) | 0 (0.0%) |
| $2,000 to $2,499 | 20 (8.0%) | 0 (0.0%) |
| $2,500 to $2,999 | 51 (20.5%) | 0 (0.0%) |
| $3,000 or more | 22 (8.8%) | 0 (0.0%) |
| Total | 249 (100.0%) | 0 (0.0%) |
Physical Housing Characteristics in Rolling Hills
Housing Structures in Rolling Hills
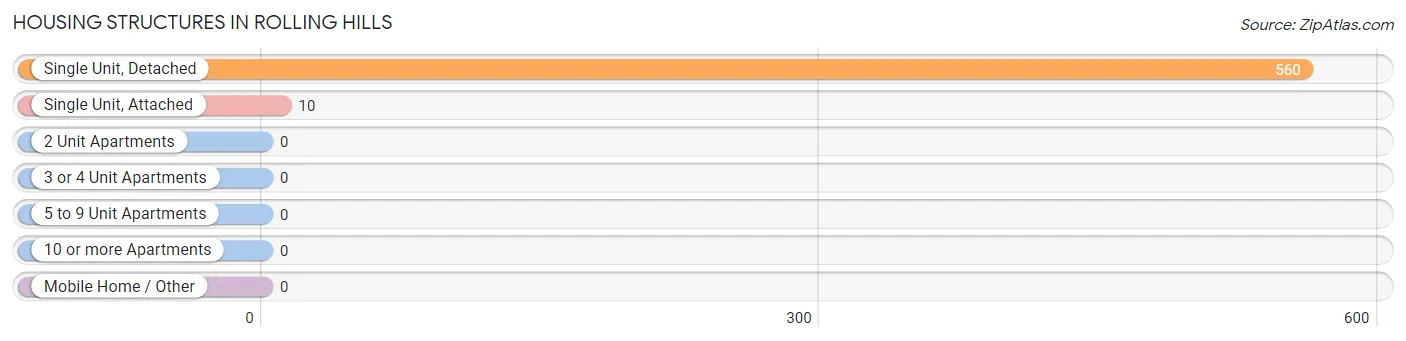
| Structure Type | # Housing Units | % Housing Units |
| Single Unit, Detached | 560 | 98.3% |
| Single Unit, Attached | 10 | 1.8% |
| 2 Unit Apartments | 0 | 0.0% |
| 3 or 4 Unit Apartments | 0 | 0.0% |
| 5 to 9 Unit Apartments | 0 | 0.0% |
| 10 or more Apartments | 0 | 0.0% |
| Mobile Home / Other | 0 | 0.0% |
| Total | 570 | 100.0% |
Housing Structures by Occupancy in Rolling Hills
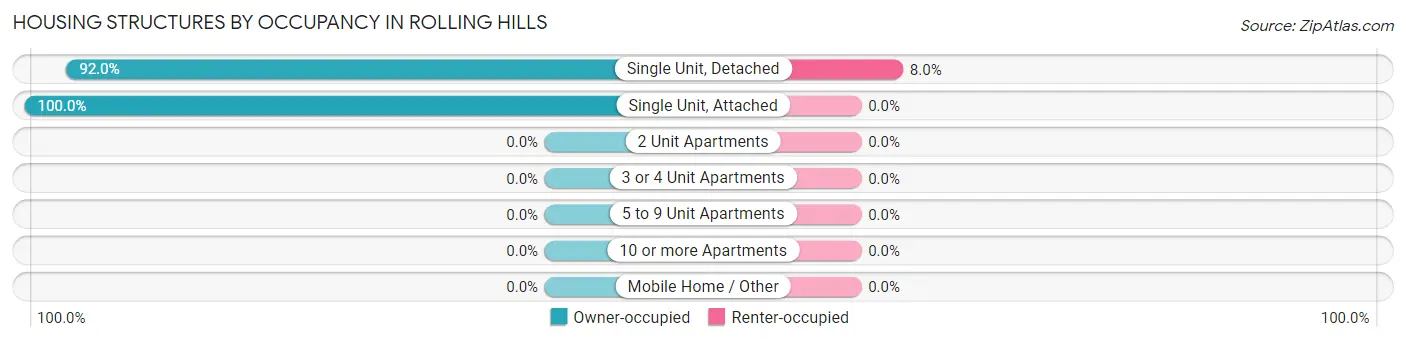
| Structure Type | Owner-occupied | Renter-occupied |
| Single Unit, Detached | 515 (92.0%) | 45 (8.0%) |
| Single Unit, Attached | 10 (100.0%) | 0 (0.0%) |
| 2 Unit Apartments | 0 (0.0%) | 0 (0.0%) |
| 3 or 4 Unit Apartments | 0 (0.0%) | 0 (0.0%) |
| 5 to 9 Unit Apartments | 0 (0.0%) | 0 (0.0%) |
| 10 or more Apartments | 0 (0.0%) | 0 (0.0%) |
| Mobile Home / Other | 0 (0.0%) | 0 (0.0%) |
| Total | 525 (92.1%) | 45 (7.9%) |
Housing Structures by Number of Rooms in Rolling Hills
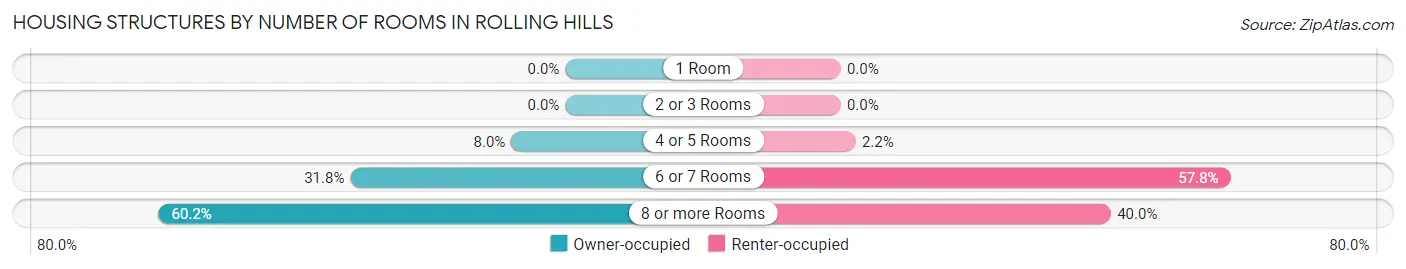
| Number of Rooms | Owner-occupied | Renter-occupied |
| 1 Room | 0 (0.0%) | 0 (0.0%) |
| 2 or 3 Rooms | 0 (0.0%) | 0 (0.0%) |
| 4 or 5 Rooms | 42 (8.0%) | 1 (2.2%) |
| 6 or 7 Rooms | 167 (31.8%) | 26 (57.8%) |
| 8 or more Rooms | 316 (60.2%) | 18 (40.0%) |
| Total | 525 (100.0%) | 45 (100.0%) |
Housing Structure by Heating Type in Rolling Hills
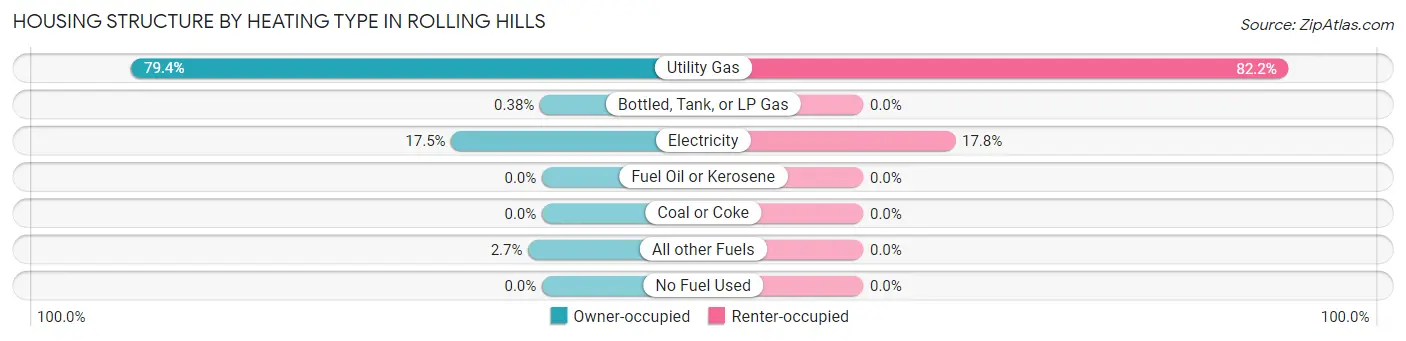
| Heating Type | Owner-occupied | Renter-occupied |
| Utility Gas | 417 (79.4%) | 37 (82.2%) |
| Bottled, Tank, or LP Gas | 2 (0.4%) | 0 (0.0%) |
| Electricity | 92 (17.5%) | 8 (17.8%) |
| Fuel Oil or Kerosene | 0 (0.0%) | 0 (0.0%) |
| Coal or Coke | 0 (0.0%) | 0 (0.0%) |
| All other Fuels | 14 (2.7%) | 0 (0.0%) |
| No Fuel Used | 0 (0.0%) | 0 (0.0%) |
| Total | 525 (100.0%) | 45 (100.0%) |
Household Vehicle Usage in Rolling Hills
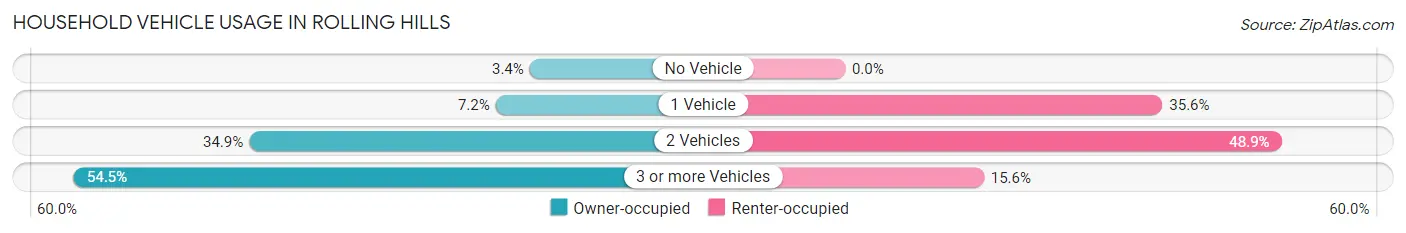
| Vehicles per Household | Owner-occupied | Renter-occupied |
| No Vehicle | 18 (3.4%) | 0 (0.0%) |
| 1 Vehicle | 38 (7.2%) | 16 (35.6%) |
| 2 Vehicles | 183 (34.9%) | 22 (48.9%) |
| 3 or more Vehicles | 286 (54.5%) | 7 (15.6%) |
| Total | 525 (100.0%) | 45 (100.0%) |
Real Estate & Mortgages in Rolling Hills
Real Estate and Mortgage Overview in Rolling Hills
| Characteristic | Without Mortgage | With Mortgage |
| Housing Units | 80 | 169 |
| Median Property Value | $569,800 | $509,900 |
| Median Household Income | - | - |
| Monthly Housing Costs | $1,030 | $22 |
| Real Estate Taxes | - | - |
Property Value by Mortgage Status in Rolling Hills
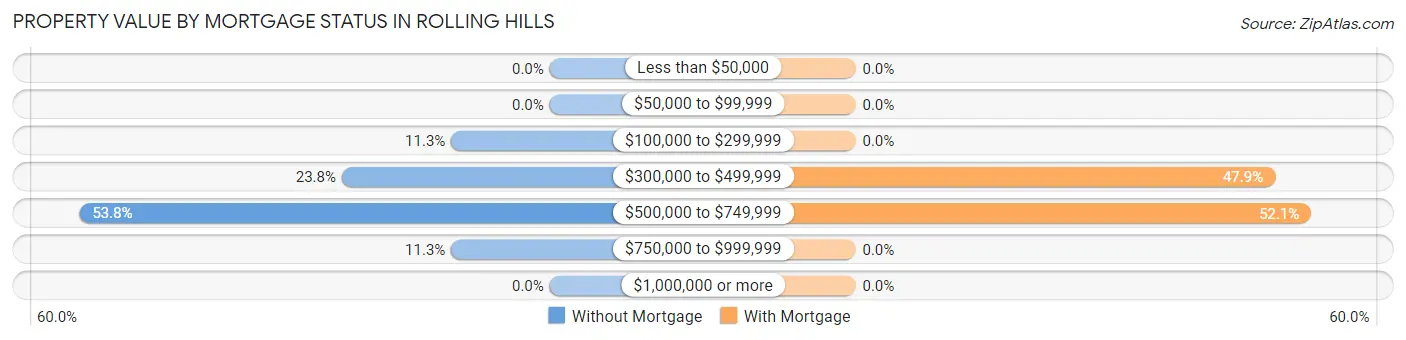
| Property Value | Without Mortgage | With Mortgage |
| Less than $50,000 | 0 (0.0%) | 0 (0.0%) |
| $50,000 to $99,999 | 0 (0.0%) | 0 (0.0%) |
| $100,000 to $299,999 | 9 (11.3%) | 0 (0.0%) |
| $300,000 to $499,999 | 19 (23.7%) | 81 (47.9%) |
| $500,000 to $749,999 | 43 (53.7%) | 88 (52.1%) |
| $750,000 to $999,999 | 9 (11.3%) | 0 (0.0%) |
| $1,000,000 or more | 0 (0.0%) | 0 (0.0%) |
| Total | 80 (100.0%) | 169 (100.0%) |
Household Income by Mortgage Status in Rolling Hills
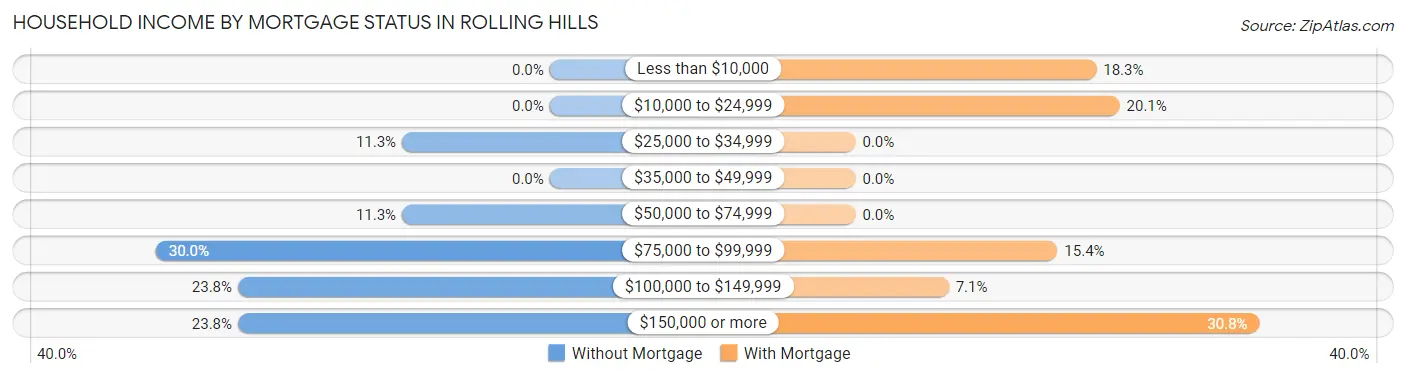
| Household Income | Without Mortgage | With Mortgage |
| Less than $10,000 | 0 (0.0%) | 31 (18.3%) |
| $10,000 to $24,999 | 0 (0.0%) | 34 (20.1%) |
| $25,000 to $34,999 | 9 (11.3%) | 0 (0.0%) |
| $35,000 to $49,999 | 0 (0.0%) | 0 (0.0%) |
| $50,000 to $74,999 | 9 (11.3%) | 0 (0.0%) |
| $75,000 to $99,999 | 24 (30.0%) | 26 (15.4%) |
| $100,000 to $149,999 | 19 (23.7%) | 12 (7.1%) |
| $150,000 or more | 19 (23.7%) | 52 (30.8%) |
| Total | 80 (100.0%) | 169 (100.0%) |
Property Value to Household Income Ratio in Rolling Hills
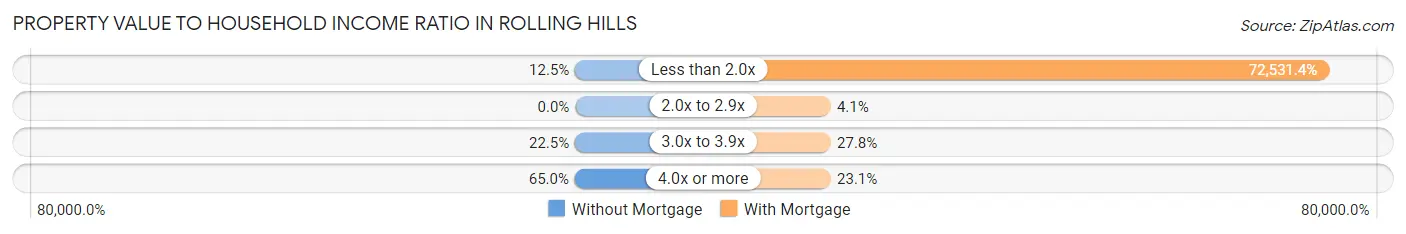
| Value-to-Income Ratio | Without Mortgage | With Mortgage |
| Less than 2.0x | 10 (12.5%) | 122,578 (72,531.4%) |
| 2.0x to 2.9x | 0 (0.0%) | 7 (4.1%) |
| 3.0x to 3.9x | 18 (22.5%) | 47 (27.8%) |
| 4.0x or more | 52 (65.0%) | 39 (23.1%) |
| Total | 80 (100.0%) | 169 (100.0%) |
Real Estate Taxes by Mortgage Status in Rolling Hills
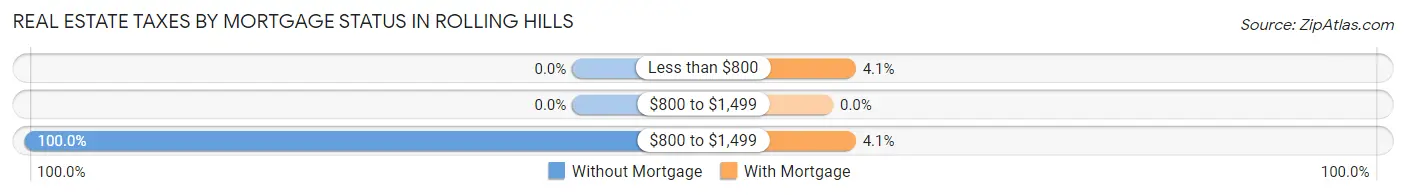
| Property Taxes | Without Mortgage | With Mortgage |
| Less than $800 | 0 (0.0%) | 7 (4.1%) |
| $800 to $1,499 | 0 (0.0%) | 0 (0.0%) |
| $800 to $1,499 | 80 (100.0%) | 7 (4.1%) |
| Total | 80 (100.0%) | 169 (100.0%) |
Health & Disability in Rolling Hills
Health Insurance Coverage by Age in Rolling Hills
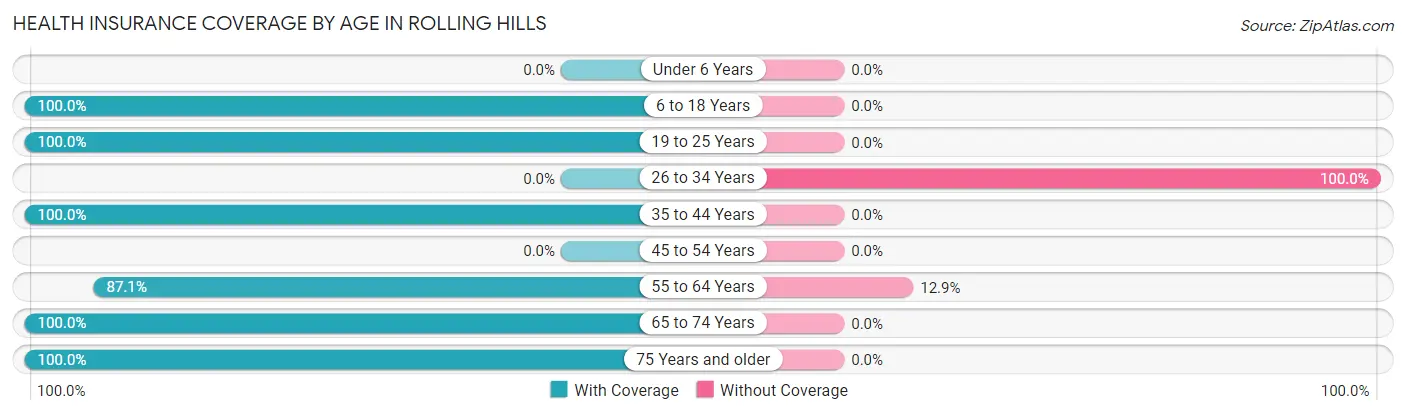
| Age Bracket | With Coverage | Without Coverage |
| Under 6 Years | 0 (0.0%) | 0 (0.0%) |
| 6 to 18 Years | 66 (100.0%) | 0 (0.0%) |
| 19 to 25 Years | 9 (100.0%) | 0 (0.0%) |
| 26 to 34 Years | 0 (0.0%) | 28 (100.0%) |
| 35 to 44 Years | 58 (100.0%) | 0 (0.0%) |
| 45 to 54 Years | 0 (0.0%) | 0 (0.0%) |
| 55 to 64 Years | 149 (87.1%) | 22 (12.9%) |
| 65 to 74 Years | 123 (100.0%) | 0 (0.0%) |
| 75 Years and older | 84 (100.0%) | 0 (0.0%) |
| Total | 489 (90.7%) | 50 (9.3%) |
Health Insurance Coverage by Citizenship Status in Rolling Hills
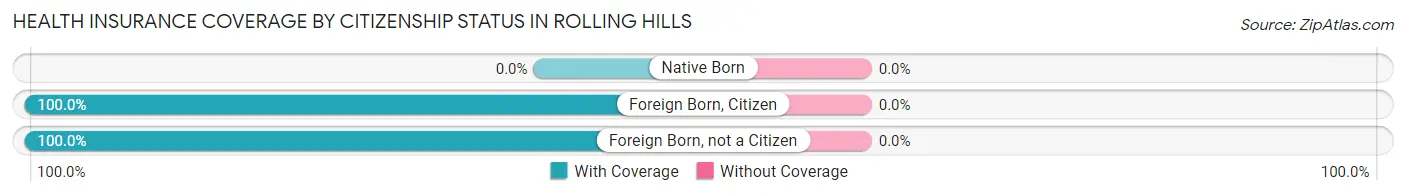
| Citizenship Status | With Coverage | Without Coverage |
| Native Born | 0 (0.0%) | 0 (0.0%) |
| Foreign Born, Citizen | 66 (100.0%) | 0 (0.0%) |
| Foreign Born, not a Citizen | 9 (100.0%) | 0 (0.0%) |
Health Insurance Coverage by Household Income in Rolling Hills
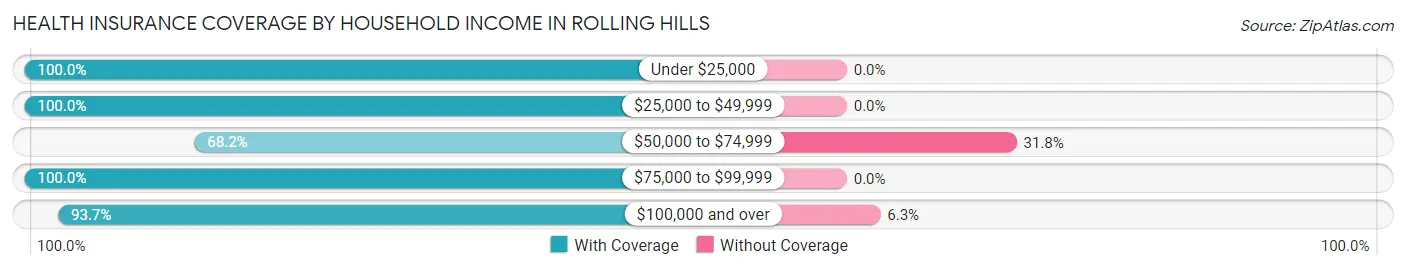
| Household Income | With Coverage | Without Coverage |
| Under $25,000 | 34 (100.0%) | 0 (0.0%) |
| $25,000 to $49,999 | 9 (100.0%) | 0 (0.0%) |
| $50,000 to $74,999 | 60 (68.2%) | 28 (31.8%) |
| $75,000 to $99,999 | 58 (100.0%) | 0 (0.0%) |
| $100,000 and over | 328 (93.7%) | 22 (6.3%) |
Public vs Private Health Insurance Coverage by Age in Rolling Hills
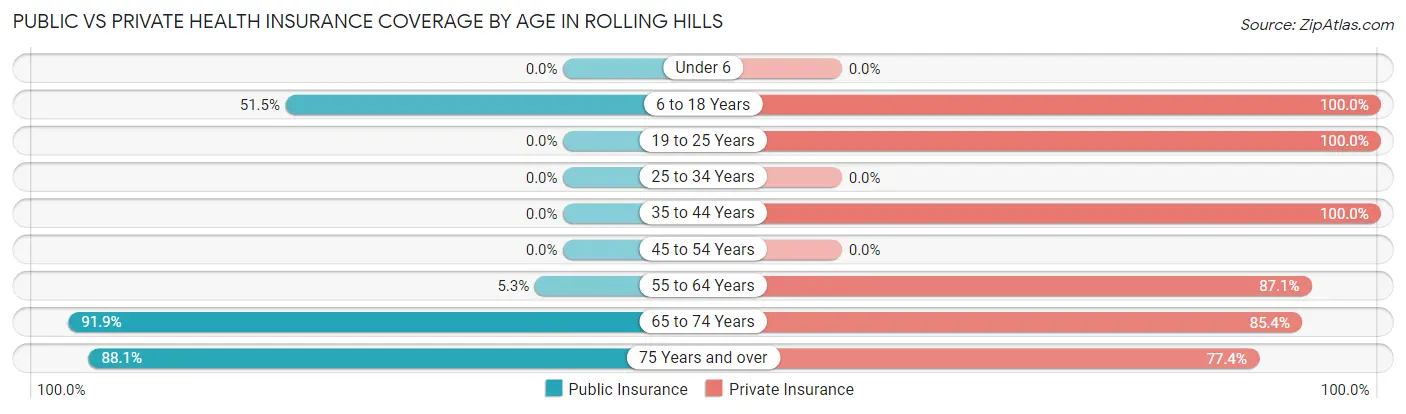
| Age Bracket | Public Insurance | Private Insurance |
| Under 6 | 0 (0.0%) | 0 (0.0%) |
| 6 to 18 Years | 34 (51.5%) | 66 (100.0%) |
| 19 to 25 Years | 0 (0.0%) | 9 (100.0%) |
| 25 to 34 Years | 0 (0.0%) | 0 (0.0%) |
| 35 to 44 Years | 0 (0.0%) | 58 (100.0%) |
| 45 to 54 Years | 0 (0.0%) | 0 (0.0%) |
| 55 to 64 Years | 9 (5.3%) | 149 (87.1%) |
| 65 to 74 Years | 113 (91.9%) | 105 (85.4%) |
| 75 Years and over | 74 (88.1%) | 65 (77.4%) |
| Total | 230 (42.7%) | 452 (83.9%) |
Disability Status by Sex by Age in Rolling Hills
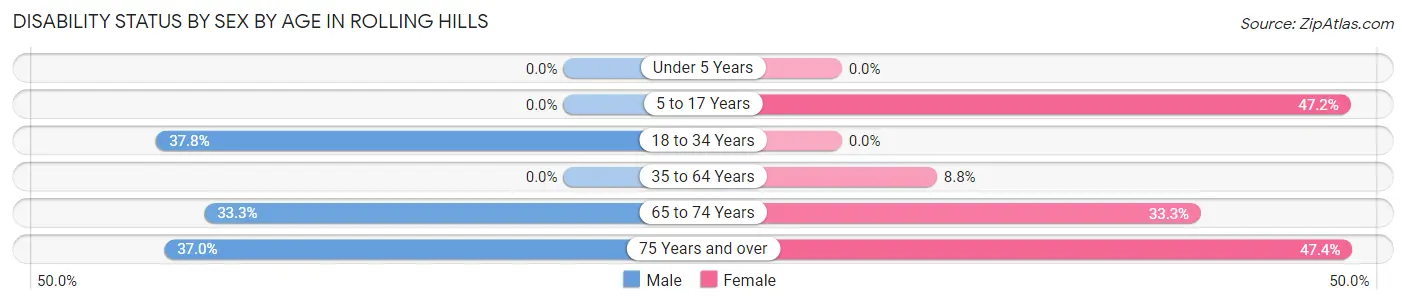
| Age Bracket | Male | Female |
| Under 5 Years | 0 (0.0%) | 0 (0.0%) |
| 5 to 17 Years | 0 (0.0%) | 17 (47.2%) |
| 18 to 34 Years | 17 (37.8%) | 0 (0.0%) |
| 35 to 64 Years | 0 (0.0%) | 9 (8.8%) |
| 65 to 74 Years | 15 (33.3%) | 26 (33.3%) |
| 75 Years and over | 10 (37.0%) | 27 (47.4%) |
Disability Class by Sex by Age in Rolling Hills
Disability Class: Hearing Difficulty
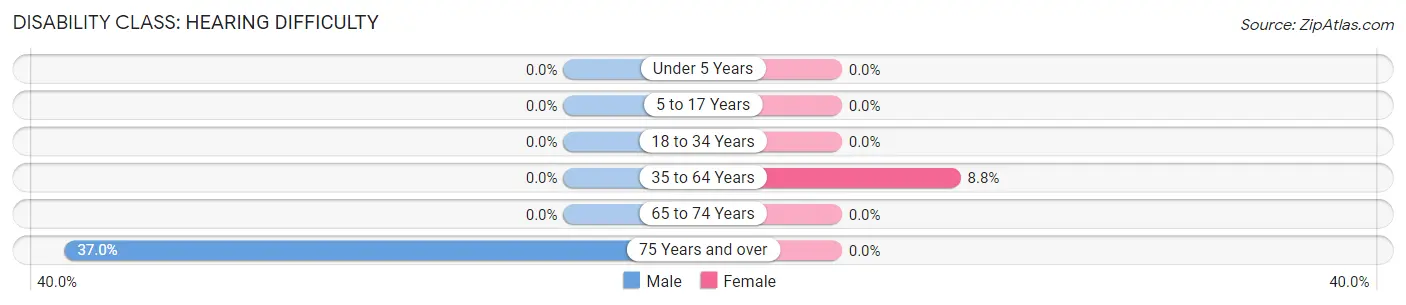
| Age Bracket | Male | Female |
| Under 5 Years | 0 (0.0%) | 0 (0.0%) |
| 5 to 17 Years | 0 (0.0%) | 0 (0.0%) |
| 18 to 34 Years | 0 (0.0%) | 0 (0.0%) |
| 35 to 64 Years | 0 (0.0%) | 9 (8.8%) |
| 65 to 74 Years | 0 (0.0%) | 0 (0.0%) |
| 75 Years and over | 10 (37.0%) | 0 (0.0%) |
Disability Class: Vision Difficulty
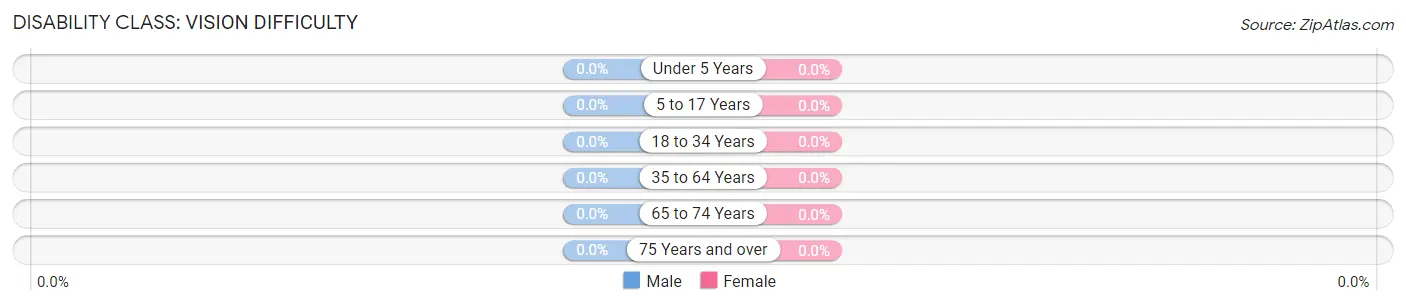
| Age Bracket | Male | Female |
| Under 5 Years | 0 (0.0%) | 0 (0.0%) |
| 5 to 17 Years | 0 (0.0%) | 0 (0.0%) |
| 18 to 34 Years | 0 (0.0%) | 0 (0.0%) |
| 35 to 64 Years | 0 (0.0%) | 0 (0.0%) |
| 65 to 74 Years | 0 (0.0%) | 0 (0.0%) |
| 75 Years and over | 0 (0.0%) | 0 (0.0%) |
Disability Class: Cognitive Difficulty
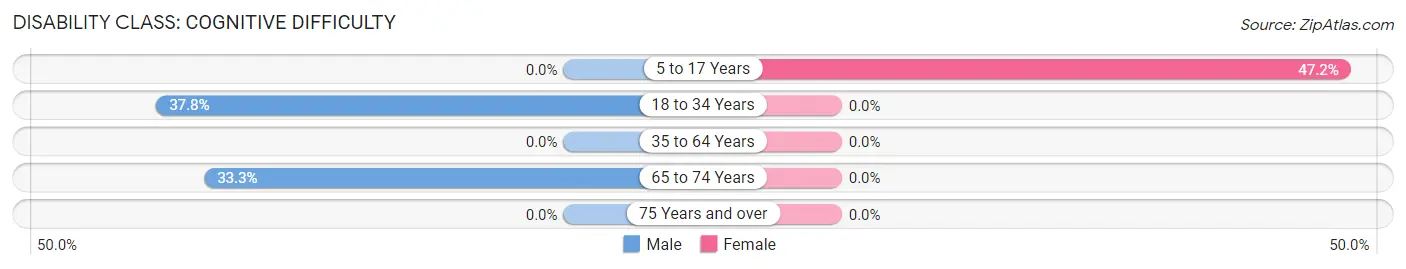
| Age Bracket | Male | Female |
| 5 to 17 Years | 0 (0.0%) | 17 (47.2%) |
| 18 to 34 Years | 17 (37.8%) | 0 (0.0%) |
| 35 to 64 Years | 0 (0.0%) | 0 (0.0%) |
| 65 to 74 Years | 15 (33.3%) | 0 (0.0%) |
| 75 Years and over | 0 (0.0%) | 0 (0.0%) |
Disability Class: Ambulatory Difficulty
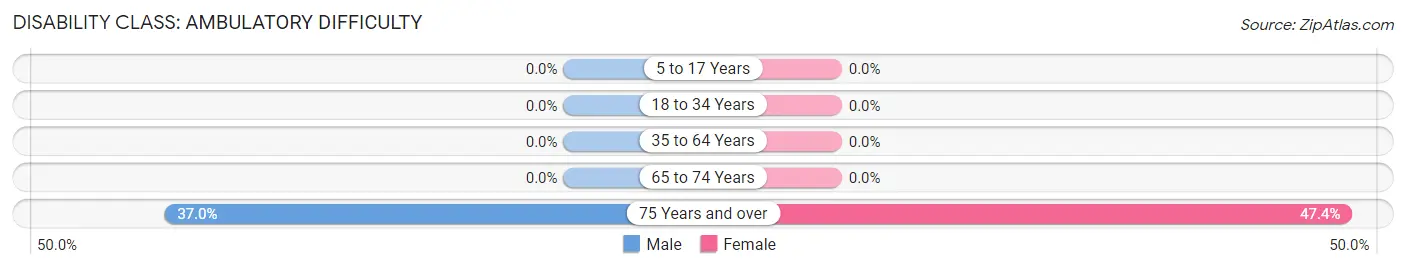
| Age Bracket | Male | Female |
| 5 to 17 Years | 0 (0.0%) | 0 (0.0%) |
| 18 to 34 Years | 0 (0.0%) | 0 (0.0%) |
| 35 to 64 Years | 0 (0.0%) | 0 (0.0%) |
| 65 to 74 Years | 0 (0.0%) | 0 (0.0%) |
| 75 Years and over | 10 (37.0%) | 27 (47.4%) |
Disability Class: Self-Care Difficulty
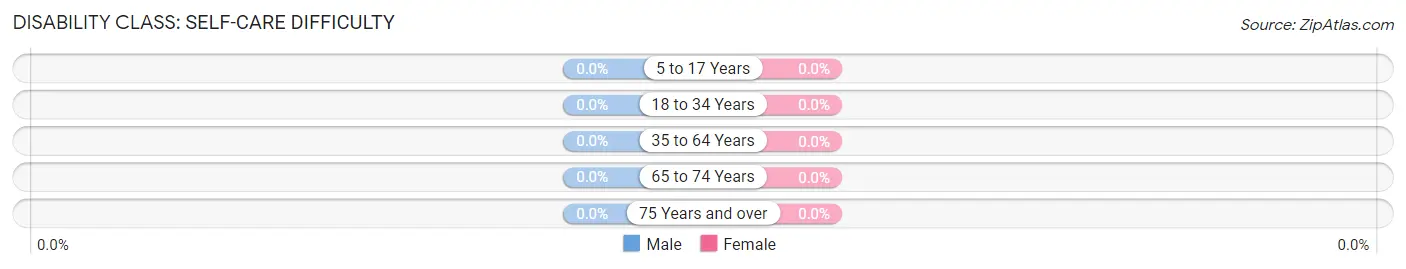
| Age Bracket | Male | Female |
| 5 to 17 Years | 0 (0.0%) | 0 (0.0%) |
| 18 to 34 Years | 0 (0.0%) | 0 (0.0%) |
| 35 to 64 Years | 0 (0.0%) | 0 (0.0%) |
| 65 to 74 Years | 0 (0.0%) | 0 (0.0%) |
| 75 Years and over | 0 (0.0%) | 0 (0.0%) |
Technology Access in Rolling Hills
Computing Device Access in Rolling Hills
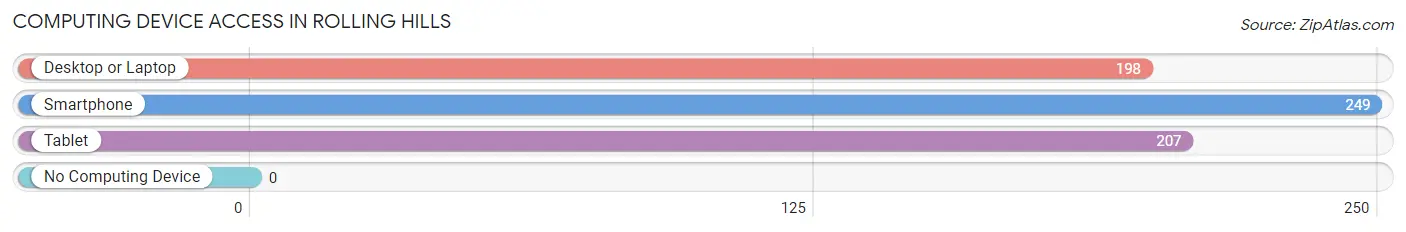
| Device Type | # Households | % Households |
| Desktop or Laptop | 198 | 79.5% |
| Smartphone | 249 | 100.0% |
| Tablet | 207 | 83.1% |
| No Computing Device | 0 | 0.0% |
| Total | 249 | 100.0% |
Internet Access in Rolling Hills
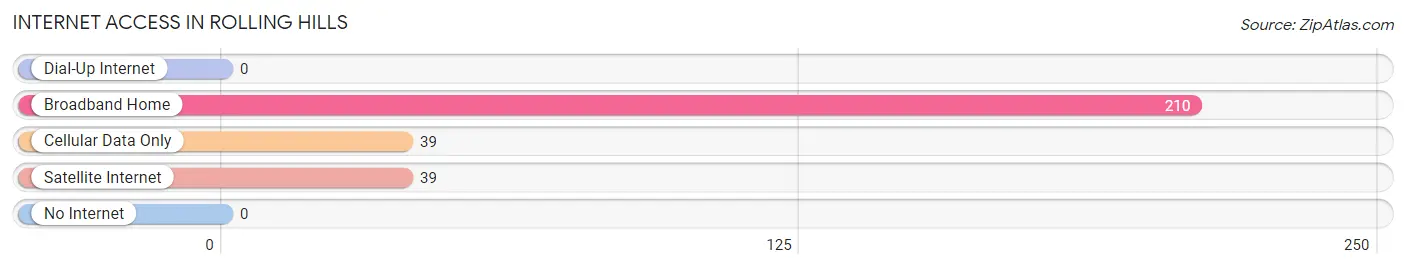
| Internet Type | # Households | % Households |
| Dial-Up Internet | 0 | 0.0% |
| Broadband Home | 210 | 84.3% |
| Cellular Data Only | 39 | 15.7% |
| Satellite Internet | 39 | 15.7% |
| No Internet | 0 | 0.0% |
| Total | 249 | 100.0% |
Rolling Hills Summary
Rolling Hills, California is a small, affluent city located in the South Bay region of Los Angeles County. It is bordered by the cities of Palos Verdes Estates to the north, Torrance to the east, and Rancho Palos Verdes to the south. Rolling Hills is an incorporated city, and is one of the wealthiest cities in the United States.
History
Rolling Hills was founded in 1957 by a group of investors who purchased the land from the Palos Verdes Corporation. The city was incorporated in 1957, and the first mayor was elected in 1958. The city was designed to be a rural, residential community, and the city's founders sought to create a place where people could live in a rural setting while still having access to the amenities of a larger city.
Geography
Rolling Hills is located in the South Bay region of Los Angeles County, and is bordered by the cities of Palos Verdes Estates to the north, Torrance to the east, and Rancho Palos Verdes to the south. The city is located on the Palos Verdes Peninsula, and is surrounded by rolling hills and canyons. The city covers an area of 3.2 square miles, and has a population of 1,872 as of the 2010 census.
Economy
Rolling Hills is an affluent city, and the median household income is $170,000. The city is home to many wealthy residents, and the city's economy is largely based on the service industry. The city is home to several high-end shopping centers, restaurants, and other businesses. The city is also home to several corporate offices, including the headquarters of the Los Angeles Times.
Demographics
As of the 2010 census, Rolling Hills had a population of 1,872. The racial makeup of the city was 87.2% White, 0.7% African American, 0.2% Native American, 8.2% Asian, 0.1% Pacific Islander, 0.7% from other races, and 2.9% from two or more races. Hispanic or Latino of any race were 4.3% of the population.
The median age in Rolling Hills was 48.2 years. About 24.3% of residents were under the age of 18, and 8.2% were 65 years of age or older. The gender makeup of the city was 51.2% male and 48.8% female.
Conclusion
Rolling Hills, California is a small, affluent city located in the South Bay region of Los Angeles County. It is bordered by the cities of Palos Verdes Estates to the north, Torrance to the east, and Rancho Palos Verdes to the south. Rolling Hills was founded in 1957, and was designed to be a rural, residential community. The city has a population of 1,872 as of the 2010 census, and has a median household income of $170,000. The city is home to many wealthy residents, and the economy is largely based on the service industry.
Common Questions
What is Per Capita Income in Rolling Hills?
Per Capita income in Rolling Hills is $58,290.
What is the Median Family Income in Rolling Hills?
Median Family Income in Rolling Hills is $137,778.
What is the Median Household income in Rolling Hills?
Median Household Income in Rolling Hills is $109,688.
What is Income or Wage Gap in Rolling Hills?
Income or Wage Gap in Rolling Hills is 32.6%.
Women in Rolling Hills earn 67.4 cents for every dollar earned by a man.
What is Inequality or Gini Index in Rolling Hills?
Inequality or Gini Index in Rolling Hills is 0.41.
What is the Total Population of Rolling Hills?
Total Population of Rolling Hills is 539.
What is the Total Male Population of Rolling Hills?
Total Male Population of Rolling Hills is 257.
What is the Total Female Population of Rolling Hills?
Total Female Population of Rolling Hills is 282.
What is the Ratio of Males per 100 Females in Rolling Hills?
There are 91.13 Males per 100 Females in Rolling Hills.
What is the Ratio of Females per 100 Males in Rolling Hills?
There are 109.73 Females per 100 Males in Rolling Hills.
What is the Median Population Age in Rolling Hills?
Median Population Age in Rolling Hills is 62.0 Years.
What is the Average Family Size in Rolling Hills
Average Family Size in Rolling Hills is 2.5 People.
What is the Average Household Size in Rolling Hills
Average Household Size in Rolling Hills is 2.2 People.
How Large is the Labor Force in Rolling Hills?
There are 284 People in the Labor Forcein in Rolling Hills.
What is the Percentage of People in the Labor Force in Rolling Hills?
56.0% of People are in the Labor Force in Rolling Hills.
What is the Unemployment Rate in Rolling Hills?
Unemployment Rate in Rolling Hills is 9.9%.