Cities with the Highest Percentage of Population Employed in Legal Services & Support in Utah
RELATED REPORTS & OPTIONS
Legal Services & Support
Utah
Compare Cities
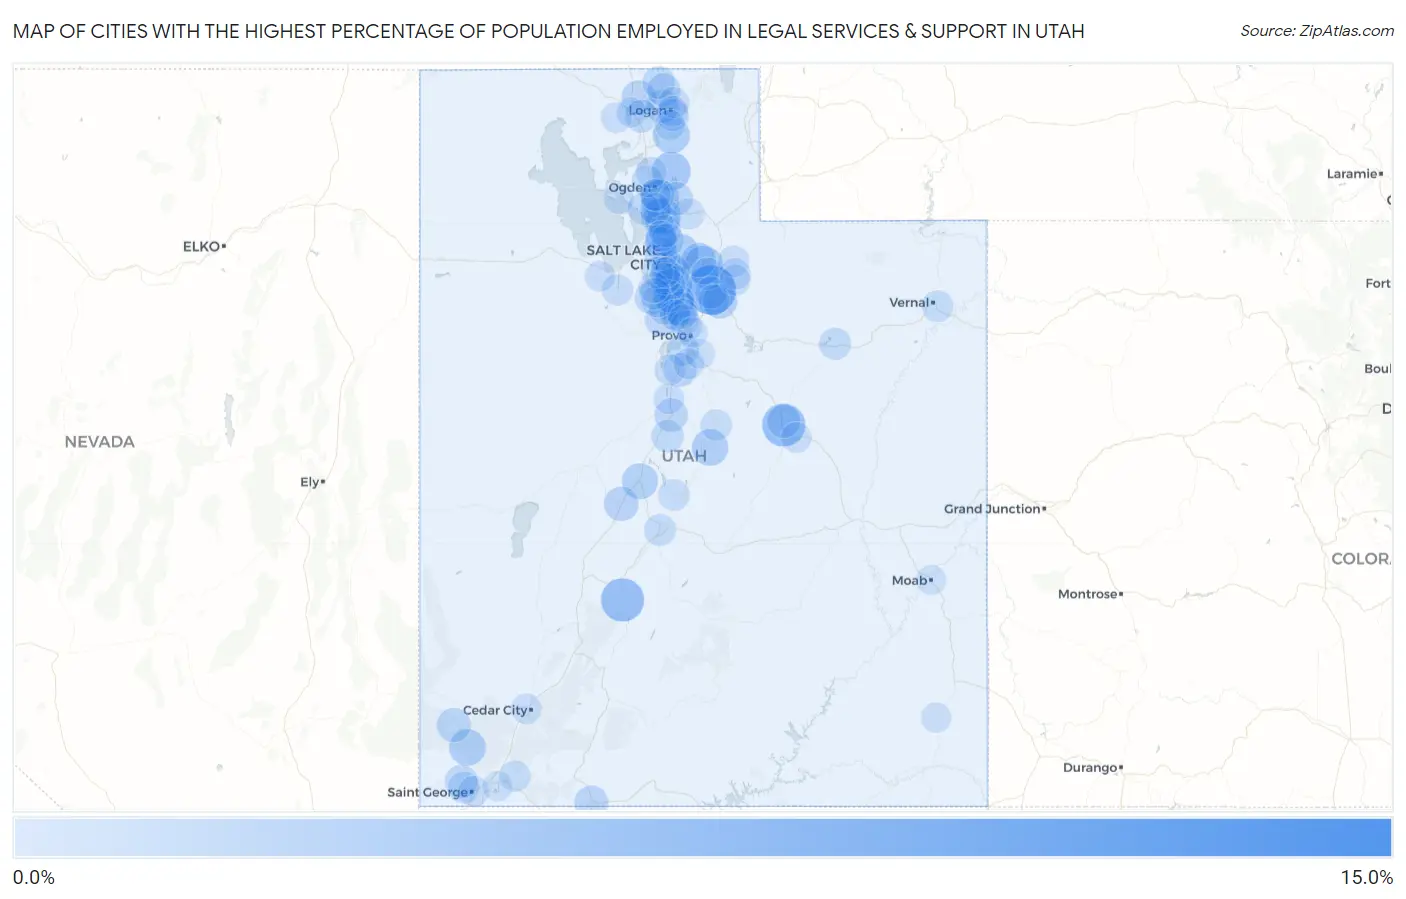
Map of Cities with the Highest Percentage of Population Employed in Legal Services & Support in Utah
0.0%
15.0%
Cities with the Highest Percentage of Population Employed in Legal Services & Support in Utah
| City | % Employed | vs State | vs National | |
| 1. | Hobble Creek | 11.8% | 0.86%(+10.9)#1 | 1.2%(+10.6)#163 |
| 2. | Interlaken | 7.3% | 0.86%(+6.42)#2 | 1.2%(+6.09)#408 |
| 3. | Carbonville | 5.0% | 0.86%(+4.10)#3 | 1.2%(+3.78)#853 |
| 4. | Marysvale | 5.0% | 0.86%(+4.09)#4 | 1.2%(+3.77)#855 |
| 5. | Wolf Creek | 3.5% | 0.86%(+2.60)#5 | 1.2%(+2.28)#1,567 |
| 6. | Snyderville | 3.4% | 0.86%(+2.50)#6 | 1.2%(+2.18)#1,637 |
| 7. | Uintah | 3.2% | 0.86%(+2.30)#7 | 1.2%(+1.98)#1,802 |
| 8. | Emigration Canyon | 3.1% | 0.86%(+2.24)#8 | 1.2%(+1.92)#1,837 |
| 9. | Paradise | 2.9% | 0.86%(+2.02)#9 | 1.2%(+1.70)#2,047 |
| 10. | Granite | 2.9% | 0.86%(+2.02)#10 | 1.2%(+1.69)#2,049 |
| 11. | Fruit Heights | 2.8% | 0.86%(+1.90)#11 | 1.2%(+1.57)#2,182 |
| 12. | Central | 2.7% | 0.86%(+1.83)#12 | 1.2%(+1.50)#2,252 |
| 13. | Spring City | 2.7% | 0.86%(+1.82)#13 | 1.2%(+1.49)#2,262 |
| 14. | Highland | 2.5% | 0.86%(+1.68)#14 | 1.2%(+1.35)#2,413 |
| 15. | Scipio | 2.5% | 0.86%(+1.63)#15 | 1.2%(+1.30)#2,457 |
| 16. | Daniel | 2.1% | 0.86%(+1.25)#16 | 1.2%(+0.919)#3,033 |
| 17. | Holladay | 2.1% | 0.86%(+1.22)#17 | 1.2%(+0.896)#3,076 |
| 18. | Holden | 2.0% | 0.86%(+1.13)#18 | 1.2%(+0.800)#3,246 |
| 19. | Millcreek | 2.0% | 0.86%(+1.11)#19 | 1.2%(+0.780)#3,279 |
| 20. | Fielding | 1.9% | 0.86%(+1.08)#20 | 1.2%(+0.754)#3,329 |
| 21. | Summit Park | 1.9% | 0.86%(+1.07)#21 | 1.2%(+0.738)#3,361 |
| 22. | Cedar Hills | 1.9% | 0.86%(+1.04)#22 | 1.2%(+0.710)#3,418 |
| 23. | Enterprise | 1.9% | 0.86%(+1.03)#23 | 1.2%(+0.703)#3,432 |
| 24. | Farmington | 1.9% | 0.86%(+1.02)#24 | 1.2%(+0.692)#3,465 |
| 25. | Kaysville | 1.9% | 0.86%(+1.00)#25 | 1.2%(+0.676)#3,496 |
| 26. | Kanab | 1.8% | 0.86%(+0.941)#26 | 1.2%(+0.613)#3,650 |
| 27. | Alpine | 1.8% | 0.86%(+0.916)#27 | 1.2%(+0.588)#3,709 |
| 28. | Benson | 1.7% | 0.86%(+0.809)#28 | 1.2%(+0.481)#3,973 |
| 29. | Nephi | 1.6% | 0.86%(+0.770)#29 | 1.2%(+0.442)#4,054 |
| 30. | Spring Glen | 1.6% | 0.86%(+0.764)#30 | 1.2%(+0.436)#4,065 |
| 31. | Spring Lake | 1.6% | 0.86%(+0.764)#31 | 1.2%(+0.436)#4,066 |
| 32. | Mountain Green | 1.6% | 0.86%(+0.750)#32 | 1.2%(+0.422)#4,109 |
| 33. | Amalga | 1.6% | 0.86%(+0.744)#33 | 1.2%(+0.416)#4,125 |
| 34. | Cottonwood Heights | 1.6% | 0.86%(+0.732)#34 | 1.2%(+0.403)#4,156 |
| 35. | South Ogden | 1.6% | 0.86%(+0.712)#35 | 1.2%(+0.384)#4,200 |
| 36. | Sandy | 1.5% | 0.86%(+0.683)#36 | 1.2%(+0.355)#4,286 |
| 37. | Herriman | 1.5% | 0.86%(+0.658)#37 | 1.2%(+0.330)#4,368 |
| 38. | Ivins | 1.5% | 0.86%(+0.632)#38 | 1.2%(+0.304)#4,448 |
| 39. | North Salt Lake | 1.5% | 0.86%(+0.621)#39 | 1.2%(+0.293)#4,499 |
| 40. | Salt Lake City | 1.4% | 0.86%(+0.589)#40 | 1.2%(+0.261)#4,589 |
| 41. | Saratoga Springs | 1.4% | 0.86%(+0.582)#41 | 1.2%(+0.254)#4,619 |
| 42. | Woods Cross | 1.4% | 0.86%(+0.580)#42 | 1.2%(+0.252)#4,623 |
| 43. | Bountiful | 1.4% | 0.86%(+0.538)#43 | 1.2%(+0.210)#4,763 |
| 44. | Deweyville | 1.4% | 0.86%(+0.524)#44 | 1.2%(+0.195)#4,811 |
| 45. | Trenton | 1.3% | 0.86%(+0.478)#45 | 1.2%(+0.150)#4,959 |
| 46. | Levan | 1.3% | 0.86%(+0.435)#46 | 1.2%(+0.107)#5,095 |
| 47. | Providence | 1.3% | 0.86%(+0.418)#47 | 1.2%(+0.089)#5,149 |
| 48. | Lake Shore | 1.2% | 0.86%(+0.384)#48 | 1.2%(+0.056)#5,288 |
| 49. | Park City | 1.2% | 0.86%(+0.379)#49 | 1.2%(+0.051)#5,310 |
| 50. | Lehi | 1.2% | 0.86%(+0.365)#50 | 1.2%(+0.037)#5,373 |
| 51. | Syracuse | 1.2% | 0.86%(+0.351)#51 | 1.2%(+0.023)#5,434 |
| 52. | Duchesne | 1.2% | 0.86%(+0.338)#52 | 1.2%(+0.010)#5,469 |
| 53. | Draper | 1.2% | 0.86%(+0.333)#53 | 1.2%(+0.004)#5,502 |
| 54. | Bluffdale | 1.2% | 0.86%(+0.330)#54 | 1.2%(+0.002)#5,511 |
| 55. | Midway | 1.2% | 0.86%(+0.325)#55 | 1.2%(-0.003)#5,528 |
| 56. | Centerville | 1.2% | 0.86%(+0.313)#56 | 1.2%(-0.015)#5,576 |
| 57. | Santa Clara | 1.1% | 0.86%(+0.219)#57 | 1.2%(-0.109)#5,986 |
| 58. | Midvale | 1.0% | 0.86%(+0.193)#58 | 1.2%(-0.135)#6,122 |
| 59. | Marriott Slaterville | 1.0% | 0.86%(+0.191)#59 | 1.2%(-0.137)#6,134 |
| 60. | Naples | 1.0% | 0.86%(+0.185)#60 | 1.2%(-0.143)#6,162 |
| 61. | Aurora | 1.0% | 0.86%(+0.173)#61 | 1.2%(-0.155)#6,219 |
| 62. | Orem | 0.99% | 0.86%(+0.134)#62 | 1.2%(-0.195)#6,426 |
| 63. | Layton | 0.97% | 0.86%(+0.111)#63 | 1.2%(-0.217)#6,525 |
| 64. | Taylorsville | 0.95% | 0.86%(+0.097)#64 | 1.2%(-0.231)#6,608 |
| 65. | Riverton | 0.95% | 0.86%(+0.096)#65 | 1.2%(-0.232)#6,617 |
| 66. | Fairview | 0.94% | 0.86%(+0.085)#66 | 1.2%(-0.243)#6,667 |
| 67. | Gunnison | 0.94% | 0.86%(+0.082)#67 | 1.2%(-0.246)#6,688 |
| 68. | Washington Terrace | 0.94% | 0.86%(+0.081)#68 | 1.2%(-0.247)#6,692 |
| 69. | Oakley | 0.92% | 0.86%(+0.066)#69 | 1.2%(-0.262)#6,770 |
| 70. | Morgan | 0.91% | 0.86%(+0.057)#70 | 1.2%(-0.271)#6,821 |
| 71. | Kamas | 0.90% | 0.86%(+0.043)#71 | 1.2%(-0.286)#6,888 |
| 72. | Virgin | 0.88% | 0.86%(+0.022)#72 | 1.2%(-0.307)#6,999 |
| 73. | Tooele | 0.87% | 0.86%(+0.013)#73 | 1.2%(-0.315)#7,050 |
| 74. | Genola | 0.81% | 0.86%(-0.048)#74 | 1.2%(-0.376)#7,379 |
| 75. | Charleston | 0.81% | 0.86%(-0.049)#75 | 1.2%(-0.377)#7,383 |
| 76. | Francis | 0.80% | 0.86%(-0.051)#76 | 1.2%(-0.379)#7,393 |
| 77. | North Logan | 0.80% | 0.86%(-0.056)#77 | 1.2%(-0.384)#7,419 |
| 78. | Pleasant View | 0.79% | 0.86%(-0.070)#78 | 1.2%(-0.398)#7,505 |
| 79. | Salem | 0.78% | 0.86%(-0.071)#79 | 1.2%(-0.399)#7,515 |
| 80. | South Jordan | 0.75% | 0.86%(-0.105)#80 | 1.2%(-0.433)#7,737 |
| 81. | Lindon | 0.74% | 0.86%(-0.117)#81 | 1.2%(-0.445)#7,810 |
| 82. | American Fork | 0.74% | 0.86%(-0.118)#82 | 1.2%(-0.446)#7,819 |
| 83. | West Bountiful | 0.72% | 0.86%(-0.133)#83 | 1.2%(-0.461)#7,906 |
| 84. | Wellington | 0.71% | 0.86%(-0.145)#84 | 1.2%(-0.473)#8,003 |
| 85. | Thatcher | 0.71% | 0.86%(-0.150)#85 | 1.2%(-0.478)#8,032 |
| 86. | St George | 0.70% | 0.86%(-0.158)#86 | 1.2%(-0.486)#8,092 |
| 87. | River Heights | 0.69% | 0.86%(-0.166)#87 | 1.2%(-0.494)#8,146 |
| 88. | Grantsville | 0.67% | 0.86%(-0.189)#88 | 1.2%(-0.517)#8,315 |
| 89. | Pleasant Grove | 0.67% | 0.86%(-0.190)#89 | 1.2%(-0.518)#8,321 |
| 90. | Cedar City | 0.65% | 0.86%(-0.209)#90 | 1.2%(-0.537)#8,437 |
| 91. | Mona | 0.62% | 0.86%(-0.238)#91 | 1.2%(-0.566)#8,661 |
| 92. | Hooper | 0.61% | 0.86%(-0.250)#92 | 1.2%(-0.579)#8,738 |
| 93. | Murray | 0.59% | 0.86%(-0.267)#93 | 1.2%(-0.595)#8,874 |
| 94. | Hurricane | 0.58% | 0.86%(-0.272)#94 | 1.2%(-0.600)#8,909 |
| 95. | Provo | 0.58% | 0.86%(-0.277)#95 | 1.2%(-0.605)#8,952 |
| 96. | Hyrum | 0.56% | 0.86%(-0.297)#96 | 1.2%(-0.625)#9,086 |
| 97. | Blanding | 0.54% | 0.86%(-0.316)#97 | 1.2%(-0.644)#9,214 |
| 98. | Tremonton | 0.51% | 0.86%(-0.350)#98 | 1.2%(-0.678)#9,462 |
| 99. | Mapleton | 0.50% | 0.86%(-0.354)#99 | 1.2%(-0.682)#9,491 |
| 100. | Moab | 0.50% | 0.86%(-0.356)#100 | 1.2%(-0.685)#9,510 |
Common Questions
What are the Top 10 Cities with the Highest Percentage of Population Employed in Legal Services & Support in Utah?
Top 10 Cities with the Highest Percentage of Population Employed in Legal Services & Support in Utah are:
#1
7.3%
#2
5.0%
#3
5.0%
#4
3.5%
#5
3.4%
#6
3.2%
#7
3.1%
#8
2.9%
#9
2.9%
#10
2.8%
What city has the Highest Percentage of Population Employed in Legal Services & Support in Utah?
Interlaken has the Highest Percentage of Population Employed in Legal Services & Support in Utah with 7.3%.
What is the Percentage of Population Employed in Legal Services & Support in the State of Utah?
Percentage of Population Employed in Legal Services & Support in Utah is 0.86%.
What is the Percentage of Population Employed in Legal Services & Support in the United States?
Percentage of Population Employed in Legal Services & Support in the United States is 1.2%.