Sea Ranch, CA Map & Demographics
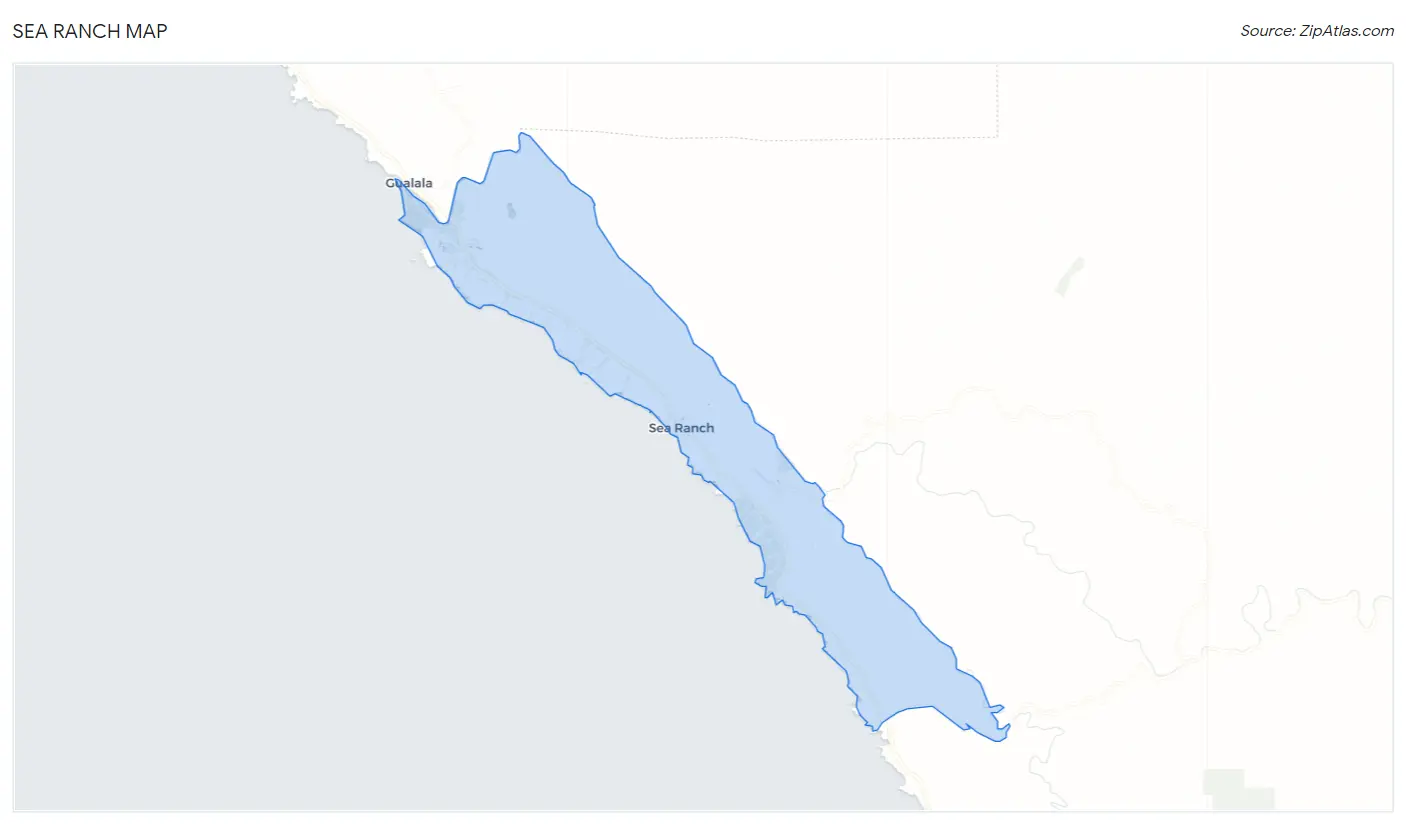
Sea Ranch Map
Sea Ranch Overview
$70,214
PER CAPITA INCOME
$120,000
AVG FAMILY INCOME
$92,260
AVG HOUSEHOLD INCOME
50.5%
WAGE / INCOME GAP [ % ]
49.5¢/ $1
WAGE / INCOME GAP [ $ ]
0.42
INEQUALITY / GINI INDEX
1,224
TOTAL POPULATION
629
MALE POPULATION
595
FEMALE POPULATION
105.71
MALES / 100 FEMALES
94.59
FEMALES / 100 MALES
67.9
MEDIAN AGE
2.2
AVG FAMILY SIZE
1.9
AVG HOUSEHOLD SIZE
380
LABOR FORCE [ PEOPLE ]
33.0%
PERCENT IN LABOR FORCE
3.7%
UNEMPLOYMENT RATE
Income in Sea Ranch
Income Overview in Sea Ranch
Per Capita Income in Sea Ranch is $70,214, while median incomes of families and households are $120,000 and $92,260 respectively.
| Characteristic | Number | Measure |
| Per Capita Income | 1,224 | $70,214 |
| Median Family Income | 406 | $120,000 |
| Mean Family Income | 406 | $152,878 |
| Median Household Income | 643 | $92,260 |
| Mean Household Income | 643 | $133,896 |
| Income Deficit | 406 | $0 |
| Wage / Income Gap (%) | 1,224 | 50.53% |
| Wage / Income Gap ($) | 1,224 | 49.47¢ per $1 |
| Gini / Inequality Index | 1,224 | 0.42 |
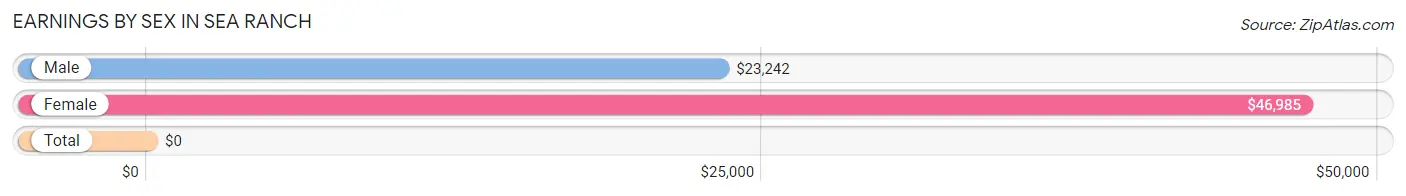
Earnings by Sex in Sea Ranch
| Sex | Number | Average Earnings |
| Male | 279 (60.7%) | $23,242 |
| Female | 181 (39.4%) | $46,985 |
| Total | 460 (100.0%) | $0 |
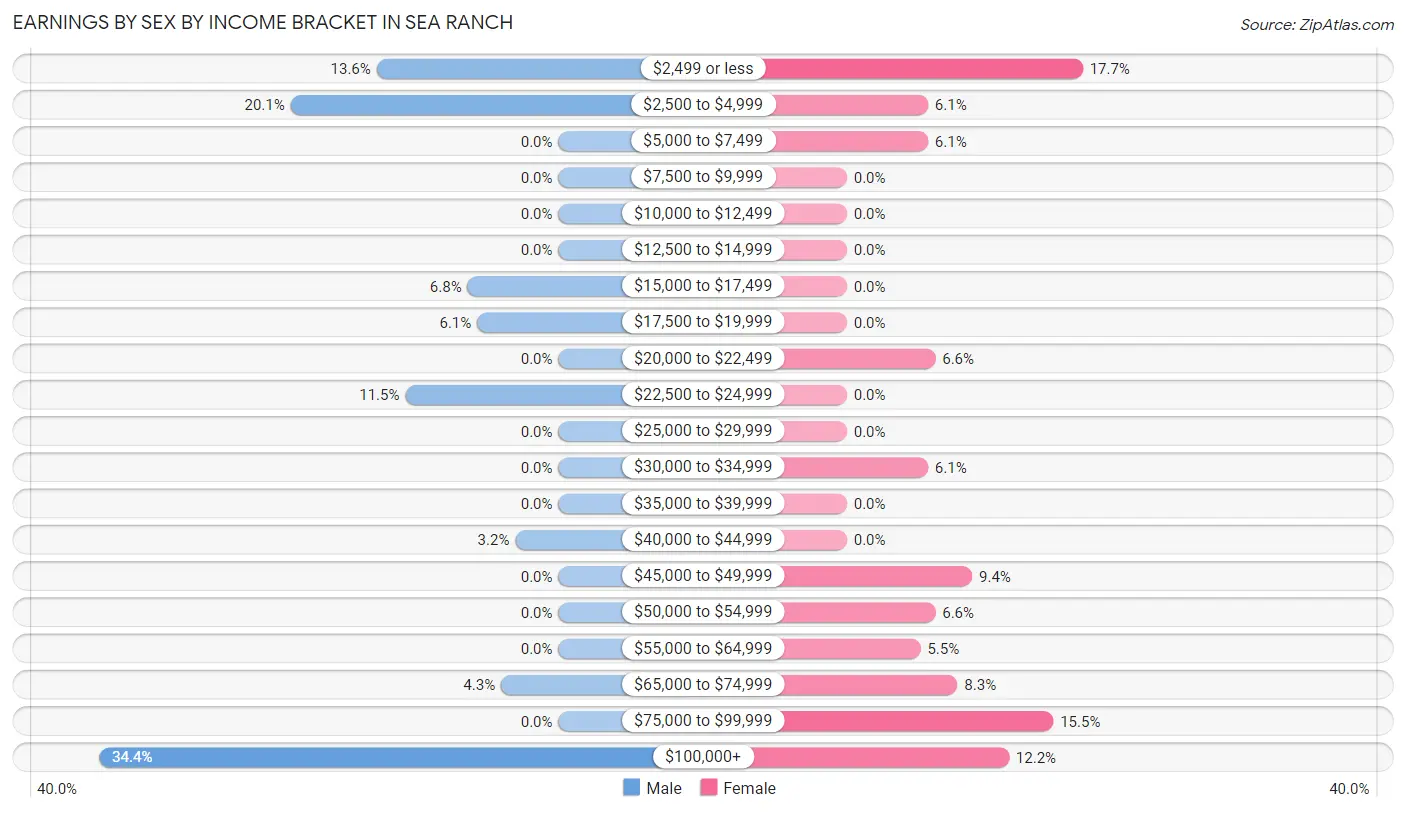
Earnings by Sex by Income Bracket in Sea Ranch
The most common earnings brackets in Sea Ranch are $100,000+ for men (96 | 34.4%) and $2,499 or less for women (32 | 17.7%).
| Income | Male | Female |
| $2,499 or less | 38 (13.6%) | 32 (17.7%) |
| $2,500 to $4,999 | 56 (20.1%) | 11 (6.1%) |
| $5,000 to $7,499 | 0 (0.0%) | 11 (6.1%) |
| $7,500 to $9,999 | 0 (0.0%) | 0 (0.0%) |
| $10,000 to $12,499 | 0 (0.0%) | 0 (0.0%) |
| $12,500 to $14,999 | 0 (0.0%) | 0 (0.0%) |
| $15,000 to $17,499 | 19 (6.8%) | 0 (0.0%) |
| $17,500 to $19,999 | 17 (6.1%) | 0 (0.0%) |
| $20,000 to $22,499 | 0 (0.0%) | 12 (6.6%) |
| $22,500 to $24,999 | 32 (11.5%) | 0 (0.0%) |
| $25,000 to $29,999 | 0 (0.0%) | 0 (0.0%) |
| $30,000 to $34,999 | 0 (0.0%) | 11 (6.1%) |
| $35,000 to $39,999 | 0 (0.0%) | 0 (0.0%) |
| $40,000 to $44,999 | 9 (3.2%) | 0 (0.0%) |
| $45,000 to $49,999 | 0 (0.0%) | 17 (9.4%) |
| $50,000 to $54,999 | 0 (0.0%) | 12 (6.6%) |
| $55,000 to $64,999 | 0 (0.0%) | 10 (5.5%) |
| $65,000 to $74,999 | 12 (4.3%) | 15 (8.3%) |
| $75,000 to $99,999 | 0 (0.0%) | 28 (15.5%) |
| $100,000+ | 96 (34.4%) | 22 (12.1%) |
| Total | 279 (100.0%) | 181 (100.0%) |
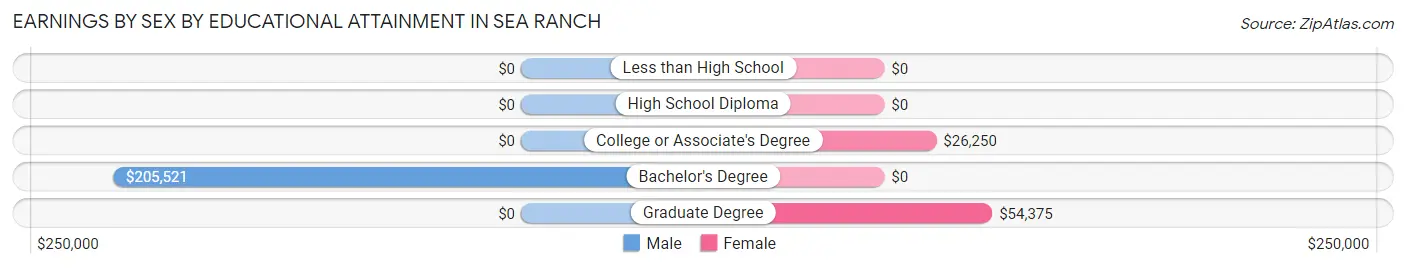
Earnings by Sex by Educational Attainment in Sea Ranch
Average earnings in Sea Ranch are $23,242 for men and $46,985 for women, a difference of 50.5%. Men with an educational attainment of bachelor's degree enjoy the highest average annual earnings of $205,521, while those with bachelor's degree education earn the least with $205,521. Women with an educational attainment of graduate degree earn the most with the average annual earnings of $54,375, while those with college or associate's degree education have the smallest earnings of $26,250.
| Educational Attainment | Male Income | Female Income |
| Less than High School | - | - |
| High School Diploma | - | - |
| College or Associate's Degree | - | - |
| Bachelor's Degree | $205,521 | $0 |
| Graduate Degree | - | - |
| Total | $23,242 | $46,985 |
Family Income in Sea Ranch
Family Income Brackets in Sea Ranch
According to the Sea Ranch family income data, there are 95 families falling into the $200,000+ income range, which is the most common income bracket and makes up 23.4% of all families.
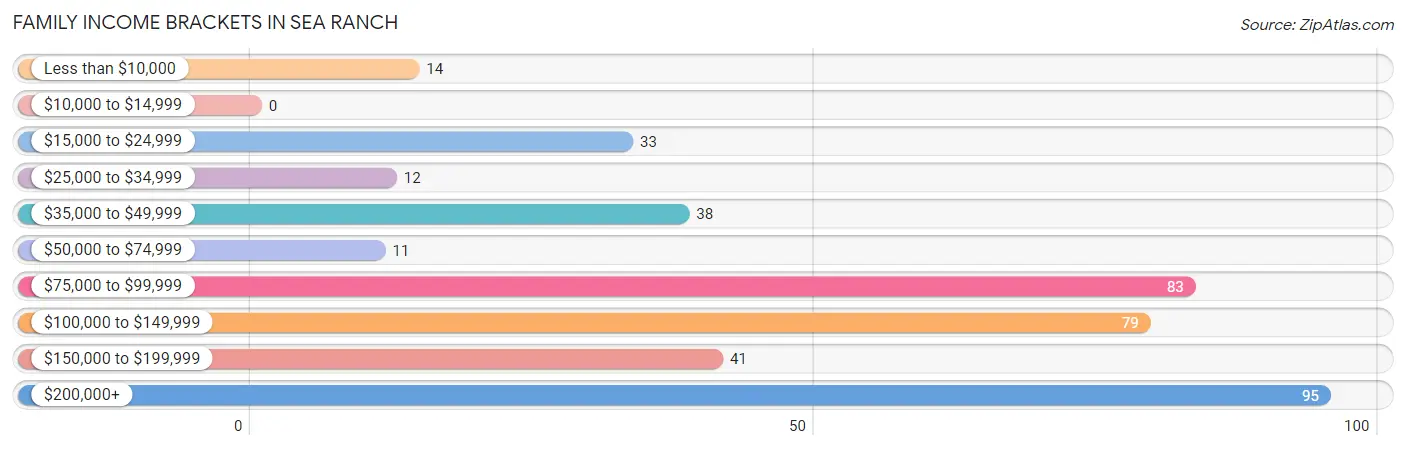
| Income Bracket | # Families | % Families |
| Less than $10,000 | 14 | 3.4% |
| $10,000 to $14,999 | 0 | 0.0% |
| $15,000 to $24,999 | 33 | 8.1% |
| $25,000 to $34,999 | 12 | 3.0% |
| $35,000 to $49,999 | 38 | 9.4% |
| $50,000 to $74,999 | 11 | 2.7% |
| $75,000 to $99,999 | 83 | 20.4% |
| $100,000 to $149,999 | 79 | 19.5% |
| $150,000 to $199,999 | 41 | 10.1% |
| $200,000+ | 95 | 23.4% |
Family Income by Famaliy Size in Sea Ranch
2-person families (349 | 86.0%) account for the highest median family income in Sea Ranch with $135,446 per family, while 2-person families (349 | 86.0%) have the highest median income of $67,723 per family member.
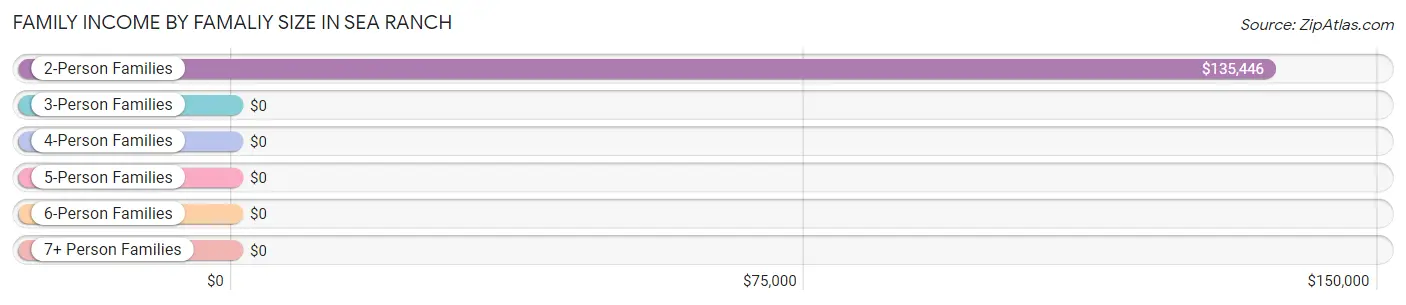
| Income Bracket | # Families | Median Income |
| 2-Person Families | 349 (86.0%) | $135,446 |
| 3-Person Families | 43 (10.6%) | $0 |
| 4-Person Families | 0 (0.0%) | $0 |
| 5-Person Families | 14 (3.5%) | $0 |
| 6-Person Families | 0 (0.0%) | $0 |
| 7+ Person Families | 0 (0.0%) | $0 |
| Total | 406 (100.0%) | $120,000 |
Family Income by Number of Earners in Sea Ranch
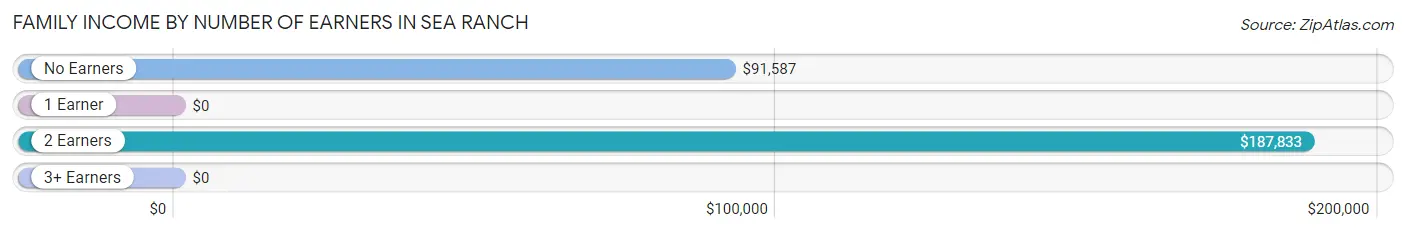
| Number of Earners | # Families | Median Income |
| No Earners | 141 (34.7%) | $91,587 |
| 1 Earner | 167 (41.1%) | $0 |
| 2 Earners | 98 (24.1%) | $187,833 |
| 3+ Earners | 0 (0.0%) | $0 |
| Total | 406 (100.0%) | $120,000 |
Household Income in Sea Ranch
Household Income Brackets in Sea Ranch
With 159 households falling in the category, the $100,000 to $149,999 income range is the most frequent in Sea Ranch, accounting for 24.7% of all households.
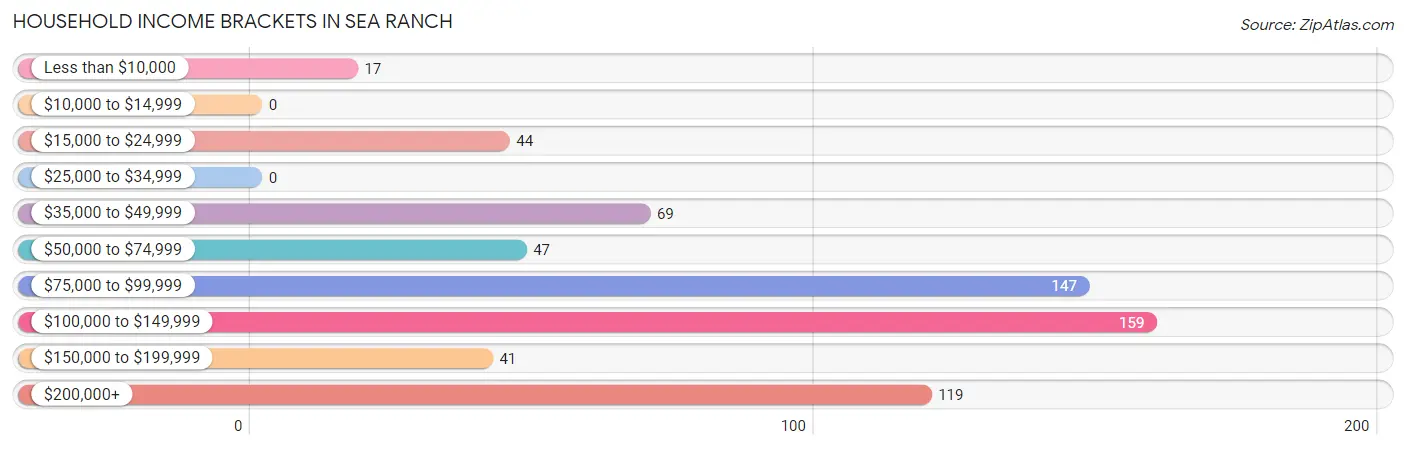
| Income Bracket | # Households | % Households |
| Less than $10,000 | 17 | 2.6% |
| $10,000 to $14,999 | 0 | 0.0% |
| $15,000 to $24,999 | 44 | 6.8% |
| $25,000 to $34,999 | 0 | 0.0% |
| $35,000 to $49,999 | 69 | 10.7% |
| $50,000 to $74,999 | 47 | 7.3% |
| $75,000 to $99,999 | 147 | 22.9% |
| $100,000 to $149,999 | 159 | 24.7% |
| $150,000 to $199,999 | 41 | 6.4% |
| $200,000+ | 119 | 18.5% |
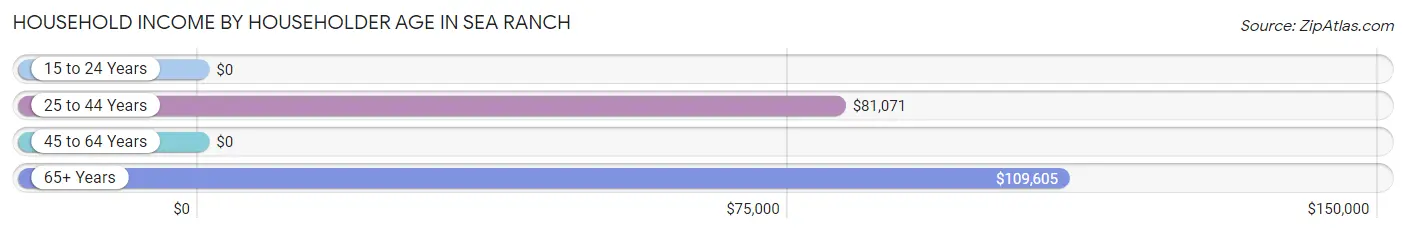
Household Income by Householder Age in Sea Ranch
The median household income in Sea Ranch is $92,260, with the highest median household income of $109,605 found in the 65+ years age bracket for the primary householder. A total of 476 households (74.0%) fall into this category.
| Income Bracket | # Households | Median Income |
| 15 to 24 Years | 0 (0.0%) | $0 |
| 25 to 44 Years | 40 (6.2%) | $81,071 |
| 45 to 64 Years | 127 (19.8%) | $0 |
| 65+ Years | 476 (74.0%) | $109,605 |
| Total | 643 (100.0%) | $92,260 |
Poverty in Sea Ranch
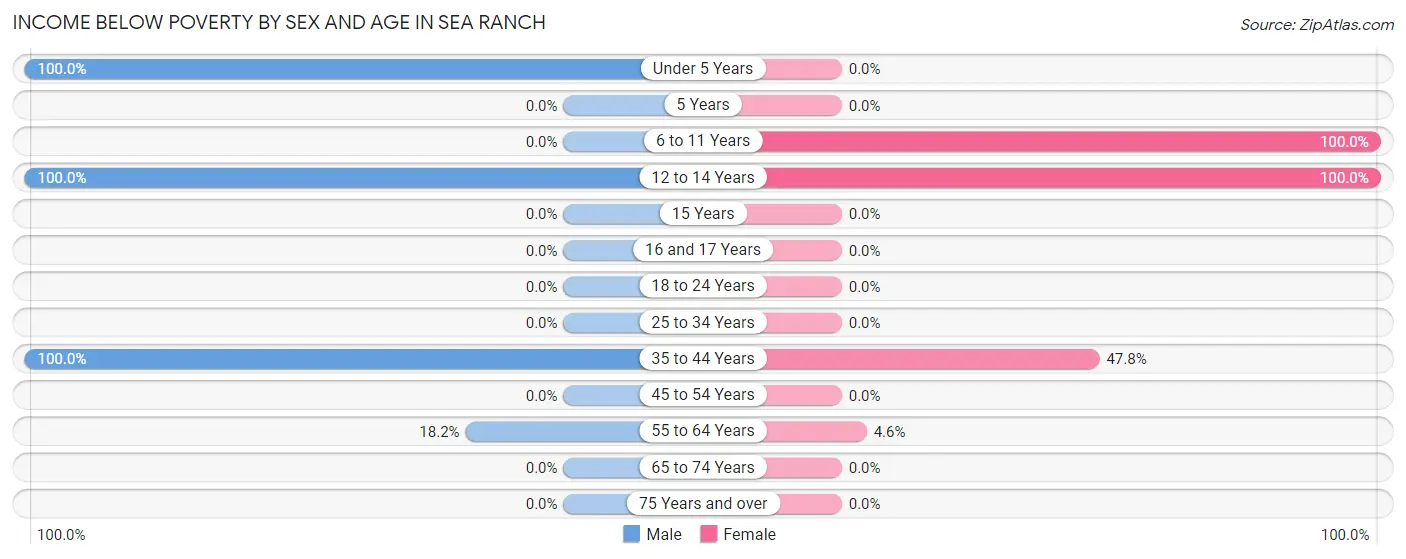
Income Below Poverty by Sex and Age in Sea Ranch
With 13.2% poverty level for males and 9.9% for females among the residents of Sea Ranch, under 5 year old males and 6 to 11 year old females are the most vulnerable to poverty, with 16 males (100.0%) and 14 females (100.0%) in their respective age groups living below the poverty level.
| Age Bracket | Male | Female |
| Under 5 Years | 16 (100.0%) | 0 (0.0%) |
| 5 Years | 0 (0.0%) | 0 (0.0%) |
| 6 to 11 Years | 0 (0.0%) | 14 (100.0%) |
| 12 to 14 Years | 13 (100.0%) | 29 (100.0%) |
| 15 Years | 0 (0.0%) | 0 (0.0%) |
| 16 and 17 Years | 0 (0.0%) | 0 (0.0%) |
| 18 to 24 Years | 0 (0.0%) | 0 (0.0%) |
| 25 to 34 Years | 0 (0.0%) | 0 (0.0%) |
| 35 to 44 Years | 28 (100.0%) | 11 (47.8%) |
| 45 to 54 Years | 0 (0.0%) | 0 (0.0%) |
| 55 to 64 Years | 26 (18.2%) | 5 (4.6%) |
| 65 to 74 Years | 0 (0.0%) | 0 (0.0%) |
| 75 Years and over | 0 (0.0%) | 0 (0.0%) |
| Total | 83 (13.2%) | 59 (9.9%) |
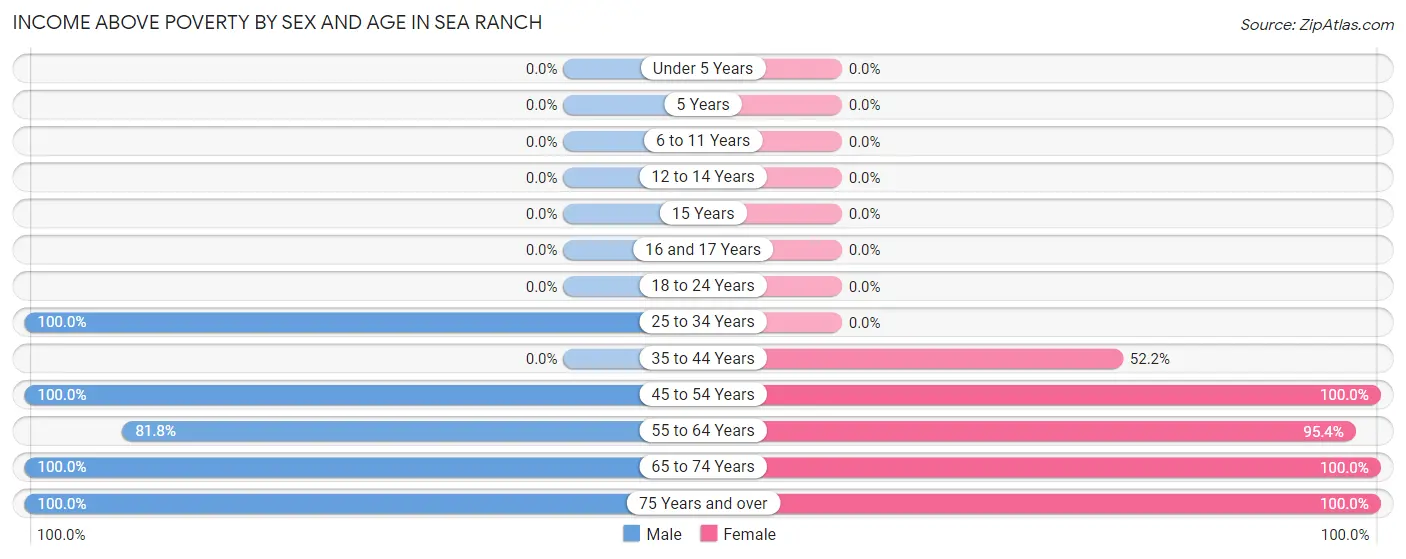
Income Above Poverty by Sex and Age in Sea Ranch
According to the poverty statistics in Sea Ranch, males aged 25 to 34 years and females aged 45 to 54 years are the age groups that are most secure financially, with 100.0% of males and 100.0% of females in these age groups living above the poverty line.
| Age Bracket | Male | Female |
| Under 5 Years | 0 (0.0%) | 0 (0.0%) |
| 5 Years | 0 (0.0%) | 0 (0.0%) |
| 6 to 11 Years | 0 (0.0%) | 0 (0.0%) |
| 12 to 14 Years | 0 (0.0%) | 0 (0.0%) |
| 15 Years | 0 (0.0%) | 0 (0.0%) |
| 16 and 17 Years | 0 (0.0%) | 0 (0.0%) |
| 18 to 24 Years | 0 (0.0%) | 0 (0.0%) |
| 25 to 34 Years | 38 (100.0%) | 0 (0.0%) |
| 35 to 44 Years | 0 (0.0%) | 12 (52.2%) |
| 45 to 54 Years | 12 (100.0%) | 26 (100.0%) |
| 55 to 64 Years | 117 (81.8%) | 103 (95.4%) |
| 65 to 74 Years | 218 (100.0%) | 248 (100.0%) |
| 75 Years and over | 161 (100.0%) | 147 (100.0%) |
| Total | 546 (86.8%) | 536 (90.1%) |
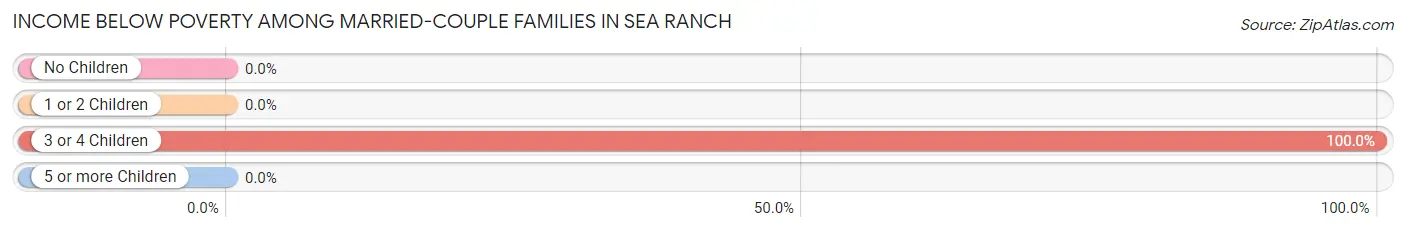
Income Below Poverty Among Married-Couple Families in Sea Ranch
The poverty statistics for married-couple families in Sea Ranch show that 3.8% or 14 of the total 365 families live below the poverty line. Families with 3 or 4 children have the highest poverty rate of 100.0%, comprising of 14 families. On the other hand, families with no children have the lowest poverty rate of 0.0%, which includes 0 families.
| Children | Above Poverty | Below Poverty |
| No Children | 351 (100.0%) | 0 (0.0%) |
| 1 or 2 Children | 0 (0.0%) | 0 (0.0%) |
| 3 or 4 Children | 0 (0.0%) | 14 (100.0%) |
| 5 or more Children | 0 (0.0%) | 0 (0.0%) |
| Total | 351 (96.2%) | 14 (3.8%) |
Income Below Poverty Among Single-Parent Households in Sea Ranch
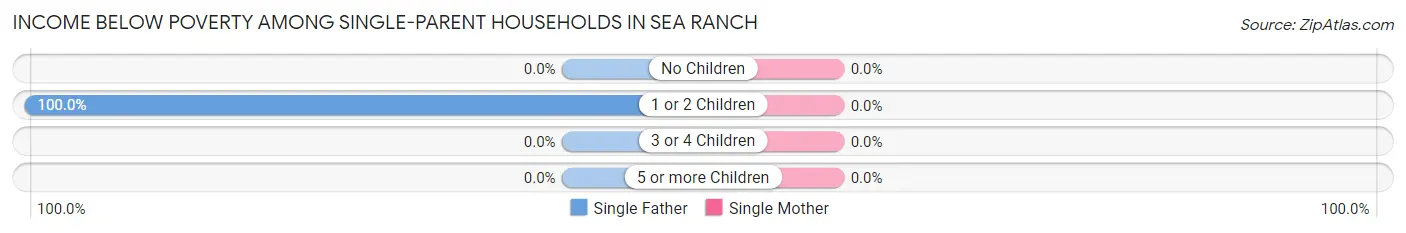
| Children | Single Father | Single Mother |
| No Children | 0 (0.0%) | 0 (0.0%) |
| 1 or 2 Children | 14 (100.0%) | 0 (0.0%) |
| 3 or 4 Children | 0 (0.0%) | 0 (0.0%) |
| 5 or more Children | 0 (0.0%) | 0 (0.0%) |
| Total | 14 (100.0%) | 0 (0.0%) |
Income Below Poverty Among Married-Couple vs Single-Parent Households in Sea Ranch
The poverty data for Sea Ranch shows that 14 of the married-couple family households (3.8%) and 14 of the single-parent households (34.2%) are living below the poverty level. Within the married-couple family households, those with 3 or 4 children have the highest poverty rate, with 14 households (100.0%) falling below the poverty line. Among the single-parent households, those with 1 or 2 children have the highest poverty rate, with 14 household (100.0%) living below poverty.
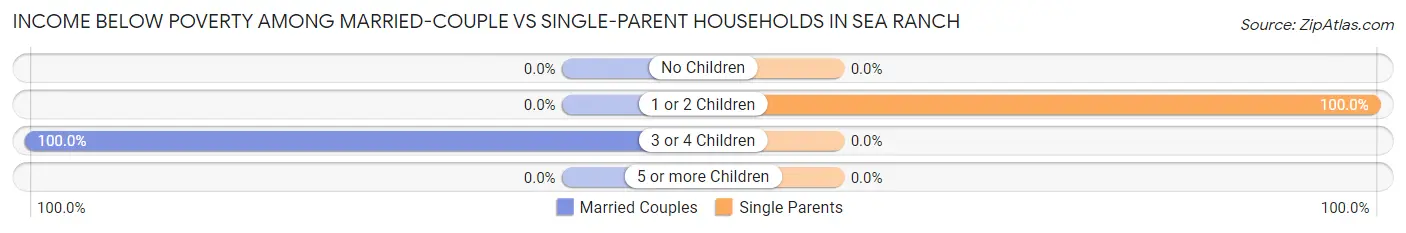
| Children | Married-Couple Families | Single-Parent Households |
| No Children | 0 (0.0%) | 0 (0.0%) |
| 1 or 2 Children | 0 (0.0%) | 14 (100.0%) |
| 3 or 4 Children | 14 (100.0%) | 0 (0.0%) |
| 5 or more Children | 0 (0.0%) | 0 (0.0%) |
| Total | 14 (3.8%) | 14 (34.2%) |
Race in Sea Ranch
The most populous races in Sea Ranch are White / Caucasian (1,108 | 90.5%), Hispanic or Latino (144 | 11.8%), and Two or more Races (67 | 5.5%).
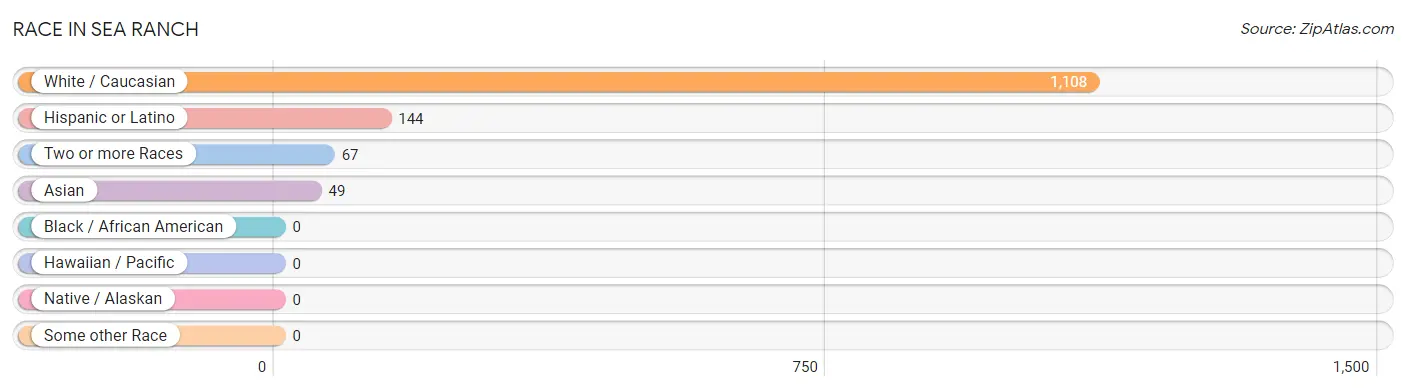
| Race | # Population | % Population |
| Asian | 49 | 4.0% |
| Black / African American | 0 | 0.0% |
| Hawaiian / Pacific | 0 | 0.0% |
| Hispanic or Latino | 144 | 11.8% |
| Native / Alaskan | 0 | 0.0% |
| White / Caucasian | 1,108 | 90.5% |
| Two or more Races | 67 | 5.5% |
| Some other Race | 0 | 0.0% |
| Total | 1,224 | 100.0% |
Ancestry in Sea Ranch
The most populous ancestries reported in Sea Ranch are English (246 | 20.1%), German (189 | 15.4%), Irish (148 | 12.1%), Mexican (132 | 10.8%), and Italian (104 | 8.5%), together accounting for 66.9% of all Sea Ranch residents.
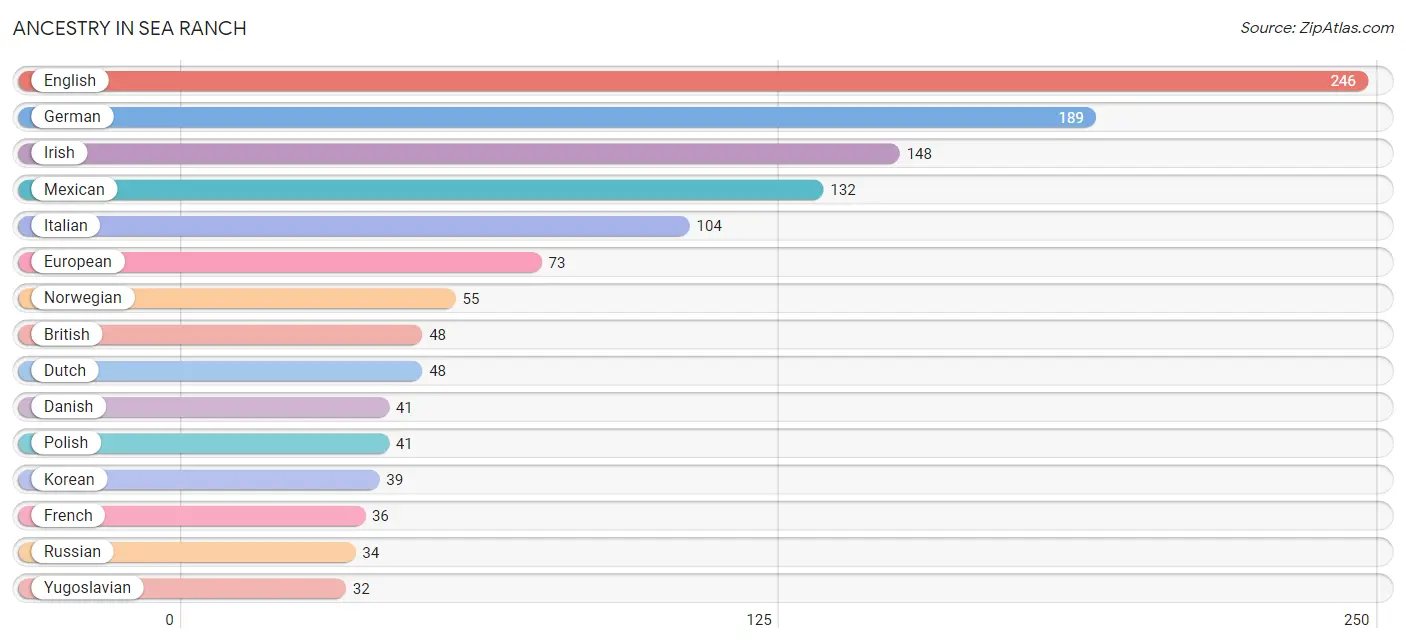
| Ancestry | # Population | % Population |
| Aleut | 10 | 0.8% |
| Argentinean | 12 | 1.0% |
| Austrian | 10 | 0.8% |
| Belgian | 12 | 1.0% |
| Bhutanese | 20 | 1.6% |
| British | 48 | 3.9% |
| Canadian | 25 | 2.0% |
| Czech | 15 | 1.2% |
| Danish | 41 | 3.4% |
| Dutch | 48 | 3.9% |
| English | 246 | 20.1% |
| European | 73 | 6.0% |
| French | 36 | 2.9% |
| German | 189 | 15.4% |
| Indian (Asian) | 10 | 0.8% |
| Irish | 148 | 12.1% |
| Italian | 104 | 8.5% |
| Korean | 39 | 3.2% |
| Lithuanian | 17 | 1.4% |
| Mexican | 132 | 10.8% |
| Native Hawaiian | 10 | 0.8% |
| Northern European | 13 | 1.1% |
| Norwegian | 55 | 4.5% |
| Polish | 41 | 3.4% |
| Russian | 34 | 2.8% |
| Scottish | 20 | 1.6% |
| Slovak | 24 | 2.0% |
| South American | 12 | 1.0% |
| Swedish | 12 | 1.0% |
| Swiss | 13 | 1.1% |
| Turkish | 11 | 0.9% |
| Welsh | 14 | 1.1% |
| Yugoslavian | 32 | 2.6% | View All 33 Rows |
Immigrants in Sea Ranch
The most numerous immigrant groups reported in Sea Ranch came from Latin America (80 | 6.5%), Central America (68 | 5.6%), Mexico (68 | 5.6%), Asia (49 | 4.0%), and Philippines (39 | 3.2%), together accounting for 24.8% of all Sea Ranch residents.
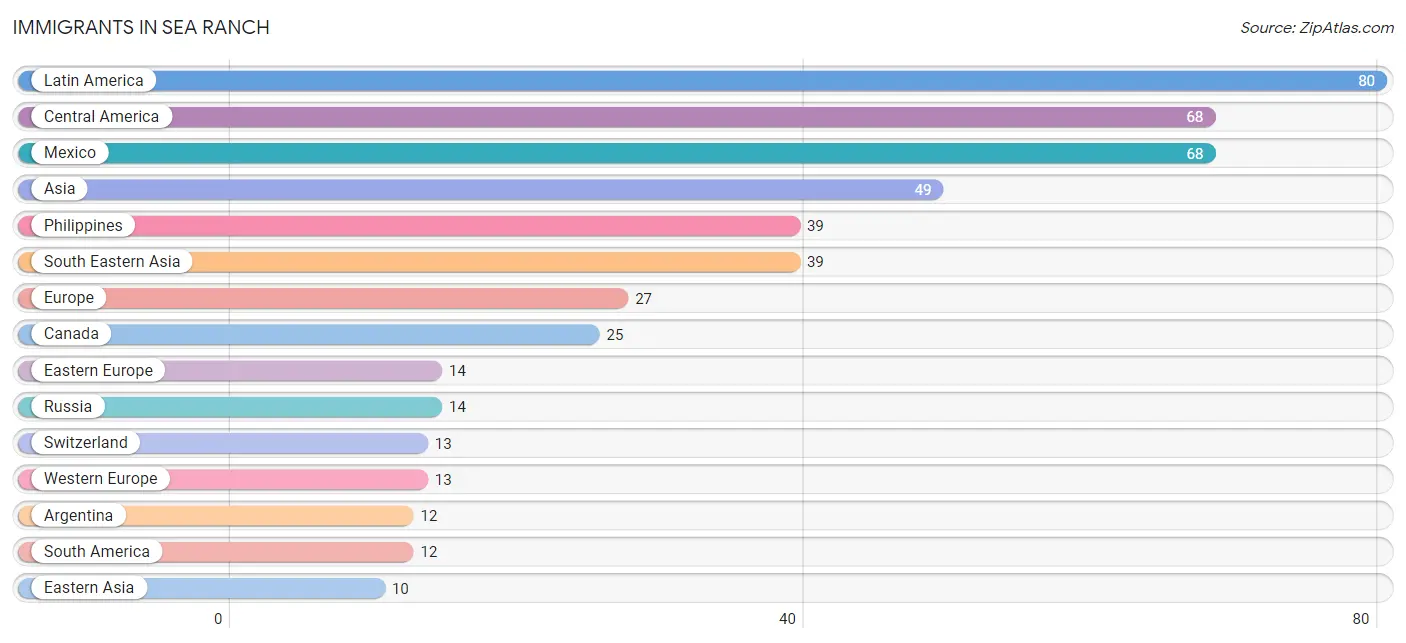
| Immigration Origin | # Population | % Population |
| Argentina | 12 | 1.0% |
| Asia | 49 | 4.0% |
| Canada | 25 | 2.0% |
| Central America | 68 | 5.6% |
| Eastern Asia | 10 | 0.8% |
| Eastern Europe | 14 | 1.1% |
| Europe | 27 | 2.2% |
| Japan | 10 | 0.8% |
| Latin America | 80 | 6.5% |
| Mexico | 68 | 5.6% |
| Philippines | 39 | 3.2% |
| Russia | 14 | 1.1% |
| South America | 12 | 1.0% |
| South Eastern Asia | 39 | 3.2% |
| Switzerland | 13 | 1.1% |
| Western Europe | 13 | 1.1% | View All 16 Rows |
Sex and Age in Sea Ranch
Sex and Age in Sea Ranch
The most populous age groups in Sea Ranch are 70 to 74 Years (135 | 21.5%) for men and 65 to 69 Years (160 | 26.9%) for women.
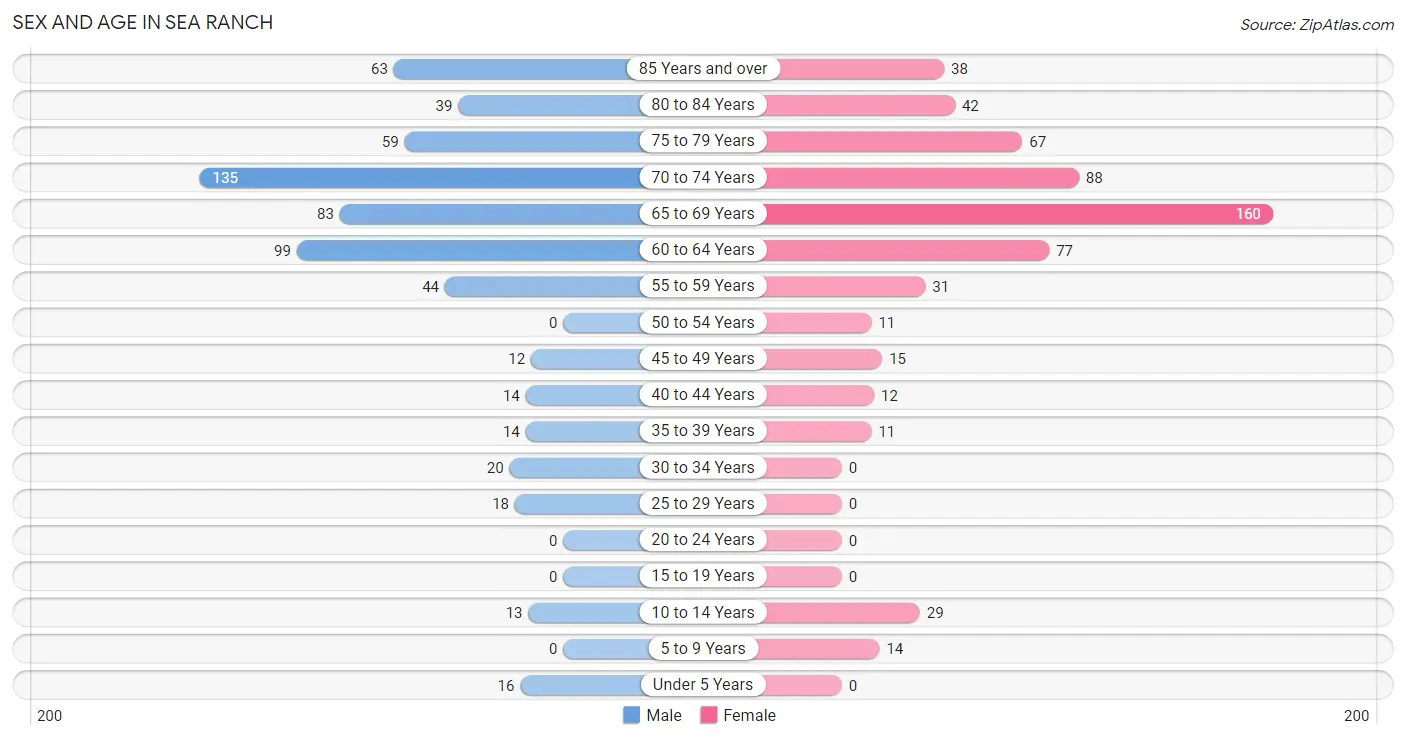
| Age Bracket | Male | Female |
| Under 5 Years | 16 (2.5%) | 0 (0.0%) |
| 5 to 9 Years | 0 (0.0%) | 14 (2.4%) |
| 10 to 14 Years | 13 (2.1%) | 29 (4.9%) |
| 15 to 19 Years | 0 (0.0%) | 0 (0.0%) |
| 20 to 24 Years | 0 (0.0%) | 0 (0.0%) |
| 25 to 29 Years | 18 (2.9%) | 0 (0.0%) |
| 30 to 34 Years | 20 (3.2%) | 0 (0.0%) |
| 35 to 39 Years | 14 (2.2%) | 11 (1.8%) |
| 40 to 44 Years | 14 (2.2%) | 12 (2.0%) |
| 45 to 49 Years | 12 (1.9%) | 15 (2.5%) |
| 50 to 54 Years | 0 (0.0%) | 11 (1.8%) |
| 55 to 59 Years | 44 (7.0%) | 31 (5.2%) |
| 60 to 64 Years | 99 (15.7%) | 77 (12.9%) |
| 65 to 69 Years | 83 (13.2%) | 160 (26.9%) |
| 70 to 74 Years | 135 (21.5%) | 88 (14.8%) |
| 75 to 79 Years | 59 (9.4%) | 67 (11.3%) |
| 80 to 84 Years | 39 (6.2%) | 42 (7.1%) |
| 85 Years and over | 63 (10.0%) | 38 (6.4%) |
| Total | 629 (100.0%) | 595 (100.0%) |
Families and Households in Sea Ranch
Median Family Size in Sea Ranch
The median family size in Sea Ranch is 2.25 persons per family, with single male/father families (14 | 3.5%) accounting for the largest median family size of 3.07 persons per family. On the other hand, married-couple families (365 | 89.9%) represent the smallest median family size with 2.22 persons per family.
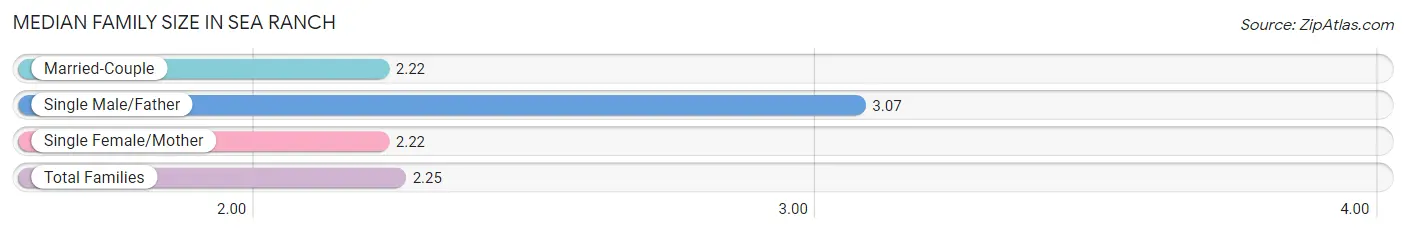
| Family Type | # Families | Family Size |
| Married-Couple | 365 (89.9%) | 2.22 |
| Single Male/Father | 14 (3.5%) | 3.07 |
| Single Female/Mother | 27 (6.7%) | 2.22 |
| Total Families | 406 (100.0%) | 2.25 |
Median Household Size in Sea Ranch
The median household size in Sea Ranch is 1.90 persons per household, with single male/father households (14 | 2.2%) accounting for the largest median household size of 4.14 persons per household. non-family households (237 | 36.9%) represent the smallest median household size with 1.13 persons per household.
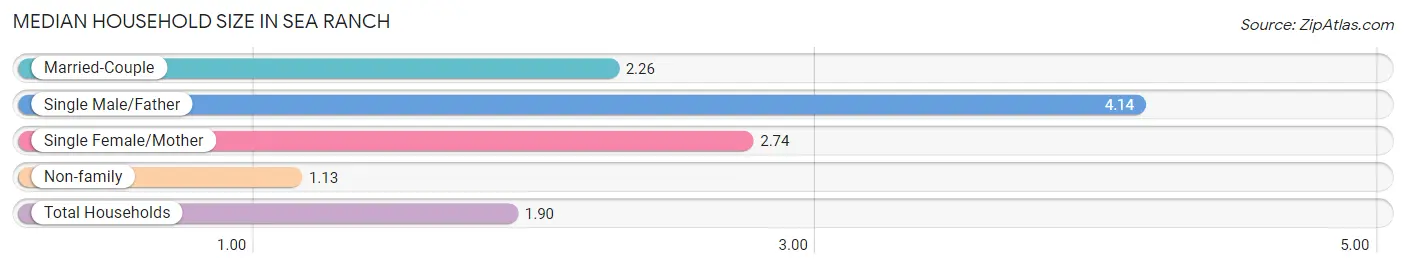
| Household Type | # Households | Household Size |
| Married-Couple | 365 (56.8%) | 2.26 |
| Single Male/Father | 14 (2.2%) | 4.14 |
| Single Female/Mother | 27 (4.2%) | 2.74 |
| Non-family | 237 (36.9%) | 1.13 |
| Total Households | 643 (100.0%) | 1.90 |
Household Size by Marriage Status in Sea Ranch
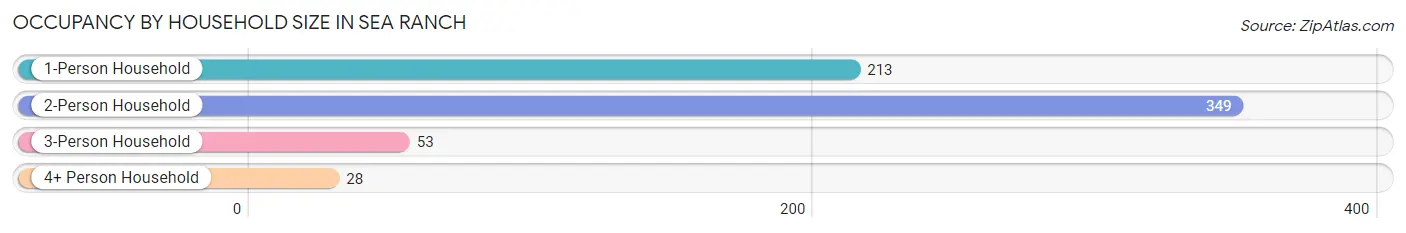
Out of a total of 643 households in Sea Ranch, 406 (63.1%) are family households, while 237 (36.9%) are nonfamily households. The most numerous type of family households are 2-person households, comprising 325, and the most common type of nonfamily households are 1-person households, comprising 213.
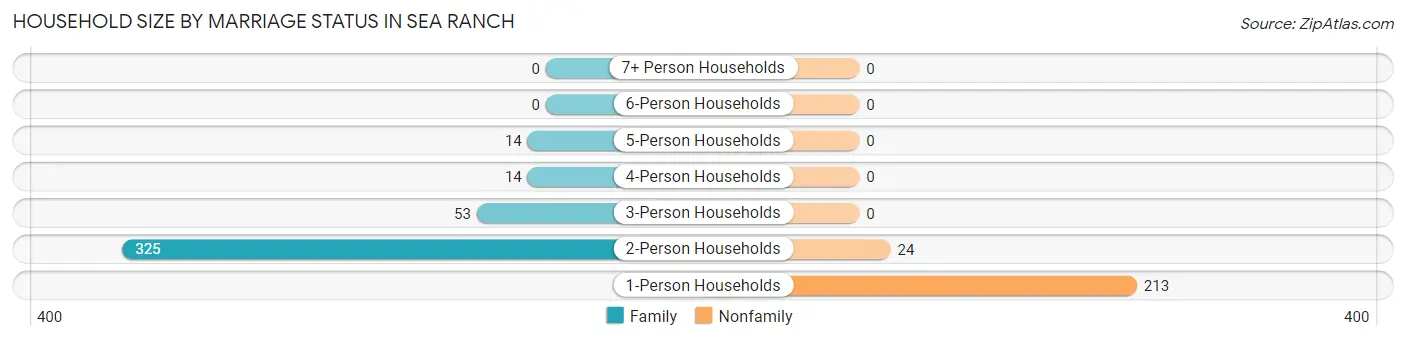
| Household Size | Family Households | Nonfamily Households |
| 1-Person Households | - | 213 (33.1%) |
| 2-Person Households | 325 (50.5%) | 24 (3.7%) |
| 3-Person Households | 53 (8.2%) | 0 (0.0%) |
| 4-Person Households | 14 (2.2%) | 0 (0.0%) |
| 5-Person Households | 14 (2.2%) | 0 (0.0%) |
| 6-Person Households | 0 (0.0%) | 0 (0.0%) |
| 7+ Person Households | 0 (0.0%) | 0 (0.0%) |
| Total | 406 (63.1%) | 237 (36.9%) |
Female Fertility in Sea Ranch
Fertility by Age in Sea Ranch
Average fertility rate in Sea Ranch is 289.0 births per 1,000 women. Women in the age bracket of 35 to 50 years have the highest fertility rate with 289.0 births per 1,000 women. Women in the age bracket of 35 to 50 years acount for 100.0% of all women with births.
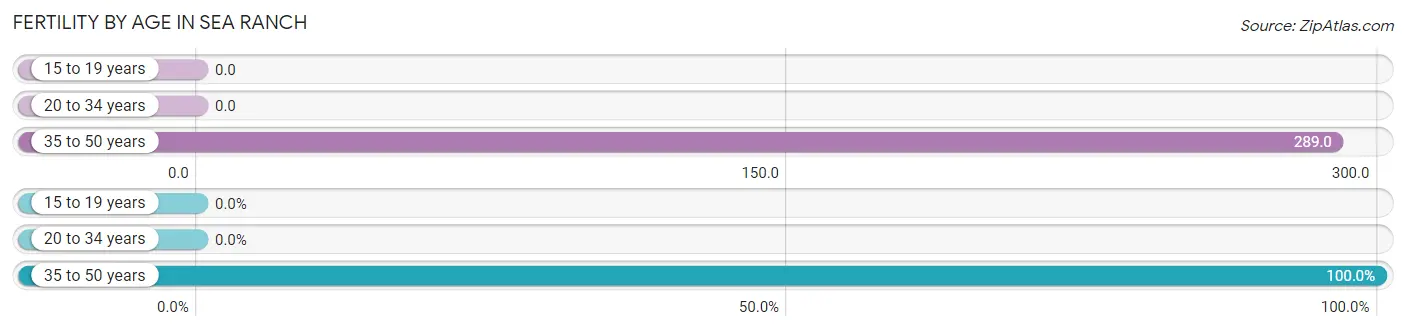
| Age Bracket | Women with Births | Births / 1,000 Women |
| 15 to 19 years | 0 (0.0%) | 0.0 |
| 20 to 34 years | 0 (0.0%) | 0.0 |
| 35 to 50 years | 11 (100.0%) | 289.0 |
| Total | 11 (100.0%) | 289.0 |
Fertility by Age by Marriage Status in Sea Ranch
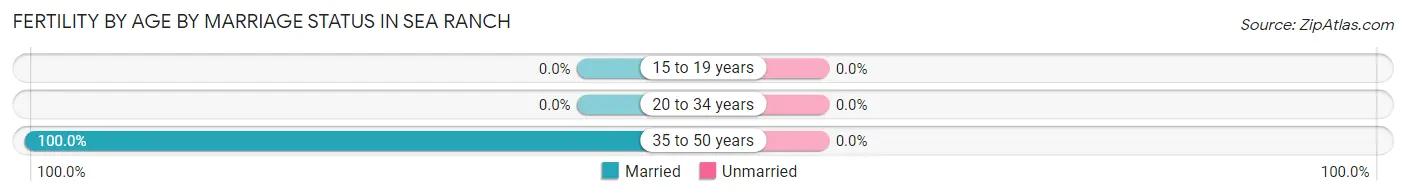
| Age Bracket | Married | Unmarried |
| 15 to 19 years | 0 (0.0%) | 0 (0.0%) |
| 20 to 34 years | 0 (0.0%) | 0 (0.0%) |
| 35 to 50 years | 11 (100.0%) | 0 (0.0%) |
| Total | 11 (100.0%) | 0 (0.0%) |
Fertility by Education in Sea Ranch
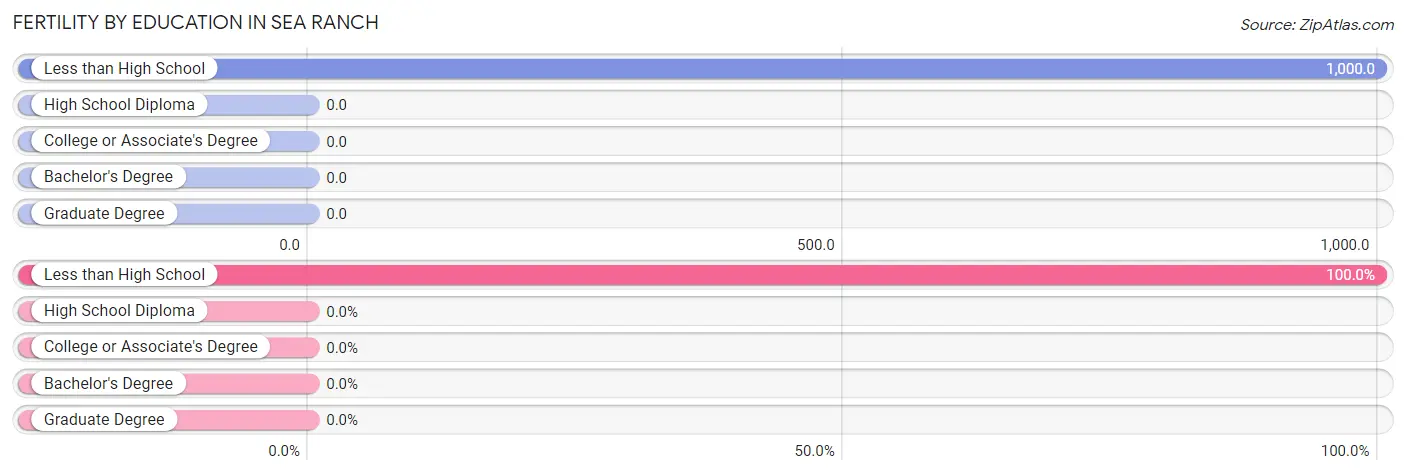
| Educational Attainment | Women with Births | Births / 1,000 Women |
| Less than High School | 11 (100.0%) | 1,000.0 |
| High School Diploma | 0 (0.0%) | 0.0 |
| College or Associate's Degree | 0 (0.0%) | 0.0 |
| Bachelor's Degree | 0 (0.0%) | 0.0 |
| Graduate Degree | 0 (0.0%) | 0.0 |
| Total | 11 (100.0%) | 289.0 |
Fertility by Education by Marriage Status in Sea Ranch
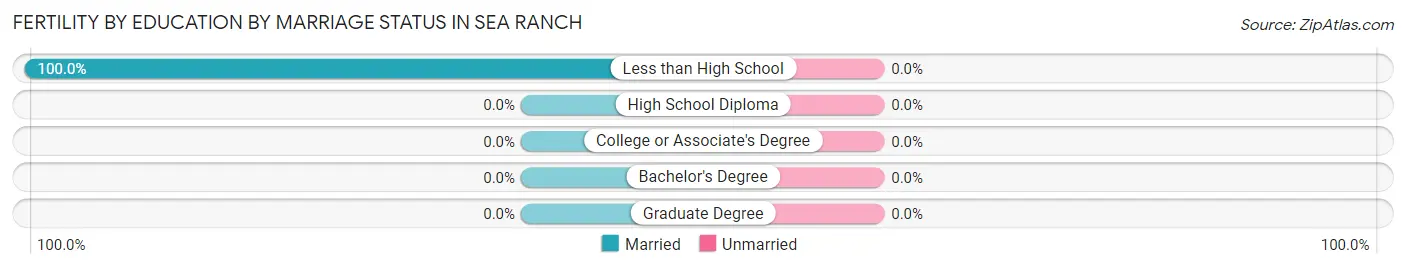
| Educational Attainment | Married | Unmarried |
| Less than High School | 11 (100.0%) | 0 (0.0%) |
| High School Diploma | 0 (0.0%) | 0 (0.0%) |
| College or Associate's Degree | 0 (0.0%) | 0 (0.0%) |
| Bachelor's Degree | 0 (0.0%) | 0 (0.0%) |
| Graduate Degree | 0 (0.0%) | 0 (0.0%) |
| Total | 11 (100.0%) | 0 (0.0%) |
Employment Characteristics in Sea Ranch
Employment by Class of Employer in Sea Ranch
Among the 366 employed individuals in Sea Ranch, private company employees (154 | 42.1%), self-employed (not incorporated) (72 | 19.7%), and local government employees (55 | 15.0%) make up the most common classes of employment.
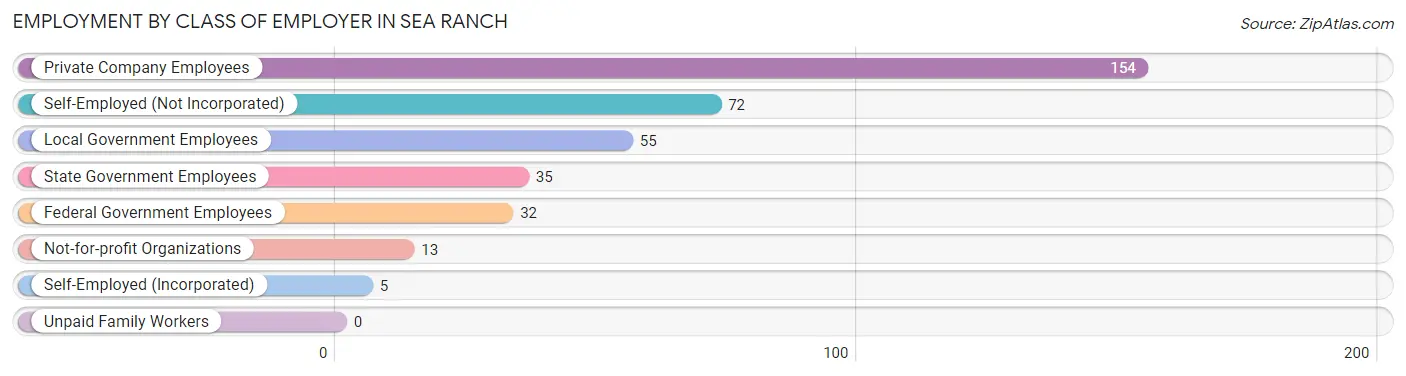
| Employer Class | # Employees | % Employees |
| Private Company Employees | 154 | 42.1% |
| Self-Employed (Incorporated) | 5 | 1.4% |
| Self-Employed (Not Incorporated) | 72 | 19.7% |
| Not-for-profit Organizations | 13 | 3.5% |
| Local Government Employees | 55 | 15.0% |
| State Government Employees | 35 | 9.6% |
| Federal Government Employees | 32 | 8.7% |
| Unpaid Family Workers | 0 | 0.0% |
| Total | 366 | 100.0% |
Employment Status by Age in Sea Ranch
According to the labor force statistics for Sea Ranch, out of the total population over 16 years of age (1,152), 33.0% or 380 individuals are in the labor force, with 3.7% or 14 of them unemployed. The age group with the highest labor force participation rate is 25 to 29 years, with 100.0% or 18 individuals in the labor force. Within the labor force, the 35 to 44 years age range has the highest percentage of unemployed individuals, with 35.0% or 14 of them being unemployed.
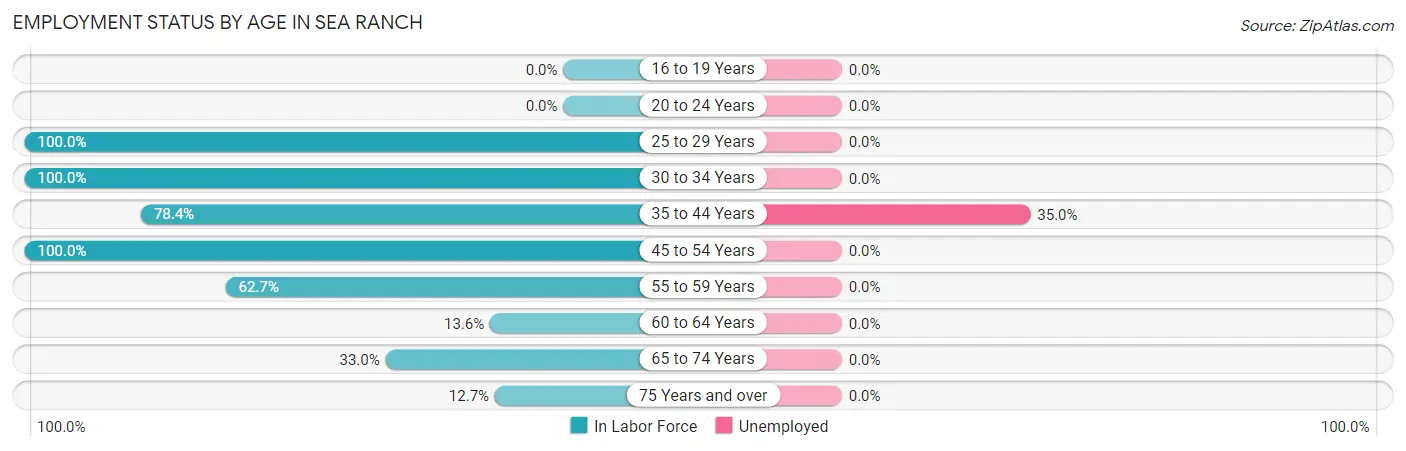
| Age Bracket | In Labor Force | Unemployed |
| 16 to 19 Years | 0 (0.0%) | 0 (0.0%) |
| 20 to 24 Years | 0 (0.0%) | 0 (0.0%) |
| 25 to 29 Years | 18 (100.0%) | 0 (0.0%) |
| 30 to 34 Years | 20 (100.0%) | 0 (0.0%) |
| 35 to 44 Years | 40 (78.4%) | 14 (35.0%) |
| 45 to 54 Years | 38 (100.0%) | 0 (0.0%) |
| 55 to 59 Years | 47 (62.7%) | 0 (0.0%) |
| 60 to 64 Years | 24 (13.6%) | 0 (0.0%) |
| 65 to 74 Years | 154 (33.0%) | 0 (0.0%) |
| 75 Years and over | 39 (12.7%) | 0 (0.0%) |
| Total | 380 (33.0%) | 14 (3.7%) |
Employment Status by Educational Attainment in Sea Ranch
According to labor force statistics for Sea Ranch, 49.5% of individuals (187) out of the total population between 25 and 64 years of age (378) are in the labor force, with 7.5% or 14 of them being unemployed. The group with the highest labor force participation rate are those with the educational attainment of high school diploma, with 77.8% or 49 individuals in the labor force. Within the labor force, individuals with high school diploma education have the highest percentage of unemployment, with 28.6% or 14 of them being unemployed.
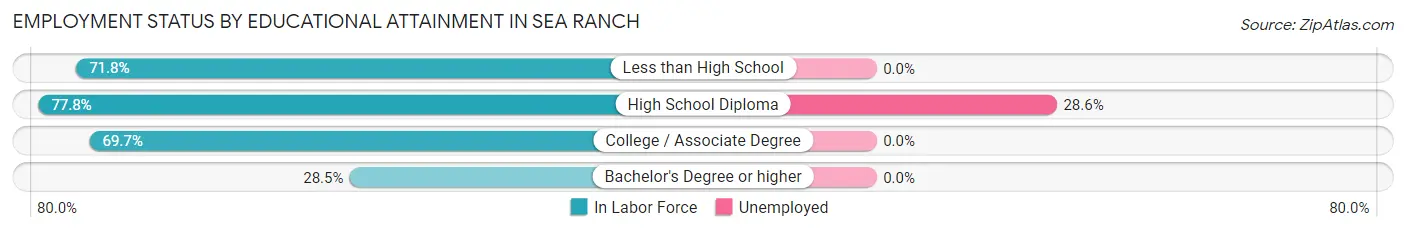
| Educational Attainment | In Labor Force | Unemployed |
| Less than High School | 28 (71.8%) | 0 (0.0%) |
| High School Diploma | 49 (77.8%) | 18 (28.6%) |
| College / Associate Degree | 53 (69.7%) | 0 (0.0%) |
| Bachelor's Degree or higher | 57 (28.5%) | 0 (0.0%) |
| Total | 187 (49.5%) | 28 (7.5%) |
Employment Occupations by Sex in Sea Ranch
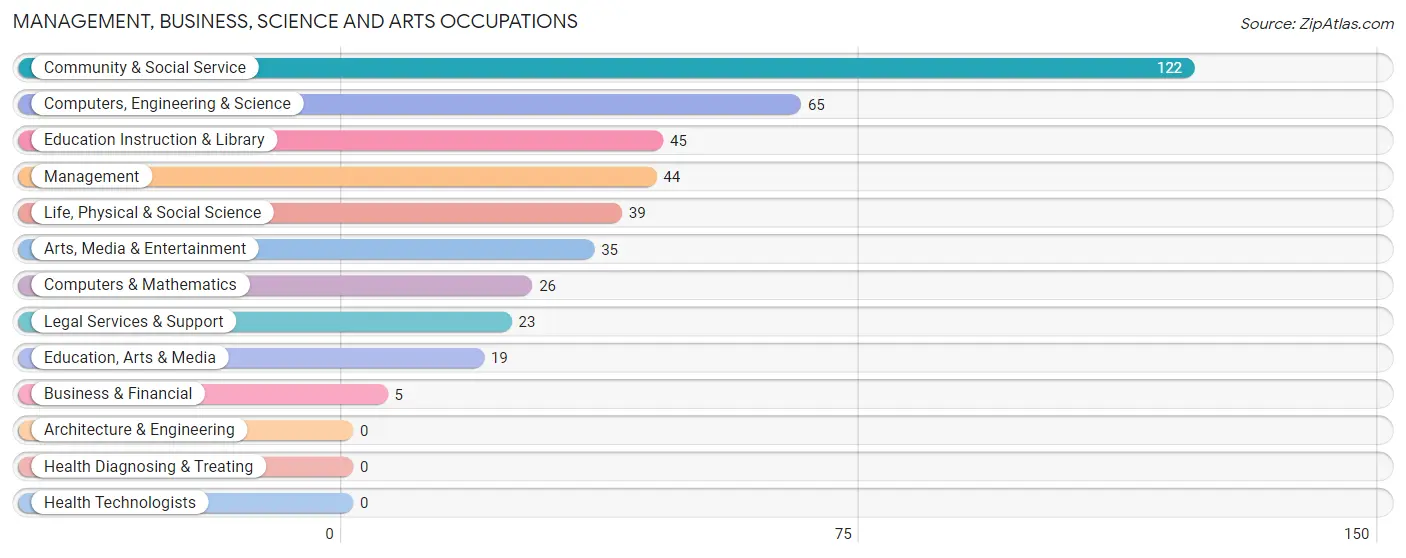
Management, Business, Science and Arts Occupations
The most common Management, Business, Science and Arts occupations in Sea Ranch are Community & Social Service (122 | 33.3%), Computers, Engineering & Science (65 | 17.8%), Education Instruction & Library (45 | 12.3%), Management (44 | 12.0%), and Life, Physical & Social Science (39 | 10.7%).
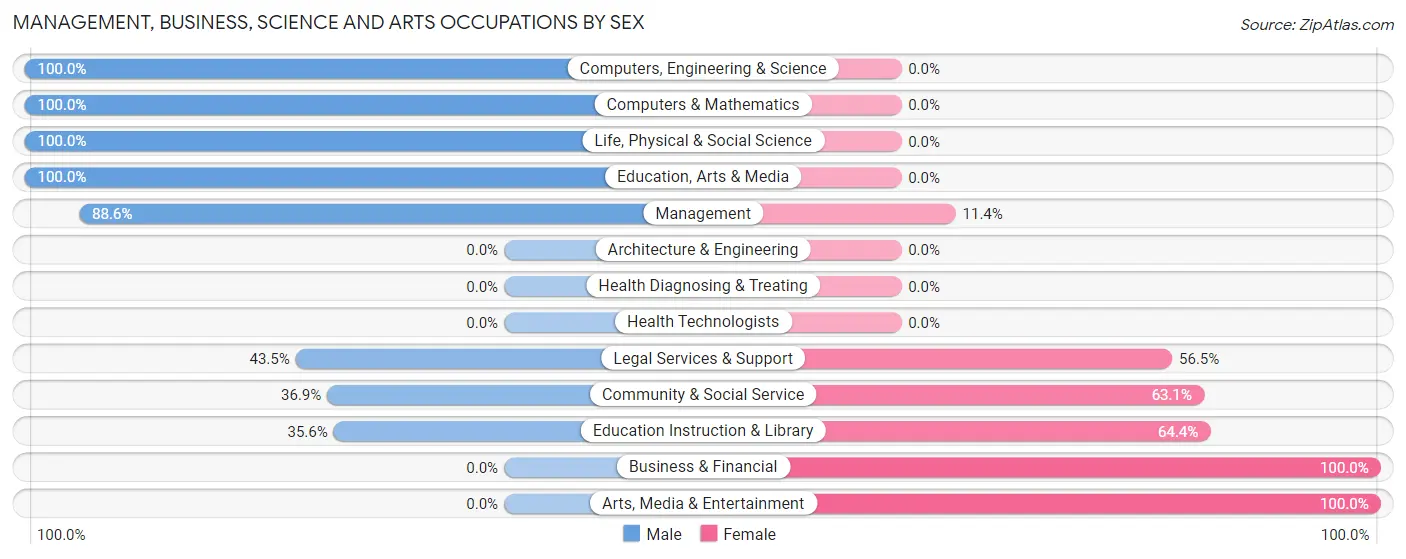
Management, Business, Science and Arts Occupations by Sex
Within the Management, Business, Science and Arts occupations in Sea Ranch, the most male-oriented occupations are Computers, Engineering & Science (100.0%), Computers & Mathematics (100.0%), and Life, Physical & Social Science (100.0%), while the most female-oriented occupations are Business & Financial (100.0%), Arts, Media & Entertainment (100.0%), and Education Instruction & Library (64.4%).
| Occupation | Male | Female |
| Management | 39 (88.6%) | 5 (11.4%) |
| Business & Financial | 0 (0.0%) | 5 (100.0%) |
| Computers, Engineering & Science | 65 (100.0%) | 0 (0.0%) |
| Computers & Mathematics | 26 (100.0%) | 0 (0.0%) |
| Architecture & Engineering | 0 (0.0%) | 0 (0.0%) |
| Life, Physical & Social Science | 39 (100.0%) | 0 (0.0%) |
| Community & Social Service | 45 (36.9%) | 77 (63.1%) |
| Education, Arts & Media | 19 (100.0%) | 0 (0.0%) |
| Legal Services & Support | 10 (43.5%) | 13 (56.5%) |
| Education Instruction & Library | 16 (35.6%) | 29 (64.4%) |
| Arts, Media & Entertainment | 0 (0.0%) | 35 (100.0%) |
| Health Diagnosing & Treating | 0 (0.0%) | 0 (0.0%) |
| Health Technologists | 0 (0.0%) | 0 (0.0%) |
| Total (Category) | 149 (63.1%) | 87 (36.9%) |
| Total (Overall) | 218 (59.6%) | 148 (40.4%) |
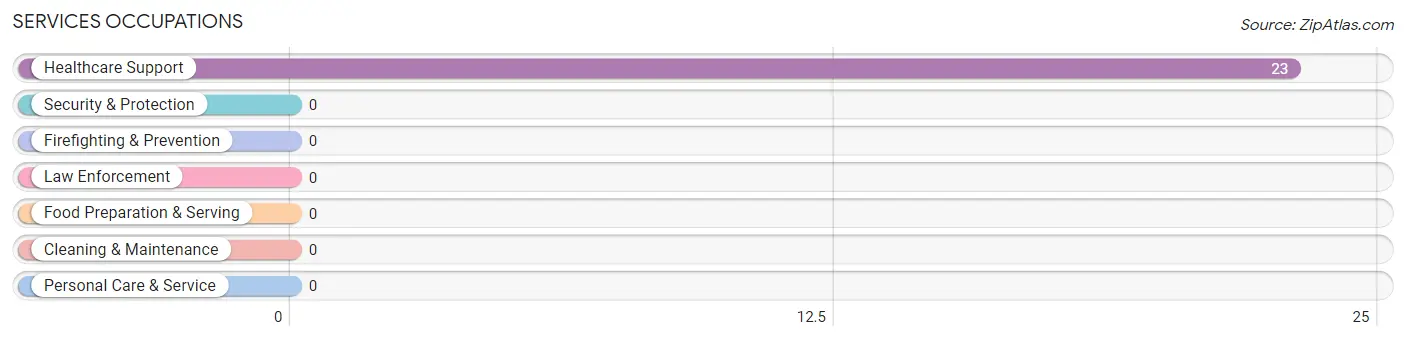
Services Occupations
The most common Services occupations in Sea Ranch are , and Healthcare Support (23 | 6.3%).
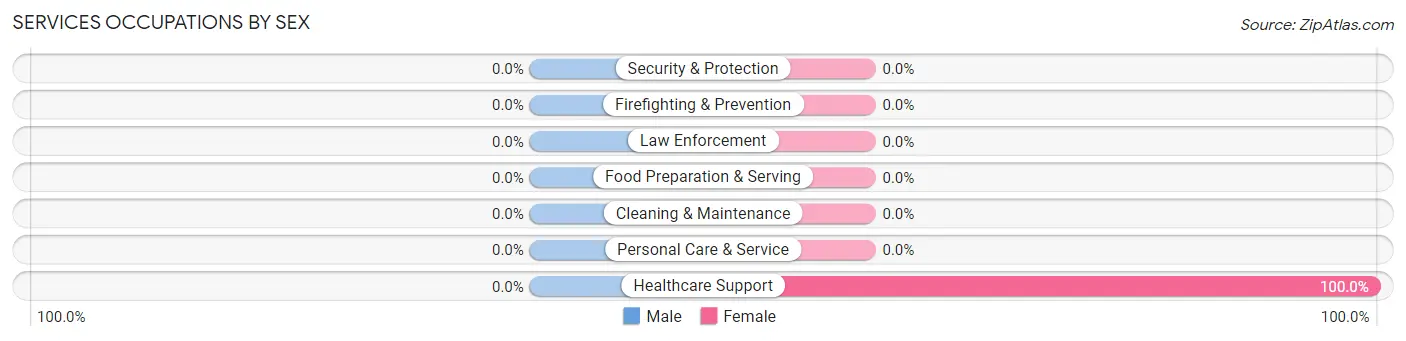
Services Occupations by Sex
| Occupation | Male | Female |
| Healthcare Support | 0 (0.0%) | 23 (100.0%) |
| Security & Protection | 0 (0.0%) | 0 (0.0%) |
| Firefighting & Prevention | 0 (0.0%) | 0 (0.0%) |
| Law Enforcement | 0 (0.0%) | 0 (0.0%) |
| Food Preparation & Serving | 0 (0.0%) | 0 (0.0%) |
| Cleaning & Maintenance | 0 (0.0%) | 0 (0.0%) |
| Personal Care & Service | 0 (0.0%) | 0 (0.0%) |
| Total (Category) | 0 (0.0%) | 23 (100.0%) |
| Total (Overall) | 218 (59.6%) | 148 (40.4%) |
Sales and Office Occupations
The most common Sales and Office occupations in Sea Ranch are Sales & Related (40 | 10.9%), and Office & Administration (15 | 4.1%).
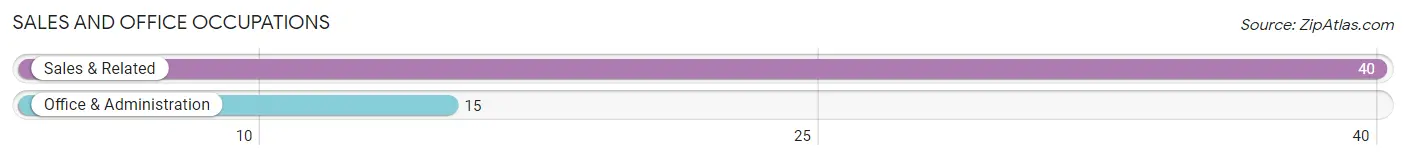
Sales and Office Occupations by Sex
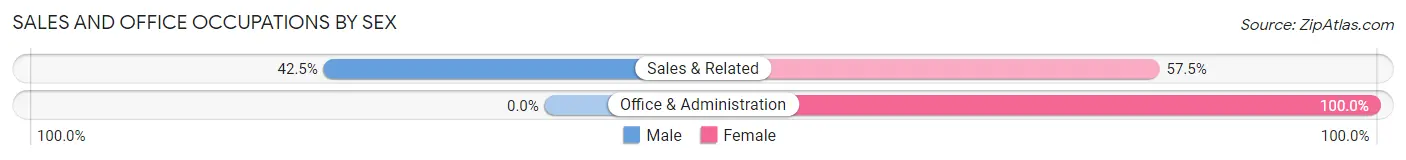
| Occupation | Male | Female |
| Sales & Related | 17 (42.5%) | 23 (57.5%) |
| Office & Administration | 0 (0.0%) | 15 (100.0%) |
| Total (Category) | 17 (30.9%) | 38 (69.1%) |
| Total (Overall) | 218 (59.6%) | 148 (40.4%) |
Natural Resources, Construction and Maintenance Occupations
The most common Natural Resources, Construction and Maintenance occupations in Sea Ranch are Farming, Fishing & Forestry (38 | 10.4%), and Construction & Extraction (14 | 3.8%).
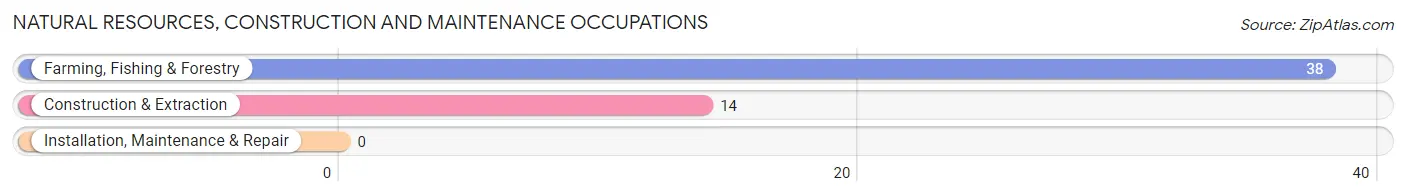
Natural Resources, Construction and Maintenance Occupations by Sex
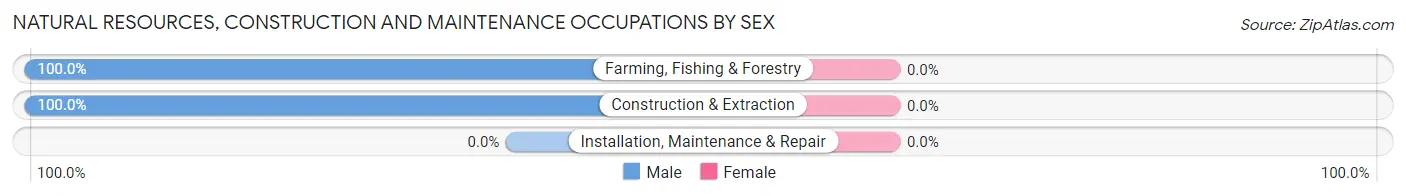
| Occupation | Male | Female |
| Farming, Fishing & Forestry | 38 (100.0%) | 0 (0.0%) |
| Construction & Extraction | 14 (100.0%) | 0 (0.0%) |
| Installation, Maintenance & Repair | 0 (0.0%) | 0 (0.0%) |
| Total (Category) | 52 (100.0%) | 0 (0.0%) |
| Total (Overall) | 218 (59.6%) | 148 (40.4%) |
Production, Transportation and Moving Occupations
Production, Transportation and Moving Occupations by Sex
| Occupation | Male | Female |
| Production | 0 (0.0%) | 0 (0.0%) |
| Transportation | 0 (0.0%) | 0 (0.0%) |
| Material Moving | 0 (0.0%) | 0 (0.0%) |
| Total (Category) | 0 (0.0%) | 0 (0.0%) |
| Total (Overall) | 218 (59.6%) | 148 (40.4%) |
Employment Industries by Sex in Sea Ranch
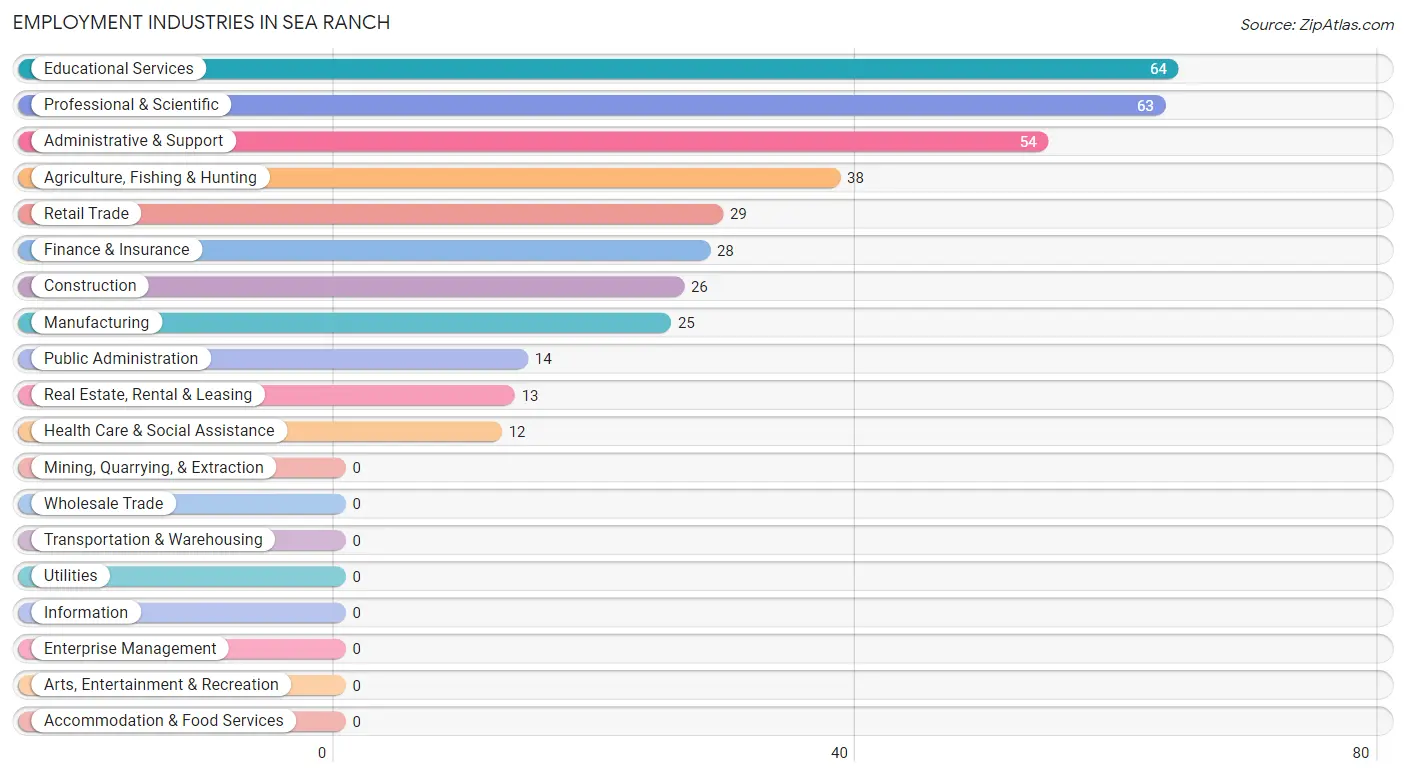
Employment Industries in Sea Ranch
The major employment industries in Sea Ranch include Educational Services (64 | 17.5%), Professional & Scientific (63 | 17.2%), Administrative & Support (54 | 14.7%), Agriculture, Fishing & Hunting (38 | 10.4%), and Retail Trade (29 | 7.9%).
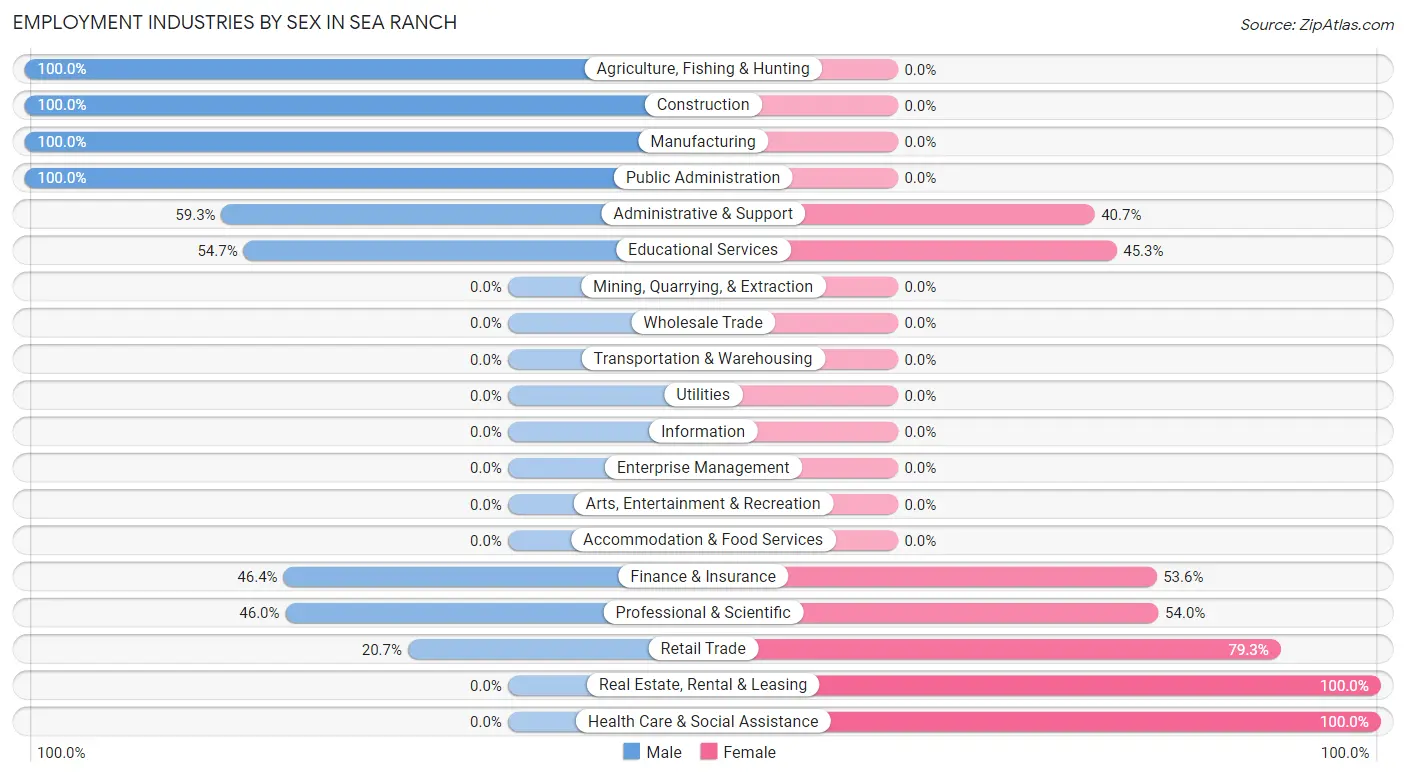
Employment Industries by Sex in Sea Ranch
The Sea Ranch industries that see more men than women are Agriculture, Fishing & Hunting (100.0%), Construction (100.0%), and Manufacturing (100.0%), whereas the industries that tend to have a higher number of women are Real Estate, Rental & Leasing (100.0%), Health Care & Social Assistance (100.0%), and Retail Trade (79.3%).
| Industry | Male | Female |
| Agriculture, Fishing & Hunting | 38 (100.0%) | 0 (0.0%) |
| Mining, Quarrying, & Extraction | 0 (0.0%) | 0 (0.0%) |
| Construction | 26 (100.0%) | 0 (0.0%) |
| Manufacturing | 25 (100.0%) | 0 (0.0%) |
| Wholesale Trade | 0 (0.0%) | 0 (0.0%) |
| Retail Trade | 6 (20.7%) | 23 (79.3%) |
| Transportation & Warehousing | 0 (0.0%) | 0 (0.0%) |
| Utilities | 0 (0.0%) | 0 (0.0%) |
| Information | 0 (0.0%) | 0 (0.0%) |
| Finance & Insurance | 13 (46.4%) | 15 (53.6%) |
| Real Estate, Rental & Leasing | 0 (0.0%) | 13 (100.0%) |
| Professional & Scientific | 29 (46.0%) | 34 (54.0%) |
| Enterprise Management | 0 (0.0%) | 0 (0.0%) |
| Administrative & Support | 32 (59.3%) | 22 (40.7%) |
| Educational Services | 35 (54.7%) | 29 (45.3%) |
| Health Care & Social Assistance | 0 (0.0%) | 12 (100.0%) |
| Arts, Entertainment & Recreation | 0 (0.0%) | 0 (0.0%) |
| Accommodation & Food Services | 0 (0.0%) | 0 (0.0%) |
| Public Administration | 14 (100.0%) | 0 (0.0%) |
| Total | 218 (59.6%) | 148 (40.4%) |
Education in Sea Ranch
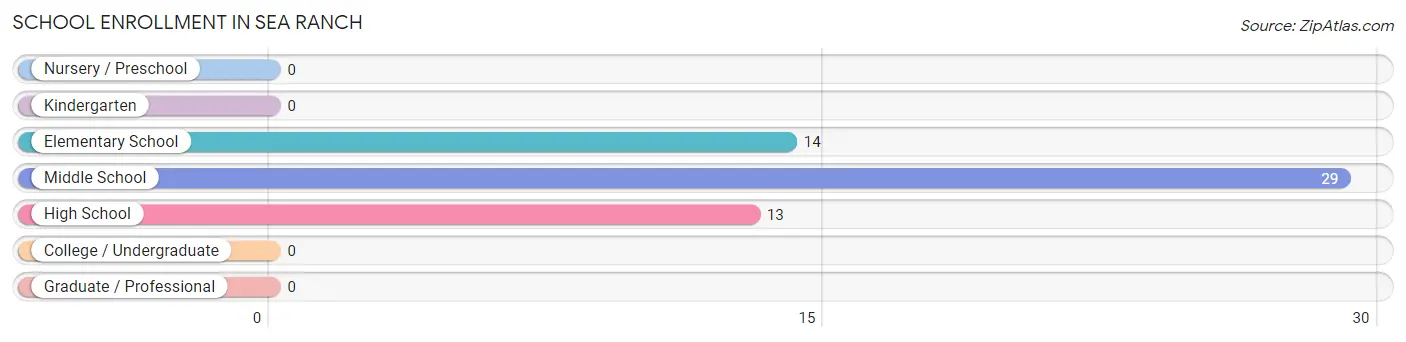
School Enrollment in Sea Ranch
The most common levels of schooling among the 56 students in Sea Ranch are middle school (29 | 51.8%), elementary school (14 | 25.0%), and high school (13 | 23.2%).
| School Level | # Students | % Students |
| Nursery / Preschool | 0 | 0.0% |
| Kindergarten | 0 | 0.0% |
| Elementary School | 14 | 25.0% |
| Middle School | 29 | 51.8% |
| High School | 13 | 23.2% |
| College / Undergraduate | 0 | 0.0% |
| Graduate / Professional | 0 | 0.0% |
| Total | 56 | 100.0% |
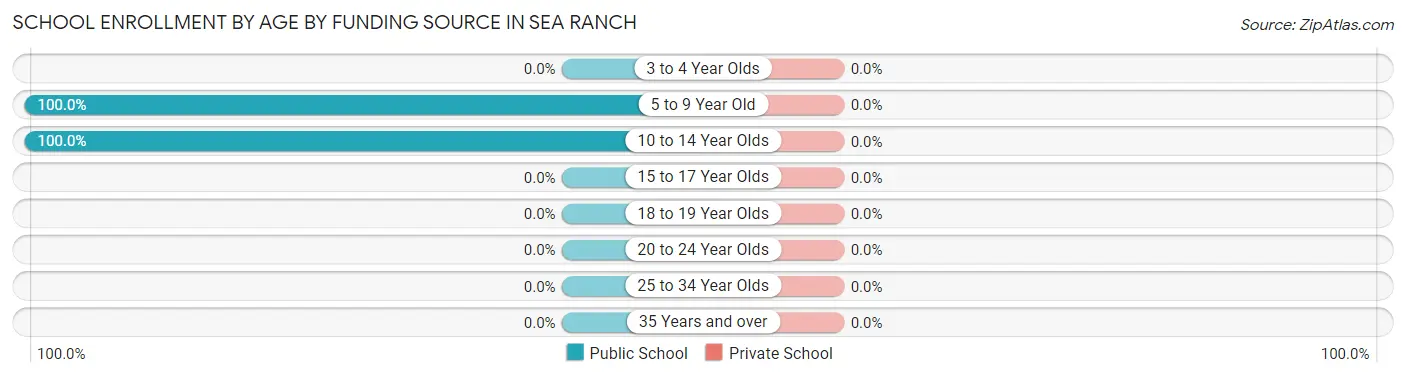
School Enrollment by Age by Funding Source in Sea Ranch
| Age Bracket | Public School | Private School |
| 3 to 4 Year Olds | 0 (0.0%) | 0 (0.0%) |
| 5 to 9 Year Old | 14 (100.0%) | 0 (0.0%) |
| 10 to 14 Year Olds | 42 (100.0%) | 0 (0.0%) |
| 15 to 17 Year Olds | 0 (0.0%) | 0 (0.0%) |
| 18 to 19 Year Olds | 0 (0.0%) | 0 (0.0%) |
| 20 to 24 Year Olds | 0 (0.0%) | 0 (0.0%) |
| 25 to 34 Year Olds | 0 (0.0%) | 0 (0.0%) |
| 35 Years and over | 0 (0.0%) | 0 (0.0%) |
| Total | 56 (100.0%) | 0 (0.0%) |
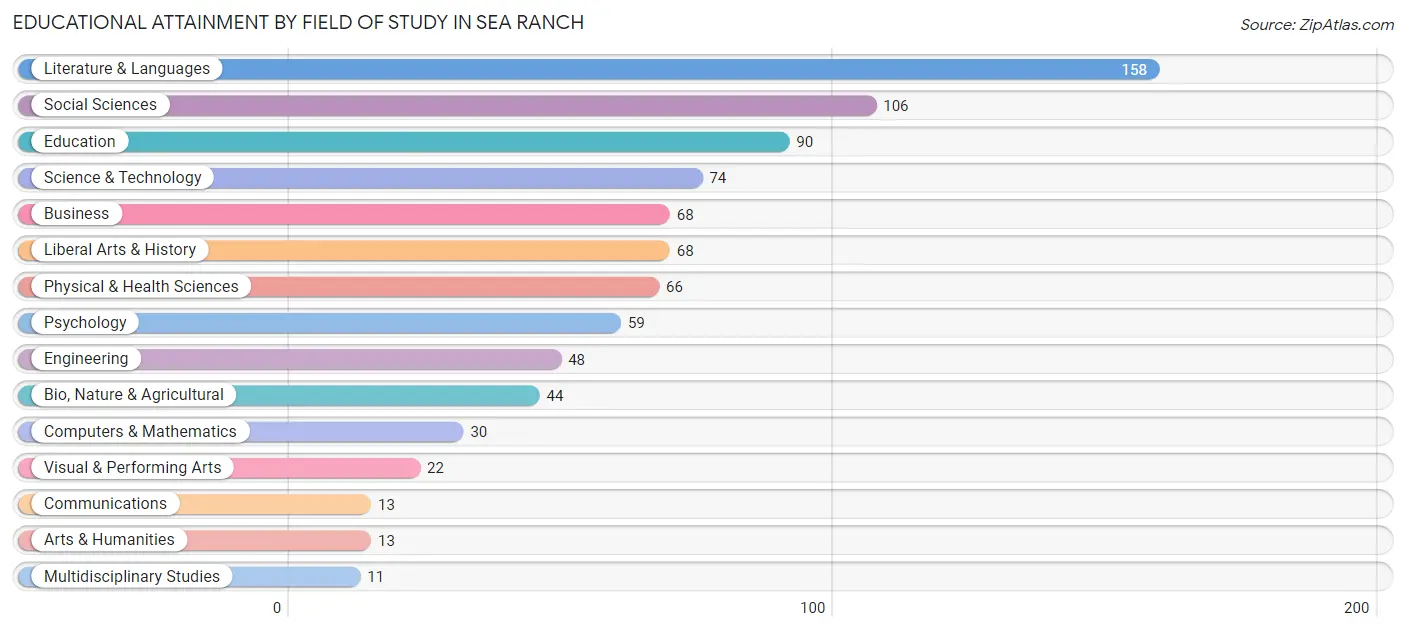
Educational Attainment by Field of Study in Sea Ranch
Literature & languages (158 | 18.2%), social sciences (106 | 12.2%), education (90 | 10.3%), science & technology (74 | 8.5%), and business (68 | 7.8%) are the most common fields of study among 870 individuals in Sea Ranch who have obtained a bachelor's degree or higher.
| Field of Study | # Graduates | % Graduates |
| Computers & Mathematics | 30 | 3.5% |
| Bio, Nature & Agricultural | 44 | 5.1% |
| Physical & Health Sciences | 66 | 7.6% |
| Psychology | 59 | 6.8% |
| Social Sciences | 106 | 12.2% |
| Engineering | 48 | 5.5% |
| Multidisciplinary Studies | 11 | 1.3% |
| Science & Technology | 74 | 8.5% |
| Business | 68 | 7.8% |
| Education | 90 | 10.3% |
| Literature & Languages | 158 | 18.2% |
| Liberal Arts & History | 68 | 7.8% |
| Visual & Performing Arts | 22 | 2.5% |
| Communications | 13 | 1.5% |
| Arts & Humanities | 13 | 1.5% |
| Total | 870 | 100.0% |
Transportation & Commute in Sea Ranch
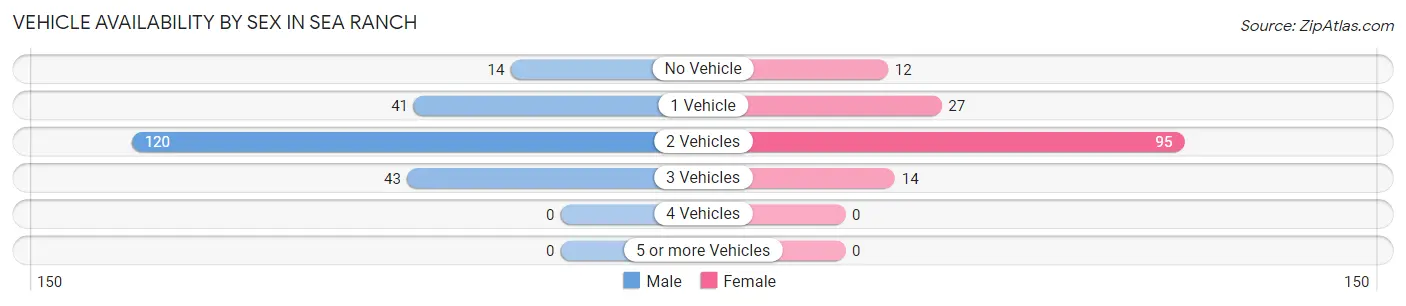
Vehicle Availability by Sex in Sea Ranch
The most prevalent vehicle ownership categories in Sea Ranch are males with 2 vehicles (120, accounting for 55.0%) and females with 2 vehicles (95, making up 81.1%).
| Vehicles Available | Male | Female |
| No Vehicle | 14 (6.4%) | 12 (8.1%) |
| 1 Vehicle | 41 (18.8%) | 27 (18.2%) |
| 2 Vehicles | 120 (55.0%) | 95 (64.2%) |
| 3 Vehicles | 43 (19.7%) | 14 (9.5%) |
| 4 Vehicles | 0 (0.0%) | 0 (0.0%) |
| 5 or more Vehicles | 0 (0.0%) | 0 (0.0%) |
| Total | 218 (100.0%) | 148 (100.0%) |
Commute Time in Sea Ranch
The most frequently occuring commute durations in Sea Ranch are 10 to 14 minutes (56 commuters, 30.6%), 90 or more minutes (48 commuters, 26.2%), and 30 to 34 minutes (35 commuters, 19.1%).
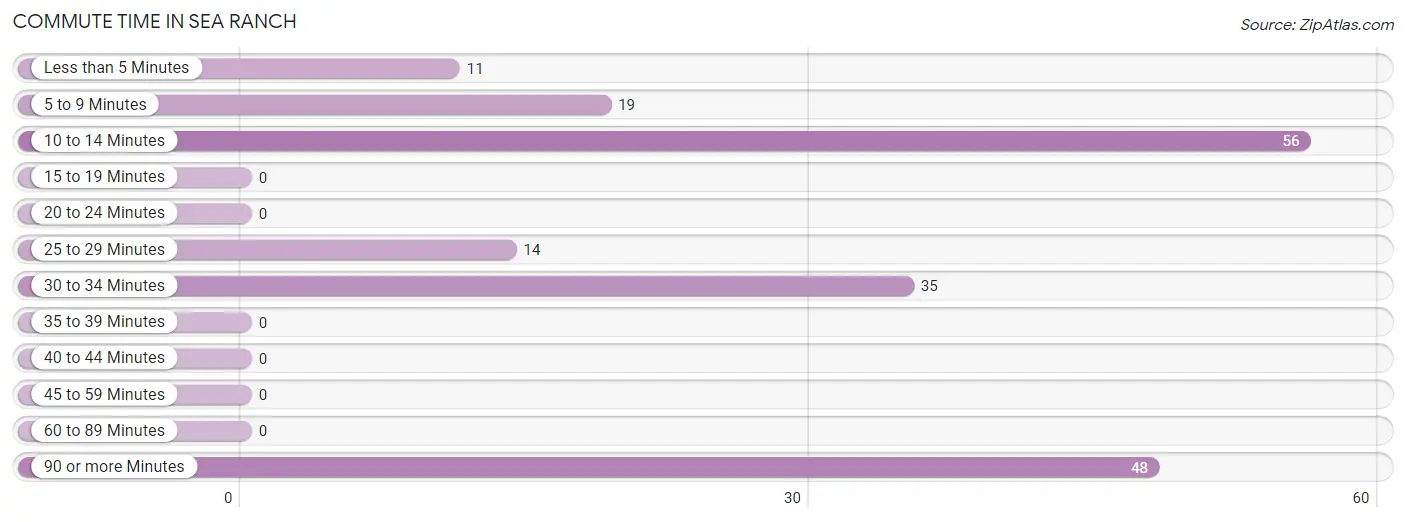
| Commute Time | # Commuters | % Commuters |
| Less than 5 Minutes | 11 | 6.0% |
| 5 to 9 Minutes | 19 | 10.4% |
| 10 to 14 Minutes | 56 | 30.6% |
| 15 to 19 Minutes | 0 | 0.0% |
| 20 to 24 Minutes | 0 | 0.0% |
| 25 to 29 Minutes | 14 | 7.6% |
| 30 to 34 Minutes | 35 | 19.1% |
| 35 to 39 Minutes | 0 | 0.0% |
| 40 to 44 Minutes | 0 | 0.0% |
| 45 to 59 Minutes | 0 | 0.0% |
| 60 to 89 Minutes | 0 | 0.0% |
| 90 or more Minutes | 48 | 26.2% |
Commute Time by Sex in Sea Ranch
The most common commute times in Sea Ranch are 10 to 14 minutes (44 commuters, 37.0%) for males and 30 to 34 minutes (15 commuters, 23.4%) for females.
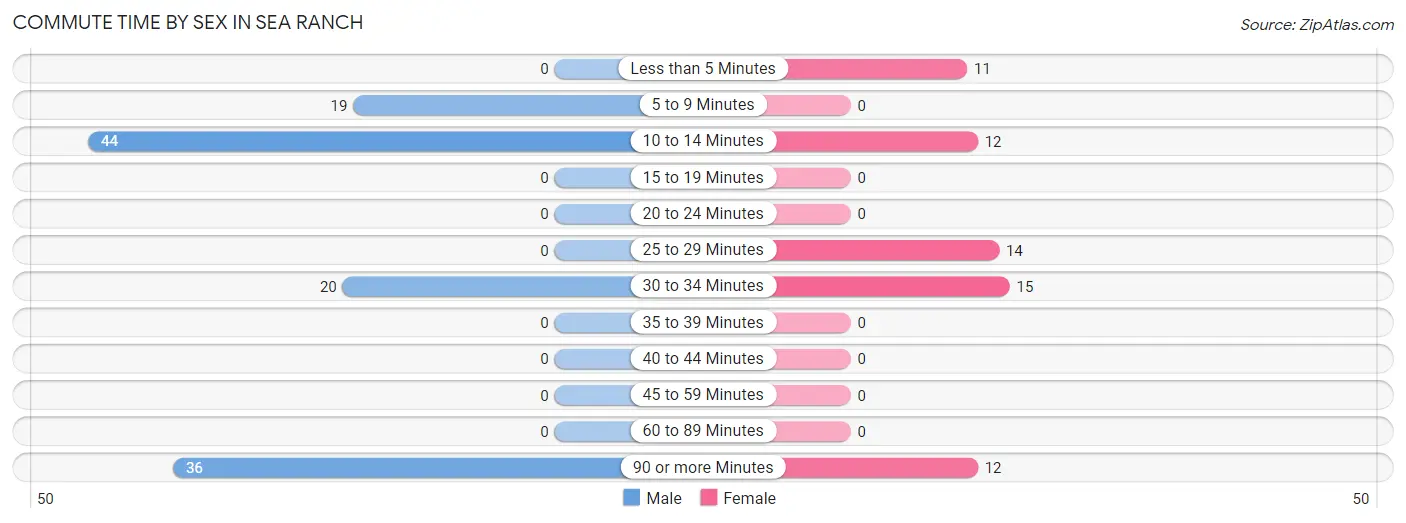
| Commute Time | Male | Female |
| Less than 5 Minutes | 0 (0.0%) | 11 (17.2%) |
| 5 to 9 Minutes | 19 (16.0%) | 0 (0.0%) |
| 10 to 14 Minutes | 44 (37.0%) | 12 (18.8%) |
| 15 to 19 Minutes | 0 (0.0%) | 0 (0.0%) |
| 20 to 24 Minutes | 0 (0.0%) | 0 (0.0%) |
| 25 to 29 Minutes | 0 (0.0%) | 14 (21.9%) |
| 30 to 34 Minutes | 20 (16.8%) | 15 (23.4%) |
| 35 to 39 Minutes | 0 (0.0%) | 0 (0.0%) |
| 40 to 44 Minutes | 0 (0.0%) | 0 (0.0%) |
| 45 to 59 Minutes | 0 (0.0%) | 0 (0.0%) |
| 60 to 89 Minutes | 0 (0.0%) | 0 (0.0%) |
| 90 or more Minutes | 36 (30.2%) | 12 (18.8%) |
Time of Departure to Work by Sex in Sea Ranch
The most frequent times of departure to work in Sea Ranch are 9:00 AM to 9:59 AM (67, 56.3%) for males and 8:30 AM to 8:59 AM (26, 40.6%) for females.
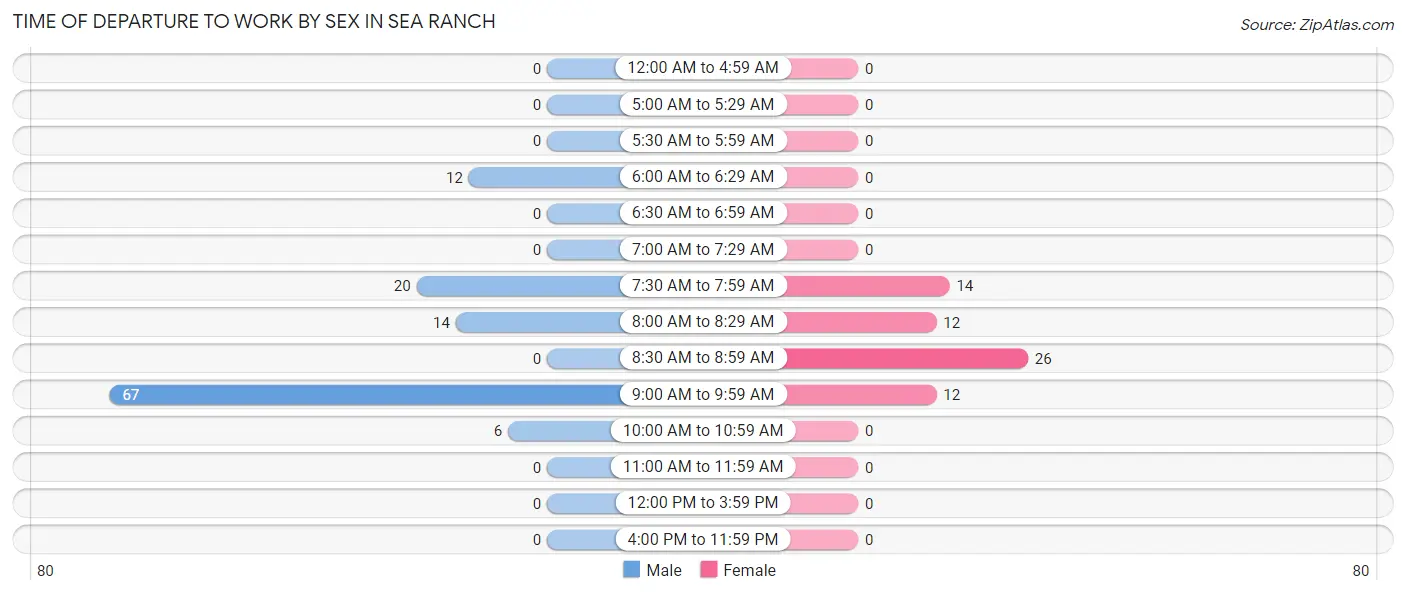
| Time of Departure | Male | Female |
| 12:00 AM to 4:59 AM | 0 (0.0%) | 0 (0.0%) |
| 5:00 AM to 5:29 AM | 0 (0.0%) | 0 (0.0%) |
| 5:30 AM to 5:59 AM | 0 (0.0%) | 0 (0.0%) |
| 6:00 AM to 6:29 AM | 12 (10.1%) | 0 (0.0%) |
| 6:30 AM to 6:59 AM | 0 (0.0%) | 0 (0.0%) |
| 7:00 AM to 7:29 AM | 0 (0.0%) | 0 (0.0%) |
| 7:30 AM to 7:59 AM | 20 (16.8%) | 14 (21.9%) |
| 8:00 AM to 8:29 AM | 14 (11.8%) | 12 (18.8%) |
| 8:30 AM to 8:59 AM | 0 (0.0%) | 26 (40.6%) |
| 9:00 AM to 9:59 AM | 67 (56.3%) | 12 (18.8%) |
| 10:00 AM to 10:59 AM | 6 (5.0%) | 0 (0.0%) |
| 11:00 AM to 11:59 AM | 0 (0.0%) | 0 (0.0%) |
| 12:00 PM to 3:59 PM | 0 (0.0%) | 0 (0.0%) |
| 4:00 PM to 11:59 PM | 0 (0.0%) | 0 (0.0%) |
| Total | 119 (100.0%) | 64 (100.0%) |
Housing Occupancy in Sea Ranch
Occupancy by Ownership in Sea Ranch
Of the total 643 dwellings in Sea Ranch, owner-occupied units account for 598 (93.0%), while renter-occupied units make up 45 (7.0%).
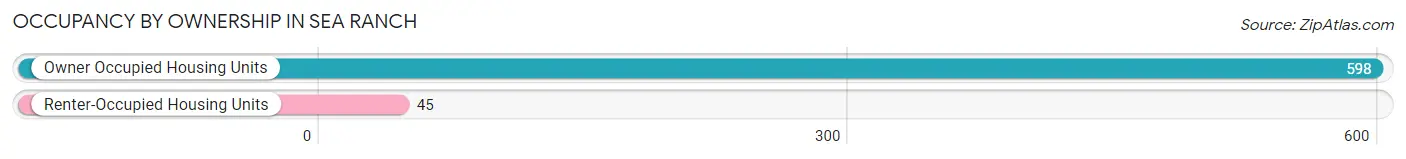
| Occupancy | # Housing Units | % Housing Units |
| Owner Occupied Housing Units | 598 | 93.0% |
| Renter-Occupied Housing Units | 45 | 7.0% |
| Total Occupied Housing Units | 643 | 100.0% |
Occupancy by Household Size in Sea Ranch
| Household Size | # Housing Units | % Housing Units |
| 1-Person Household | 213 | 33.1% |
| 2-Person Household | 349 | 54.3% |
| 3-Person Household | 53 | 8.2% |
| 4+ Person Household | 28 | 4.3% |
| Total Housing Units | 643 | 100.0% |
Occupancy by Ownership by Household Size in Sea Ranch
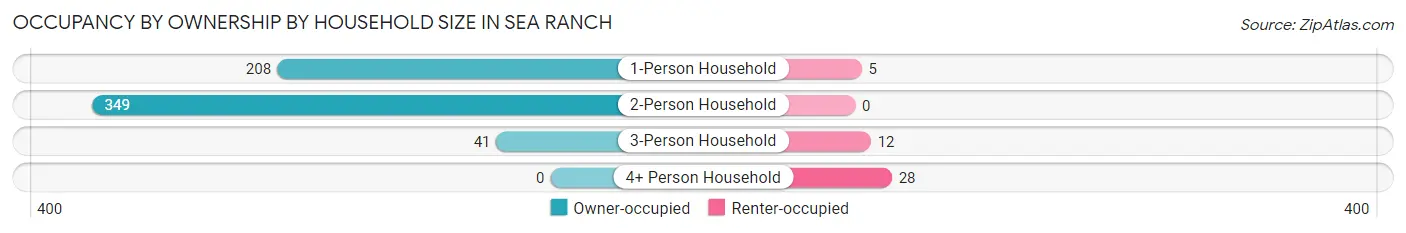
| Household Size | Owner-occupied | Renter-occupied |
| 1-Person Household | 208 (97.7%) | 5 (2.4%) |
| 2-Person Household | 349 (100.0%) | 0 (0.0%) |
| 3-Person Household | 41 (77.4%) | 12 (22.6%) |
| 4+ Person Household | 0 (0.0%) | 28 (100.0%) |
| Total Housing Units | 598 (93.0%) | 45 (7.0%) |
Occupancy by Educational Attainment in Sea Ranch
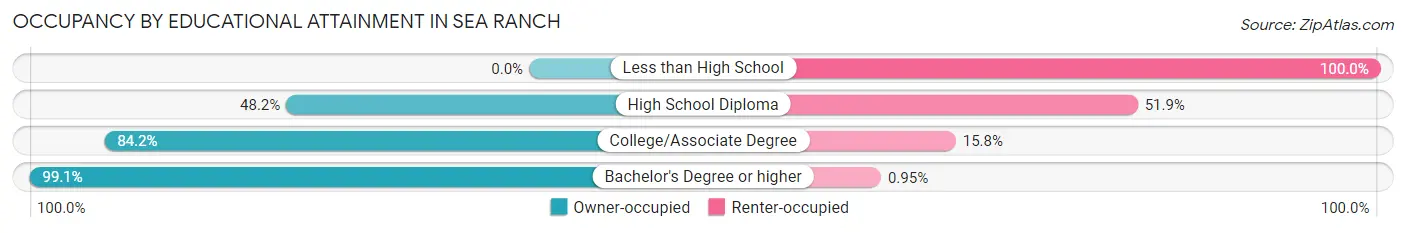
| Household Size | Owner-occupied | Renter-occupied |
| Less than High School | 0 (0.0%) | 14 (100.0%) |
| High School Diploma | 13 (48.1%) | 14 (51.8%) |
| College/Associate Degree | 64 (84.2%) | 12 (15.8%) |
| Bachelor's Degree or higher | 521 (99.1%) | 5 (0.9%) |
Occupancy by Age of Householder in Sea Ranch
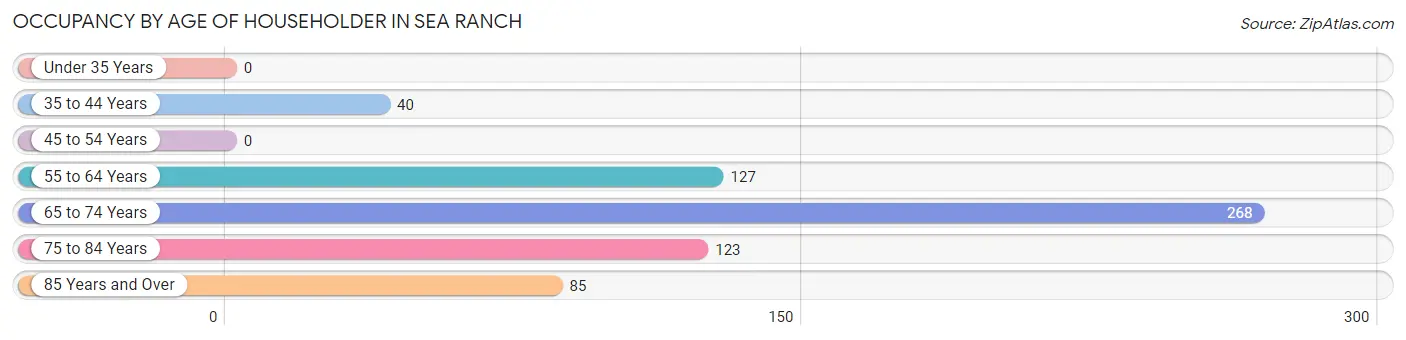
| Age Bracket | # Households | % Households |
| Under 35 Years | 0 | 0.0% |
| 35 to 44 Years | 40 | 6.2% |
| 45 to 54 Years | 0 | 0.0% |
| 55 to 64 Years | 127 | 19.8% |
| 65 to 74 Years | 268 | 41.7% |
| 75 to 84 Years | 123 | 19.1% |
| 85 Years and Over | 85 | 13.2% |
| Total | 643 | 100.0% |
Housing Finances in Sea Ranch
Median Income by Occupancy in Sea Ranch
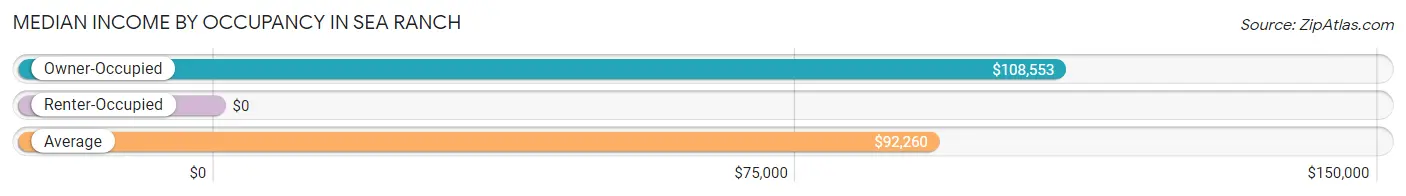
| Occupancy Type | # Households | Median Income |
| Owner-Occupied | 598 (93.0%) | $108,553 |
| Renter-Occupied | 45 (7.0%) | $0 |
| Average | 643 (100.0%) | $92,260 |
Occupancy by Householder Income Bracket in Sea Ranch
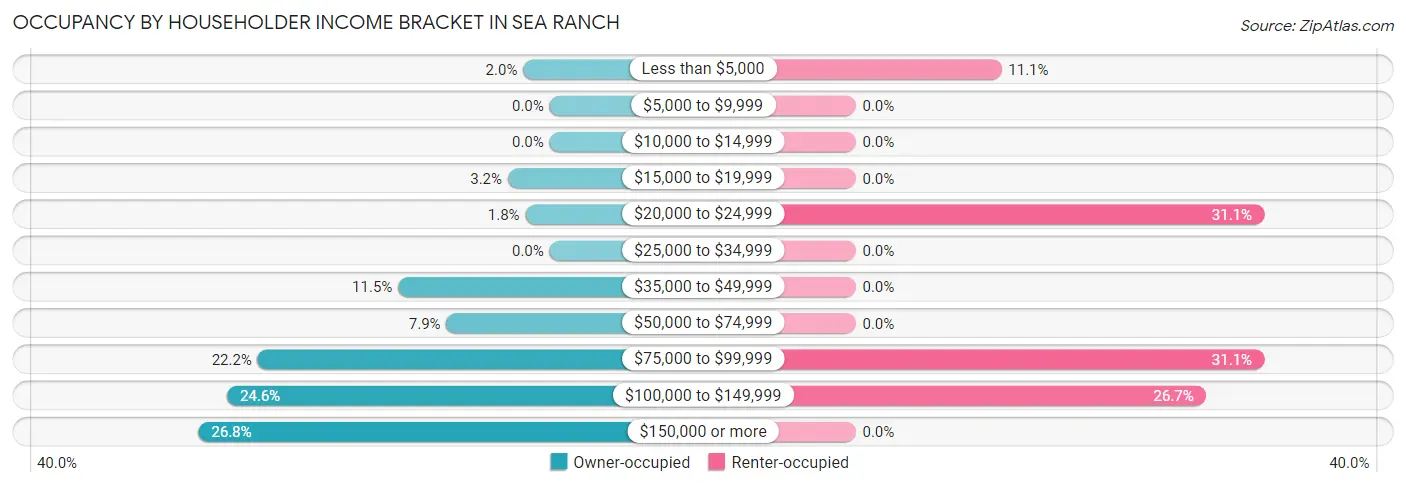
| Income Bracket | Owner-occupied | Renter-occupied |
| Less than $5,000 | 12 (2.0%) | 5 (11.1%) |
| $5,000 to $9,999 | 0 (0.0%) | 0 (0.0%) |
| $10,000 to $14,999 | 0 (0.0%) | 0 (0.0%) |
| $15,000 to $19,999 | 19 (3.2%) | 0 (0.0%) |
| $20,000 to $24,999 | 11 (1.8%) | 14 (31.1%) |
| $25,000 to $34,999 | 0 (0.0%) | 0 (0.0%) |
| $35,000 to $49,999 | 69 (11.5%) | 0 (0.0%) |
| $50,000 to $74,999 | 47 (7.9%) | 0 (0.0%) |
| $75,000 to $99,999 | 133 (22.2%) | 14 (31.1%) |
| $100,000 to $149,999 | 147 (24.6%) | 12 (26.7%) |
| $150,000 or more | 160 (26.8%) | 0 (0.0%) |
| Total | 598 (100.0%) | 45 (100.0%) |
Monthly Housing Cost Tiers in Sea Ranch
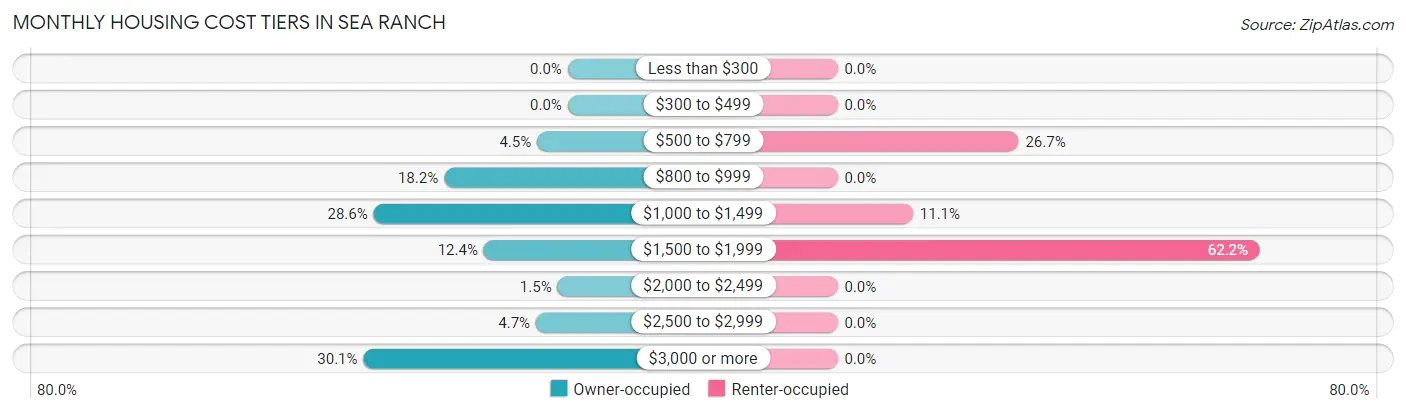
| Monthly Cost | Owner-occupied | Renter-occupied |
| Less than $300 | 0 (0.0%) | 0 (0.0%) |
| $300 to $499 | 0 (0.0%) | 0 (0.0%) |
| $500 to $799 | 27 (4.5%) | 12 (26.7%) |
| $800 to $999 | 109 (18.2%) | 0 (0.0%) |
| $1,000 to $1,499 | 171 (28.6%) | 5 (11.1%) |
| $1,500 to $1,999 | 74 (12.4%) | 28 (62.2%) |
| $2,000 to $2,499 | 9 (1.5%) | 0 (0.0%) |
| $2,500 to $2,999 | 28 (4.7%) | 0 (0.0%) |
| $3,000 or more | 180 (30.1%) | 0 (0.0%) |
| Total | 598 (100.0%) | 45 (100.0%) |
Physical Housing Characteristics in Sea Ranch
Housing Structures in Sea Ranch
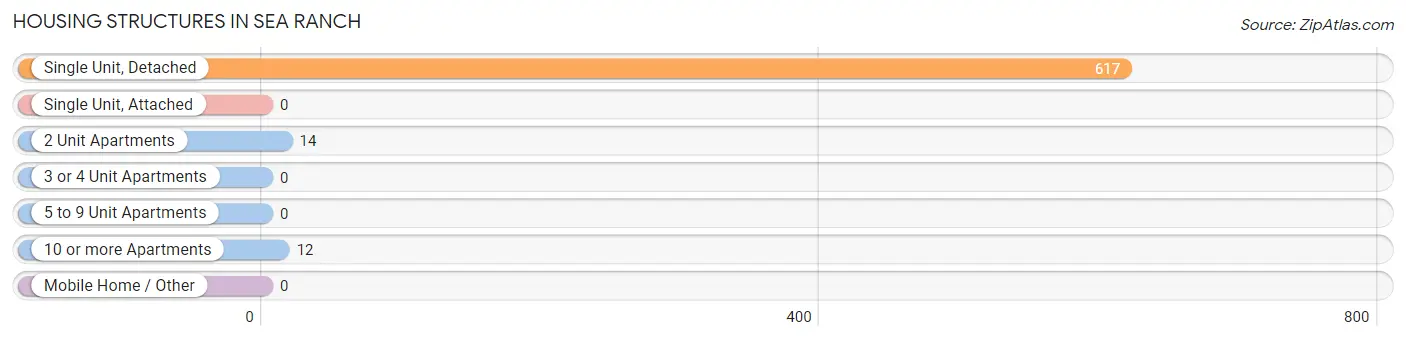
| Structure Type | # Housing Units | % Housing Units |
| Single Unit, Detached | 617 | 96.0% |
| Single Unit, Attached | 0 | 0.0% |
| 2 Unit Apartments | 14 | 2.2% |
| 3 or 4 Unit Apartments | 0 | 0.0% |
| 5 to 9 Unit Apartments | 0 | 0.0% |
| 10 or more Apartments | 12 | 1.9% |
| Mobile Home / Other | 0 | 0.0% |
| Total | 643 | 100.0% |
Housing Structures by Occupancy in Sea Ranch
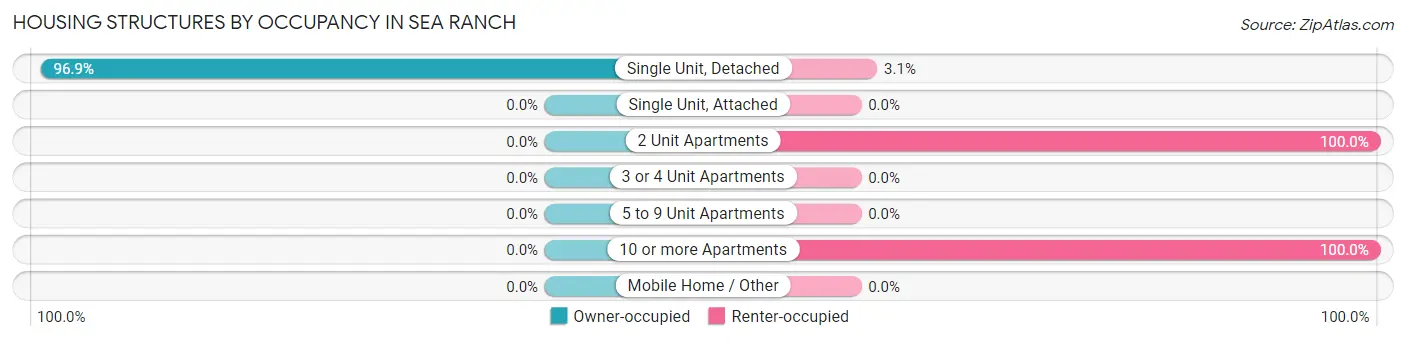
| Structure Type | Owner-occupied | Renter-occupied |
| Single Unit, Detached | 598 (96.9%) | 19 (3.1%) |
| Single Unit, Attached | 0 (0.0%) | 0 (0.0%) |
| 2 Unit Apartments | 0 (0.0%) | 14 (100.0%) |
| 3 or 4 Unit Apartments | 0 (0.0%) | 0 (0.0%) |
| 5 to 9 Unit Apartments | 0 (0.0%) | 0 (0.0%) |
| 10 or more Apartments | 0 (0.0%) | 12 (100.0%) |
| Mobile Home / Other | 0 (0.0%) | 0 (0.0%) |
| Total | 598 (93.0%) | 45 (7.0%) |
Housing Structures by Number of Rooms in Sea Ranch
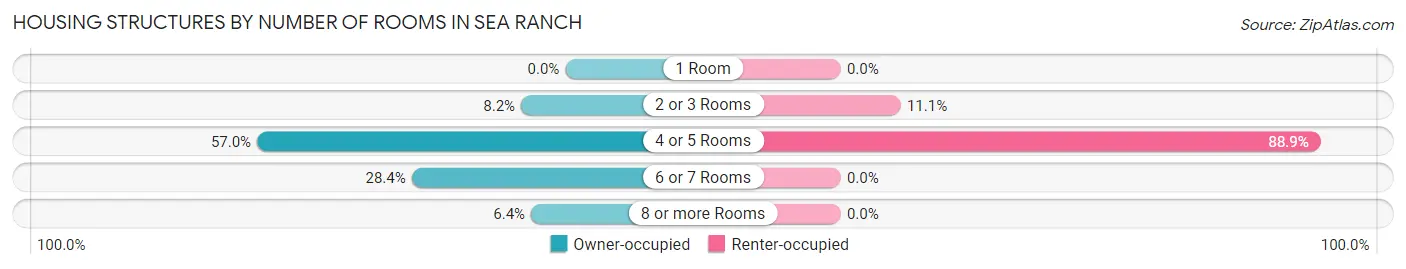
| Number of Rooms | Owner-occupied | Renter-occupied |
| 1 Room | 0 (0.0%) | 0 (0.0%) |
| 2 or 3 Rooms | 49 (8.2%) | 5 (11.1%) |
| 4 or 5 Rooms | 341 (57.0%) | 40 (88.9%) |
| 6 or 7 Rooms | 170 (28.4%) | 0 (0.0%) |
| 8 or more Rooms | 38 (6.4%) | 0 (0.0%) |
| Total | 598 (100.0%) | 45 (100.0%) |
Housing Structure by Heating Type in Sea Ranch
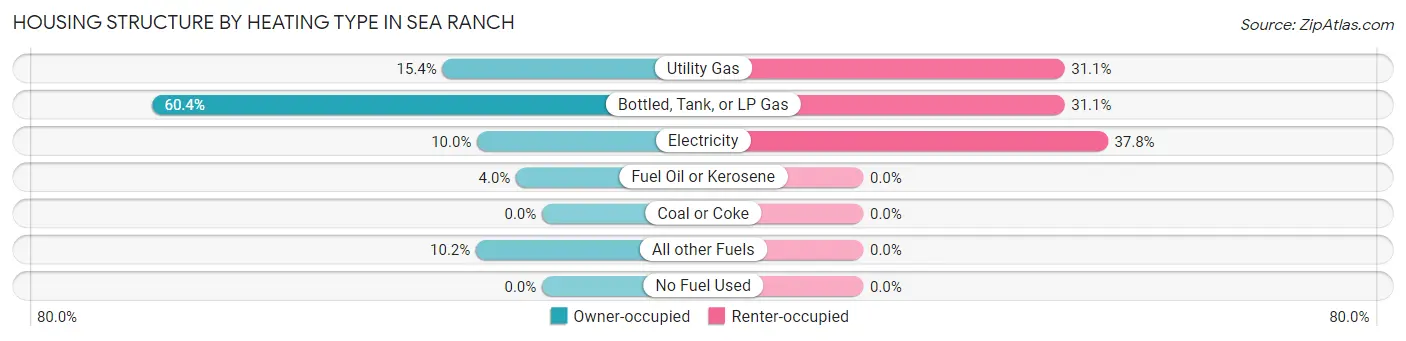
| Heating Type | Owner-occupied | Renter-occupied |
| Utility Gas | 92 (15.4%) | 14 (31.1%) |
| Bottled, Tank, or LP Gas | 361 (60.4%) | 14 (31.1%) |
| Electricity | 60 (10.0%) | 17 (37.8%) |
| Fuel Oil or Kerosene | 24 (4.0%) | 0 (0.0%) |
| Coal or Coke | 0 (0.0%) | 0 (0.0%) |
| All other Fuels | 61 (10.2%) | 0 (0.0%) |
| No Fuel Used | 0 (0.0%) | 0 (0.0%) |
| Total | 598 (100.0%) | 45 (100.0%) |
Household Vehicle Usage in Sea Ranch
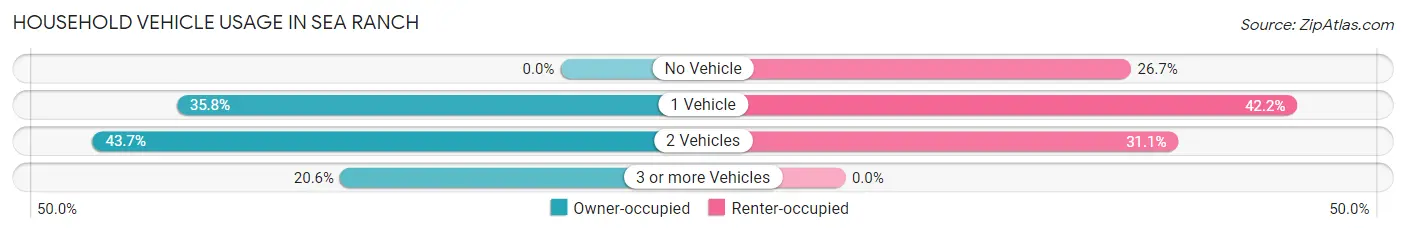
| Vehicles per Household | Owner-occupied | Renter-occupied |
| No Vehicle | 0 (0.0%) | 12 (26.7%) |
| 1 Vehicle | 214 (35.8%) | 19 (42.2%) |
| 2 Vehicles | 261 (43.6%) | 14 (31.1%) |
| 3 or more Vehicles | 123 (20.6%) | 0 (0.0%) |
| Total | 598 (100.0%) | 45 (100.0%) |
Real Estate & Mortgages in Sea Ranch
Real Estate and Mortgage Overview in Sea Ranch
| Characteristic | Without Mortgage | With Mortgage |
| Housing Units | 337 | 261 |
| Median Property Value | $986,500 | $1,283,800 |
| Median Household Income | $81,875 | $117 |
| Monthly Housing Costs | $1,074 | $180 |
| Real Estate Taxes | $5,932 | $0 |
Property Value by Mortgage Status in Sea Ranch
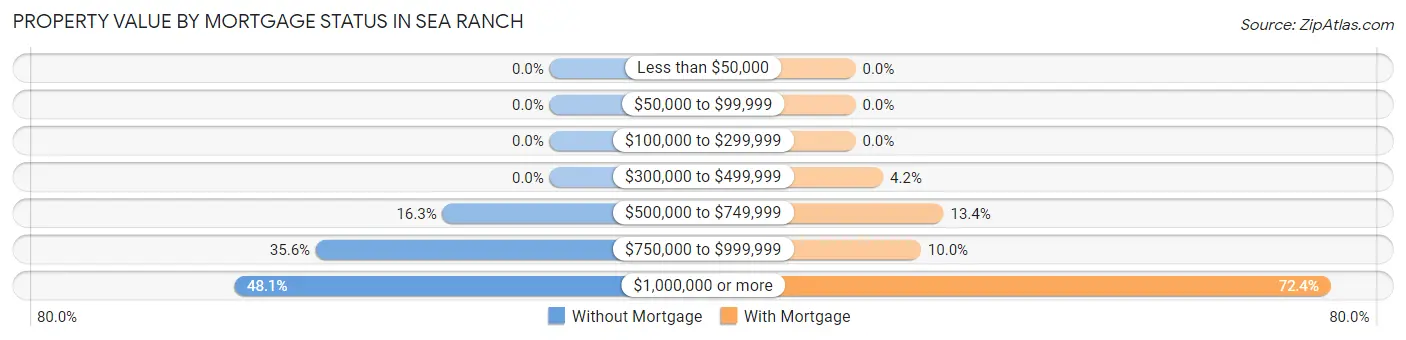
| Property Value | Without Mortgage | With Mortgage |
| Less than $50,000 | 0 (0.0%) | 0 (0.0%) |
| $50,000 to $99,999 | 0 (0.0%) | 0 (0.0%) |
| $100,000 to $299,999 | 0 (0.0%) | 0 (0.0%) |
| $300,000 to $499,999 | 0 (0.0%) | 11 (4.2%) |
| $500,000 to $749,999 | 55 (16.3%) | 35 (13.4%) |
| $750,000 to $999,999 | 120 (35.6%) | 26 (10.0%) |
| $1,000,000 or more | 162 (48.1%) | 189 (72.4%) |
| Total | 337 (100.0%) | 261 (100.0%) |
Household Income by Mortgage Status in Sea Ranch
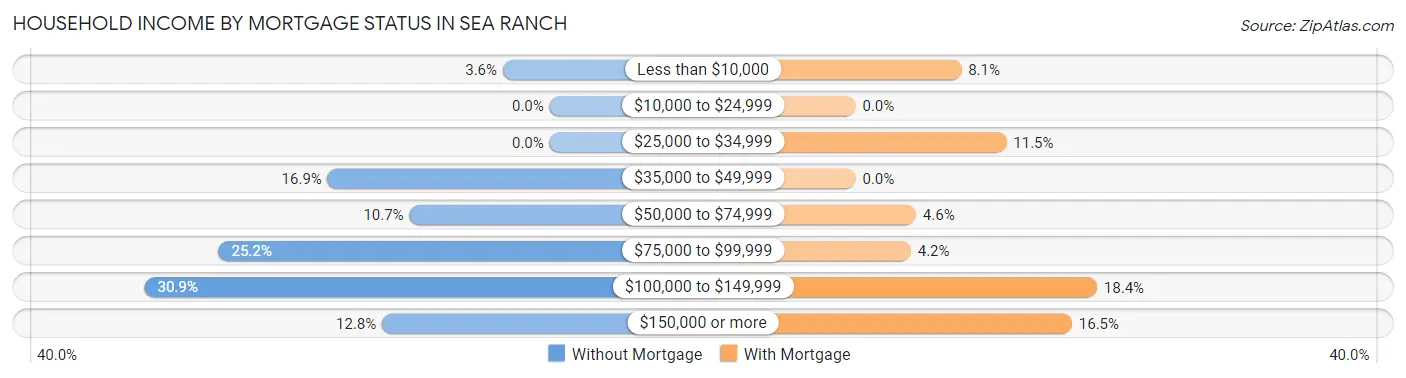
| Household Income | Without Mortgage | With Mortgage |
| Less than $10,000 | 12 (3.6%) | 21 (8.1%) |
| $10,000 to $24,999 | 0 (0.0%) | 0 (0.0%) |
| $25,000 to $34,999 | 0 (0.0%) | 30 (11.5%) |
| $35,000 to $49,999 | 57 (16.9%) | 0 (0.0%) |
| $50,000 to $74,999 | 36 (10.7%) | 12 (4.6%) |
| $75,000 to $99,999 | 85 (25.2%) | 11 (4.2%) |
| $100,000 to $149,999 | 104 (30.9%) | 48 (18.4%) |
| $150,000 or more | 43 (12.8%) | 43 (16.5%) |
| Total | 337 (100.0%) | 261 (100.0%) |
Property Value to Household Income Ratio in Sea Ranch
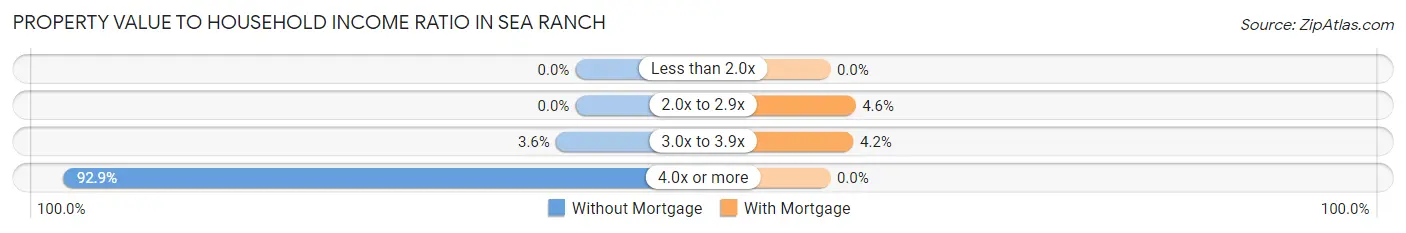
| Value-to-Income Ratio | Without Mortgage | With Mortgage |
| Less than 2.0x | 0 (0.0%) | 0 (0.0%) |
| 2.0x to 2.9x | 0 (0.0%) | 12 (4.6%) |
| 3.0x to 3.9x | 12 (3.6%) | 11 (4.2%) |
| 4.0x or more | 313 (92.9%) | 0 (0.0%) |
| Total | 337 (100.0%) | 261 (100.0%) |
Real Estate Taxes by Mortgage Status in Sea Ranch
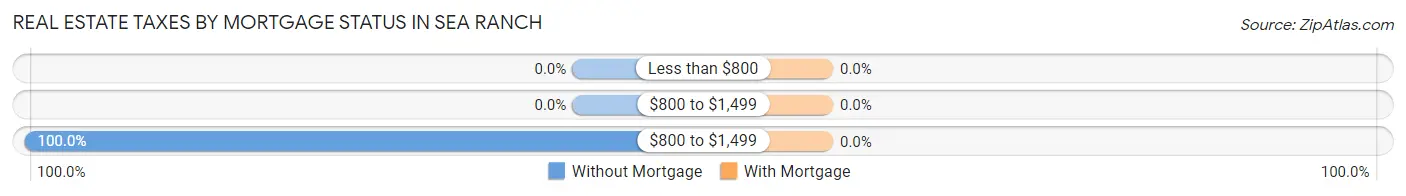
| Property Taxes | Without Mortgage | With Mortgage |
| Less than $800 | 0 (0.0%) | 0 (0.0%) |
| $800 to $1,499 | 0 (0.0%) | 0 (0.0%) |
| $800 to $1,499 | 337 (100.0%) | 0 (0.0%) |
| Total | 337 (100.0%) | 261 (100.0%) |
Health & Disability in Sea Ranch
Health Insurance Coverage by Age in Sea Ranch
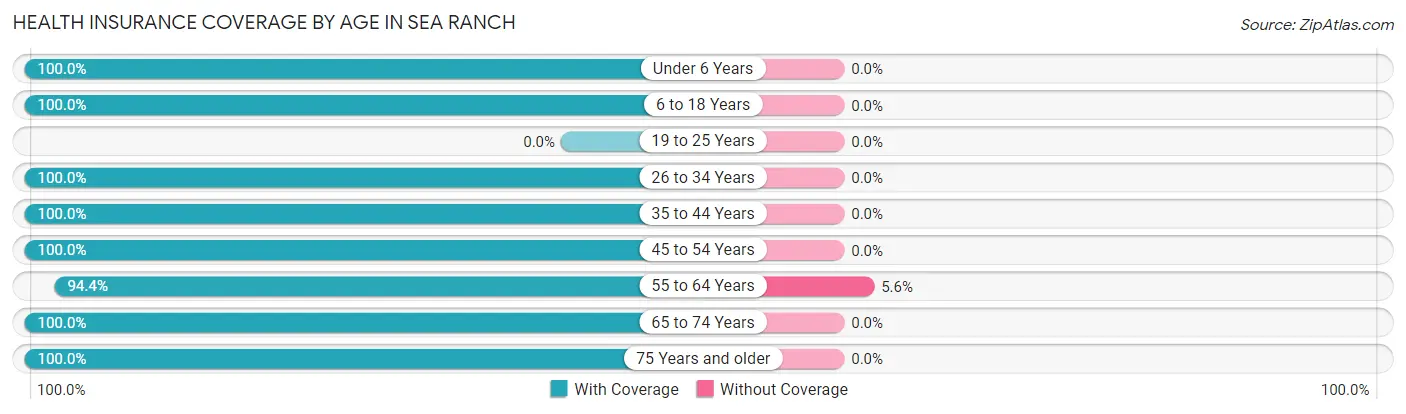
| Age Bracket | With Coverage | Without Coverage |
| Under 6 Years | 16 (100.0%) | 0 (0.0%) |
| 6 to 18 Years | 56 (100.0%) | 0 (0.0%) |
| 19 to 25 Years | 0 (0.0%) | 0 (0.0%) |
| 26 to 34 Years | 38 (100.0%) | 0 (0.0%) |
| 35 to 44 Years | 51 (100.0%) | 0 (0.0%) |
| 45 to 54 Years | 38 (100.0%) | 0 (0.0%) |
| 55 to 64 Years | 237 (94.4%) | 14 (5.6%) |
| 65 to 74 Years | 466 (100.0%) | 0 (0.0%) |
| 75 Years and older | 308 (100.0%) | 0 (0.0%) |
| Total | 1,210 (98.9%) | 14 (1.1%) |
Health Insurance Coverage by Citizenship Status in Sea Ranch
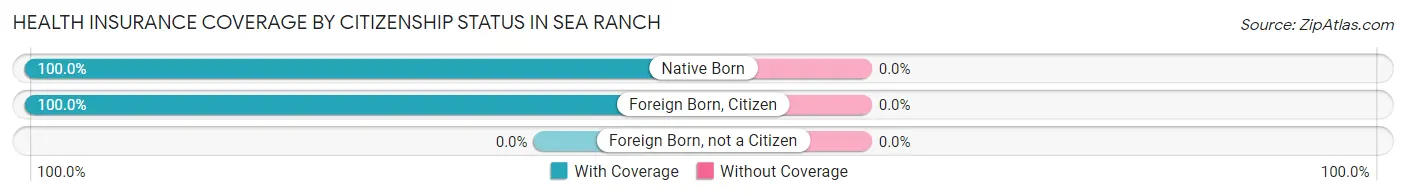
| Citizenship Status | With Coverage | Without Coverage |
| Native Born | 16 (100.0%) | 0 (0.0%) |
| Foreign Born, Citizen | 56 (100.0%) | 0 (0.0%) |
| Foreign Born, not a Citizen | 0 (0.0%) | 0 (0.0%) |
Health Insurance Coverage by Household Income in Sea Ranch
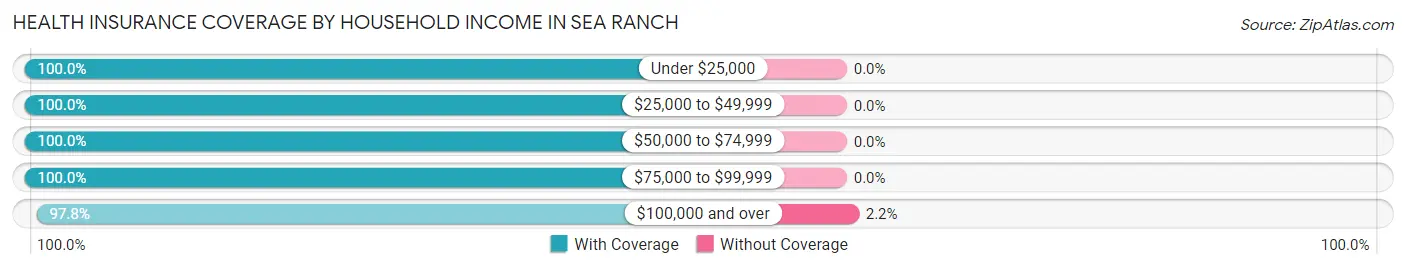
| Household Income | With Coverage | Without Coverage |
| Under $25,000 | 134 (100.0%) | 0 (0.0%) |
| $25,000 to $49,999 | 112 (100.0%) | 0 (0.0%) |
| $50,000 to $74,999 | 57 (100.0%) | 0 (0.0%) |
| $75,000 to $99,999 | 297 (100.0%) | 0 (0.0%) |
| $100,000 and over | 610 (97.8%) | 14 (2.2%) |
Public vs Private Health Insurance Coverage by Age in Sea Ranch
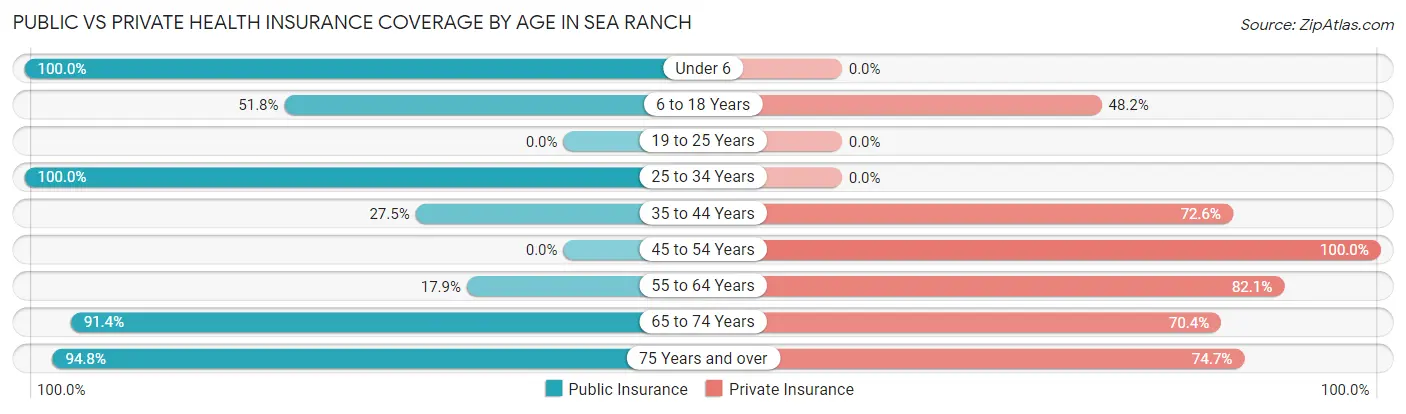
| Age Bracket | Public Insurance | Private Insurance |
| Under 6 | 16 (100.0%) | 0 (0.0%) |
| 6 to 18 Years | 29 (51.8%) | 27 (48.2%) |
| 19 to 25 Years | 0 (0.0%) | 0 (0.0%) |
| 25 to 34 Years | 38 (100.0%) | 0 (0.0%) |
| 35 to 44 Years | 14 (27.5%) | 37 (72.6%) |
| 45 to 54 Years | 0 (0.0%) | 38 (100.0%) |
| 55 to 64 Years | 45 (17.9%) | 206 (82.1%) |
| 65 to 74 Years | 426 (91.4%) | 328 (70.4%) |
| 75 Years and over | 292 (94.8%) | 230 (74.7%) |
| Total | 860 (70.3%) | 866 (70.8%) |
Disability Status by Sex by Age in Sea Ranch
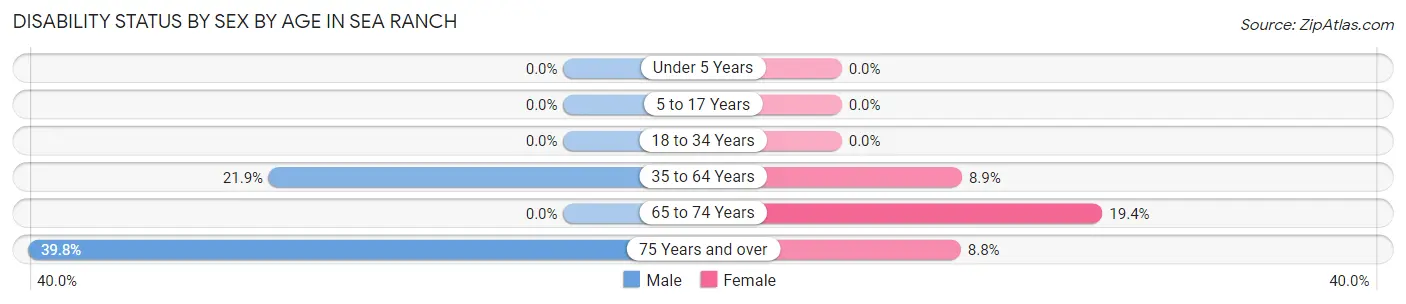
| Age Bracket | Male | Female |
| Under 5 Years | 0 (0.0%) | 0 (0.0%) |
| 5 to 17 Years | 0 (0.0%) | 0 (0.0%) |
| 18 to 34 Years | 0 (0.0%) | 0 (0.0%) |
| 35 to 64 Years | 40 (21.9%) | 14 (8.9%) |
| 65 to 74 Years | 0 (0.0%) | 48 (19.4%) |
| 75 Years and over | 64 (39.8%) | 13 (8.8%) |
Disability Class by Sex by Age in Sea Ranch
Disability Class: Hearing Difficulty
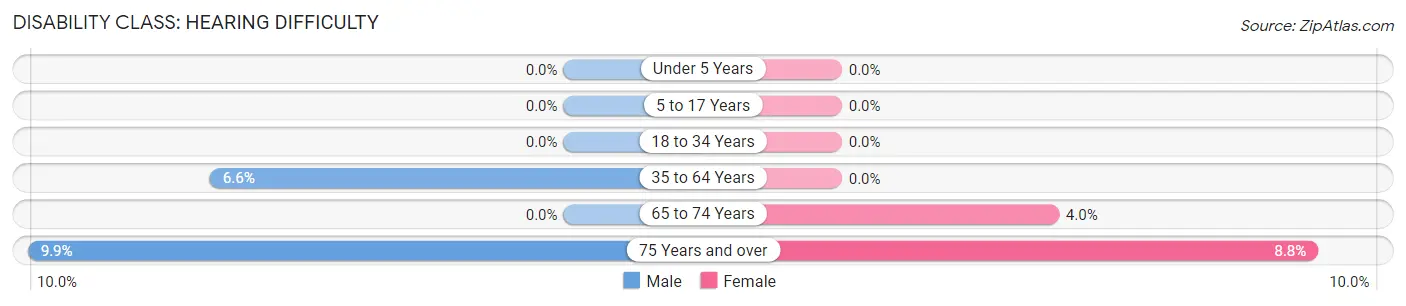
| Age Bracket | Male | Female |
| Under 5 Years | 0 (0.0%) | 0 (0.0%) |
| 5 to 17 Years | 0 (0.0%) | 0 (0.0%) |
| 18 to 34 Years | 0 (0.0%) | 0 (0.0%) |
| 35 to 64 Years | 12 (6.6%) | 0 (0.0%) |
| 65 to 74 Years | 0 (0.0%) | 10 (4.0%) |
| 75 Years and over | 16 (9.9%) | 13 (8.8%) |
Disability Class: Vision Difficulty
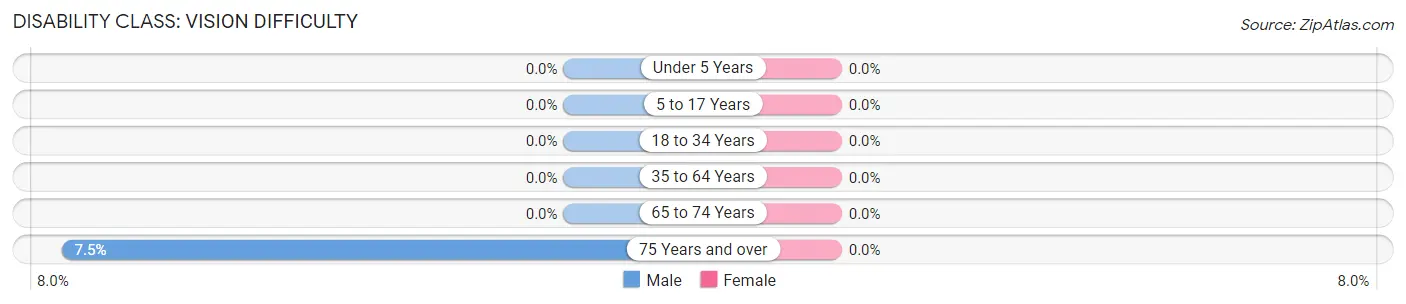
| Age Bracket | Male | Female |
| Under 5 Years | 0 (0.0%) | 0 (0.0%) |
| 5 to 17 Years | 0 (0.0%) | 0 (0.0%) |
| 18 to 34 Years | 0 (0.0%) | 0 (0.0%) |
| 35 to 64 Years | 0 (0.0%) | 0 (0.0%) |
| 65 to 74 Years | 0 (0.0%) | 0 (0.0%) |
| 75 Years and over | 12 (7.4%) | 0 (0.0%) |
Disability Class: Cognitive Difficulty
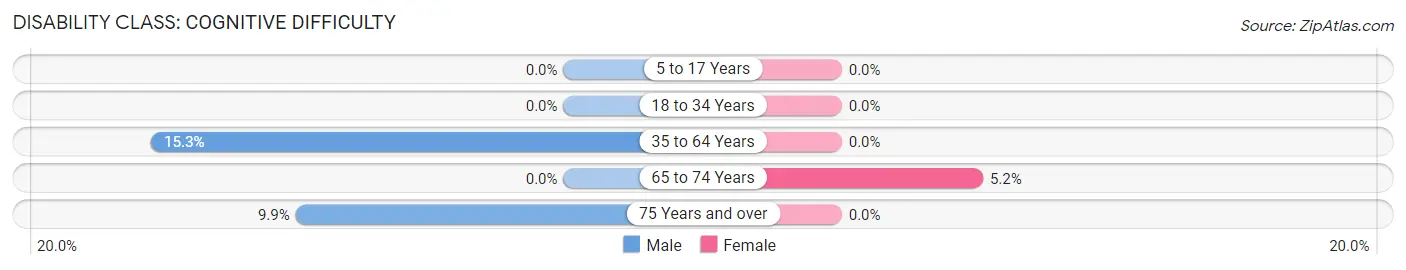
| Age Bracket | Male | Female |
| 5 to 17 Years | 0 (0.0%) | 0 (0.0%) |
| 18 to 34 Years | 0 (0.0%) | 0 (0.0%) |
| 35 to 64 Years | 28 (15.3%) | 0 (0.0%) |
| 65 to 74 Years | 0 (0.0%) | 13 (5.2%) |
| 75 Years and over | 16 (9.9%) | 0 (0.0%) |
Disability Class: Ambulatory Difficulty
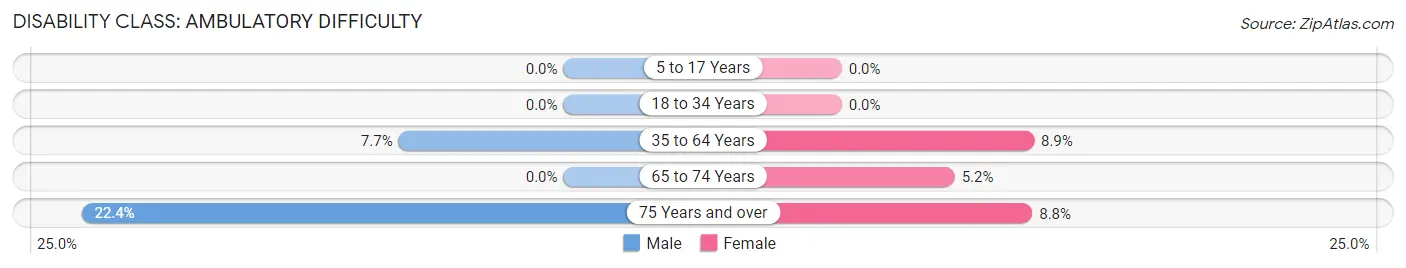
| Age Bracket | Male | Female |
| 5 to 17 Years | 0 (0.0%) | 0 (0.0%) |
| 18 to 34 Years | 0 (0.0%) | 0 (0.0%) |
| 35 to 64 Years | 14 (7.6%) | 14 (8.9%) |
| 65 to 74 Years | 0 (0.0%) | 13 (5.2%) |
| 75 Years and over | 36 (22.4%) | 13 (8.8%) |
Disability Class: Self-Care Difficulty
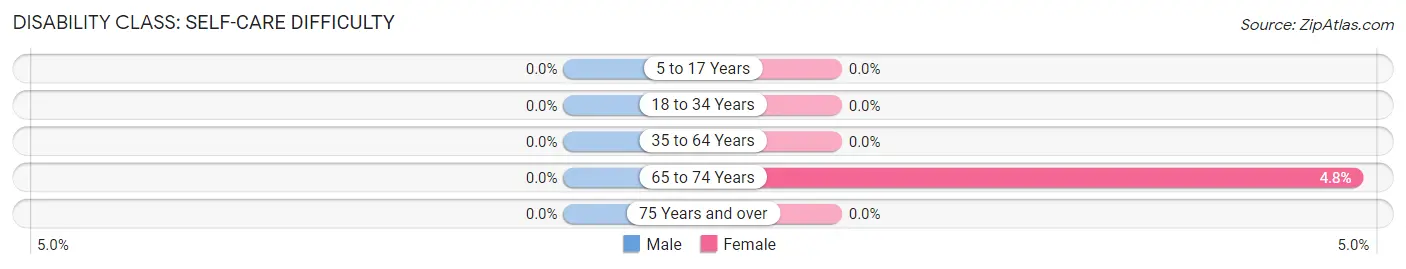
| Age Bracket | Male | Female |
| 5 to 17 Years | 0 (0.0%) | 0 (0.0%) |
| 18 to 34 Years | 0 (0.0%) | 0 (0.0%) |
| 35 to 64 Years | 0 (0.0%) | 0 (0.0%) |
| 65 to 74 Years | 0 (0.0%) | 12 (4.8%) |
| 75 Years and over | 0 (0.0%) | 0 (0.0%) |
Technology Access in Sea Ranch
Computing Device Access in Sea Ranch
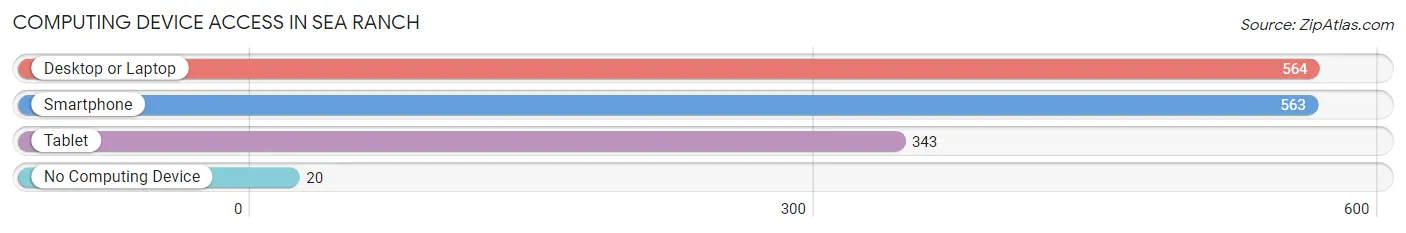
| Device Type | # Households | % Households |
| Desktop or Laptop | 564 | 87.7% |
| Smartphone | 563 | 87.6% |
| Tablet | 343 | 53.3% |
| No Computing Device | 20 | 3.1% |
| Total | 643 | 100.0% |
Internet Access in Sea Ranch
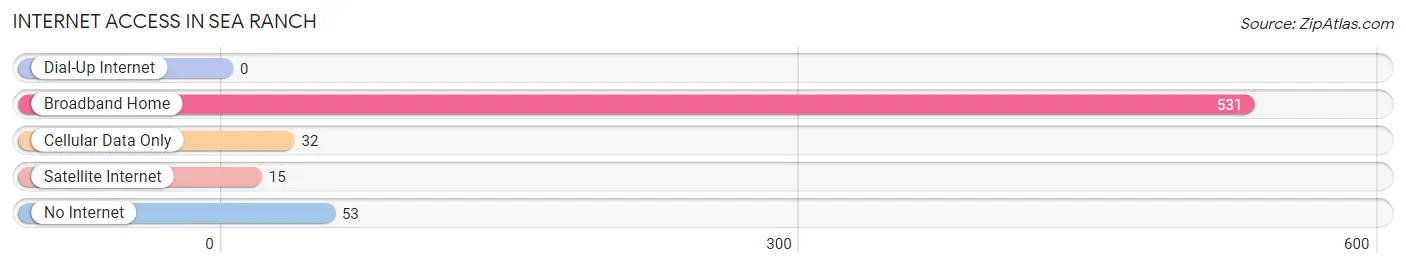
| Internet Type | # Households | % Households |
| Dial-Up Internet | 0 | 0.0% |
| Broadband Home | 531 | 82.6% |
| Cellular Data Only | 32 | 5.0% |
| Satellite Internet | 15 | 2.3% |
| No Internet | 53 | 8.2% |
| Total | 643 | 100.0% |
Sea Ranch Summary
History
The Sea Ranch is a planned community located along the Sonoma County coast in Northern California. It was developed in the 1960s by architect and developer Al Boeke, who envisioned a community that would be in harmony with the natural environment. The Sea Ranch was the first large-scale planned community in the United States to be designed with an emphasis on environmental conservation.
The Sea Ranch was originally part of the Rancho Bodega Mexican land grant, which was granted to Captain Stephen Smith in 1836. In the late 19th century, the land was used for sheep and cattle ranching. In the 1950s, the land was purchased by the Sea Ranch Corporation, which was owned by Al Boeke. Boeke had a vision of creating a community that would be in harmony with the natural environment. He hired landscape architect Lawrence Halprin to design the community, and the first homes were built in 1964.
The Sea Ranch was designed to be a low-density, low-impact community. The homes were designed to blend in with the natural environment, and the community was designed to be self-sustaining. The Sea Ranch was also designed to be a pedestrian-friendly community, with walking paths and bike trails connecting the homes.
Geography
The Sea Ranch is located along the Sonoma County coast in Northern California. It is situated between the towns of Gualala and Bodega Bay, and is approximately 90 miles north of San Francisco. The Sea Ranch is located on a 10-mile stretch of coastline, and is bordered by the Pacific Ocean to the west and the Gualala River to the east. The Sea Ranch is located in a temperate climate, with mild winters and warm summers.
The Sea Ranch is composed of 10,000 acres of land, with approximately 5,000 acres of open space. The terrain is mostly rolling hills, with some areas of flat land. The area is home to a variety of wildlife, including deer, foxes, coyotes, and a variety of birds.
Economy
The Sea Ranch is primarily a residential community, and the majority of the population is employed in the service sector. The community is home to a variety of businesses, including restaurants, retail stores, and art galleries. The Sea Ranch is also home to a number of vacation rental properties, which attract visitors from around the world.
The Sea Ranch is also home to a number of wineries, which produce a variety of wines. The area is also home to a number of organic farms, which produce a variety of fruits and vegetables.
Demographics
As of the 2010 census, the population of the Sea Ranch was 1,305. The population is primarily white (90.2%), with a small percentage of Hispanic (3.2%) and Asian (2.2%) residents. The median household income is $90,000, and the median home value is $735,000. The Sea Ranch is a popular destination for retirees, and the median age of the population is 62.
Common Questions
What is Per Capita Income in Sea Ranch?
Per Capita income in Sea Ranch is $70,214.
What is the Median Family Income in Sea Ranch?
Median Family Income in Sea Ranch is $120,000.
What is the Median Household income in Sea Ranch?
Median Household Income in Sea Ranch is $92,260.
What is Income or Wage Gap in Sea Ranch?
Income or Wage Gap in Sea Ranch is 50.5%.
Women in Sea Ranch earn 49.5 cents for every dollar earned by a man.
What is Inequality or Gini Index in Sea Ranch?
Inequality or Gini Index in Sea Ranch is 0.42.
What is the Total Population of Sea Ranch?
Total Population of Sea Ranch is 1,224.
What is the Total Male Population of Sea Ranch?
Total Male Population of Sea Ranch is 629.
What is the Total Female Population of Sea Ranch?
Total Female Population of Sea Ranch is 595.
What is the Ratio of Males per 100 Females in Sea Ranch?
There are 105.71 Males per 100 Females in Sea Ranch.
What is the Ratio of Females per 100 Males in Sea Ranch?
There are 94.59 Females per 100 Males in Sea Ranch.
What is the Median Population Age in Sea Ranch?
Median Population Age in Sea Ranch is 67.9 Years.
What is the Average Family Size in Sea Ranch
Average Family Size in Sea Ranch is 2.2 People.
What is the Average Household Size in Sea Ranch
Average Household Size in Sea Ranch is 1.9 People.
How Large is the Labor Force in Sea Ranch?
There are 380 People in the Labor Forcein in Sea Ranch.
What is the Percentage of People in the Labor Force in Sea Ranch?
33.0% of People are in the Labor Force in Sea Ranch.
What is the Unemployment Rate in Sea Ranch?
Unemployment Rate in Sea Ranch is 3.7%.