Kenwood, CA Map & Demographics
Kenwood Map
Kenwood Overview
$83,268
PER CAPITA INCOME
$198,083
AVG FAMILY INCOME
$122,292
AVG HOUSEHOLD INCOME
0.42
INEQUALITY / GINI INDEX
609
TOTAL POPULATION
205
MALE POPULATION
404
FEMALE POPULATION
50.74
MALES / 100 FEMALES
197.07
FEMALES / 100 MALES
56.3
MEDIAN AGE
2.0
AVG FAMILY SIZE
1.6
AVG HOUSEHOLD SIZE
361
LABOR FORCE [ PEOPLE ]
63.3%
PERCENT IN LABOR FORCE
Kenwood Zip Codes
Kenwood Area Codes
Income in Kenwood
Income Overview in Kenwood
Per Capita Income in Kenwood is $83,268, while median incomes of families and households are $198,083 and $122,292 respectively.
| Characteristic | Number | Measure |
| Per Capita Income | 609 | $83,268 |
| Median Family Income | 171 | $198,083 |
| Mean Family Income | 171 | $199,221 |
| Median Household Income | 373 | $122,292 |
| Mean Household Income | 373 | $139,435 |
| Income Deficit | 171 | $0 |
| Wage / Income Gap (%) | 609 | 0.00% |
| Wage / Income Gap ($) | 609 | 100.00¢ per $1 |
| Gini / Inequality Index | 609 | 0.42 |
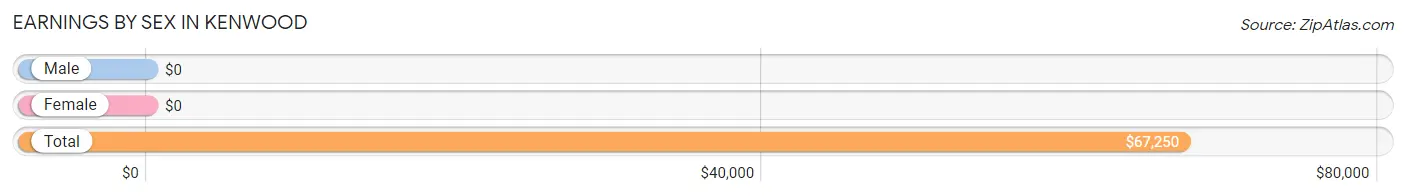
Earnings by Sex in Kenwood
| Sex | Number | Average Earnings |
| Male | 134 (35.7%) | $0 |
| Female | 241 (64.3%) | $0 |
| Total | 375 (100.0%) | $67,250 |
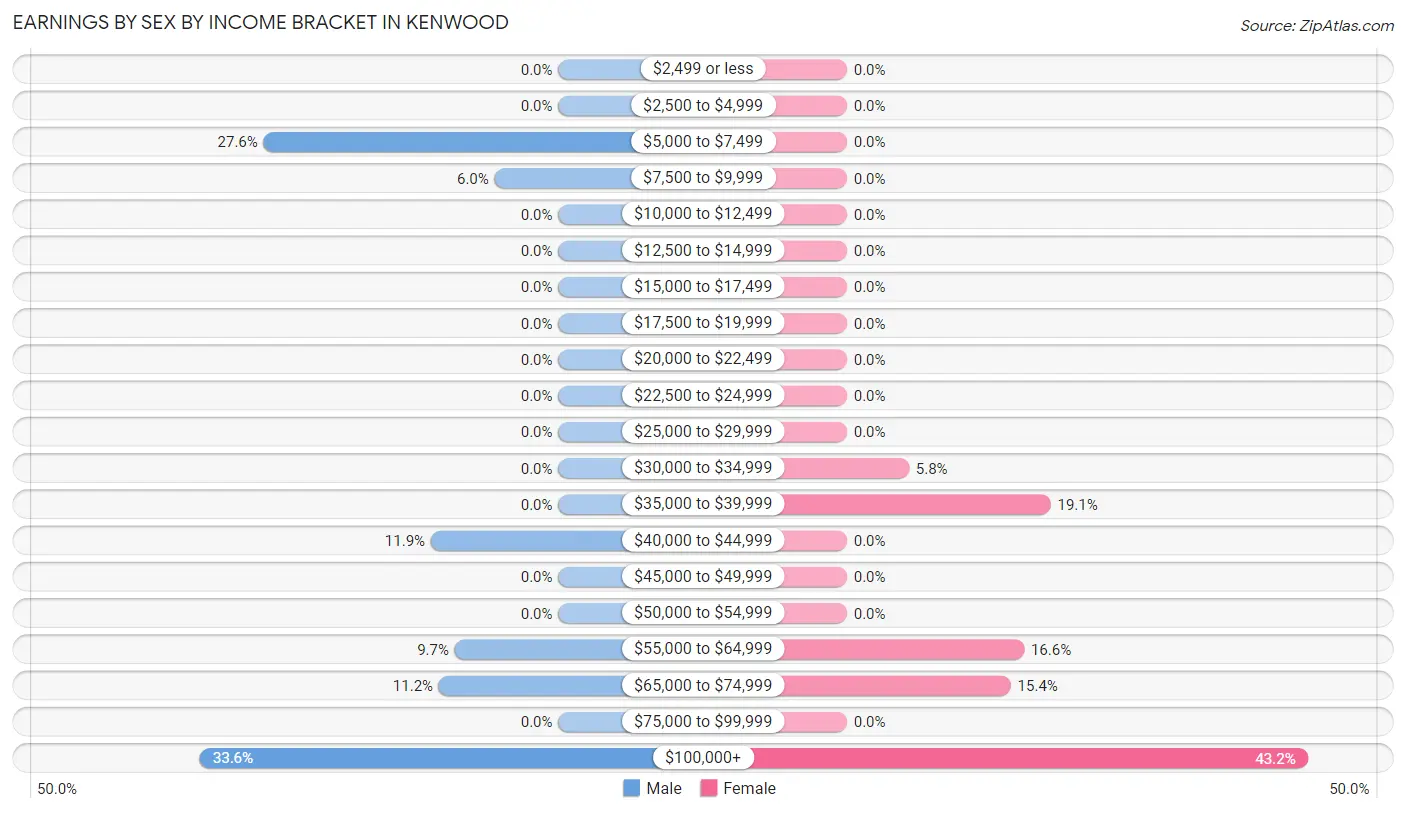
Earnings by Sex by Income Bracket in Kenwood
The most common earnings brackets in Kenwood are $100,000+ for men (45 | 33.6%) and $100,000+ for women (104 | 43.1%).
| Income | Male | Female |
| $2,499 or less | 0 (0.0%) | 0 (0.0%) |
| $2,500 to $4,999 | 0 (0.0%) | 0 (0.0%) |
| $5,000 to $7,499 | 37 (27.6%) | 0 (0.0%) |
| $7,500 to $9,999 | 8 (6.0%) | 0 (0.0%) |
| $10,000 to $12,499 | 0 (0.0%) | 0 (0.0%) |
| $12,500 to $14,999 | 0 (0.0%) | 0 (0.0%) |
| $15,000 to $17,499 | 0 (0.0%) | 0 (0.0%) |
| $17,500 to $19,999 | 0 (0.0%) | 0 (0.0%) |
| $20,000 to $22,499 | 0 (0.0%) | 0 (0.0%) |
| $22,500 to $24,999 | 0 (0.0%) | 0 (0.0%) |
| $25,000 to $29,999 | 0 (0.0%) | 0 (0.0%) |
| $30,000 to $34,999 | 0 (0.0%) | 14 (5.8%) |
| $35,000 to $39,999 | 0 (0.0%) | 46 (19.1%) |
| $40,000 to $44,999 | 16 (11.9%) | 0 (0.0%) |
| $45,000 to $49,999 | 0 (0.0%) | 0 (0.0%) |
| $50,000 to $54,999 | 0 (0.0%) | 0 (0.0%) |
| $55,000 to $64,999 | 13 (9.7%) | 40 (16.6%) |
| $65,000 to $74,999 | 15 (11.2%) | 37 (15.3%) |
| $75,000 to $99,999 | 0 (0.0%) | 0 (0.0%) |
| $100,000+ | 45 (33.6%) | 104 (43.1%) |
| Total | 134 (100.0%) | 241 (100.0%) |
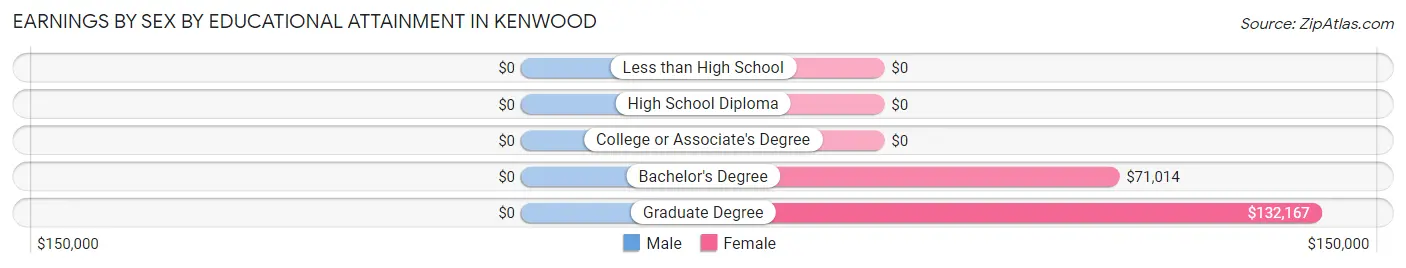
Earnings by Sex by Educational Attainment in Kenwood
| Educational Attainment | Male Income | Female Income |
| Less than High School | - | - |
| High School Diploma | - | - |
| College or Associate's Degree | - | - |
| Bachelor's Degree | - | - |
| Graduate Degree | - | - |
| Total | $64,423 | $0 |
Family Income in Kenwood
Family Income Brackets in Kenwood
According to the Kenwood family income data, there are 74 families falling into the $200,000+ income range, which is the most common income bracket and makes up 43.3% of all families.
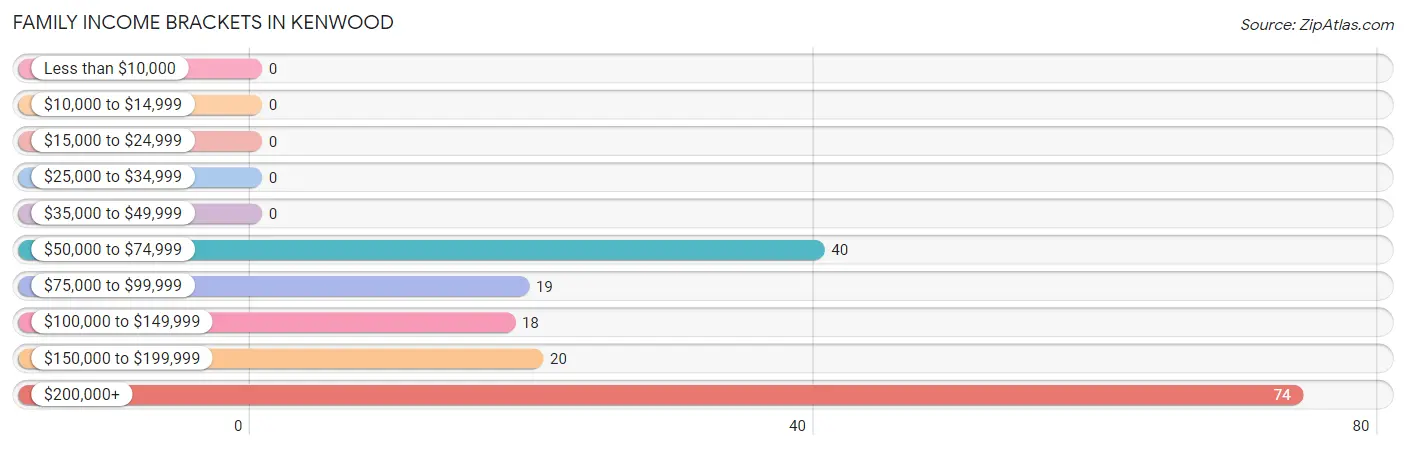
| Income Bracket | # Families | % Families |
| Less than $10,000 | 0 | 0.0% |
| $10,000 to $14,999 | 0 | 0.0% |
| $15,000 to $24,999 | 0 | 0.0% |
| $25,000 to $34,999 | 0 | 0.0% |
| $35,000 to $49,999 | 0 | 0.0% |
| $50,000 to $74,999 | 40 | 23.4% |
| $75,000 to $99,999 | 19 | 11.1% |
| $100,000 to $149,999 | 18 | 10.5% |
| $150,000 to $199,999 | 20 | 11.7% |
| $200,000+ | 74 | 43.3% |
Family Income by Famaliy Size in Kenwood
2-person families (171 | 100.0%) account for the highest median family income in Kenwood with $198,083 per family, while 2-person families (171 | 100.0%) have the highest median income of $99,042 per family member.
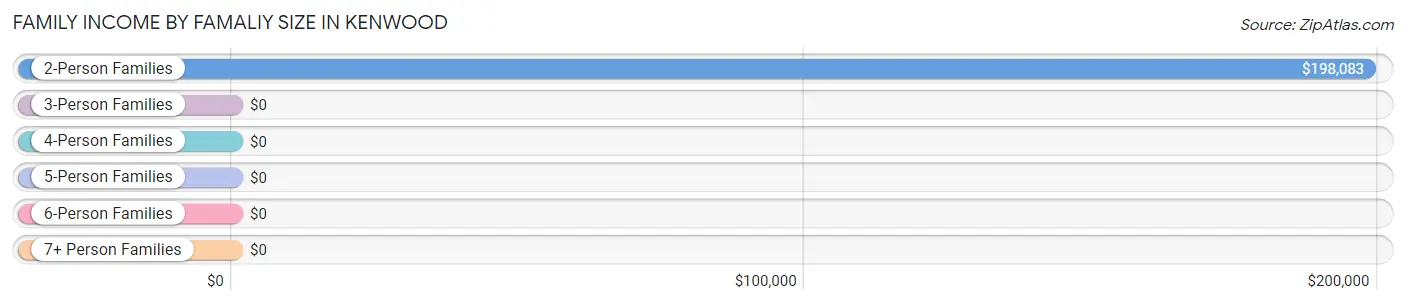
| Income Bracket | # Families | Median Income |
| 2-Person Families | 171 (100.0%) | $198,083 |
| 3-Person Families | 0 (0.0%) | $0 |
| 4-Person Families | 0 (0.0%) | $0 |
| 5-Person Families | 0 (0.0%) | $0 |
| 6-Person Families | 0 (0.0%) | $0 |
| 7+ Person Families | 0 (0.0%) | $0 |
| Total | 171 (100.0%) | $198,083 |
Family Income by Number of Earners in Kenwood
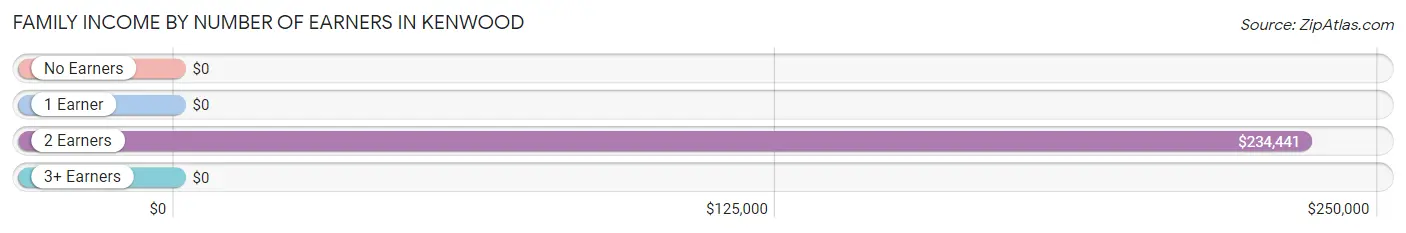
| Number of Earners | # Families | Median Income |
| No Earners | 12 (7.0%) | $0 |
| 1 Earner | 70 (40.9%) | $0 |
| 2 Earners | 89 (52.0%) | $234,441 |
| 3+ Earners | 0 (0.0%) | $0 |
| Total | 171 (100.0%) | $198,083 |
Household Income in Kenwood
Household Income Brackets in Kenwood
With 139 households falling in the category, the $100,000 to $149,999 income range is the most frequent in Kenwood, accounting for 37.3% of all households.
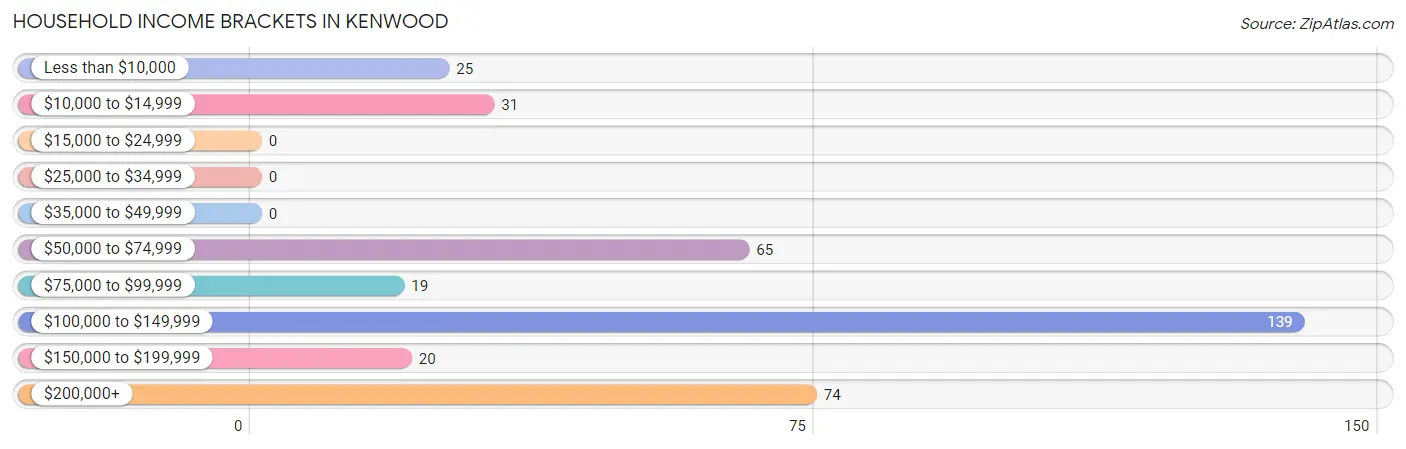
| Income Bracket | # Households | % Households |
| Less than $10,000 | 25 | 6.7% |
| $10,000 to $14,999 | 31 | 8.3% |
| $15,000 to $24,999 | 0 | 0.0% |
| $25,000 to $34,999 | 0 | 0.0% |
| $35,000 to $49,999 | 0 | 0.0% |
| $50,000 to $74,999 | 65 | 17.4% |
| $75,000 to $99,999 | 19 | 5.1% |
| $100,000 to $149,999 | 139 | 37.3% |
| $150,000 to $199,999 | 20 | 5.4% |
| $200,000+ | 74 | 19.8% |
Household Income by Householder Age in Kenwood
The median household income in Kenwood is $122,292, with the highest median household income of $125,117 found in the 45 to 64 years age bracket for the primary householder. A total of 163 households (43.7%) fall into this category.
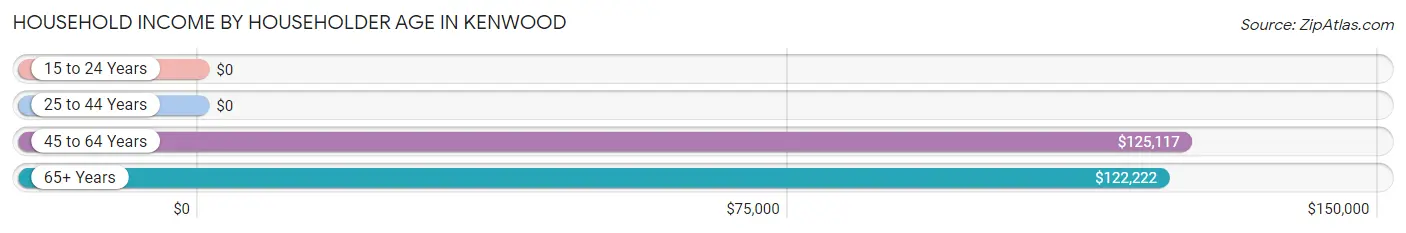
| Income Bracket | # Households | Median Income |
| 15 to 24 Years | 0 (0.0%) | $0 |
| 25 to 44 Years | 78 (20.9%) | $0 |
| 45 to 64 Years | 163 (43.7%) | $125,117 |
| 65+ Years | 132 (35.4%) | $122,222 |
| Total | 373 (100.0%) | $122,292 |
Poverty in Kenwood
Income Below Poverty by Sex and Age in Kenwood
With 11.7% poverty level for males and 9.9% for females among the residents of Kenwood, 16 and 17 year old males and 65 to 74 year old females are the most vulnerable to poverty, with 8 males (100.0%) and 31 females (33.7%) in their respective age groups living below the poverty level.
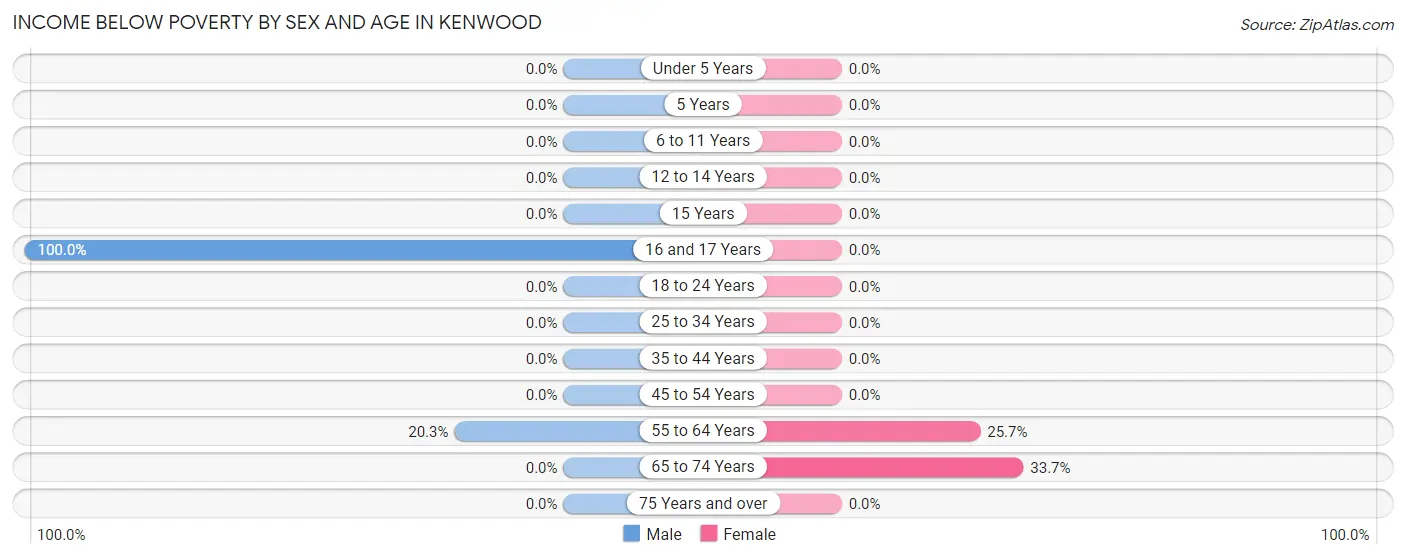
| Age Bracket | Male | Female |
| Under 5 Years | 0 (0.0%) | 0 (0.0%) |
| 5 Years | 0 (0.0%) | 0 (0.0%) |
| 6 to 11 Years | 0 (0.0%) | 0 (0.0%) |
| 12 to 14 Years | 0 (0.0%) | 0 (0.0%) |
| 15 Years | 0 (0.0%) | 0 (0.0%) |
| 16 and 17 Years | 8 (100.0%) | 0 (0.0%) |
| 18 to 24 Years | 0 (0.0%) | 0 (0.0%) |
| 25 to 34 Years | 0 (0.0%) | 0 (0.0%) |
| 35 to 44 Years | 0 (0.0%) | 0 (0.0%) |
| 45 to 54 Years | 0 (0.0%) | 0 (0.0%) |
| 55 to 64 Years | 16 (20.3%) | 9 (25.7%) |
| 65 to 74 Years | 0 (0.0%) | 31 (33.7%) |
| 75 Years and over | 0 (0.0%) | 0 (0.0%) |
| Total | 24 (11.7%) | 40 (9.9%) |
Income Above Poverty by Sex and Age in Kenwood
According to the poverty statistics in Kenwood, males aged 35 to 44 years and females aged 6 to 11 years are the age groups that are most secure financially, with 100.0% of males and 100.0% of females in these age groups living above the poverty line.
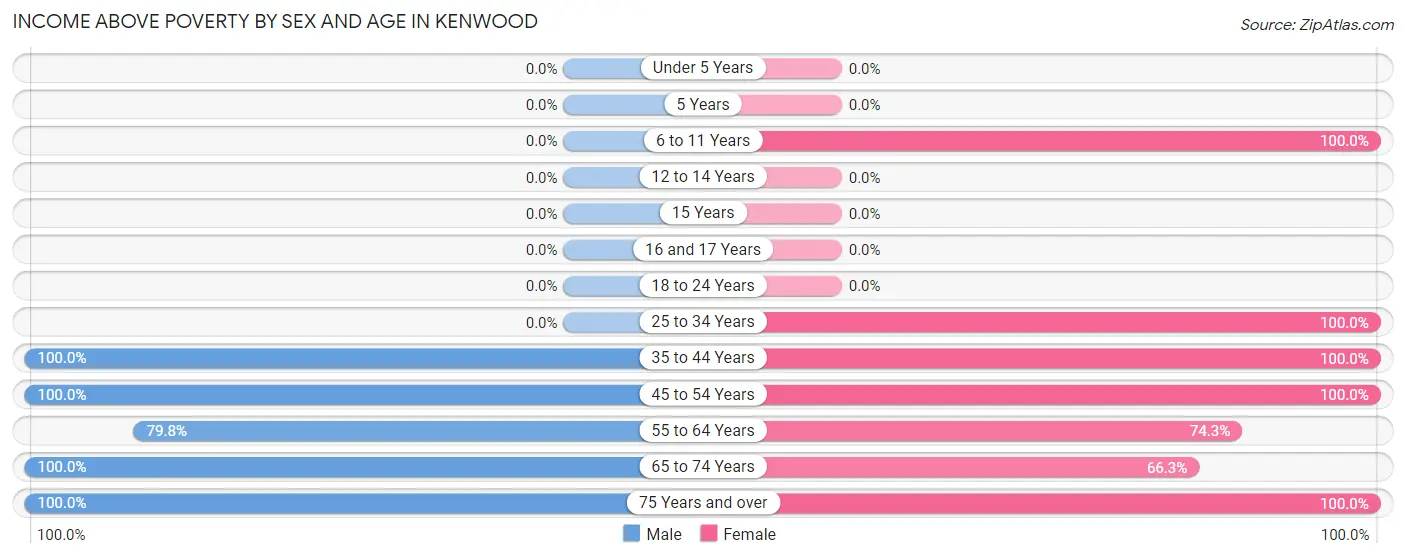
| Age Bracket | Male | Female |
| Under 5 Years | 0 (0.0%) | 0 (0.0%) |
| 5 Years | 0 (0.0%) | 0 (0.0%) |
| 6 to 11 Years | 0 (0.0%) | 39 (100.0%) |
| 12 to 14 Years | 0 (0.0%) | 0 (0.0%) |
| 15 Years | 0 (0.0%) | 0 (0.0%) |
| 16 and 17 Years | 0 (0.0%) | 0 (0.0%) |
| 18 to 24 Years | 0 (0.0%) | 0 (0.0%) |
| 25 to 34 Years | 0 (0.0%) | 59 (100.0%) |
| 35 to 44 Years | 7 (100.0%) | 75 (100.0%) |
| 45 to 54 Years | 28 (100.0%) | 66 (100.0%) |
| 55 to 64 Years | 63 (79.7%) | 26 (74.3%) |
| 65 to 74 Years | 18 (100.0%) | 61 (66.3%) |
| 75 Years and over | 65 (100.0%) | 38 (100.0%) |
| Total | 181 (88.3%) | 364 (90.1%) |
Income Below Poverty Among Married-Couple Families in Kenwood
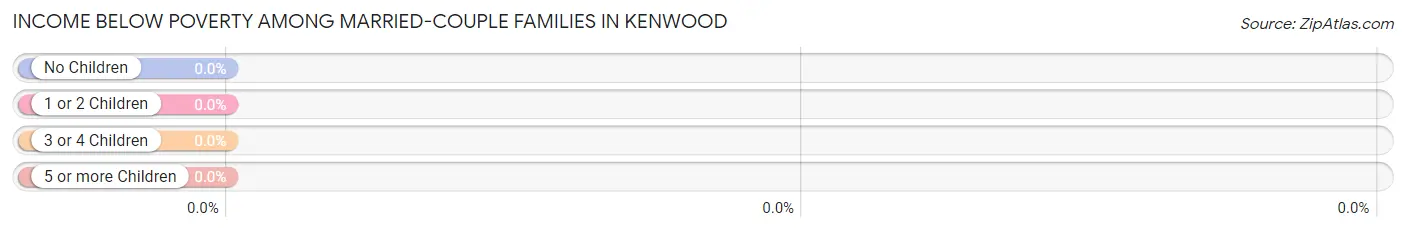
| Children | Above Poverty | Below Poverty |
| No Children | 131 (100.0%) | 0 (0.0%) |
| 1 or 2 Children | 0 (0.0%) | 0 (0.0%) |
| 3 or 4 Children | 0 (0.0%) | 0 (0.0%) |
| 5 or more Children | 0 (0.0%) | 0 (0.0%) |
| Total | 131 (100.0%) | 0 (0.0%) |
Income Below Poverty Among Single-Parent Households in Kenwood
| Children | Single Father | Single Mother |
| No Children | 0 (0.0%) | 0 (0.0%) |
| 1 or 2 Children | 0 (0.0%) | 0 (0.0%) |
| 3 or 4 Children | 0 (0.0%) | 0 (0.0%) |
| 5 or more Children | 0 (0.0%) | 0 (0.0%) |
| Total | 0 (0.0%) | 0 (0.0%) |
Income Below Poverty Among Married-Couple vs Single-Parent Households in Kenwood
| Children | Married-Couple Families | Single-Parent Households |
| No Children | 0 (0.0%) | 0 (0.0%) |
| 1 or 2 Children | 0 (0.0%) | 0 (0.0%) |
| 3 or 4 Children | 0 (0.0%) | 0 (0.0%) |
| 5 or more Children | 0 (0.0%) | 0 (0.0%) |
| Total | 0 (0.0%) | 0 (0.0%) |
Race in Kenwood
The most populous races in Kenwood are White / Caucasian (434 | 71.3%), Asian (168 | 27.6%), and Hispanic or Latino (22 | 3.6%).
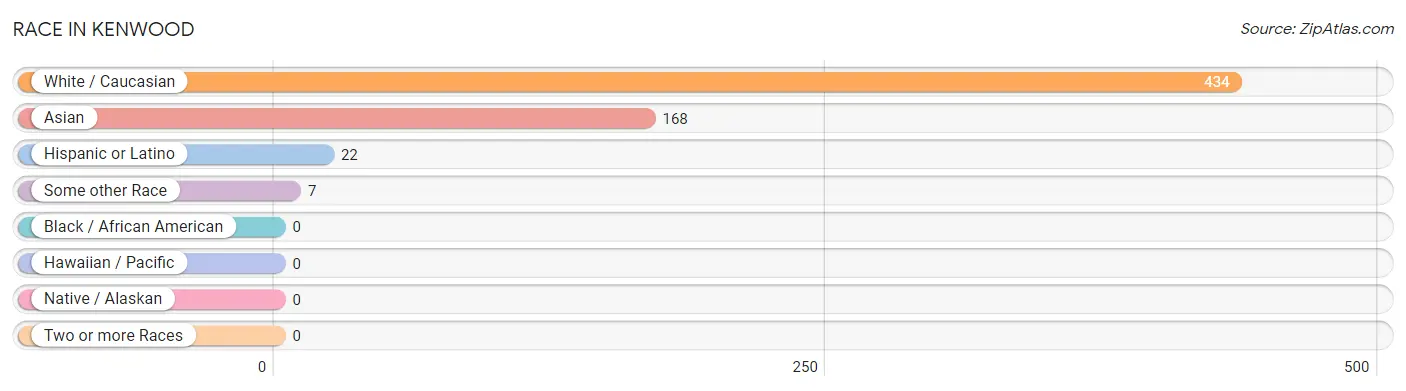
| Race | # Population | % Population |
| Asian | 168 | 27.6% |
| Black / African American | 0 | 0.0% |
| Hawaiian / Pacific | 0 | 0.0% |
| Hispanic or Latino | 22 | 3.6% |
| Native / Alaskan | 0 | 0.0% |
| White / Caucasian | 434 | 71.3% |
| Two or more Races | 0 | 0.0% |
| Some other Race | 7 | 1.1% |
| Total | 609 | 100.0% |
Ancestry in Kenwood
The most populous ancestries reported in Kenwood are Korean (90 | 14.8%), English (80 | 13.1%), British (79 | 13.0%), German (60 | 9.9%), and Indian (Asian) (58 | 9.5%), together accounting for 60.3% of all Kenwood residents.
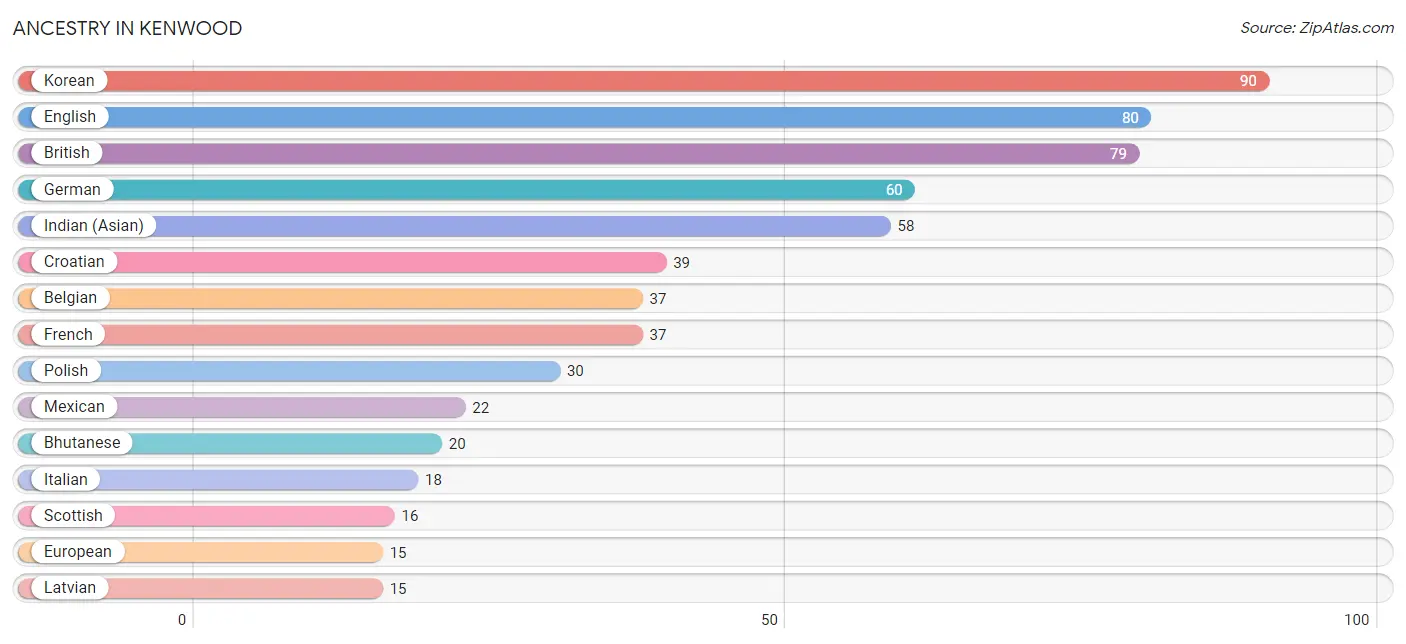
| Ancestry | # Population | % Population |
| Belgian | 37 | 6.1% |
| Bhutanese | 20 | 3.3% |
| British | 79 | 13.0% |
| Bulgarian | 12 | 2.0% |
| Croatian | 39 | 6.4% |
| Dutch | 14 | 2.3% |
| English | 80 | 13.1% |
| European | 15 | 2.5% |
| French | 37 | 6.1% |
| German | 60 | 9.9% |
| Indian (Asian) | 58 | 9.5% |
| Irish | 5 | 0.8% |
| Italian | 18 | 3.0% |
| Korean | 90 | 14.8% |
| Latvian | 15 | 2.5% |
| Mexican | 22 | 3.6% |
| Polish | 30 | 4.9% |
| Scottish | 16 | 2.6% | View All 18 Rows |
Immigrants in Kenwood
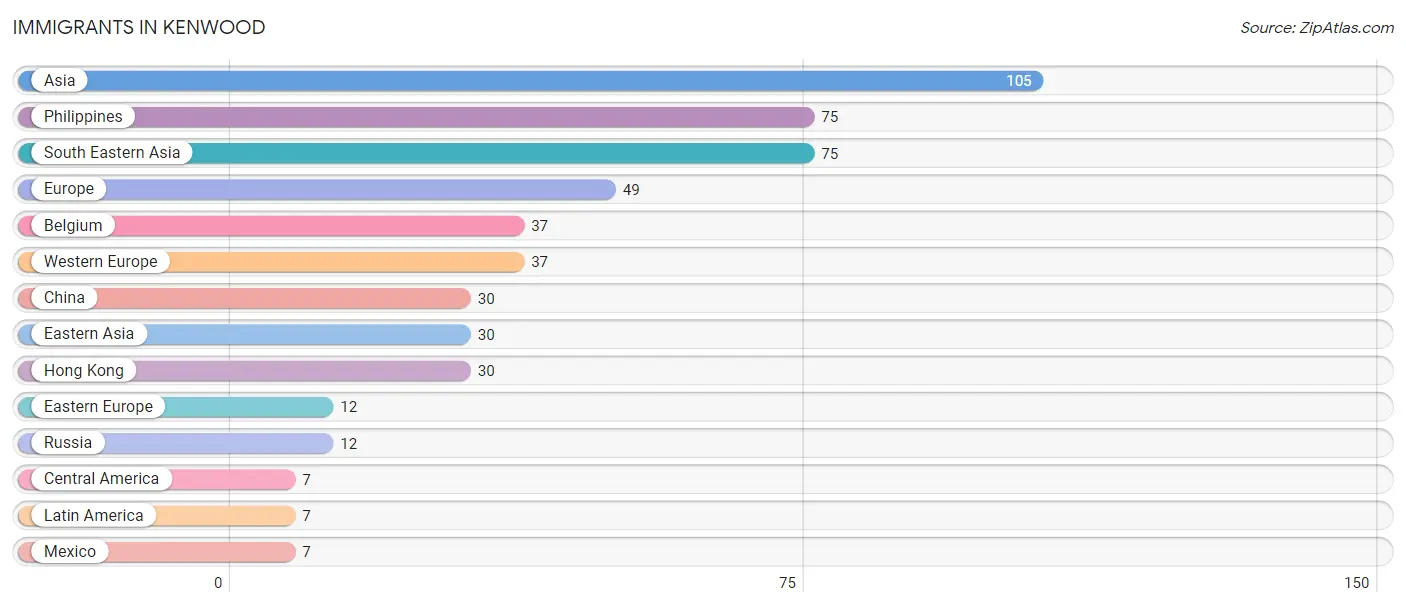
The most numerous immigrant groups reported in Kenwood came from Asia (105 | 17.2%), Philippines (75 | 12.3%), South Eastern Asia (75 | 12.3%), Europe (49 | 8.1%), and Belgium (37 | 6.1%), together accounting for 56.0% of all Kenwood residents.
| Immigration Origin | # Population | % Population |
| Asia | 105 | 17.2% |
| Belgium | 37 | 6.1% |
| Central America | 7 | 1.1% |
| China | 30 | 4.9% |
| Eastern Asia | 30 | 4.9% |
| Eastern Europe | 12 | 2.0% |
| Europe | 49 | 8.1% |
| Hong Kong | 30 | 4.9% |
| Latin America | 7 | 1.1% |
| Mexico | 7 | 1.1% |
| Philippines | 75 | 12.3% |
| Russia | 12 | 2.0% |
| South Eastern Asia | 75 | 12.3% |
| Western Europe | 37 | 6.1% | View All 14 Rows |
Sex and Age in Kenwood
Sex and Age in Kenwood
The most populous age groups in Kenwood are 75 to 79 Years (65 | 31.7%) for men and 70 to 74 Years (92 | 22.8%) for women.
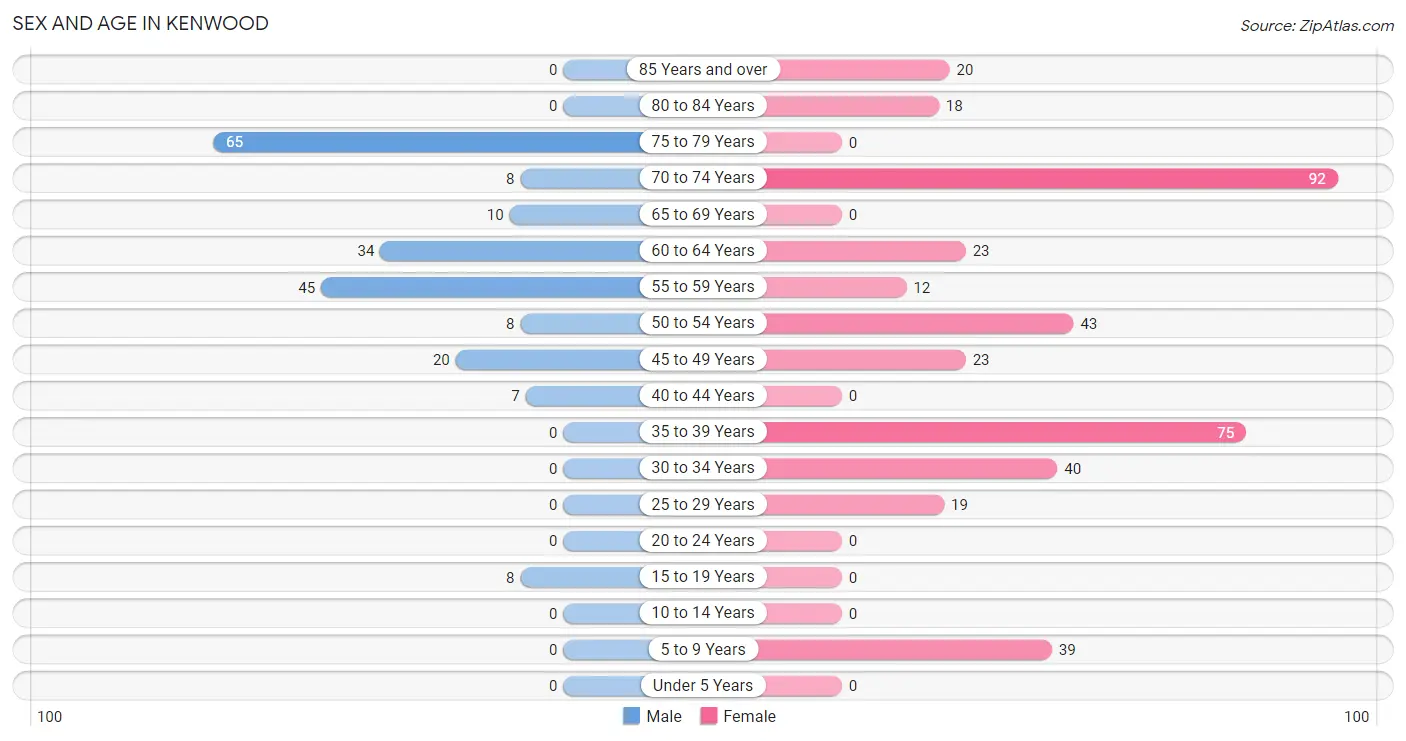
| Age Bracket | Male | Female |
| Under 5 Years | 0 (0.0%) | 0 (0.0%) |
| 5 to 9 Years | 0 (0.0%) | 39 (9.7%) |
| 10 to 14 Years | 0 (0.0%) | 0 (0.0%) |
| 15 to 19 Years | 8 (3.9%) | 0 (0.0%) |
| 20 to 24 Years | 0 (0.0%) | 0 (0.0%) |
| 25 to 29 Years | 0 (0.0%) | 19 (4.7%) |
| 30 to 34 Years | 0 (0.0%) | 40 (9.9%) |
| 35 to 39 Years | 0 (0.0%) | 75 (18.6%) |
| 40 to 44 Years | 7 (3.4%) | 0 (0.0%) |
| 45 to 49 Years | 20 (9.8%) | 23 (5.7%) |
| 50 to 54 Years | 8 (3.9%) | 43 (10.6%) |
| 55 to 59 Years | 45 (22.0%) | 12 (3.0%) |
| 60 to 64 Years | 34 (16.6%) | 23 (5.7%) |
| 65 to 69 Years | 10 (4.9%) | 0 (0.0%) |
| 70 to 74 Years | 8 (3.9%) | 92 (22.8%) |
| 75 to 79 Years | 65 (31.7%) | 0 (0.0%) |
| 80 to 84 Years | 0 (0.0%) | 18 (4.5%) |
| 85 Years and over | 0 (0.0%) | 20 (5.0%) |
| Total | 205 (100.0%) | 404 (100.0%) |
Families and Households in Kenwood
Median Family Size in Kenwood
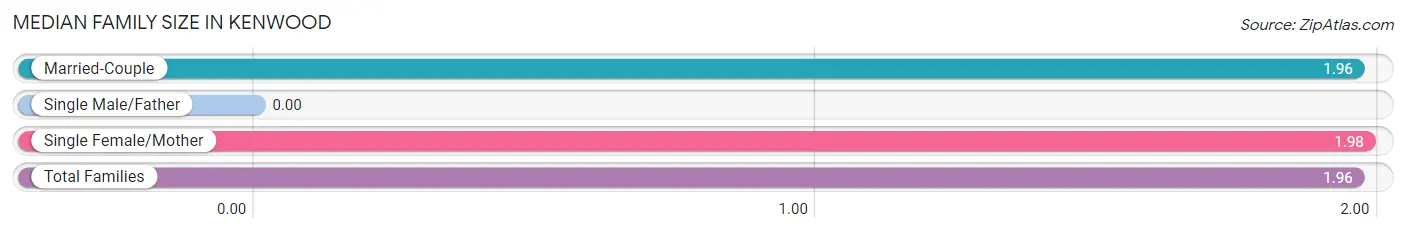
| Family Type | # Families | Family Size |
| Married-Couple | 131 (76.6%) | 1.96 |
| Single Male/Father | 0 (0.0%) | - |
| Single Female/Mother | 40 (23.4%) | 1.98 |
| Total Families | 171 (100.0%) | 1.96 |
Median Household Size in Kenwood
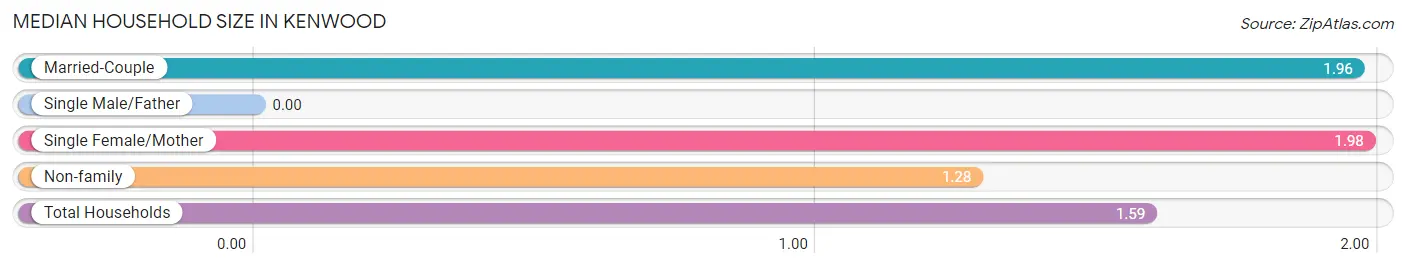
| Household Type | # Households | Household Size |
| Married-Couple | 131 (35.1%) | 1.96 |
| Single Male/Father | 0 (0.0%) | - |
| Single Female/Mother | 40 (10.7%) | 1.98 |
| Non-family | 202 (54.2%) | 1.28 |
| Total Households | 373 (100.0%) | 1.59 |
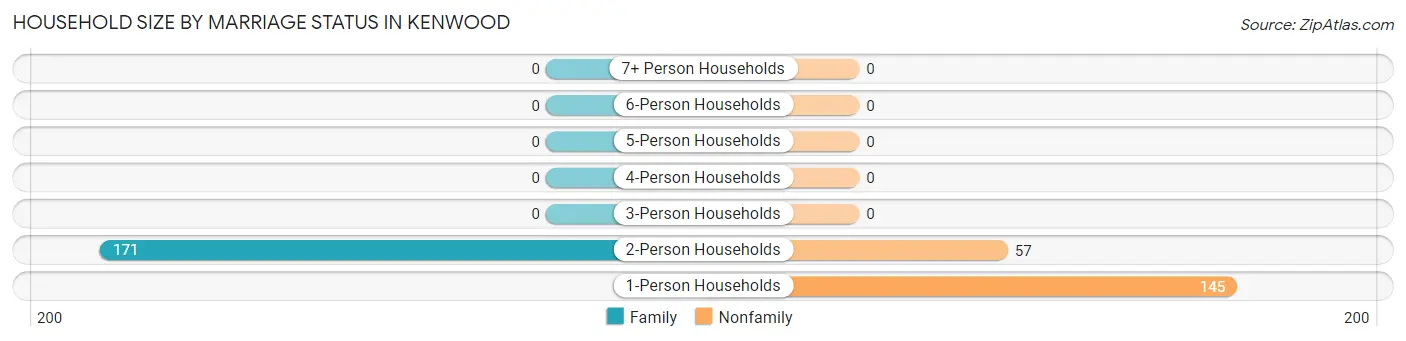
Household Size by Marriage Status in Kenwood
Out of a total of 373 households in Kenwood, 171 (45.8%) are family households, while 202 (54.2%) are nonfamily households. The most numerous type of family households are 2-person households, comprising 171, and the most common type of nonfamily households are 1-person households, comprising 145.
| Household Size | Family Households | Nonfamily Households |
| 1-Person Households | - | 145 (38.9%) |
| 2-Person Households | 171 (45.8%) | 57 (15.3%) |
| 3-Person Households | 0 (0.0%) | 0 (0.0%) |
| 4-Person Households | 0 (0.0%) | 0 (0.0%) |
| 5-Person Households | 0 (0.0%) | 0 (0.0%) |
| 6-Person Households | 0 (0.0%) | 0 (0.0%) |
| 7+ Person Households | 0 (0.0%) | 0 (0.0%) |
| Total | 171 (45.8%) | 202 (54.2%) |
Female Fertility in Kenwood
Fertility by Age in Kenwood
| Age Bracket | Women with Births | Births / 1,000 Women |
| 15 to 19 years | 0 (0.0%) | 0.0 |
| 20 to 34 years | 0 (0.0%) | 0.0 |
| 35 to 50 years | 0 (0.0%) | 0.0 |
| Total | 0 (0.0%) | 0.0 |
Fertility by Age by Marriage Status in Kenwood
| Age Bracket | Married | Unmarried |
| 15 to 19 years | 0 (0.0%) | 0 (0.0%) |
| 20 to 34 years | 0 (0.0%) | 0 (0.0%) |
| 35 to 50 years | 0 (0.0%) | 0 (0.0%) |
| Total | 0 (0.0%) | 0 (0.0%) |
Fertility by Education in Kenwood
| Educational Attainment | Women with Births | Births / 1,000 Women |
| Less than High School | 0 (0.0%) | 0.0 |
| High School Diploma | 0 (0.0%) | 0.0 |
| College or Associate's Degree | 0 (0.0%) | 0.0 |
| Bachelor's Degree | 0 (0.0%) | 0.0 |
| Graduate Degree | 0 (0.0%) | 0.0 |
| Total | 0 (0.0%) | 0.0 |
Fertility by Education by Marriage Status in Kenwood
| Educational Attainment | Married | Unmarried |
| Less than High School | 0 (0.0%) | 0 (0.0%) |
| High School Diploma | 0 (0.0%) | 0 (0.0%) |
| College or Associate's Degree | 0 (0.0%) | 0 (0.0%) |
| Bachelor's Degree | 0 (0.0%) | 0 (0.0%) |
| Graduate Degree | 0 (0.0%) | 0 (0.0%) |
| Total | 0 (0.0%) | 0 (0.0%) |
Employment Characteristics in Kenwood
Employment by Class of Employer in Kenwood
Among the 346 employed individuals in Kenwood, private company employees (153 | 44.2%), local government employees (55 | 15.9%), and state government employees (51 | 14.7%) make up the most common classes of employment.
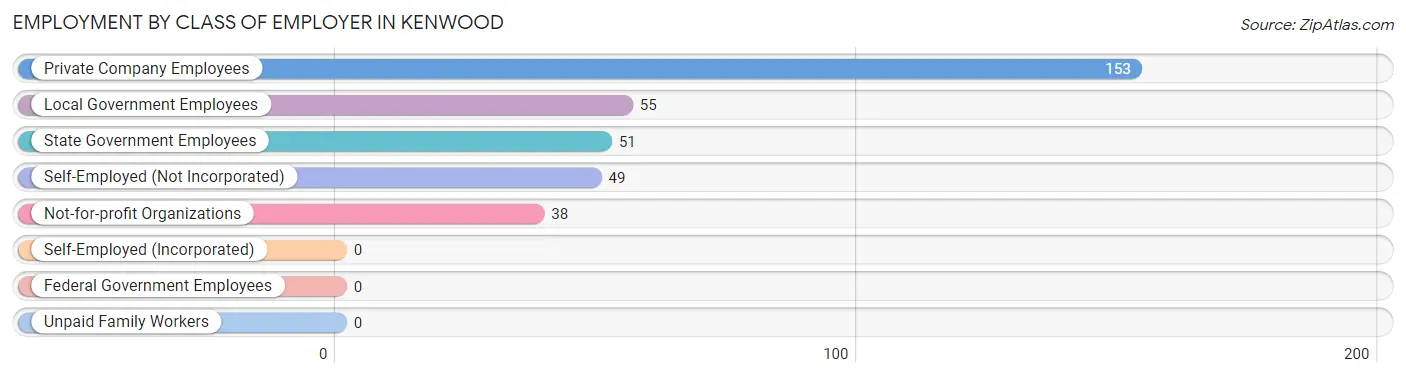
| Employer Class | # Employees | % Employees |
| Private Company Employees | 153 | 44.2% |
| Self-Employed (Incorporated) | 0 | 0.0% |
| Self-Employed (Not Incorporated) | 49 | 14.2% |
| Not-for-profit Organizations | 38 | 11.0% |
| Local Government Employees | 55 | 15.9% |
| State Government Employees | 51 | 14.7% |
| Federal Government Employees | 0 | 0.0% |
| Unpaid Family Workers | 0 | 0.0% |
| Total | 346 | 100.0% |
Employment Status by Age in Kenwood
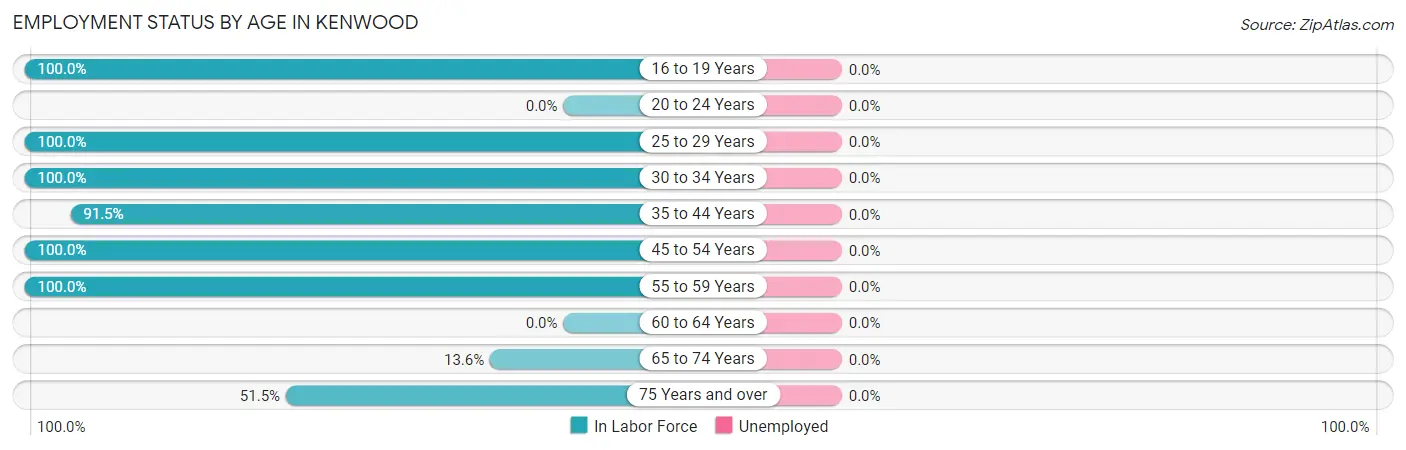
| Age Bracket | In Labor Force | Unemployed |
| 16 to 19 Years | 8 (100.0%) | 0 (0.0%) |
| 20 to 24 Years | 0 (0.0%) | 0 (0.0%) |
| 25 to 29 Years | 19 (100.0%) | 0 (0.0%) |
| 30 to 34 Years | 40 (100.0%) | 0 (0.0%) |
| 35 to 44 Years | 75 (91.5%) | 0 (0.0%) |
| 45 to 54 Years | 94 (100.0%) | 0 (0.0%) |
| 55 to 59 Years | 57 (100.0%) | 0 (0.0%) |
| 60 to 64 Years | 0 (0.0%) | 0 (0.0%) |
| 65 to 74 Years | 15 (13.6%) | 0 (0.0%) |
| 75 Years and over | 53 (51.5%) | 0 (0.0%) |
| Total | 361 (63.3%) | 0 (0.0%) |
Employment Status by Educational Attainment in Kenwood
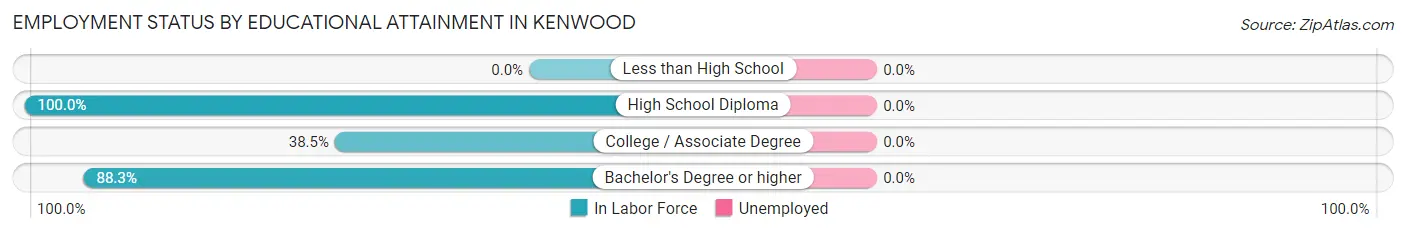
| Educational Attainment | In Labor Force | Unemployed |
| Less than High School | 0 (0.0%) | 0 (0.0%) |
| High School Diploma | 23 (100.0%) | 0 (0.0%) |
| College / Associate Degree | 20 (38.5%) | 0 (0.0%) |
| Bachelor's Degree or higher | 242 (88.3%) | 0 (0.0%) |
| Total | 285 (81.7%) | 0 (0.0%) |
Employment Occupations by Sex in Kenwood
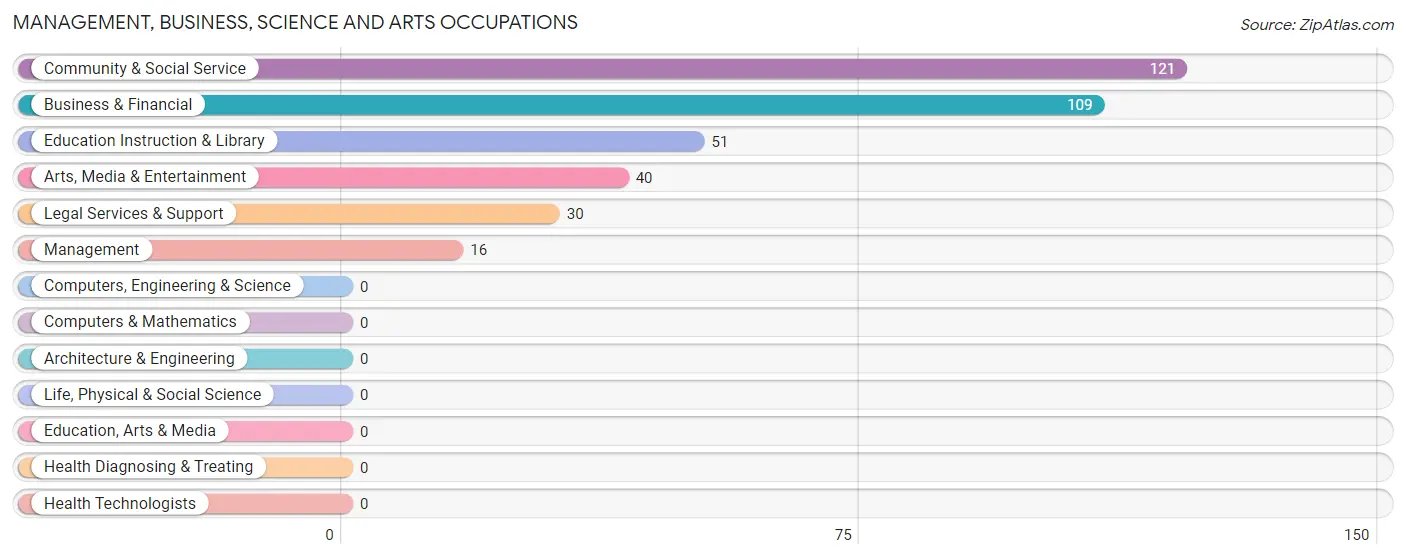
Management, Business, Science and Arts Occupations
The most common Management, Business, Science and Arts occupations in Kenwood are Community & Social Service (121 | 33.5%), Business & Financial (109 | 30.2%), Education Instruction & Library (51 | 14.1%), Arts, Media & Entertainment (40 | 11.1%), and Legal Services & Support (30 | 8.3%).
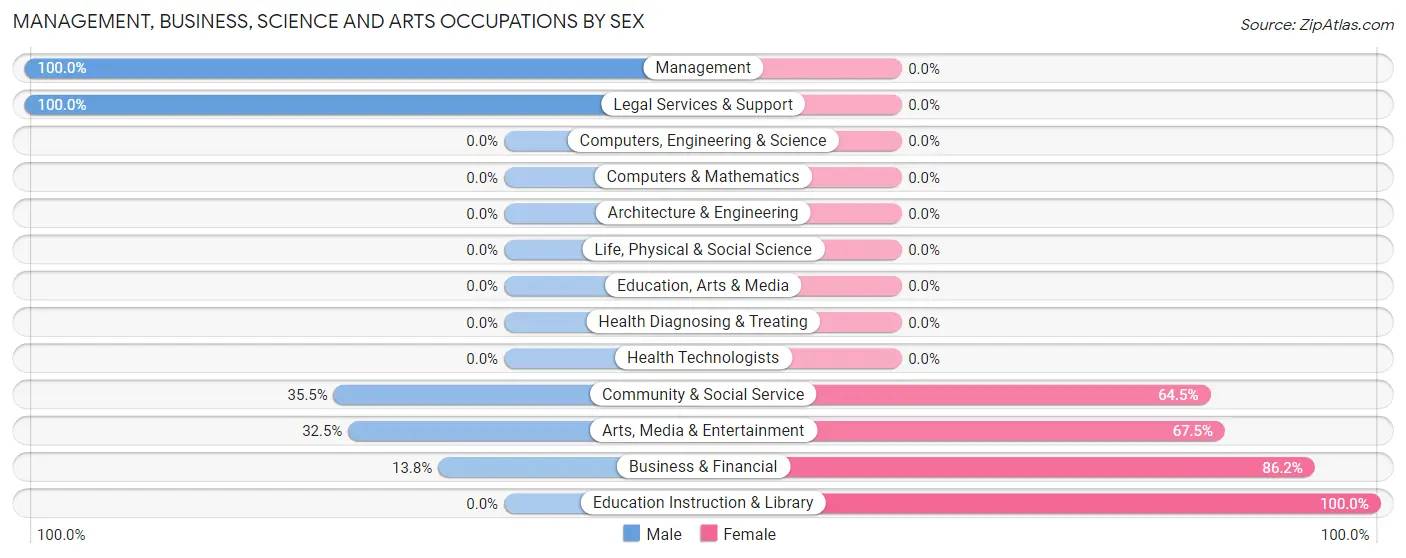
Management, Business, Science and Arts Occupations by Sex
Within the Management, Business, Science and Arts occupations in Kenwood, the most male-oriented occupations are Management (100.0%), Legal Services & Support (100.0%), and Community & Social Service (35.5%), while the most female-oriented occupations are Education Instruction & Library (100.0%), Business & Financial (86.2%), and Arts, Media & Entertainment (67.5%).
| Occupation | Male | Female |
| Management | 16 (100.0%) | 0 (0.0%) |
| Business & Financial | 15 (13.8%) | 94 (86.2%) |
| Computers, Engineering & Science | 0 (0.0%) | 0 (0.0%) |
| Computers & Mathematics | 0 (0.0%) | 0 (0.0%) |
| Architecture & Engineering | 0 (0.0%) | 0 (0.0%) |
| Life, Physical & Social Science | 0 (0.0%) | 0 (0.0%) |
| Community & Social Service | 43 (35.5%) | 78 (64.5%) |
| Education, Arts & Media | 0 (0.0%) | 0 (0.0%) |
| Legal Services & Support | 30 (100.0%) | 0 (0.0%) |
| Education Instruction & Library | 0 (0.0%) | 51 (100.0%) |
| Arts, Media & Entertainment | 13 (32.5%) | 27 (67.5%) |
| Health Diagnosing & Treating | 0 (0.0%) | 0 (0.0%) |
| Health Technologists | 0 (0.0%) | 0 (0.0%) |
| Total (Category) | 74 (30.1%) | 172 (69.9%) |
| Total (Overall) | 134 (37.1%) | 227 (62.9%) |
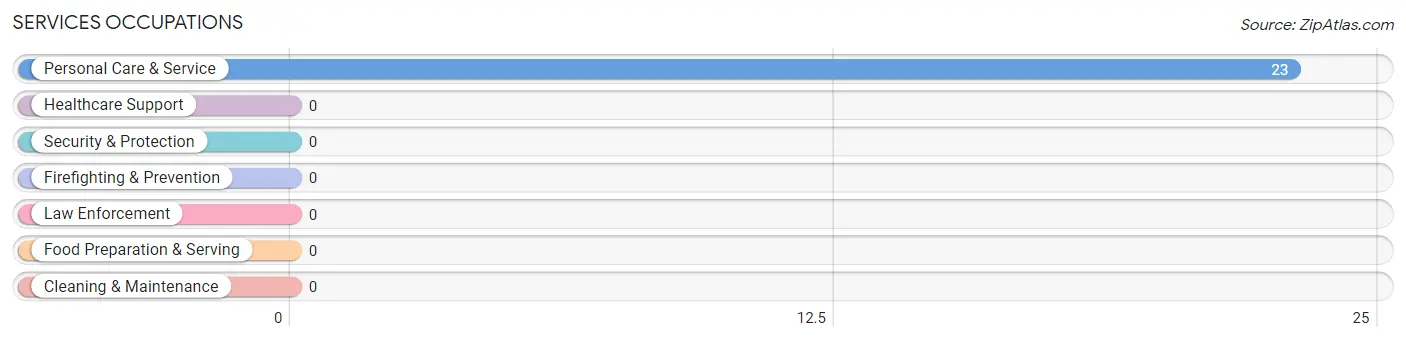
Services Occupations
The most common Services occupations in Kenwood are , and Personal Care & Service (23 | 6.4%).
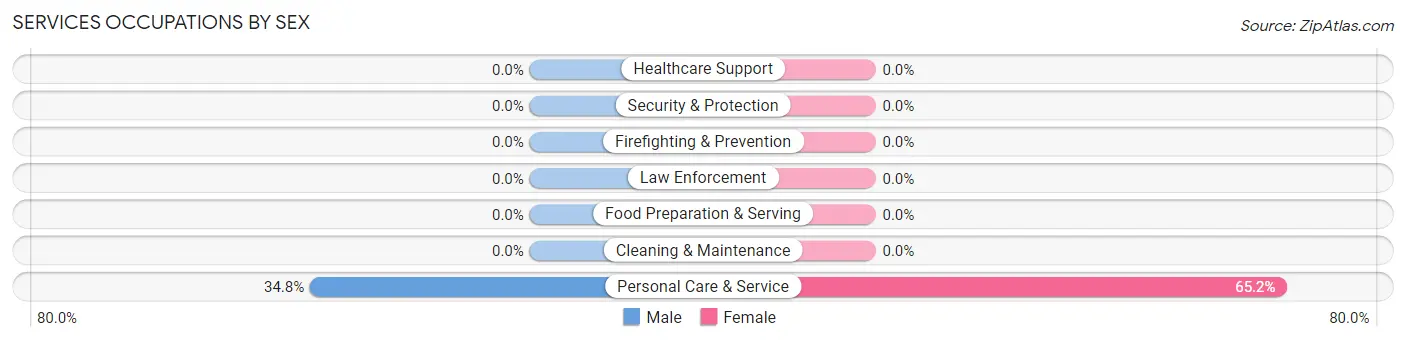
Services Occupations by Sex
| Occupation | Male | Female |
| Healthcare Support | 0 (0.0%) | 0 (0.0%) |
| Security & Protection | 0 (0.0%) | 0 (0.0%) |
| Firefighting & Prevention | 0 (0.0%) | 0 (0.0%) |
| Law Enforcement | 0 (0.0%) | 0 (0.0%) |
| Food Preparation & Serving | 0 (0.0%) | 0 (0.0%) |
| Cleaning & Maintenance | 0 (0.0%) | 0 (0.0%) |
| Personal Care & Service | 8 (34.8%) | 15 (65.2%) |
| Total (Category) | 8 (34.8%) | 15 (65.2%) |
| Total (Overall) | 134 (37.1%) | 227 (62.9%) |
Sales and Office Occupations
Sales and Office Occupations by Sex
| Occupation | Male | Female |
| Sales & Related | 0 (0.0%) | 0 (0.0%) |
| Office & Administration | 0 (0.0%) | 0 (0.0%) |
| Total (Category) | 0 (0.0%) | 0 (0.0%) |
| Total (Overall) | 134 (37.1%) | 227 (62.9%) |
Natural Resources, Construction and Maintenance Occupations
The most common Natural Resources, Construction and Maintenance occupations in Kenwood are , and Construction & Extraction (15 | 4.2%).
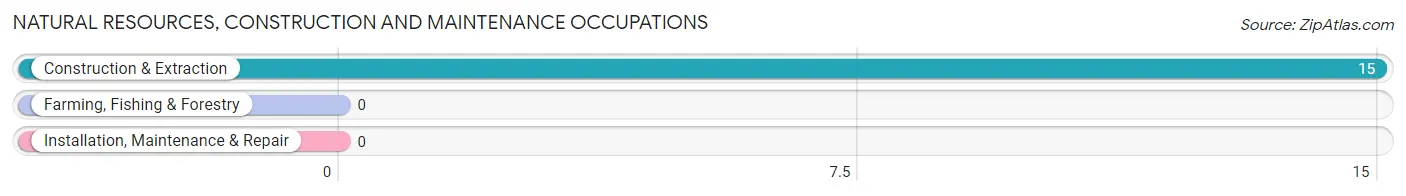
Natural Resources, Construction and Maintenance Occupations by Sex
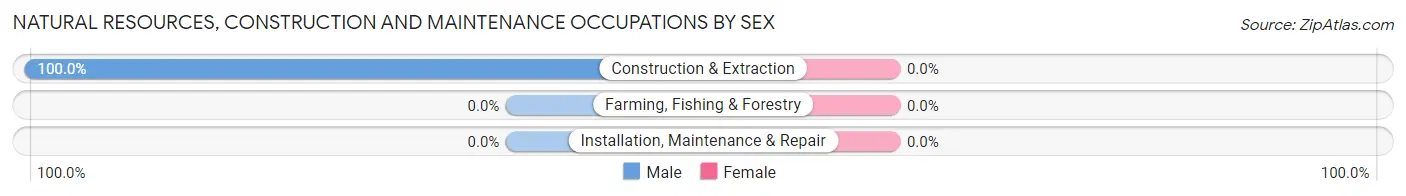
| Occupation | Male | Female |
| Farming, Fishing & Forestry | 0 (0.0%) | 0 (0.0%) |
| Construction & Extraction | 15 (100.0%) | 0 (0.0%) |
| Installation, Maintenance & Repair | 0 (0.0%) | 0 (0.0%) |
| Total (Category) | 15 (100.0%) | 0 (0.0%) |
| Total (Overall) | 134 (37.1%) | 227 (62.9%) |
Production, Transportation and Moving Occupations
The most common Production, Transportation and Moving occupations in Kenwood are Production (40 | 11.1%), and Transportation (37 | 10.2%).
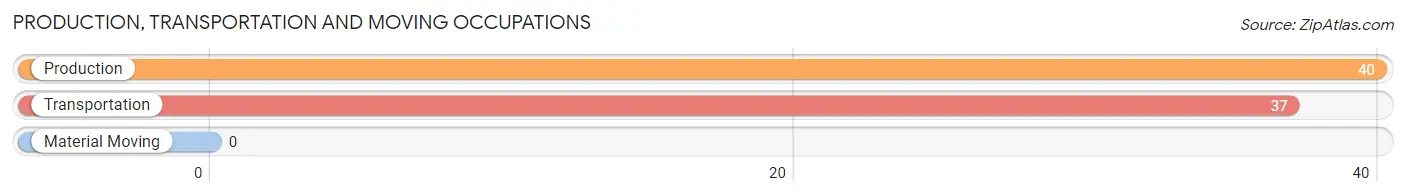
Production, Transportation and Moving Occupations by Sex
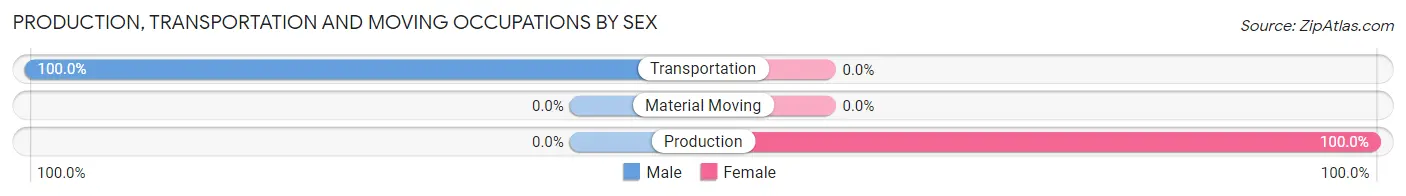
| Occupation | Male | Female |
| Production | 0 (0.0%) | 40 (100.0%) |
| Transportation | 37 (100.0%) | 0 (0.0%) |
| Material Moving | 0 (0.0%) | 0 (0.0%) |
| Total (Category) | 37 (48.0%) | 40 (51.9%) |
| Total (Overall) | 134 (37.1%) | 227 (62.9%) |
Employment Industries by Sex in Kenwood
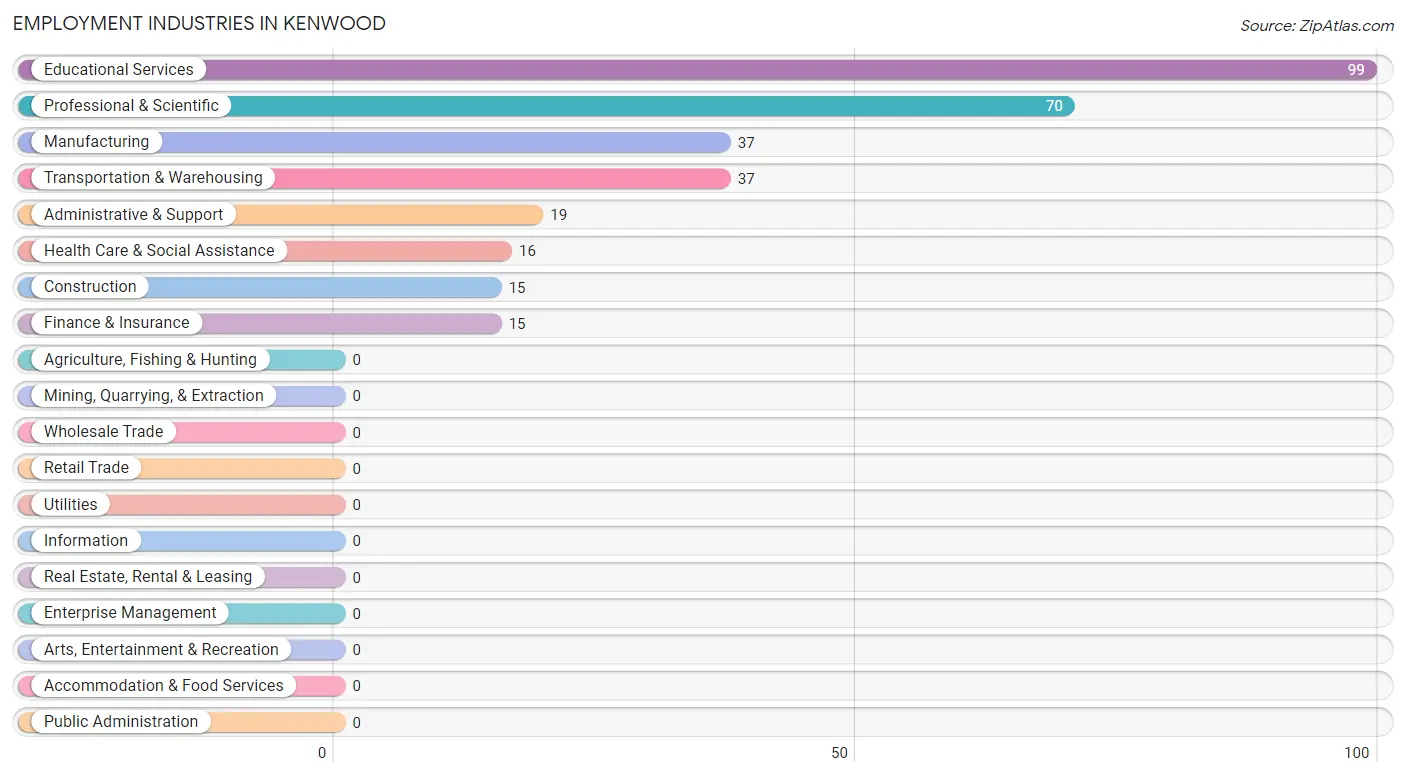
Employment Industries in Kenwood
The major employment industries in Kenwood include Educational Services (99 | 27.4%), Professional & Scientific (70 | 19.4%), Manufacturing (37 | 10.2%), Transportation & Warehousing (37 | 10.2%), and Administrative & Support (19 | 5.3%).
Employment Industries by Sex in Kenwood
The Kenwood industries that see more men than women are Construction (100.0%), Transportation & Warehousing (100.0%), and Finance & Insurance (100.0%), whereas the industries that tend to have a higher number of women are Manufacturing (100.0%), Administrative & Support (100.0%), and Educational Services (91.9%).
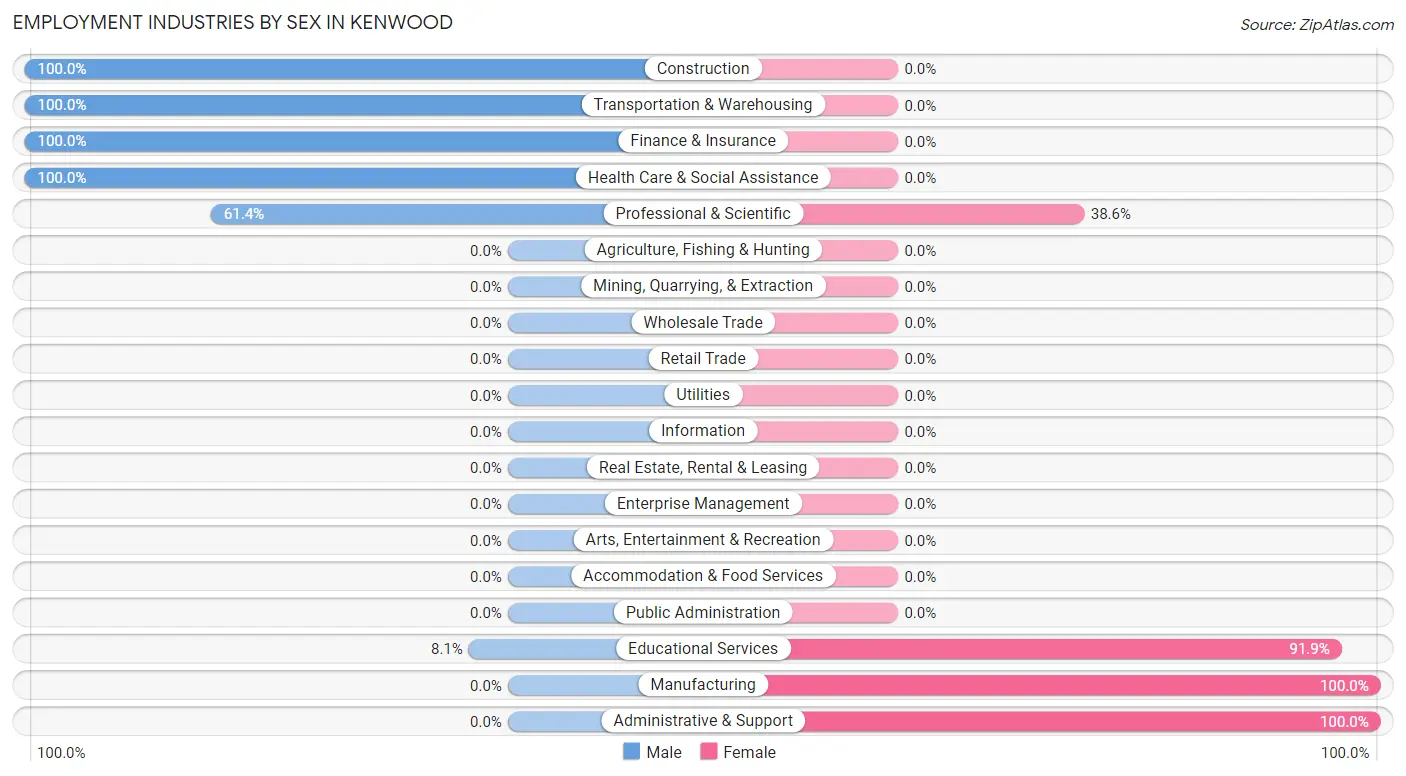
| Industry | Male | Female |
| Agriculture, Fishing & Hunting | 0 (0.0%) | 0 (0.0%) |
| Mining, Quarrying, & Extraction | 0 (0.0%) | 0 (0.0%) |
| Construction | 15 (100.0%) | 0 (0.0%) |
| Manufacturing | 0 (0.0%) | 37 (100.0%) |
| Wholesale Trade | 0 (0.0%) | 0 (0.0%) |
| Retail Trade | 0 (0.0%) | 0 (0.0%) |
| Transportation & Warehousing | 37 (100.0%) | 0 (0.0%) |
| Utilities | 0 (0.0%) | 0 (0.0%) |
| Information | 0 (0.0%) | 0 (0.0%) |
| Finance & Insurance | 15 (100.0%) | 0 (0.0%) |
| Real Estate, Rental & Leasing | 0 (0.0%) | 0 (0.0%) |
| Professional & Scientific | 43 (61.4%) | 27 (38.6%) |
| Enterprise Management | 0 (0.0%) | 0 (0.0%) |
| Administrative & Support | 0 (0.0%) | 19 (100.0%) |
| Educational Services | 8 (8.1%) | 91 (91.9%) |
| Health Care & Social Assistance | 16 (100.0%) | 0 (0.0%) |
| Arts, Entertainment & Recreation | 0 (0.0%) | 0 (0.0%) |
| Accommodation & Food Services | 0 (0.0%) | 0 (0.0%) |
| Public Administration | 0 (0.0%) | 0 (0.0%) |
| Total | 134 (37.1%) | 227 (62.9%) |
Education in Kenwood
School Enrollment in Kenwood
The most common levels of schooling among the 79 students in Kenwood are college / undergraduate (40 | 50.6%), and kindergarten (39 | 49.4%).
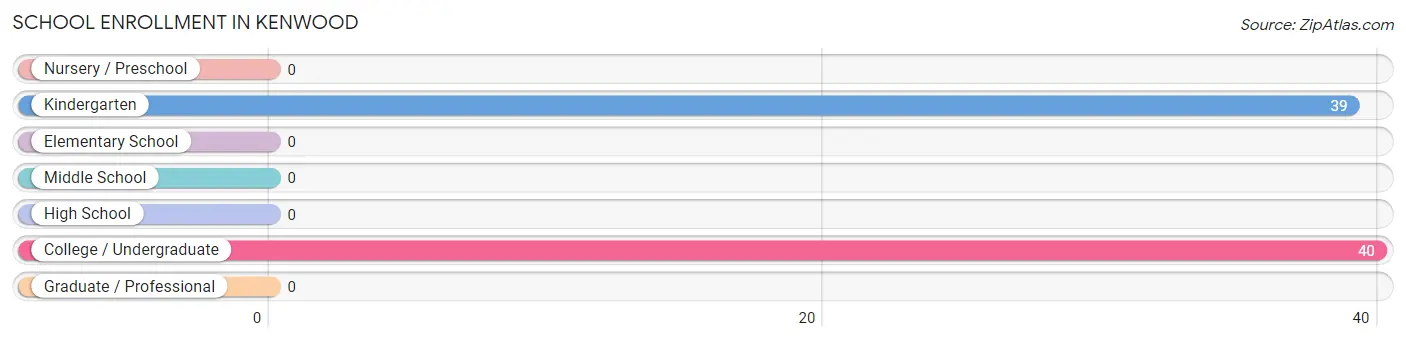
| School Level | # Students | % Students |
| Nursery / Preschool | 0 | 0.0% |
| Kindergarten | 39 | 49.4% |
| Elementary School | 0 | 0.0% |
| Middle School | 0 | 0.0% |
| High School | 0 | 0.0% |
| College / Undergraduate | 40 | 50.6% |
| Graduate / Professional | 0 | 0.0% |
| Total | 79 | 100.0% |
School Enrollment by Age by Funding Source in Kenwood
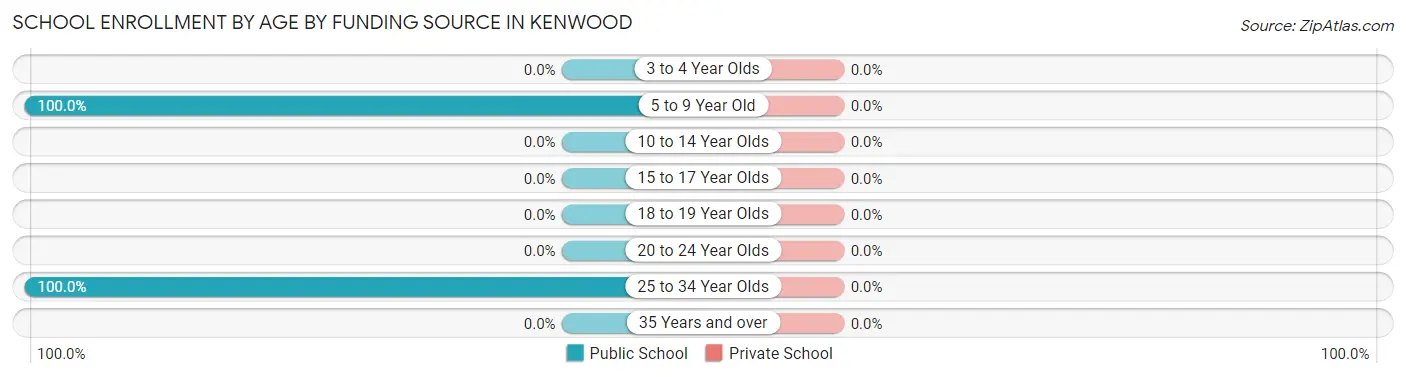
| Age Bracket | Public School | Private School |
| 3 to 4 Year Olds | 0 (0.0%) | 0 (0.0%) |
| 5 to 9 Year Old | 39 (100.0%) | 0 (0.0%) |
| 10 to 14 Year Olds | 0 (0.0%) | 0 (0.0%) |
| 15 to 17 Year Olds | 0 (0.0%) | 0 (0.0%) |
| 18 to 19 Year Olds | 0 (0.0%) | 0 (0.0%) |
| 20 to 24 Year Olds | 0 (0.0%) | 0 (0.0%) |
| 25 to 34 Year Olds | 40 (100.0%) | 0 (0.0%) |
| 35 Years and over | 0 (0.0%) | 0 (0.0%) |
| Total | 79 (100.0%) | 0 (0.0%) |
Educational Attainment by Field of Study in Kenwood
Psychology (126 | 31.1%), science & technology (75 | 18.5%), social sciences (53 | 13.1%), literature & languages (50 | 12.3%), and computers & mathematics (37 | 9.1%) are the most common fields of study among 405 individuals in Kenwood who have obtained a bachelor's degree or higher.
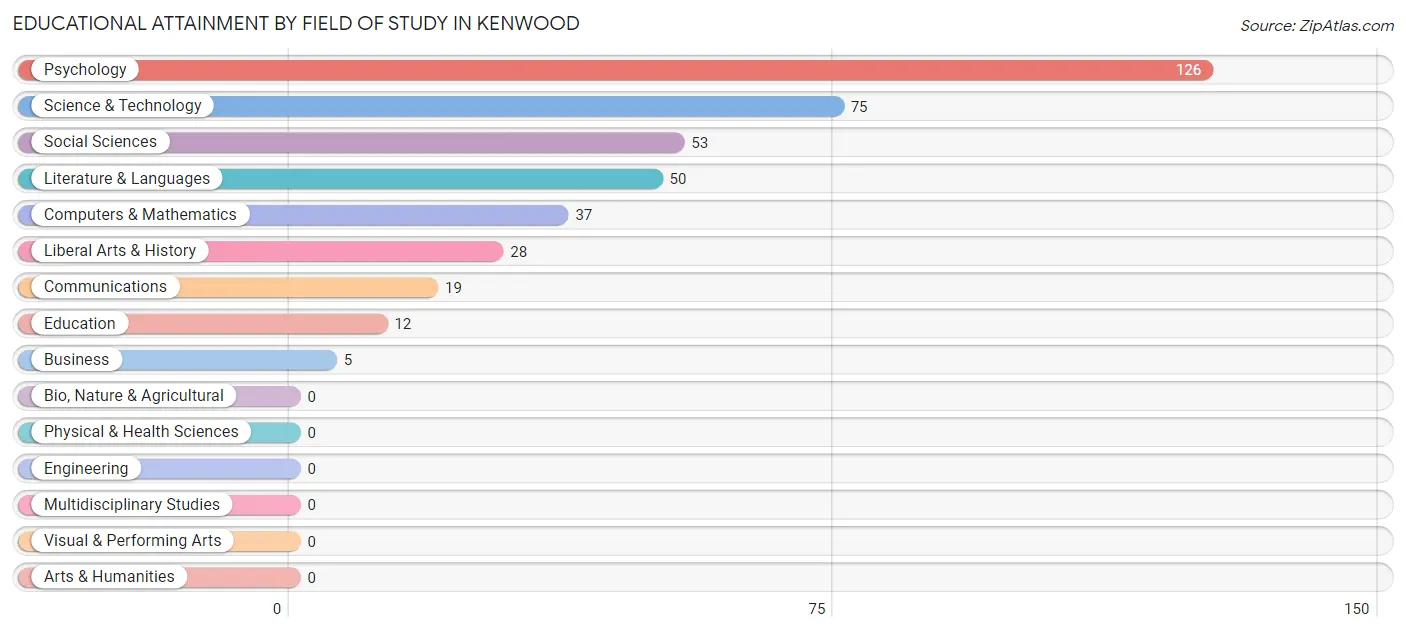
| Field of Study | # Graduates | % Graduates |
| Computers & Mathematics | 37 | 9.1% |
| Bio, Nature & Agricultural | 0 | 0.0% |
| Physical & Health Sciences | 0 | 0.0% |
| Psychology | 126 | 31.1% |
| Social Sciences | 53 | 13.1% |
| Engineering | 0 | 0.0% |
| Multidisciplinary Studies | 0 | 0.0% |
| Science & Technology | 75 | 18.5% |
| Business | 5 | 1.2% |
| Education | 12 | 3.0% |
| Literature & Languages | 50 | 12.3% |
| Liberal Arts & History | 28 | 6.9% |
| Visual & Performing Arts | 0 | 0.0% |
| Communications | 19 | 4.7% |
| Arts & Humanities | 0 | 0.0% |
| Total | 405 | 100.0% |
Transportation & Commute in Kenwood
Vehicle Availability by Sex in Kenwood
The most prevalent vehicle ownership categories in Kenwood are males with 1 vehicle (45, accounting for 35.7%) and females with 1 vehicle (52, making up 21.2%).
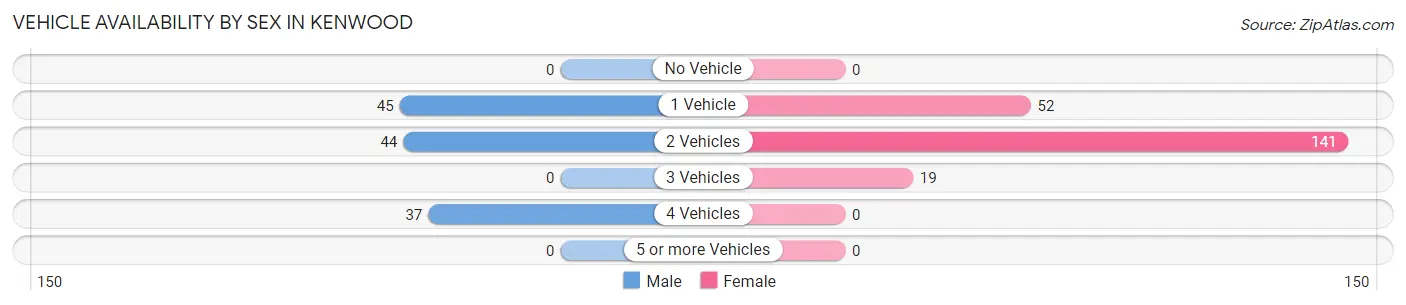
| Vehicles Available | Male | Female |
| No Vehicle | 0 (0.0%) | 0 (0.0%) |
| 1 Vehicle | 45 (35.7%) | 52 (24.5%) |
| 2 Vehicles | 44 (34.9%) | 141 (66.5%) |
| 3 Vehicles | 0 (0.0%) | 19 (9.0%) |
| 4 Vehicles | 37 (29.4%) | 0 (0.0%) |
| 5 or more Vehicles | 0 (0.0%) | 0 (0.0%) |
| Total | 126 (100.0%) | 212 (100.0%) |
Commute Time in Kenwood
The most frequently occuring commute durations in Kenwood are 90 or more minutes (95 commuters, 38.9%), 30 to 34 minutes (77 commuters, 31.6%), and 10 to 14 minutes (42 commuters, 17.2%).
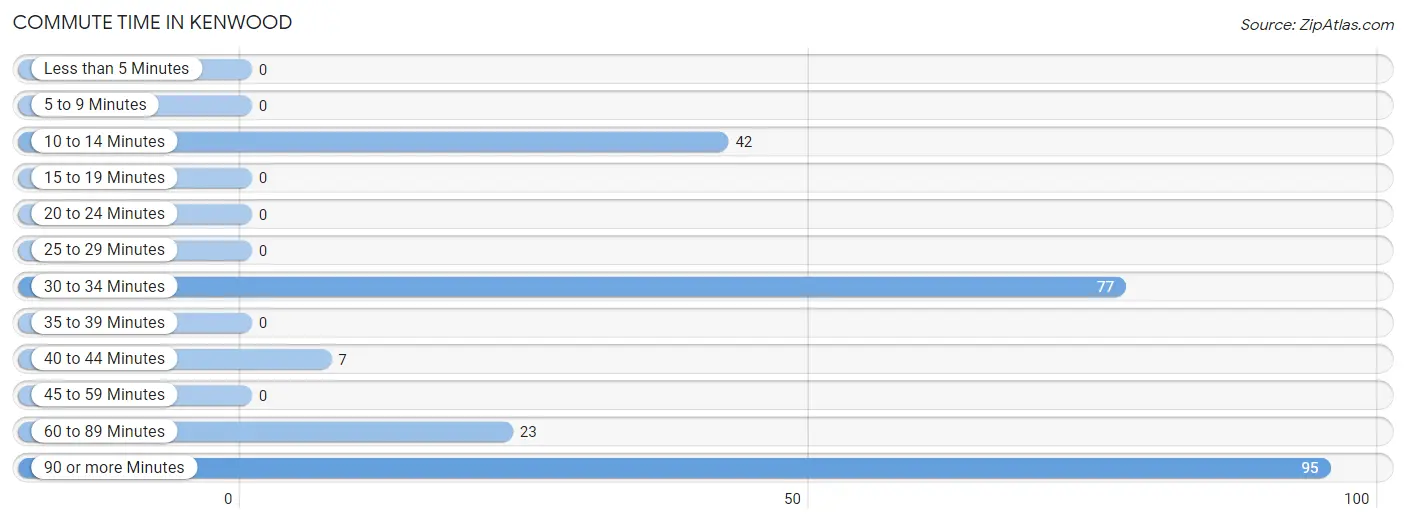
| Commute Time | # Commuters | % Commuters |
| Less than 5 Minutes | 0 | 0.0% |
| 5 to 9 Minutes | 0 | 0.0% |
| 10 to 14 Minutes | 42 | 17.2% |
| 15 to 19 Minutes | 0 | 0.0% |
| 20 to 24 Minutes | 0 | 0.0% |
| 25 to 29 Minutes | 0 | 0.0% |
| 30 to 34 Minutes | 77 | 31.6% |
| 35 to 39 Minutes | 0 | 0.0% |
| 40 to 44 Minutes | 7 | 2.9% |
| 45 to 59 Minutes | 0 | 0.0% |
| 60 to 89 Minutes | 23 | 9.4% |
| 90 or more Minutes | 95 | 38.9% |
Commute Time by Sex in Kenwood
The most common commute times in Kenwood are 30 to 34 minutes (37 commuters, 45.1%) for males and 90 or more minutes (65 commuters, 40.1%) for females.
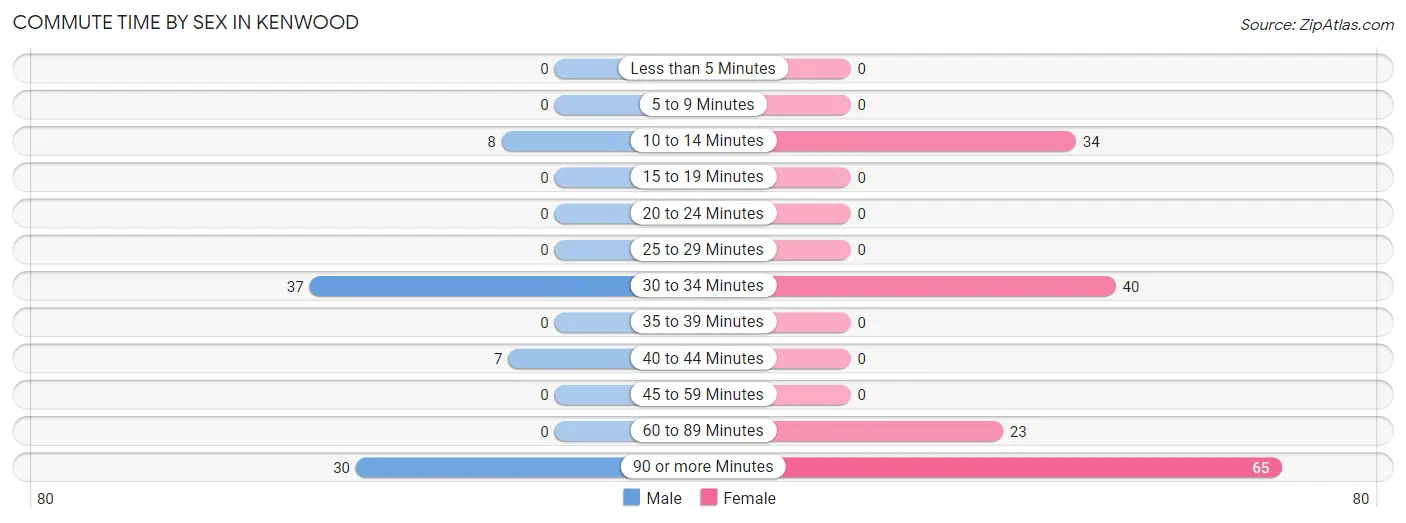
| Commute Time | Male | Female |
| Less than 5 Minutes | 0 (0.0%) | 0 (0.0%) |
| 5 to 9 Minutes | 0 (0.0%) | 0 (0.0%) |
| 10 to 14 Minutes | 8 (9.8%) | 34 (21.0%) |
| 15 to 19 Minutes | 0 (0.0%) | 0 (0.0%) |
| 20 to 24 Minutes | 0 (0.0%) | 0 (0.0%) |
| 25 to 29 Minutes | 0 (0.0%) | 0 (0.0%) |
| 30 to 34 Minutes | 37 (45.1%) | 40 (24.7%) |
| 35 to 39 Minutes | 0 (0.0%) | 0 (0.0%) |
| 40 to 44 Minutes | 7 (8.5%) | 0 (0.0%) |
| 45 to 59 Minutes | 0 (0.0%) | 0 (0.0%) |
| 60 to 89 Minutes | 0 (0.0%) | 23 (14.2%) |
| 90 or more Minutes | 30 (36.6%) | 65 (40.1%) |
Time of Departure to Work by Sex in Kenwood
The most frequent times of departure to work in Kenwood are 8:30 AM to 8:59 AM (44, 53.7%) for males and 5:00 AM to 5:29 AM (65, 40.1%) for females.
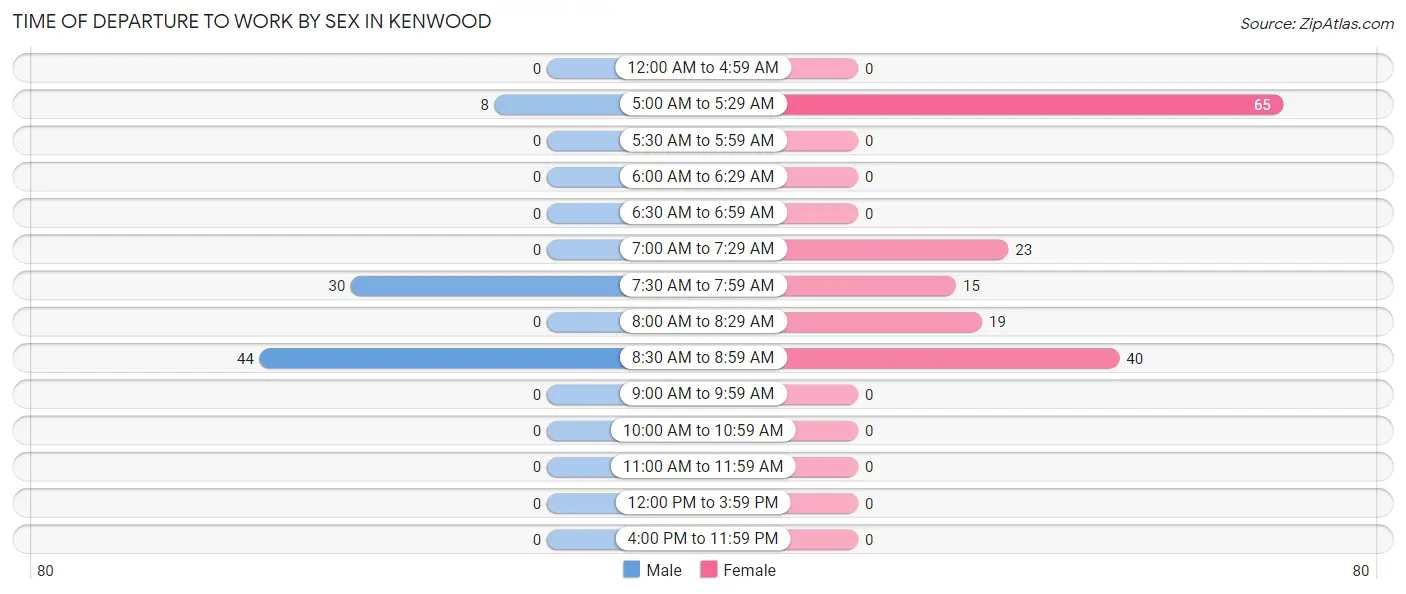
| Time of Departure | Male | Female |
| 12:00 AM to 4:59 AM | 0 (0.0%) | 0 (0.0%) |
| 5:00 AM to 5:29 AM | 8 (9.8%) | 65 (40.1%) |
| 5:30 AM to 5:59 AM | 0 (0.0%) | 0 (0.0%) |
| 6:00 AM to 6:29 AM | 0 (0.0%) | 0 (0.0%) |
| 6:30 AM to 6:59 AM | 0 (0.0%) | 0 (0.0%) |
| 7:00 AM to 7:29 AM | 0 (0.0%) | 23 (14.2%) |
| 7:30 AM to 7:59 AM | 30 (36.6%) | 15 (9.3%) |
| 8:00 AM to 8:29 AM | 0 (0.0%) | 19 (11.7%) |
| 8:30 AM to 8:59 AM | 44 (53.7%) | 40 (24.7%) |
| 9:00 AM to 9:59 AM | 0 (0.0%) | 0 (0.0%) |
| 10:00 AM to 10:59 AM | 0 (0.0%) | 0 (0.0%) |
| 11:00 AM to 11:59 AM | 0 (0.0%) | 0 (0.0%) |
| 12:00 PM to 3:59 PM | 0 (0.0%) | 0 (0.0%) |
| 4:00 PM to 11:59 PM | 0 (0.0%) | 0 (0.0%) |
| Total | 82 (100.0%) | 162 (100.0%) |
Housing Occupancy in Kenwood
Occupancy by Ownership in Kenwood
Of the total 373 dwellings in Kenwood, owner-occupied units account for 311 (83.4%), while renter-occupied units make up 62 (16.6%).
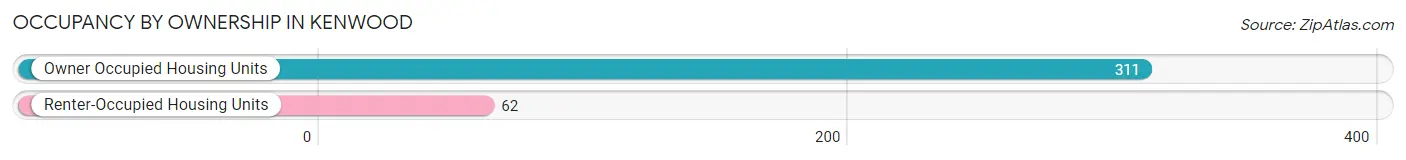
| Occupancy | # Housing Units | % Housing Units |
| Owner Occupied Housing Units | 311 | 83.4% |
| Renter-Occupied Housing Units | 62 | 16.6% |
| Total Occupied Housing Units | 373 | 100.0% |
Occupancy by Household Size in Kenwood
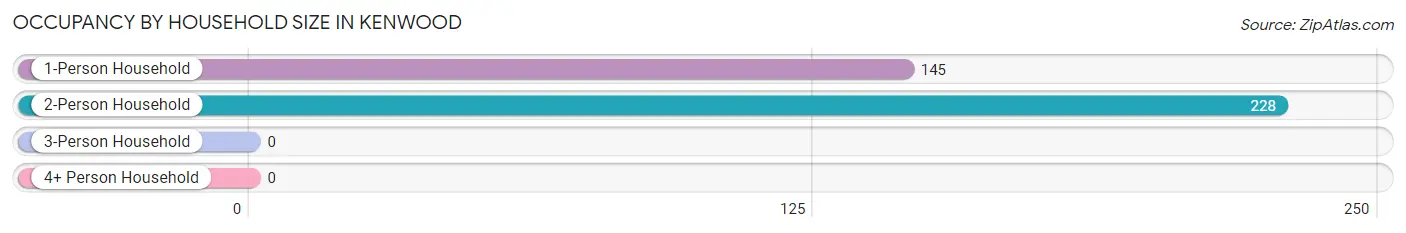
| Household Size | # Housing Units | % Housing Units |
| 1-Person Household | 145 | 38.9% |
| 2-Person Household | 228 | 61.1% |
| 3-Person Household | 0 | 0.0% |
| 4+ Person Household | 0 | 0.0% |
| Total Housing Units | 373 | 100.0% |
Occupancy by Ownership by Household Size in Kenwood
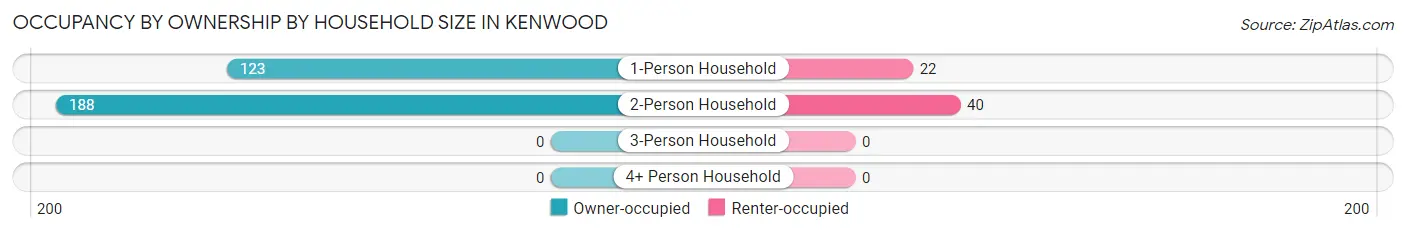
| Household Size | Owner-occupied | Renter-occupied |
| 1-Person Household | 123 (84.8%) | 22 (15.2%) |
| 2-Person Household | 188 (82.5%) | 40 (17.5%) |
| 3-Person Household | 0 (0.0%) | 0 (0.0%) |
| 4+ Person Household | 0 (0.0%) | 0 (0.0%) |
| Total Housing Units | 311 (83.4%) | 62 (16.6%) |
Occupancy by Educational Attainment in Kenwood
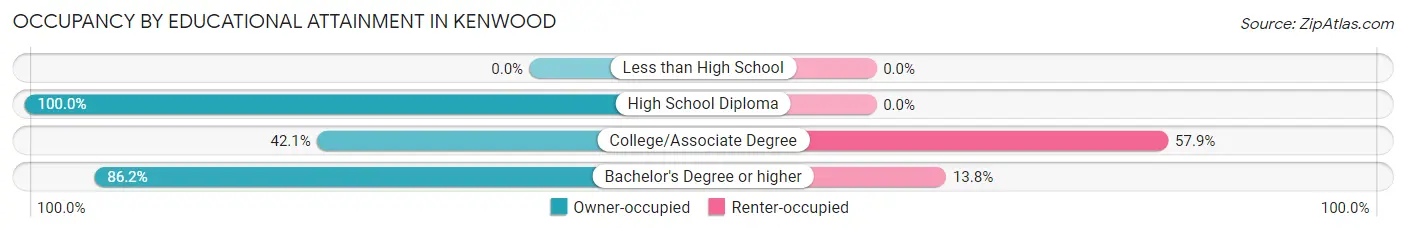
| Household Size | Owner-occupied | Renter-occupied |
| Less than High School | 0 (0.0%) | 0 (0.0%) |
| High School Diploma | 46 (100.0%) | 0 (0.0%) |
| College/Associate Degree | 16 (42.1%) | 22 (57.9%) |
| Bachelor's Degree or higher | 249 (86.2%) | 40 (13.8%) |
Occupancy by Age of Householder in Kenwood
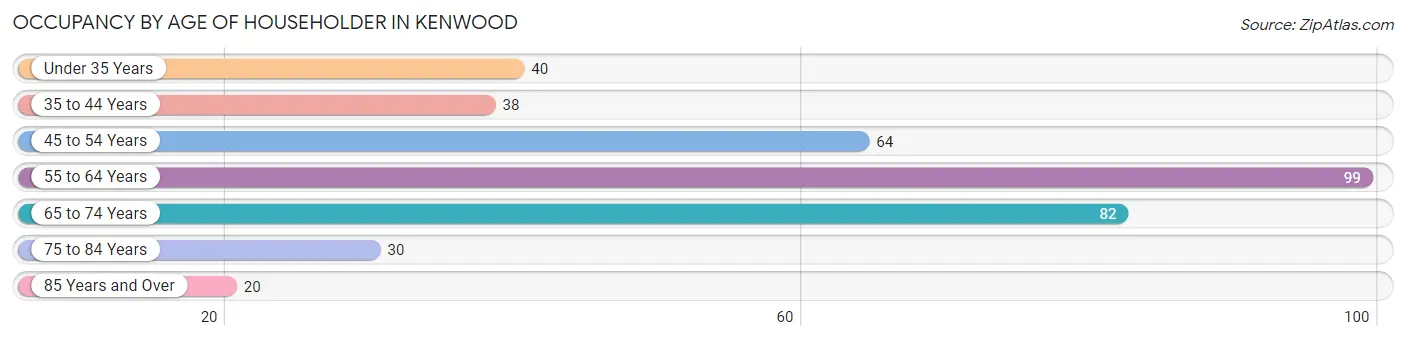
| Age Bracket | # Households | % Households |
| Under 35 Years | 40 | 10.7% |
| 35 to 44 Years | 38 | 10.2% |
| 45 to 54 Years | 64 | 17.2% |
| 55 to 64 Years | 99 | 26.5% |
| 65 to 74 Years | 82 | 22.0% |
| 75 to 84 Years | 30 | 8.0% |
| 85 Years and Over | 20 | 5.4% |
| Total | 373 | 100.0% |
Housing Finances in Kenwood
Median Income by Occupancy in Kenwood
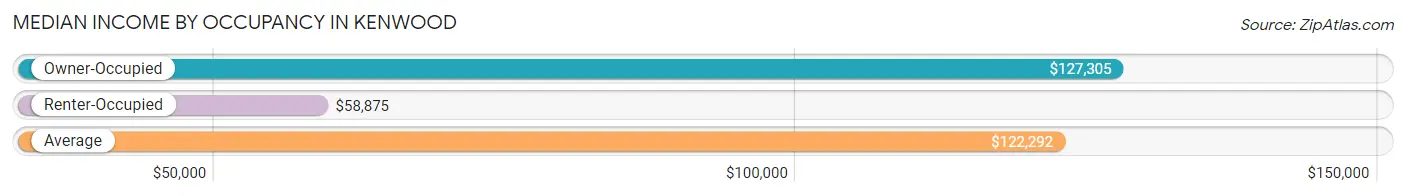
| Occupancy Type | # Households | Median Income |
| Owner-Occupied | 311 (83.4%) | $127,305 |
| Renter-Occupied | 62 (16.6%) | $58,875 |
| Average | 373 (100.0%) | $122,292 |
Occupancy by Householder Income Bracket in Kenwood
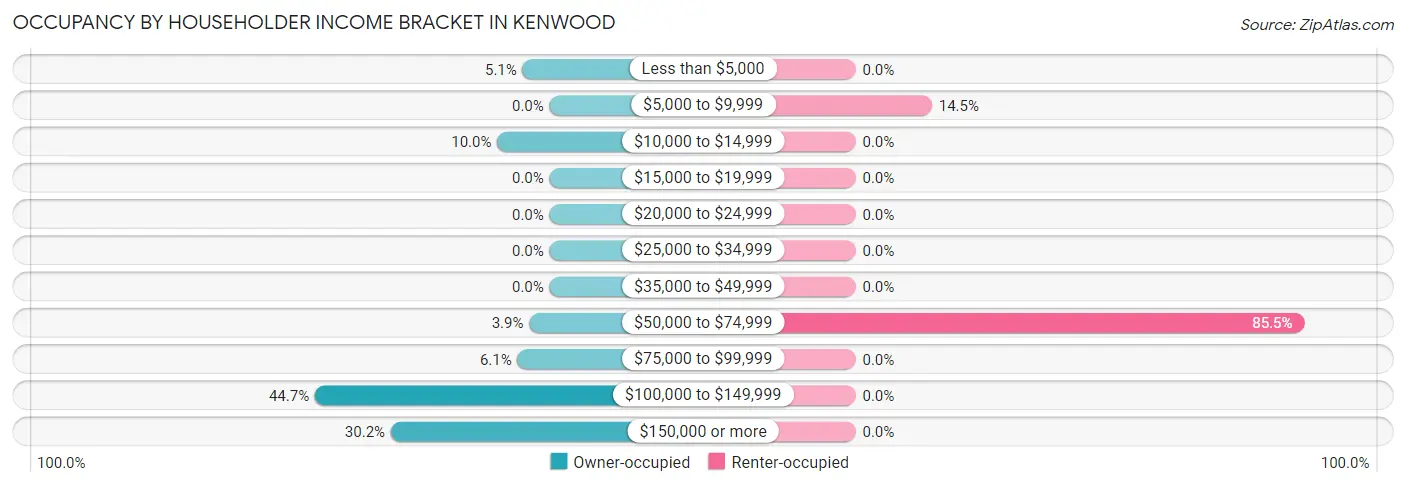
| Income Bracket | Owner-occupied | Renter-occupied |
| Less than $5,000 | 16 (5.1%) | 0 (0.0%) |
| $5,000 to $9,999 | 0 (0.0%) | 9 (14.5%) |
| $10,000 to $14,999 | 31 (10.0%) | 0 (0.0%) |
| $15,000 to $19,999 | 0 (0.0%) | 0 (0.0%) |
| $20,000 to $24,999 | 0 (0.0%) | 0 (0.0%) |
| $25,000 to $34,999 | 0 (0.0%) | 0 (0.0%) |
| $35,000 to $49,999 | 0 (0.0%) | 0 (0.0%) |
| $50,000 to $74,999 | 12 (3.9%) | 53 (85.5%) |
| $75,000 to $99,999 | 19 (6.1%) | 0 (0.0%) |
| $100,000 to $149,999 | 139 (44.7%) | 0 (0.0%) |
| $150,000 or more | 94 (30.2%) | 0 (0.0%) |
| Total | 311 (100.0%) | 62 (100.0%) |
Monthly Housing Cost Tiers in Kenwood
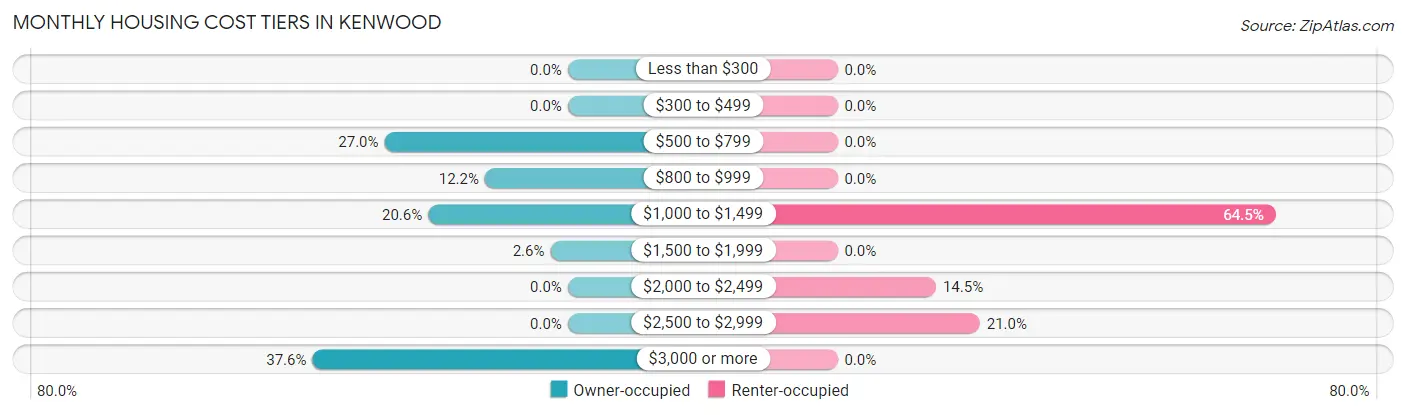
| Monthly Cost | Owner-occupied | Renter-occupied |
| Less than $300 | 0 (0.0%) | 0 (0.0%) |
| $300 to $499 | 0 (0.0%) | 0 (0.0%) |
| $500 to $799 | 84 (27.0%) | 0 (0.0%) |
| $800 to $999 | 38 (12.2%) | 0 (0.0%) |
| $1,000 to $1,499 | 64 (20.6%) | 40 (64.5%) |
| $1,500 to $1,999 | 8 (2.6%) | 0 (0.0%) |
| $2,000 to $2,499 | 0 (0.0%) | 9 (14.5%) |
| $2,500 to $2,999 | 0 (0.0%) | 13 (21.0%) |
| $3,000 or more | 117 (37.6%) | 0 (0.0%) |
| Total | 311 (100.0%) | 62 (100.0%) |
Physical Housing Characteristics in Kenwood
Housing Structures in Kenwood
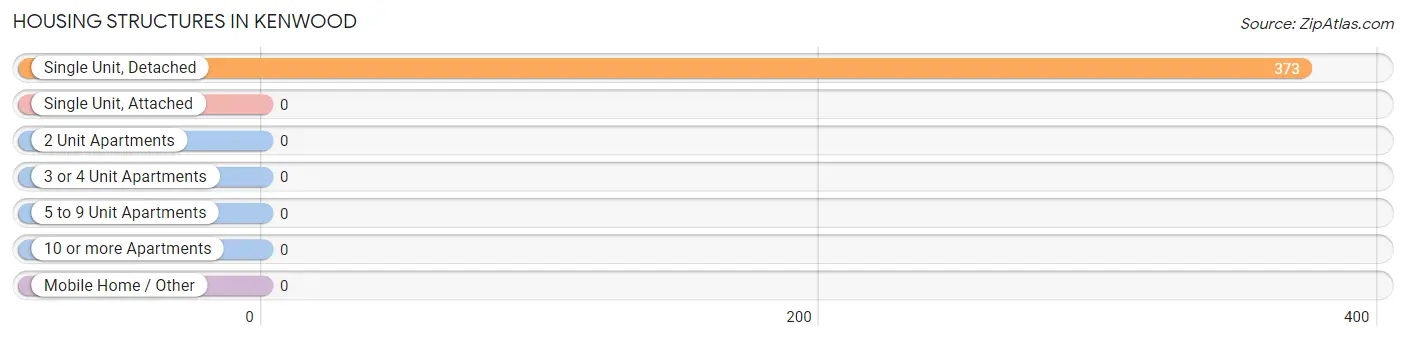
| Structure Type | # Housing Units | % Housing Units |
| Single Unit, Detached | 373 | 100.0% |
| Single Unit, Attached | 0 | 0.0% |
| 2 Unit Apartments | 0 | 0.0% |
| 3 or 4 Unit Apartments | 0 | 0.0% |
| 5 to 9 Unit Apartments | 0 | 0.0% |
| 10 or more Apartments | 0 | 0.0% |
| Mobile Home / Other | 0 | 0.0% |
| Total | 373 | 100.0% |
Housing Structures by Occupancy in Kenwood
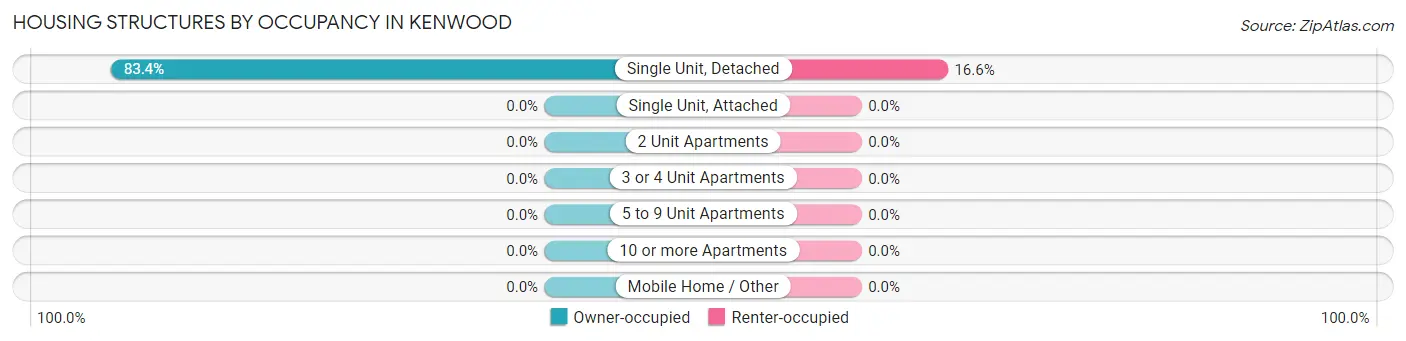
| Structure Type | Owner-occupied | Renter-occupied |
| Single Unit, Detached | 311 (83.4%) | 62 (16.6%) |
| Single Unit, Attached | 0 (0.0%) | 0 (0.0%) |
| 2 Unit Apartments | 0 (0.0%) | 0 (0.0%) |
| 3 or 4 Unit Apartments | 0 (0.0%) | 0 (0.0%) |
| 5 to 9 Unit Apartments | 0 (0.0%) | 0 (0.0%) |
| 10 or more Apartments | 0 (0.0%) | 0 (0.0%) |
| Mobile Home / Other | 0 (0.0%) | 0 (0.0%) |
| Total | 311 (83.4%) | 62 (16.6%) |
Housing Structures by Number of Rooms in Kenwood
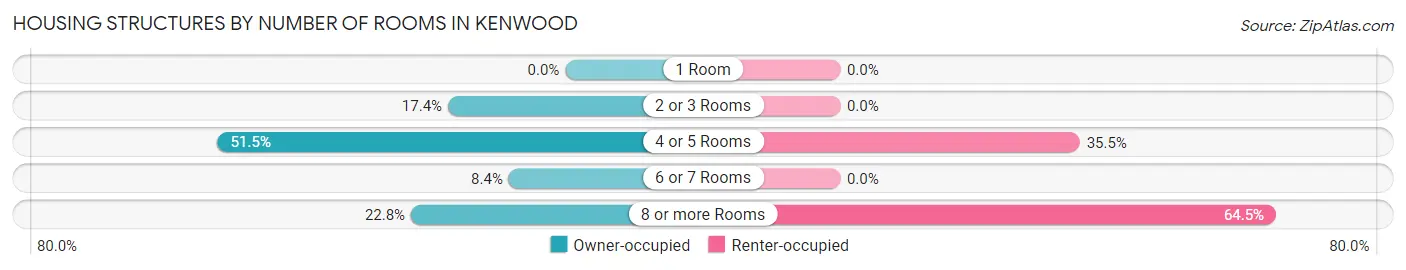
| Number of Rooms | Owner-occupied | Renter-occupied |
| 1 Room | 0 (0.0%) | 0 (0.0%) |
| 2 or 3 Rooms | 54 (17.4%) | 0 (0.0%) |
| 4 or 5 Rooms | 160 (51.4%) | 22 (35.5%) |
| 6 or 7 Rooms | 26 (8.4%) | 0 (0.0%) |
| 8 or more Rooms | 71 (22.8%) | 40 (64.5%) |
| Total | 311 (100.0%) | 62 (100.0%) |
Housing Structure by Heating Type in Kenwood
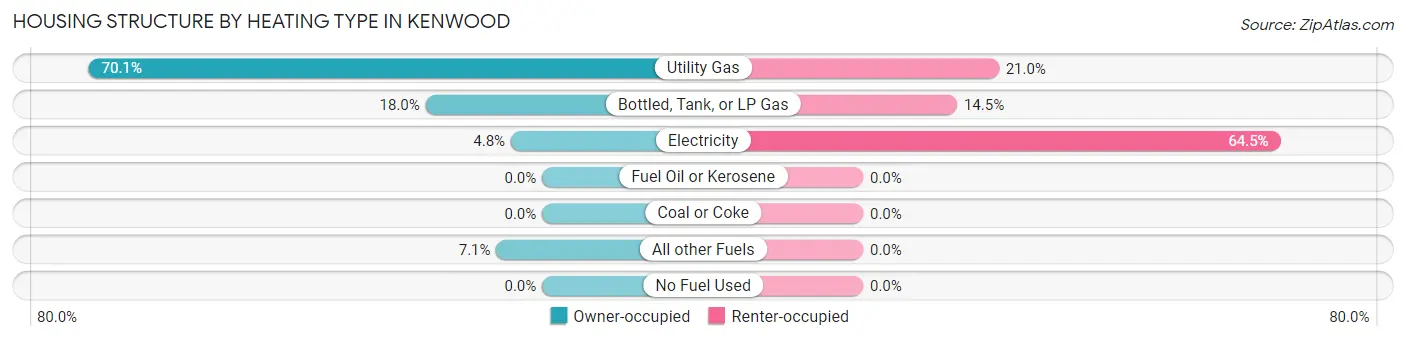
| Heating Type | Owner-occupied | Renter-occupied |
| Utility Gas | 218 (70.1%) | 13 (21.0%) |
| Bottled, Tank, or LP Gas | 56 (18.0%) | 9 (14.5%) |
| Electricity | 15 (4.8%) | 40 (64.5%) |
| Fuel Oil or Kerosene | 0 (0.0%) | 0 (0.0%) |
| Coal or Coke | 0 (0.0%) | 0 (0.0%) |
| All other Fuels | 22 (7.1%) | 0 (0.0%) |
| No Fuel Used | 0 (0.0%) | 0 (0.0%) |
| Total | 311 (100.0%) | 62 (100.0%) |
Household Vehicle Usage in Kenwood
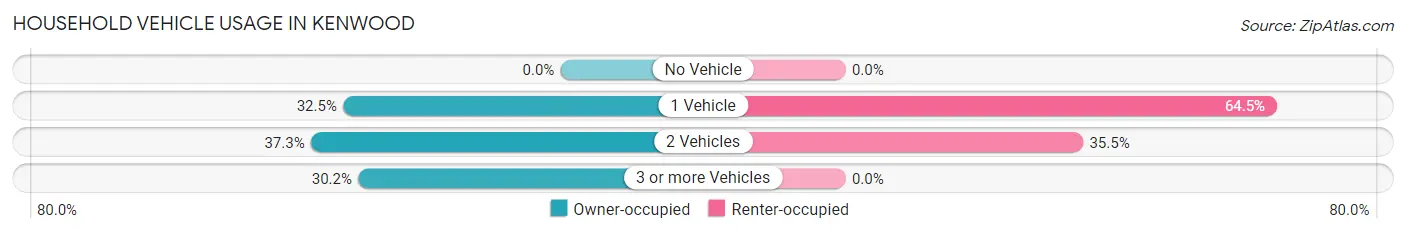
| Vehicles per Household | Owner-occupied | Renter-occupied |
| No Vehicle | 0 (0.0%) | 0 (0.0%) |
| 1 Vehicle | 101 (32.5%) | 40 (64.5%) |
| 2 Vehicles | 116 (37.3%) | 22 (35.5%) |
| 3 or more Vehicles | 94 (30.2%) | 0 (0.0%) |
| Total | 311 (100.0%) | 62 (100.0%) |
Real Estate & Mortgages in Kenwood
Real Estate and Mortgage Overview in Kenwood
| Characteristic | Without Mortgage | With Mortgage |
| Housing Units | 174 | 137 |
| Median Property Value | $810,300 | $1,052,100 |
| Median Household Income | $125,234 | $56 |
| Monthly Housing Costs | $908 | $117 |
| Real Estate Taxes | $6,471 | $0 |
Property Value by Mortgage Status in Kenwood
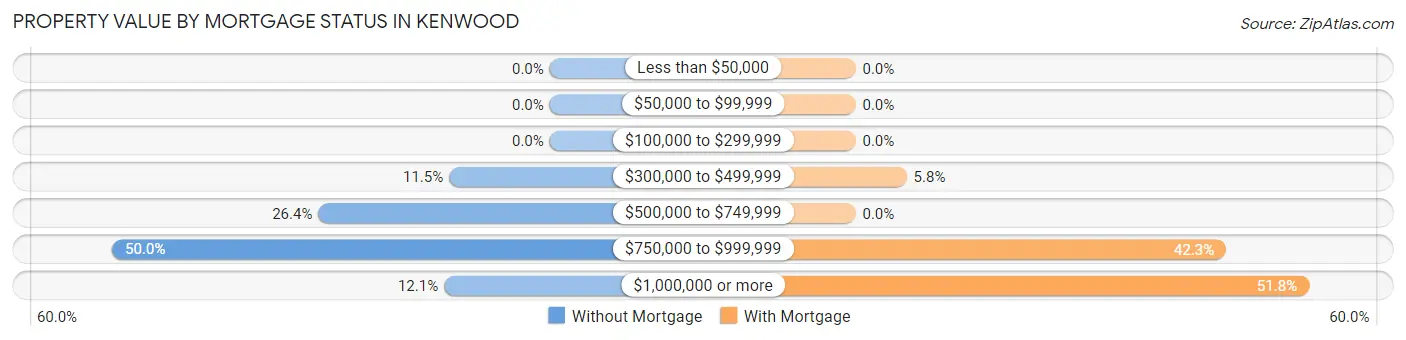
| Property Value | Without Mortgage | With Mortgage |
| Less than $50,000 | 0 (0.0%) | 0 (0.0%) |
| $50,000 to $99,999 | 0 (0.0%) | 0 (0.0%) |
| $100,000 to $299,999 | 0 (0.0%) | 0 (0.0%) |
| $300,000 to $499,999 | 20 (11.5%) | 8 (5.8%) |
| $500,000 to $749,999 | 46 (26.4%) | 0 (0.0%) |
| $750,000 to $999,999 | 87 (50.0%) | 58 (42.3%) |
| $1,000,000 or more | 21 (12.1%) | 71 (51.8%) |
| Total | 174 (100.0%) | 137 (100.0%) |
Household Income by Mortgage Status in Kenwood
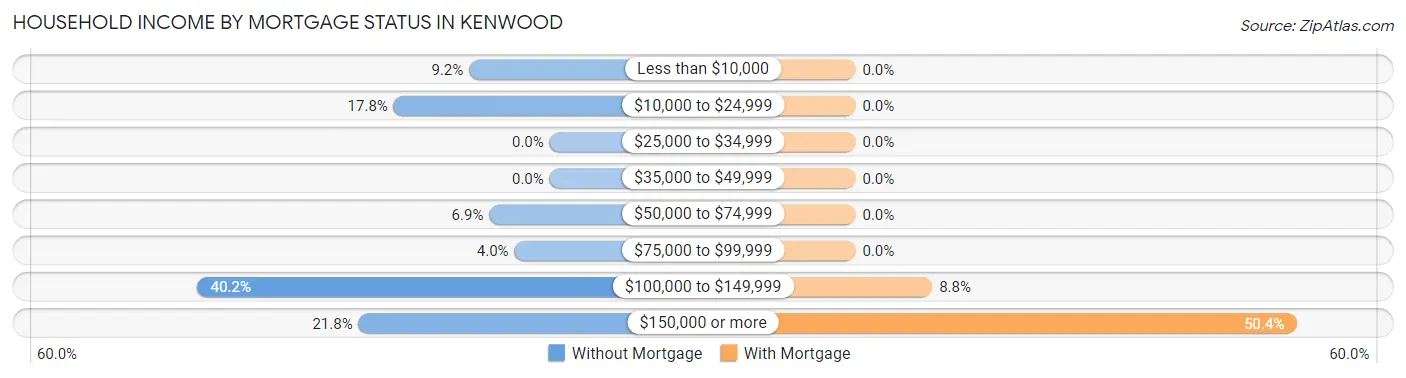
| Household Income | Without Mortgage | With Mortgage |
| Less than $10,000 | 16 (9.2%) | 0 (0.0%) |
| $10,000 to $24,999 | 31 (17.8%) | 0 (0.0%) |
| $25,000 to $34,999 | 0 (0.0%) | 0 (0.0%) |
| $35,000 to $49,999 | 0 (0.0%) | 0 (0.0%) |
| $50,000 to $74,999 | 12 (6.9%) | 0 (0.0%) |
| $75,000 to $99,999 | 7 (4.0%) | 0 (0.0%) |
| $100,000 to $149,999 | 70 (40.2%) | 12 (8.8%) |
| $150,000 or more | 38 (21.8%) | 69 (50.4%) |
| Total | 174 (100.0%) | 137 (100.0%) |
Property Value to Household Income Ratio in Kenwood
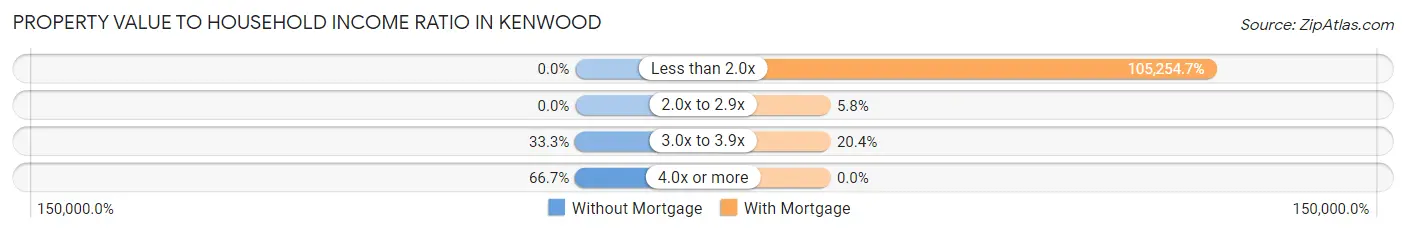
| Value-to-Income Ratio | Without Mortgage | With Mortgage |
| Less than 2.0x | 0 (0.0%) | 144,199 (105,254.7%) |
| 2.0x to 2.9x | 0 (0.0%) | 8 (5.8%) |
| 3.0x to 3.9x | 58 (33.3%) | 28 (20.4%) |
| 4.0x or more | 116 (66.7%) | 0 (0.0%) |
| Total | 174 (100.0%) | 137 (100.0%) |
Real Estate Taxes by Mortgage Status in Kenwood
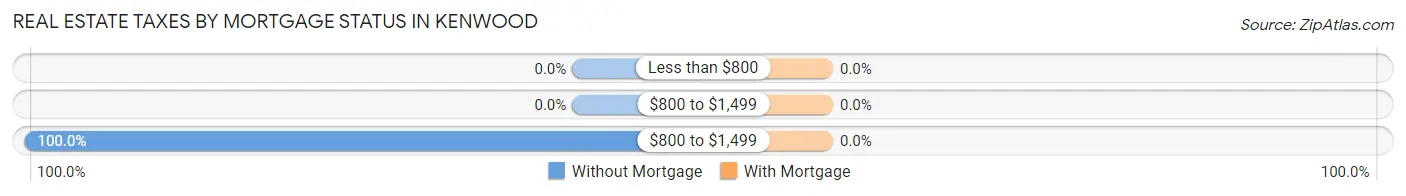
| Property Taxes | Without Mortgage | With Mortgage |
| Less than $800 | 0 (0.0%) | 0 (0.0%) |
| $800 to $1,499 | 0 (0.0%) | 0 (0.0%) |
| $800 to $1,499 | 174 (100.0%) | 0 (0.0%) |
| Total | 174 (100.0%) | 137 (100.0%) |
Health & Disability in Kenwood
Health Insurance Coverage by Age in Kenwood
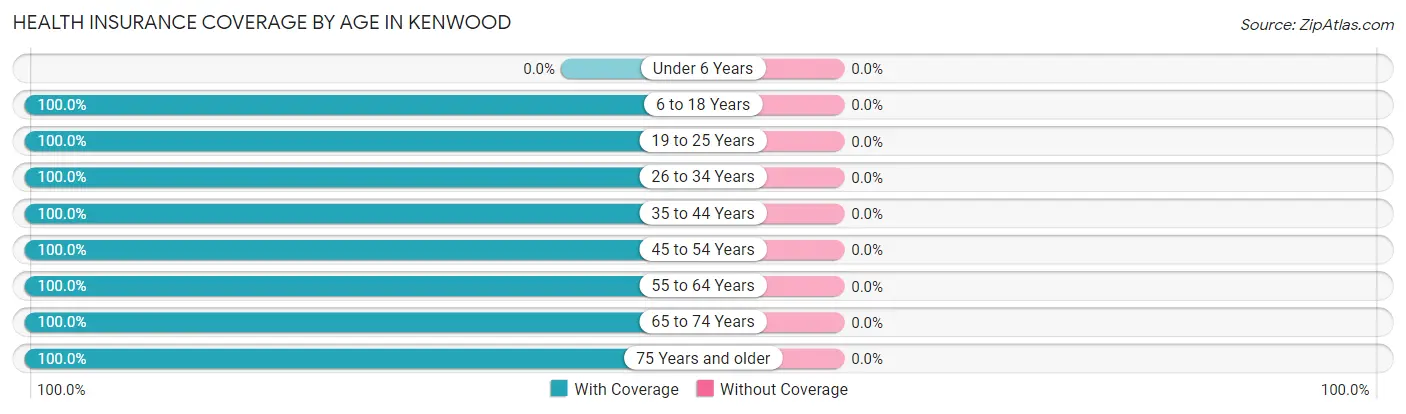
| Age Bracket | With Coverage | Without Coverage |
| Under 6 Years | 0 (0.0%) | 0 (0.0%) |
| 6 to 18 Years | 47 (100.0%) | 0 (0.0%) |
| 19 to 25 Years | 19 (100.0%) | 0 (0.0%) |
| 26 to 34 Years | 40 (100.0%) | 0 (0.0%) |
| 35 to 44 Years | 82 (100.0%) | 0 (0.0%) |
| 45 to 54 Years | 94 (100.0%) | 0 (0.0%) |
| 55 to 64 Years | 114 (100.0%) | 0 (0.0%) |
| 65 to 74 Years | 110 (100.0%) | 0 (0.0%) |
| 75 Years and older | 103 (100.0%) | 0 (0.0%) |
| Total | 609 (100.0%) | 0 (0.0%) |
Health Insurance Coverage by Citizenship Status in Kenwood
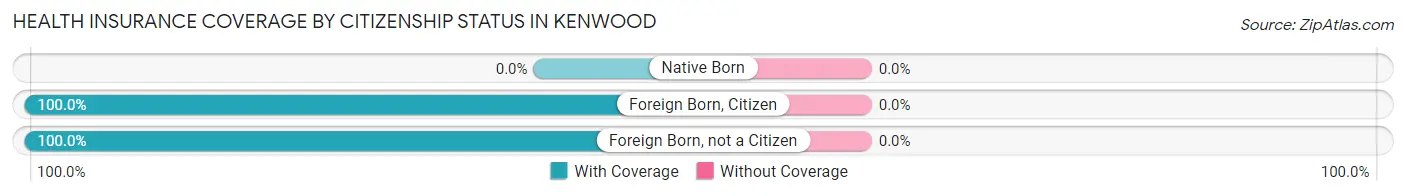
| Citizenship Status | With Coverage | Without Coverage |
| Native Born | 0 (0.0%) | 0 (0.0%) |
| Foreign Born, Citizen | 47 (100.0%) | 0 (0.0%) |
| Foreign Born, not a Citizen | 19 (100.0%) | 0 (0.0%) |
Health Insurance Coverage by Household Income in Kenwood
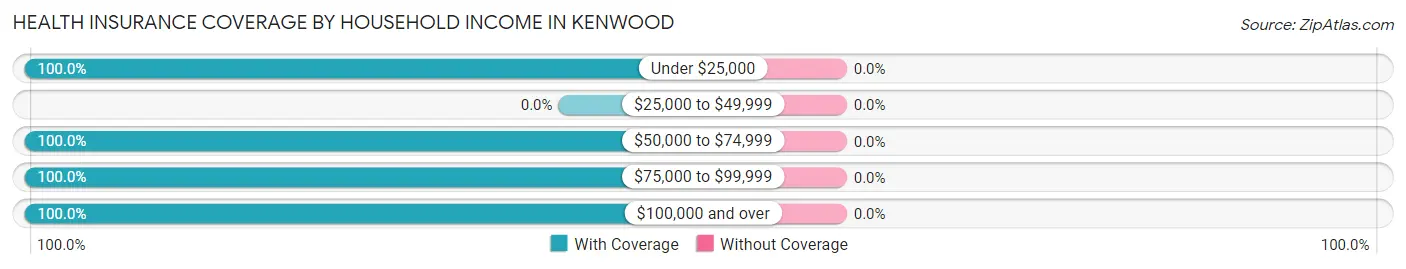
| Household Income | With Coverage | Without Coverage |
| Under $25,000 | 56 (100.0%) | 0 (0.0%) |
| $25,000 to $49,999 | 0 (0.0%) | 0 (0.0%) |
| $50,000 to $74,999 | 104 (100.0%) | 0 (0.0%) |
| $75,000 to $99,999 | 42 (100.0%) | 0 (0.0%) |
| $100,000 and over | 392 (100.0%) | 0 (0.0%) |
Public vs Private Health Insurance Coverage by Age in Kenwood
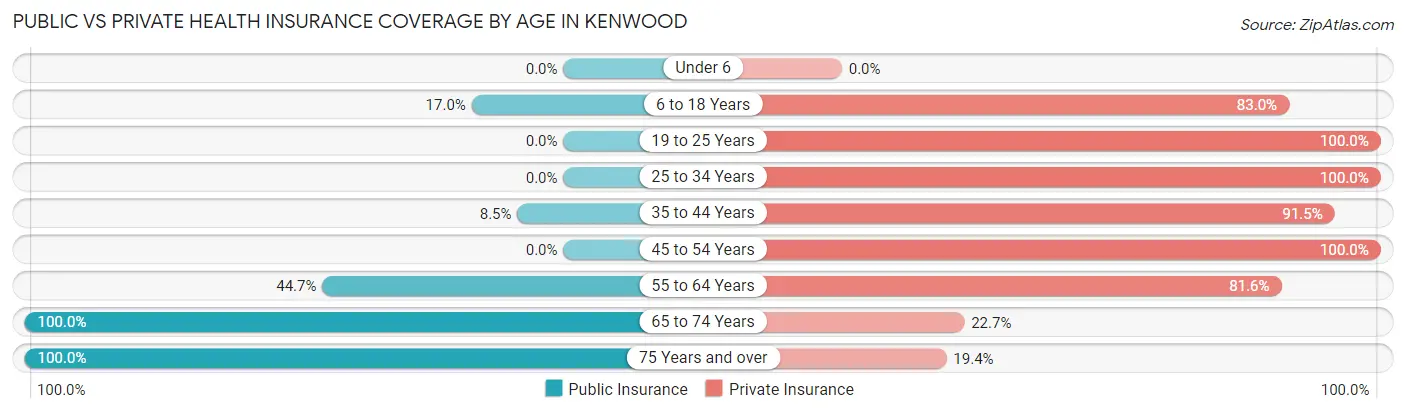
| Age Bracket | Public Insurance | Private Insurance |
| Under 6 | 0 (0.0%) | 0 (0.0%) |
| 6 to 18 Years | 8 (17.0%) | 39 (83.0%) |
| 19 to 25 Years | 0 (0.0%) | 19 (100.0%) |
| 25 to 34 Years | 0 (0.0%) | 40 (100.0%) |
| 35 to 44 Years | 7 (8.5%) | 75 (91.5%) |
| 45 to 54 Years | 0 (0.0%) | 94 (100.0%) |
| 55 to 64 Years | 51 (44.7%) | 93 (81.6%) |
| 65 to 74 Years | 110 (100.0%) | 25 (22.7%) |
| 75 Years and over | 103 (100.0%) | 20 (19.4%) |
| Total | 279 (45.8%) | 405 (66.5%) |
Disability Status by Sex by Age in Kenwood
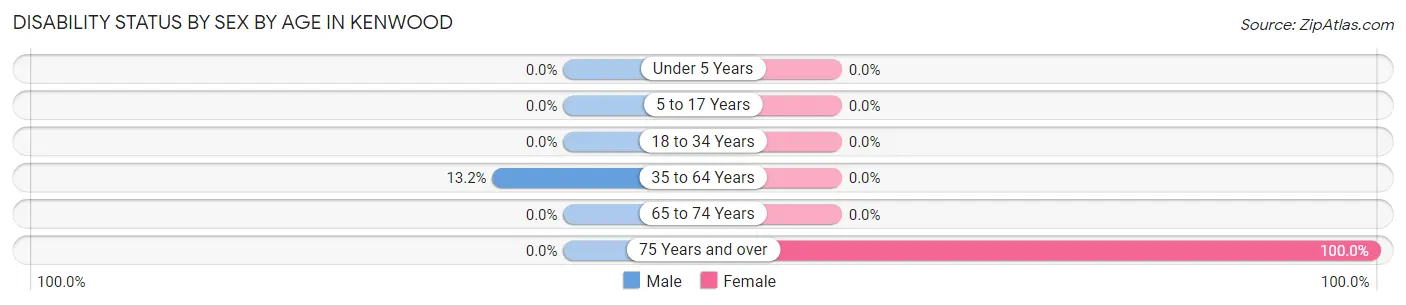
| Age Bracket | Male | Female |
| Under 5 Years | 0 (0.0%) | 0 (0.0%) |
| 5 to 17 Years | 0 (0.0%) | 0 (0.0%) |
| 18 to 34 Years | 0 (0.0%) | 0 (0.0%) |
| 35 to 64 Years | 15 (13.2%) | 0 (0.0%) |
| 65 to 74 Years | 0 (0.0%) | 0 (0.0%) |
| 75 Years and over | 0 (0.0%) | 38 (100.0%) |
Disability Class by Sex by Age in Kenwood
Disability Class: Hearing Difficulty
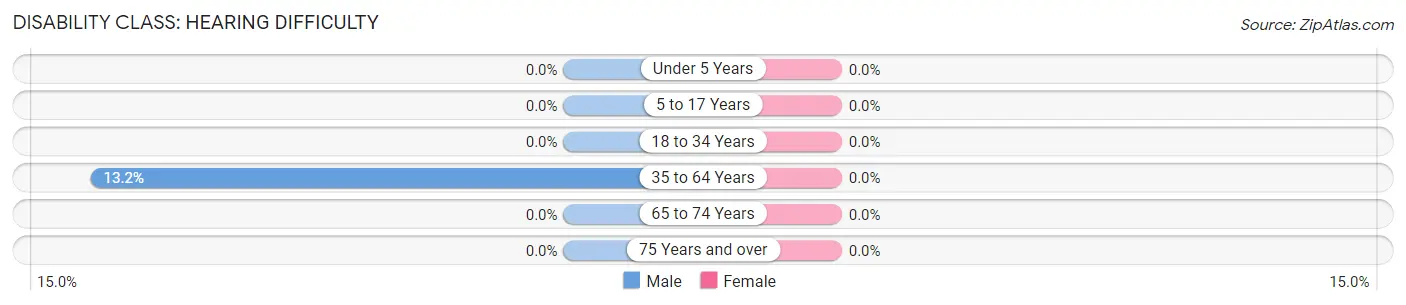
| Age Bracket | Male | Female |
| Under 5 Years | 0 (0.0%) | 0 (0.0%) |
| 5 to 17 Years | 0 (0.0%) | 0 (0.0%) |
| 18 to 34 Years | 0 (0.0%) | 0 (0.0%) |
| 35 to 64 Years | 15 (13.2%) | 0 (0.0%) |
| 65 to 74 Years | 0 (0.0%) | 0 (0.0%) |
| 75 Years and over | 0 (0.0%) | 0 (0.0%) |
Disability Class: Vision Difficulty
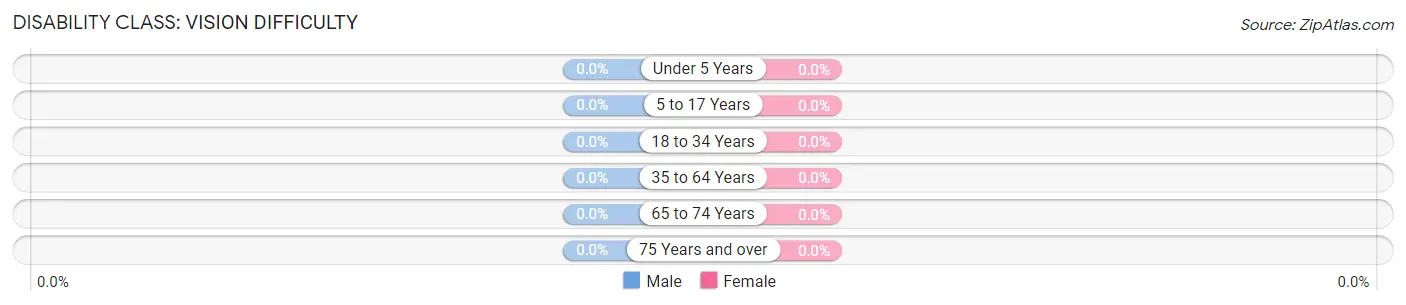
| Age Bracket | Male | Female |
| Under 5 Years | 0 (0.0%) | 0 (0.0%) |
| 5 to 17 Years | 0 (0.0%) | 0 (0.0%) |
| 18 to 34 Years | 0 (0.0%) | 0 (0.0%) |
| 35 to 64 Years | 0 (0.0%) | 0 (0.0%) |
| 65 to 74 Years | 0 (0.0%) | 0 (0.0%) |
| 75 Years and over | 0 (0.0%) | 0 (0.0%) |
Disability Class: Cognitive Difficulty
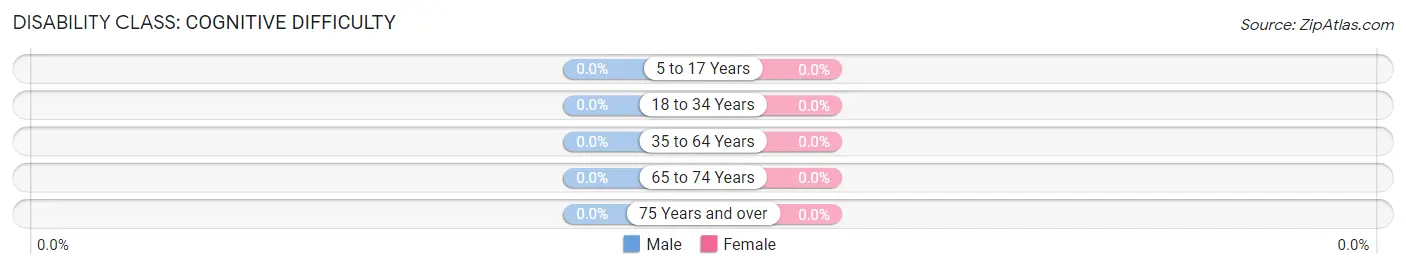
| Age Bracket | Male | Female |
| 5 to 17 Years | 0 (0.0%) | 0 (0.0%) |
| 18 to 34 Years | 0 (0.0%) | 0 (0.0%) |
| 35 to 64 Years | 0 (0.0%) | 0 (0.0%) |
| 65 to 74 Years | 0 (0.0%) | 0 (0.0%) |
| 75 Years and over | 0 (0.0%) | 0 (0.0%) |
Disability Class: Ambulatory Difficulty
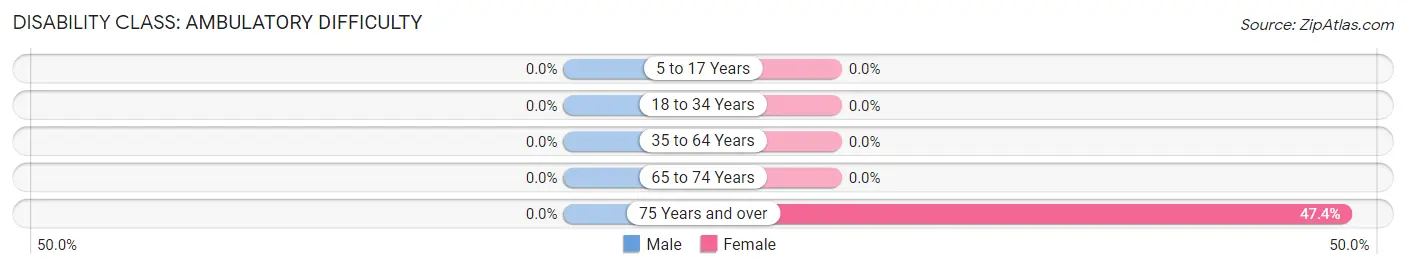
| Age Bracket | Male | Female |
| 5 to 17 Years | 0 (0.0%) | 0 (0.0%) |
| 18 to 34 Years | 0 (0.0%) | 0 (0.0%) |
| 35 to 64 Years | 0 (0.0%) | 0 (0.0%) |
| 65 to 74 Years | 0 (0.0%) | 0 (0.0%) |
| 75 Years and over | 0 (0.0%) | 18 (47.4%) |
Disability Class: Self-Care Difficulty
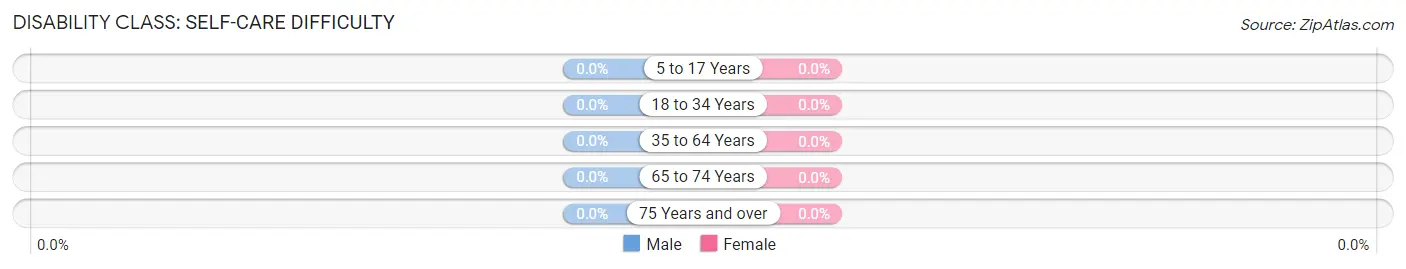
| Age Bracket | Male | Female |
| 5 to 17 Years | 0 (0.0%) | 0 (0.0%) |
| 18 to 34 Years | 0 (0.0%) | 0 (0.0%) |
| 35 to 64 Years | 0 (0.0%) | 0 (0.0%) |
| 65 to 74 Years | 0 (0.0%) | 0 (0.0%) |
| 75 Years and over | 0 (0.0%) | 0 (0.0%) |
Technology Access in Kenwood
Computing Device Access in Kenwood
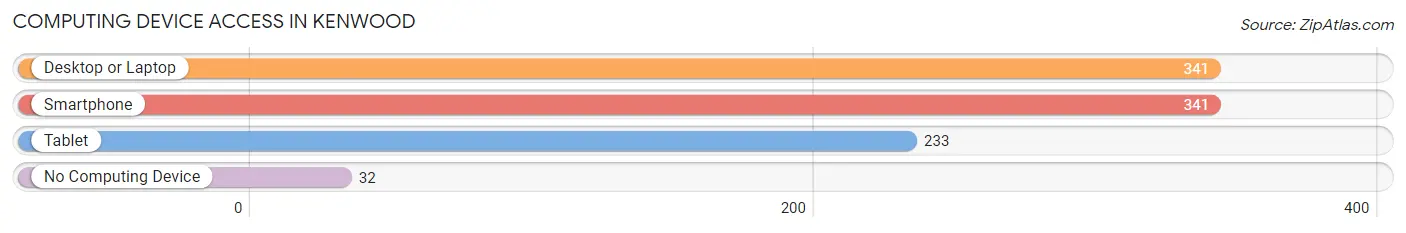
| Device Type | # Households | % Households |
| Desktop or Laptop | 341 | 91.4% |
| Smartphone | 341 | 91.4% |
| Tablet | 233 | 62.5% |
| No Computing Device | 32 | 8.6% |
| Total | 373 | 100.0% |
Internet Access in Kenwood
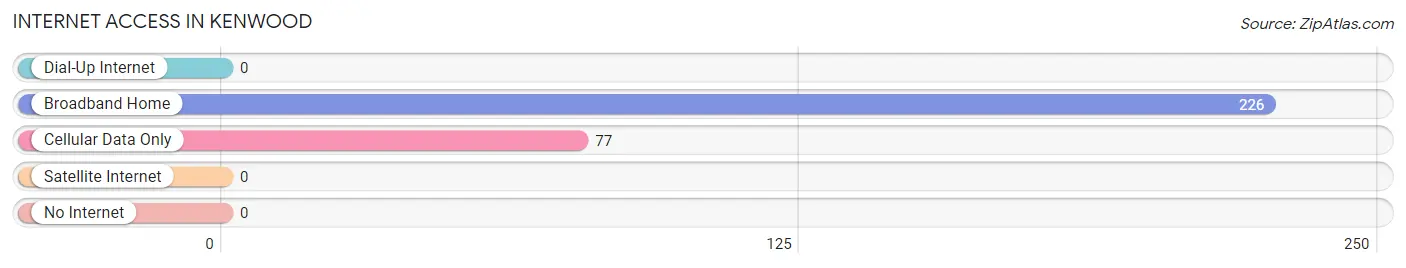
| Internet Type | # Households | % Households |
| Dial-Up Internet | 0 | 0.0% |
| Broadband Home | 226 | 60.6% |
| Cellular Data Only | 77 | 20.6% |
| Satellite Internet | 0 | 0.0% |
| No Internet | 0 | 0.0% |
| Total | 373 | 100.0% |
Kenwood Summary
Kenwood is a small unincorporated community located in Sonoma County, California. It is situated in the heart of the Sonoma Valley, just north of the city of Santa Rosa. The population of Kenwood was estimated to be 1,845 in 2019.
History
Kenwood was originally inhabited by the Coast Miwok Native Americans. The first European settlers arrived in the area in the mid-1800s. The town was named after a local landowner, William Kenwood, who purchased the land in 1871. The town was officially established in 1877.
In the early 1900s, Kenwood was a popular tourist destination due to its proximity to the nearby wineries. The town was also known for its mineral springs, which were believed to have healing properties.
Geography
Kenwood is located in the Sonoma Valley, which is part of the larger North Bay region of the San Francisco Bay Area. The town is situated at the base of the Mayacamas Mountains, which form the eastern boundary of the valley. The town is surrounded by vineyards and rolling hills.
The climate in Kenwood is Mediterranean, with warm, dry summers and mild, wet winters. The average annual temperature is around 60°F (15°C).
Economy
The economy of Kenwood is largely based on tourism and agriculture. The town is home to several wineries, which attract visitors from all over the world. The town is also home to several small businesses, including restaurants, shops, and galleries.
Demographics
As of 2019, the population of Kenwood was estimated to be 1,845. The racial makeup of the town was 79.3% White, 0.7% African American, 0.3% Native American, 0.7% Asian, 0.1% Pacific Islander, and 18.0% from other races. The median household income was $68,958, and the median age was 44.
Conclusion
Kenwood is a small unincorporated community located in Sonoma County, California. It is situated in the heart of the Sonoma Valley, just north of the city of Santa Rosa. The town was originally inhabited by the Coast Miwok Native Americans and was officially established in 1877. The economy of Kenwood is largely based on tourism and agriculture, and the population of the town was estimated to be 1,845 in 2019.
Common Questions
What is Per Capita Income in Kenwood?
Per Capita income in Kenwood is $83,268.
What is the Median Family Income in Kenwood?
Median Family Income in Kenwood is $198,083.
What is the Median Household income in Kenwood?
Median Household Income in Kenwood is $122,292.
What is Inequality or Gini Index in Kenwood?
Inequality or Gini Index in Kenwood is 0.42.
What is the Total Population of Kenwood?
Total Population of Kenwood is 609.
What is the Total Male Population of Kenwood?
Total Male Population of Kenwood is 205.
What is the Total Female Population of Kenwood?
Total Female Population of Kenwood is 404.
What is the Ratio of Males per 100 Females in Kenwood?
There are 50.74 Males per 100 Females in Kenwood.
What is the Ratio of Females per 100 Males in Kenwood?
There are 197.07 Females per 100 Males in Kenwood.
What is the Median Population Age in Kenwood?
Median Population Age in Kenwood is 56.3 Years.
What is the Average Family Size in Kenwood
Average Family Size in Kenwood is 2.0 People.
What is the Average Household Size in Kenwood
Average Household Size in Kenwood is 1.6 People.
How Large is the Labor Force in Kenwood?
There are 361 People in the Labor Forcein in Kenwood.
What is the Percentage of People in the Labor Force in Kenwood?
63.3% of People are in the Labor Force in Kenwood.