Bolinas, CA Map & Demographics
Bolinas Map
Bolinas Overview
$88,127
PER CAPITA INCOME
$185,134
AVG FAMILY INCOME
$99,191
AVG HOUSEHOLD INCOME
66.3%
WAGE / INCOME GAP [ % ]
33.7¢/ $1
WAGE / INCOME GAP [ $ ]
0.55
INEQUALITY / GINI INDEX
1,280
TOTAL POPULATION
684
MALE POPULATION
596
FEMALE POPULATION
114.77
MALES / 100 FEMALES
87.13
FEMALES / 100 MALES
65.4
MEDIAN AGE
2.5
AVG FAMILY SIZE
2.2
AVG HOUSEHOLD SIZE
658
LABOR FORCE [ PEOPLE ]
55.8%
PERCENT IN LABOR FORCE
2.3%
UNEMPLOYMENT RATE
Bolinas Zip Codes
Bolinas Area Codes
Income in Bolinas
Income Overview in Bolinas
Per Capita Income in Bolinas is $88,127, while median incomes of families and households are $185,134 and $99,191 respectively.
| Characteristic | Number | Measure |
| Per Capita Income | 1,280 | $88,127 |
| Median Family Income | 271 | $185,134 |
| Mean Family Income | 271 | $224,354 |
| Median Household Income | 571 | $99,191 |
| Mean Household Income | 571 | $190,334 |
| Income Deficit | 271 | $0 |
| Wage / Income Gap (%) | 1,280 | 66.29% |
| Wage / Income Gap ($) | 1,280 | 33.71¢ per $1 |
| Gini / Inequality Index | 1,280 | 0.55 |
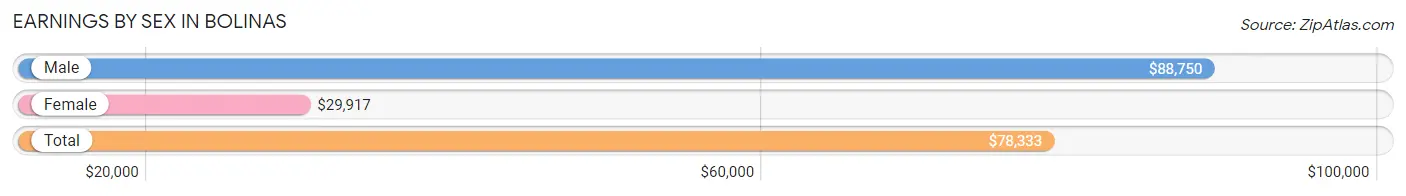
Earnings by Sex in Bolinas
Average Earnings in Bolinas are $78,333, $88,750 for men and $29,917 for women, a difference of 66.3%.
| Sex | Number | Average Earnings |
| Male | 435 (61.3%) | $88,750 |
| Female | 275 (38.7%) | $29,917 |
| Total | 710 (100.0%) | $78,333 |
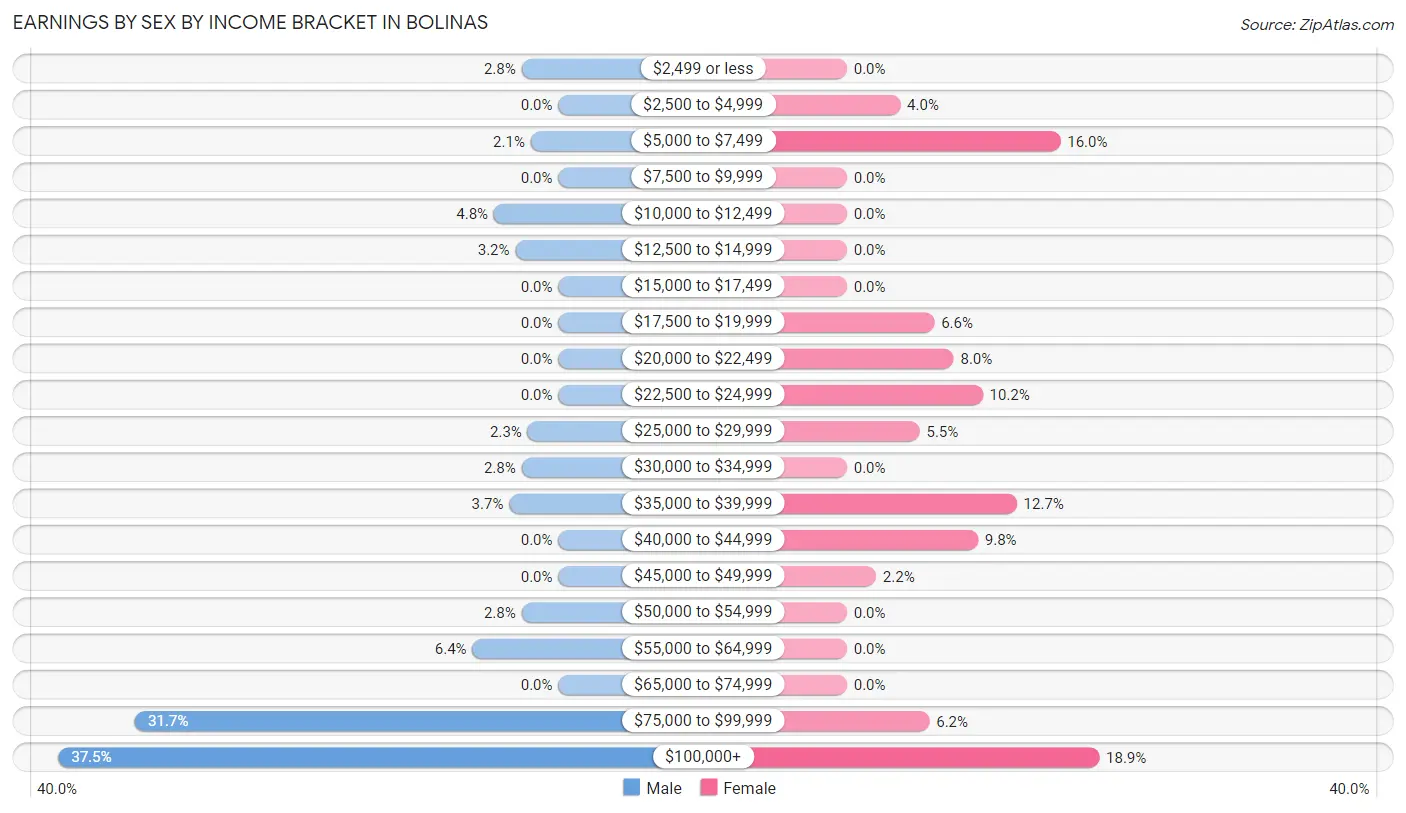
Earnings by Sex by Income Bracket in Bolinas
The most common earnings brackets in Bolinas are $100,000+ for men (163 | 37.5%) and $100,000+ for women (52 | 18.9%).
| Income | Male | Female |
| $2,499 or less | 12 (2.8%) | 0 (0.0%) |
| $2,500 to $4,999 | 0 (0.0%) | 11 (4.0%) |
| $5,000 to $7,499 | 9 (2.1%) | 44 (16.0%) |
| $7,500 to $9,999 | 0 (0.0%) | 0 (0.0%) |
| $10,000 to $12,499 | 21 (4.8%) | 0 (0.0%) |
| $12,500 to $14,999 | 14 (3.2%) | 0 (0.0%) |
| $15,000 to $17,499 | 0 (0.0%) | 0 (0.0%) |
| $17,500 to $19,999 | 0 (0.0%) | 18 (6.6%) |
| $20,000 to $22,499 | 0 (0.0%) | 22 (8.0%) |
| $22,500 to $24,999 | 0 (0.0%) | 28 (10.2%) |
| $25,000 to $29,999 | 10 (2.3%) | 15 (5.4%) |
| $30,000 to $34,999 | 12 (2.8%) | 0 (0.0%) |
| $35,000 to $39,999 | 16 (3.7%) | 35 (12.7%) |
| $40,000 to $44,999 | 0 (0.0%) | 27 (9.8%) |
| $45,000 to $49,999 | 0 (0.0%) | 6 (2.2%) |
| $50,000 to $54,999 | 12 (2.8%) | 0 (0.0%) |
| $55,000 to $64,999 | 28 (6.4%) | 0 (0.0%) |
| $65,000 to $74,999 | 0 (0.0%) | 0 (0.0%) |
| $75,000 to $99,999 | 138 (31.7%) | 17 (6.2%) |
| $100,000+ | 163 (37.5%) | 52 (18.9%) |
| Total | 435 (100.0%) | 275 (100.0%) |
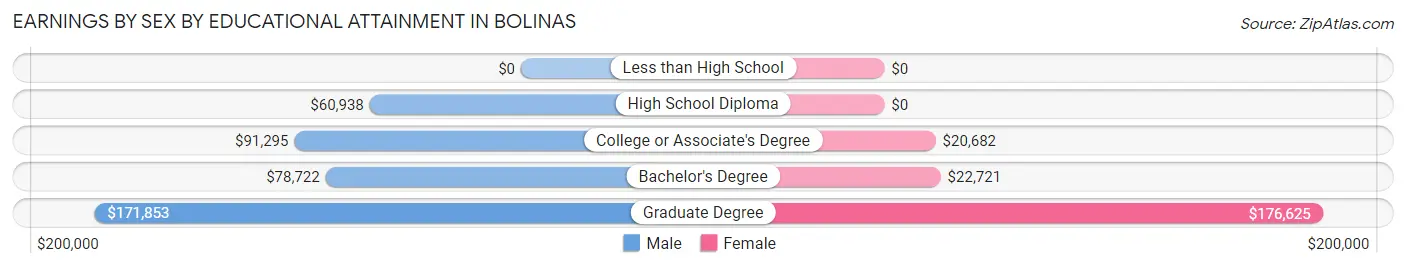
Earnings by Sex by Educational Attainment in Bolinas
Average earnings in Bolinas are $88,750 for men and $29,917 for women, a difference of 66.3%. Men with an educational attainment of graduate degree enjoy the highest average annual earnings of $171,853, while those with high school diploma education earn the least with $60,938. Women with an educational attainment of graduate degree earn the most with the average annual earnings of $176,625, while those with college or associate's degree education have the smallest earnings of $20,682.
| Educational Attainment | Male Income | Female Income |
| Less than High School | - | - |
| High School Diploma | $60,938 | $0 |
| College or Associate's Degree | $91,295 | $20,682 |
| Bachelor's Degree | $78,722 | $22,721 |
| Graduate Degree | $171,853 | $176,625 |
| Total | $88,750 | $29,917 |
Family Income in Bolinas
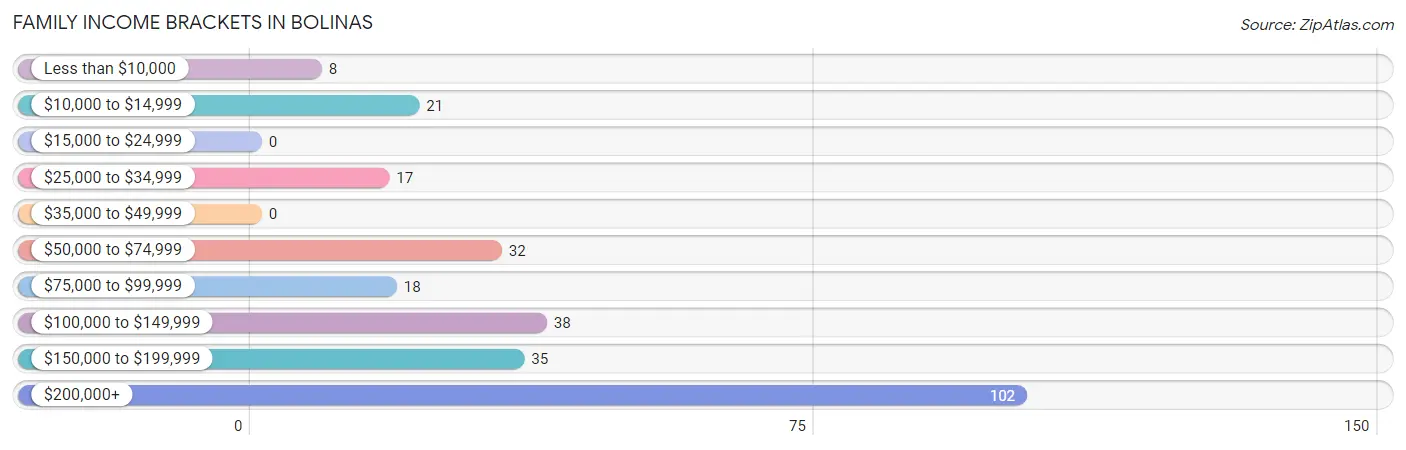
Family Income Brackets in Bolinas
According to the Bolinas family income data, there are 102 families falling into the $200,000+ income range, which is the most common income bracket and makes up 37.6% of all families.
| Income Bracket | # Families | % Families |
| Less than $10,000 | 8 | 3.0% |
| $10,000 to $14,999 | 21 | 7.7% |
| $15,000 to $24,999 | 0 | 0.0% |
| $25,000 to $34,999 | 17 | 6.3% |
| $35,000 to $49,999 | 0 | 0.0% |
| $50,000 to $74,999 | 32 | 11.8% |
| $75,000 to $99,999 | 18 | 6.6% |
| $100,000 to $149,999 | 38 | 14.0% |
| $150,000 to $199,999 | 35 | 12.9% |
| $200,000+ | 102 | 37.6% |
Family Income by Famaliy Size in Bolinas
| Income Bracket | # Families | Median Income |
| 2-Person Families | 193 (71.2%) | $0 |
| 3-Person Families | 24 (8.9%) | $0 |
| 4-Person Families | 48 (17.7%) | $0 |
| 5-Person Families | 0 (0.0%) | $0 |
| 6-Person Families | 0 (0.0%) | $0 |
| 7+ Person Families | 6 (2.2%) | $0 |
| Total | 271 (100.0%) | $185,134 |
Family Income by Number of Earners in Bolinas
| Number of Earners | # Families | Median Income |
| No Earners | 8 (2.9%) | $0 |
| 1 Earner | 203 (74.9%) | $0 |
| 2 Earners | 25 (9.2%) | $0 |
| 3+ Earners | 35 (12.9%) | $0 |
| Total | 271 (100.0%) | $185,134 |
Household Income in Bolinas
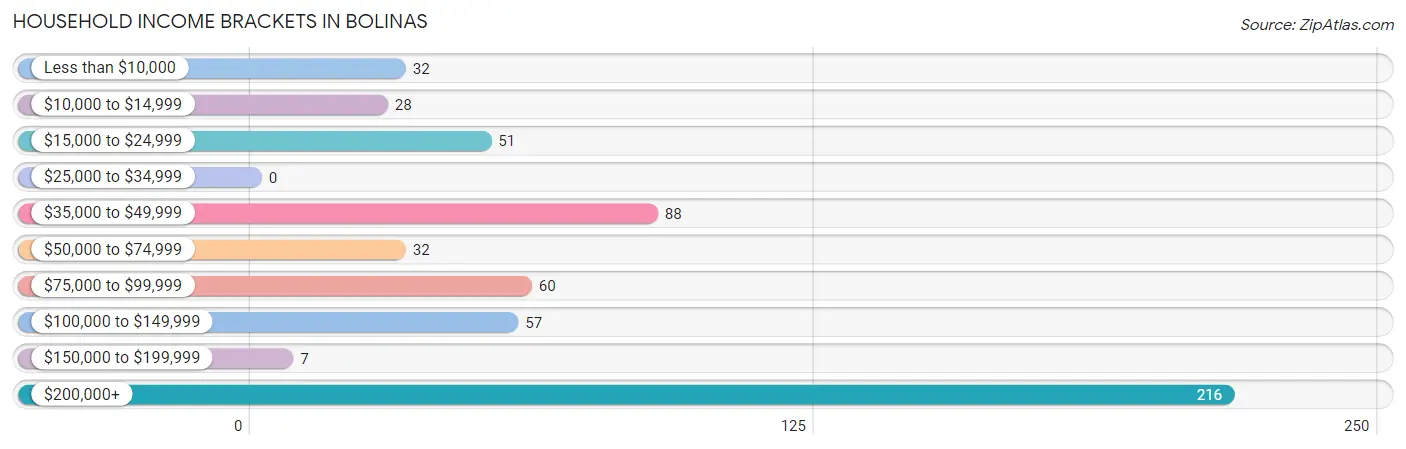
Household Income Brackets in Bolinas
With 216 households falling in the category, the $200,000+ income range is the most frequent in Bolinas, accounting for 37.8% of all households.
| Income Bracket | # Households | % Households |
| Less than $10,000 | 32 | 5.6% |
| $10,000 to $14,999 | 28 | 4.9% |
| $15,000 to $24,999 | 51 | 8.9% |
| $25,000 to $34,999 | 0 | 0.0% |
| $35,000 to $49,999 | 88 | 15.4% |
| $50,000 to $74,999 | 32 | 5.6% |
| $75,000 to $99,999 | 60 | 10.5% |
| $100,000 to $149,999 | 57 | 10.0% |
| $150,000 to $199,999 | 7 | 1.2% |
| $200,000+ | 216 | 37.8% |
Household Income by Householder Age in Bolinas
The median household income in Bolinas is $99,191, with the highest median household income of $120,921 found in the 65+ years age bracket for the primary householder. A total of 426 households (74.6%) fall into this category.
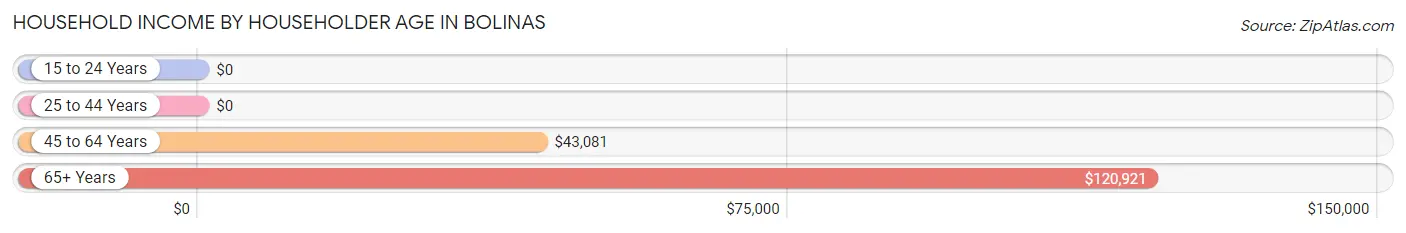
| Income Bracket | # Households | Median Income |
| 15 to 24 Years | 0 (0.0%) | $0 |
| 25 to 44 Years | 43 (7.5%) | $0 |
| 45 to 64 Years | 102 (17.9%) | $43,081 |
| 65+ Years | 426 (74.6%) | $120,921 |
| Total | 571 (100.0%) | $99,191 |
Poverty in Bolinas
Income Below Poverty by Sex and Age in Bolinas
With 12.1% poverty level for males and 10.6% for females among the residents of Bolinas, 6 to 11 year old males and 35 to 44 year old females are the most vulnerable to poverty, with 19 males (76.0%) and 13 females (24.1%) in their respective age groups living below the poverty level.
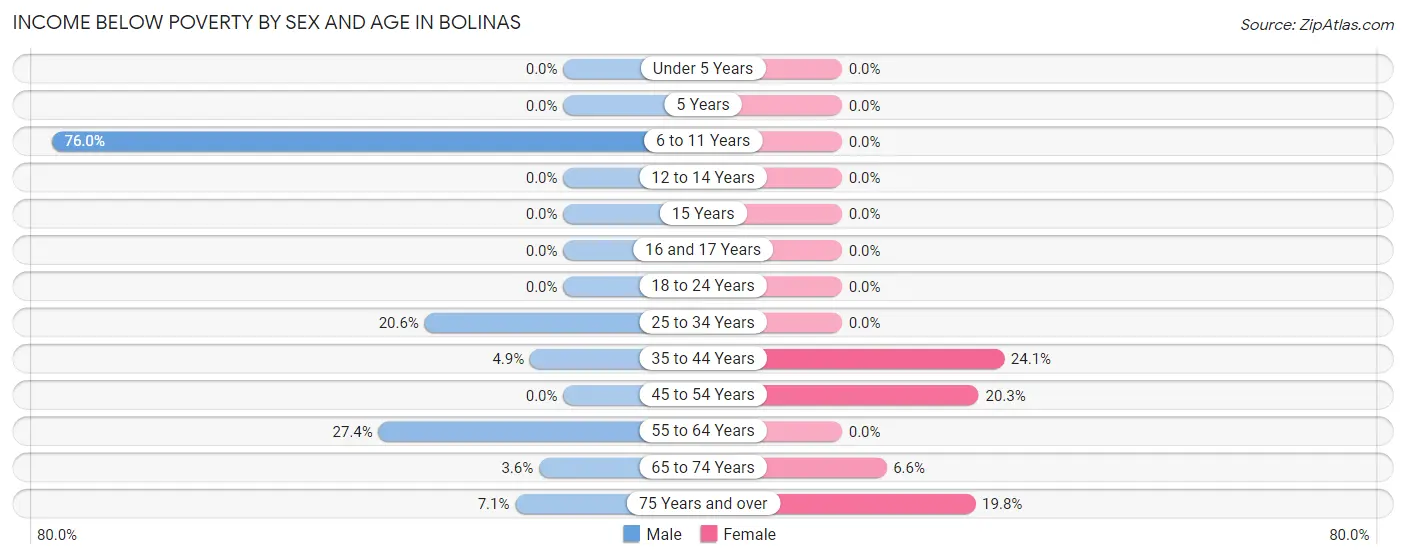
| Age Bracket | Male | Female |
| Under 5 Years | 0 (0.0%) | 0 (0.0%) |
| 5 Years | 0 (0.0%) | 0 (0.0%) |
| 6 to 11 Years | 19 (76.0%) | 0 (0.0%) |
| 12 to 14 Years | 0 (0.0%) | 0 (0.0%) |
| 15 Years | 0 (0.0%) | 0 (0.0%) |
| 16 and 17 Years | 0 (0.0%) | 0 (0.0%) |
| 18 to 24 Years | 0 (0.0%) | 0 (0.0%) |
| 25 to 34 Years | 14 (20.6%) | 0 (0.0%) |
| 35 to 44 Years | 4 (4.9%) | 13 (24.1%) |
| 45 to 54 Years | 0 (0.0%) | 13 (20.3%) |
| 55 to 64 Years | 31 (27.4%) | 0 (0.0%) |
| 65 to 74 Years | 7 (3.6%) | 17 (6.6%) |
| 75 Years and over | 8 (7.1%) | 20 (19.8%) |
| Total | 83 (12.1%) | 63 (10.6%) |
Income Above Poverty by Sex and Age in Bolinas
According to the poverty statistics in Bolinas, males aged under 5 years and females aged under 5 years are the age groups that are most secure financially, with 100.0% of males and 100.0% of females in these age groups living above the poverty line.
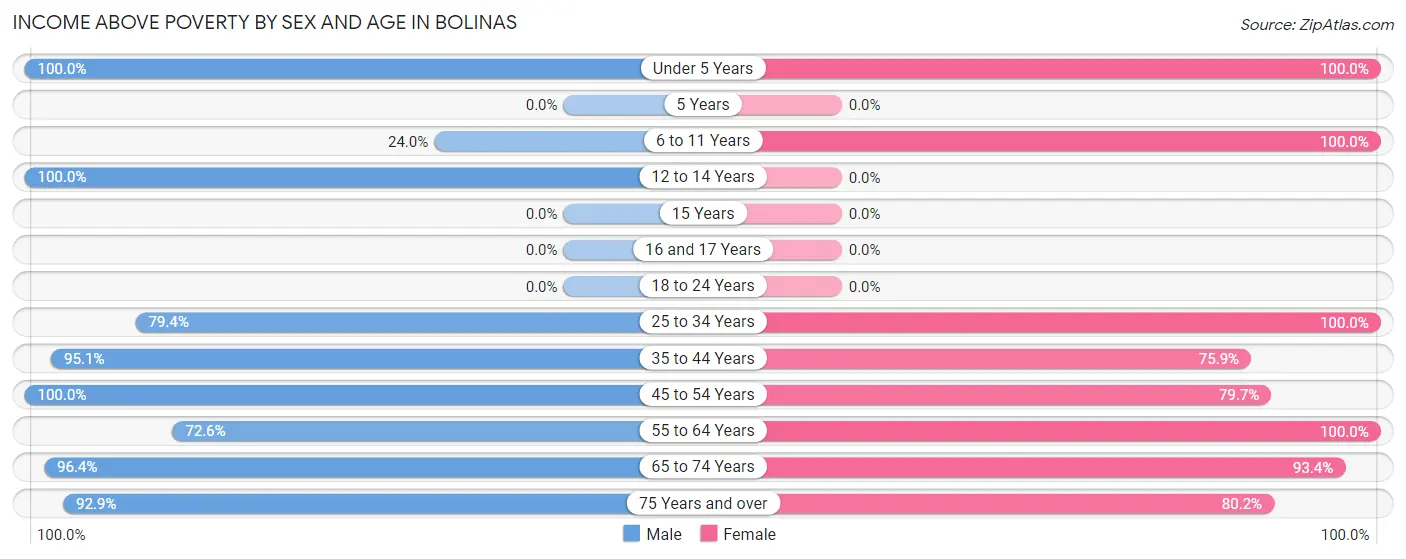
| Age Bracket | Male | Female |
| Under 5 Years | 24 (100.0%) | 16 (100.0%) |
| 5 Years | 0 (0.0%) | 0 (0.0%) |
| 6 to 11 Years | 6 (24.0%) | 30 (100.0%) |
| 12 to 14 Years | 6 (100.0%) | 0 (0.0%) |
| 15 Years | 0 (0.0%) | 0 (0.0%) |
| 16 and 17 Years | 0 (0.0%) | 0 (0.0%) |
| 18 to 24 Years | 0 (0.0%) | 0 (0.0%) |
| 25 to 34 Years | 54 (79.4%) | 55 (100.0%) |
| 35 to 44 Years | 77 (95.1%) | 41 (75.9%) |
| 45 to 54 Years | 61 (100.0%) | 51 (79.7%) |
| 55 to 64 Years | 82 (72.6%) | 18 (100.0%) |
| 65 to 74 Years | 187 (96.4%) | 241 (93.4%) |
| 75 Years and over | 104 (92.9%) | 81 (80.2%) |
| Total | 601 (87.9%) | 533 (89.4%) |
Income Below Poverty Among Married-Couple Families in Bolinas
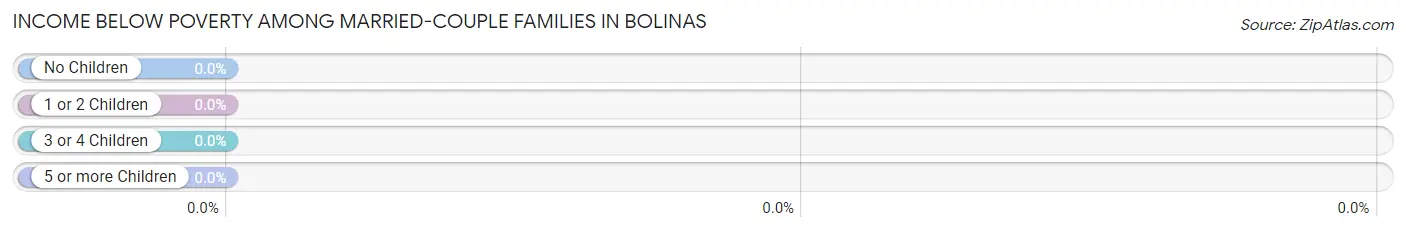
| Children | Above Poverty | Below Poverty |
| No Children | 159 (100.0%) | 0 (0.0%) |
| 1 or 2 Children | 0 (0.0%) | 0 (0.0%) |
| 3 or 4 Children | 6 (100.0%) | 0 (0.0%) |
| 5 or more Children | 0 (0.0%) | 0 (0.0%) |
| Total | 165 (100.0%) | 0 (0.0%) |
Income Below Poverty Among Single-Parent Households in Bolinas
According to the poverty data in Bolinas, 34.4% or 21 single-father households and 17.8% or 8 single-mother households are living below the poverty line. Among single-father households, those with 1 or 2 children have the highest poverty rate, with 21 households (34.4%) experiencing poverty. Likewise, among single-mother households, those with no children have the highest poverty rate, with 8 households (28.6%) falling below the poverty line.
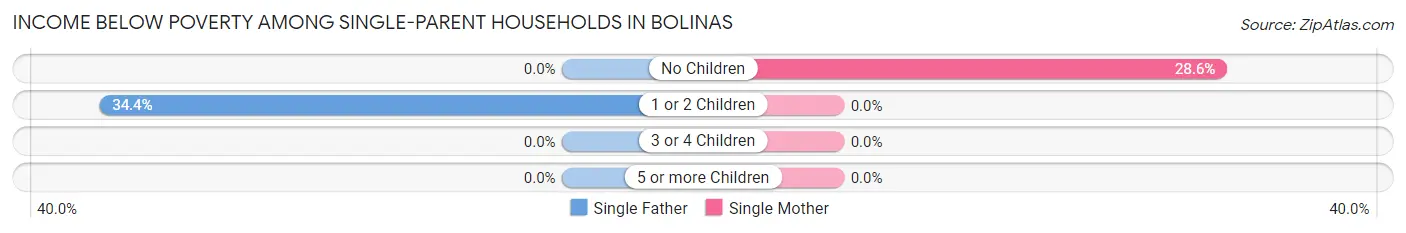
| Children | Single Father | Single Mother |
| No Children | 0 (0.0%) | 8 (28.6%) |
| 1 or 2 Children | 21 (34.4%) | 0 (0.0%) |
| 3 or 4 Children | 0 (0.0%) | 0 (0.0%) |
| 5 or more Children | 0 (0.0%) | 0 (0.0%) |
| Total | 21 (34.4%) | 8 (17.8%) |
Income Below Poverty Among Married-Couple vs Single-Parent Households in Bolinas
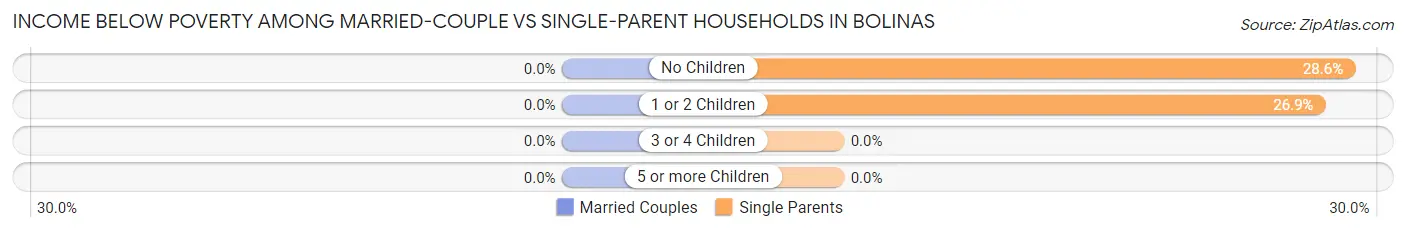
| Children | Married-Couple Families | Single-Parent Households |
| No Children | 0 (0.0%) | 8 (28.6%) |
| 1 or 2 Children | 0 (0.0%) | 21 (26.9%) |
| 3 or 4 Children | 0 (0.0%) | 0 (0.0%) |
| 5 or more Children | 0 (0.0%) | 0 (0.0%) |
| Total | 0 (0.0%) | 29 (27.4%) |
Race in Bolinas
The most populous races in Bolinas are White / Caucasian (1,095 | 85.6%), Hispanic or Latino (156 | 12.2%), and Two or more Races (132 | 10.3%).
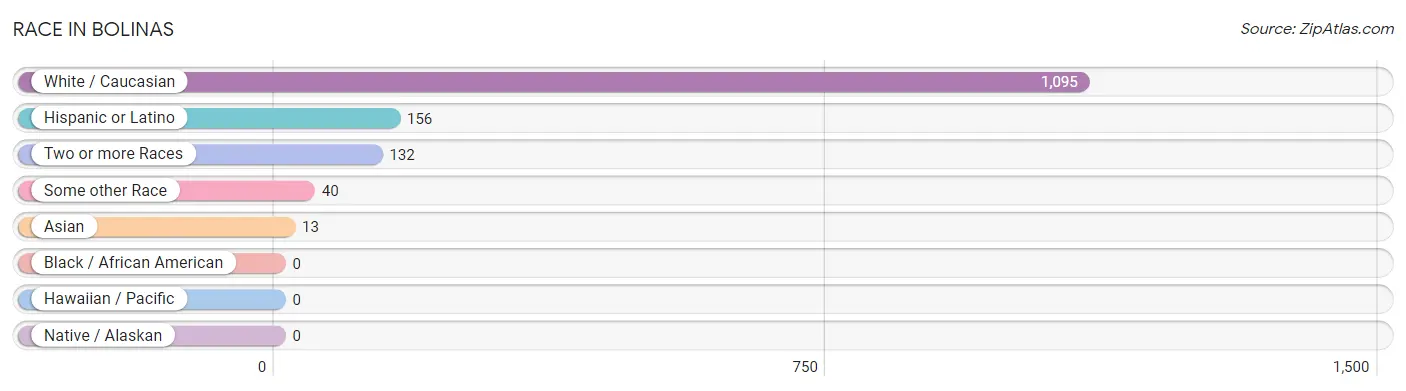
| Race | # Population | % Population |
| Asian | 13 | 1.0% |
| Black / African American | 0 | 0.0% |
| Hawaiian / Pacific | 0 | 0.0% |
| Hispanic or Latino | 156 | 12.2% |
| Native / Alaskan | 0 | 0.0% |
| White / Caucasian | 1,095 | 85.6% |
| Two or more Races | 132 | 10.3% |
| Some other Race | 40 | 3.1% |
| Total | 1,280 | 100.0% |
Ancestry in Bolinas
The most populous ancestries reported in Bolinas are English (273 | 21.3%), Scottish (166 | 13.0%), Irish (147 | 11.5%), German (118 | 9.2%), and Swedish (58 | 4.5%), together accounting for 59.5% of all Bolinas residents.
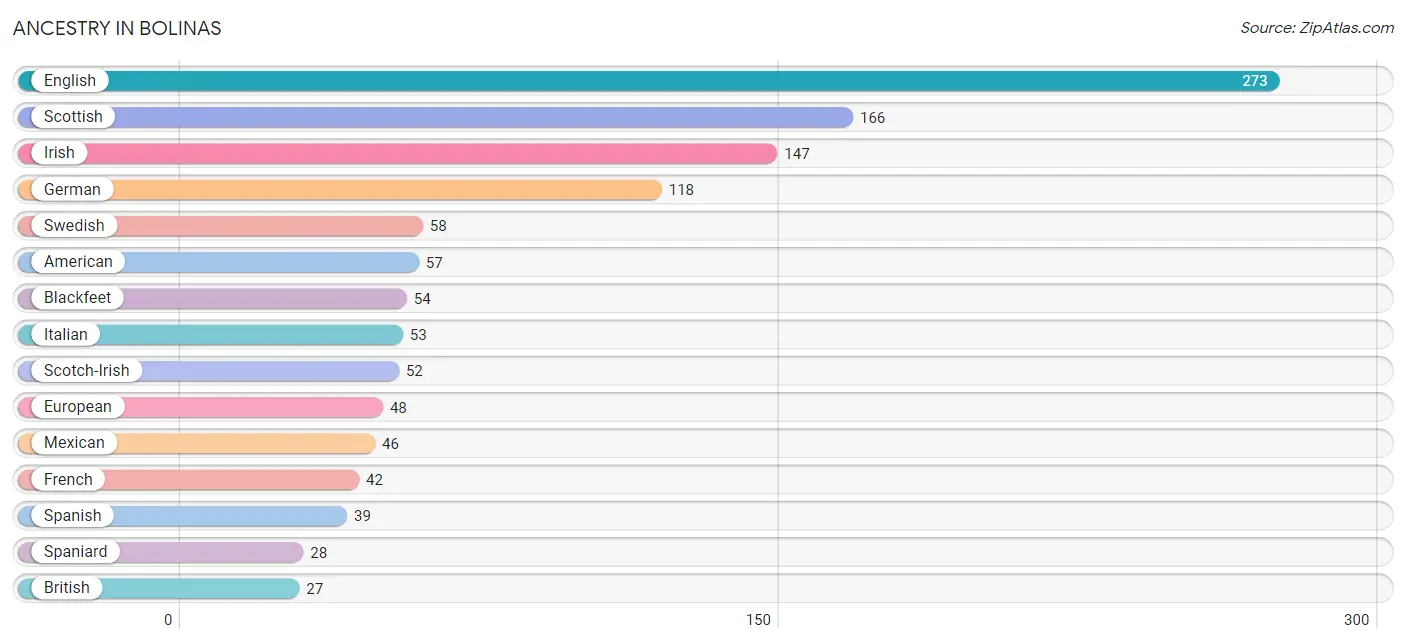
| Ancestry | # Population | % Population |
| American | 57 | 4.4% |
| Austrian | 6 | 0.5% |
| Blackfeet | 54 | 4.2% |
| British | 27 | 2.1% |
| Cherokee | 19 | 1.5% |
| Chilean | 22 | 1.7% |
| Danish | 13 | 1.0% |
| Dutch | 22 | 1.7% |
| English | 273 | 21.3% |
| European | 48 | 3.7% |
| French | 42 | 3.3% |
| German | 118 | 9.2% |
| Hungarian | 7 | 0.5% |
| Indian (Asian) | 13 | 1.0% |
| Irish | 147 | 11.5% |
| Italian | 53 | 4.1% |
| Mexican | 46 | 3.6% |
| Puerto Rican | 10 | 0.8% |
| Scotch-Irish | 52 | 4.1% |
| Scottish | 166 | 13.0% |
| Slavic | 7 | 0.5% |
| Slovene | 21 | 1.6% |
| South American | 22 | 1.7% |
| Spaniard | 28 | 2.2% |
| Spanish | 39 | 3.0% |
| Swedish | 58 | 4.5% |
| Swiss | 6 | 0.5% |
| Welsh | 17 | 1.3% | View All 28 Rows |
Immigrants in Bolinas
The most numerous immigrant groups reported in Bolinas came from Europe (61 | 4.8%), Northern Europe (40 | 3.1%), England (34 | 2.7%), Australia (33 | 2.6%), and Oceania (33 | 2.6%), together accounting for 15.7% of all Bolinas residents.
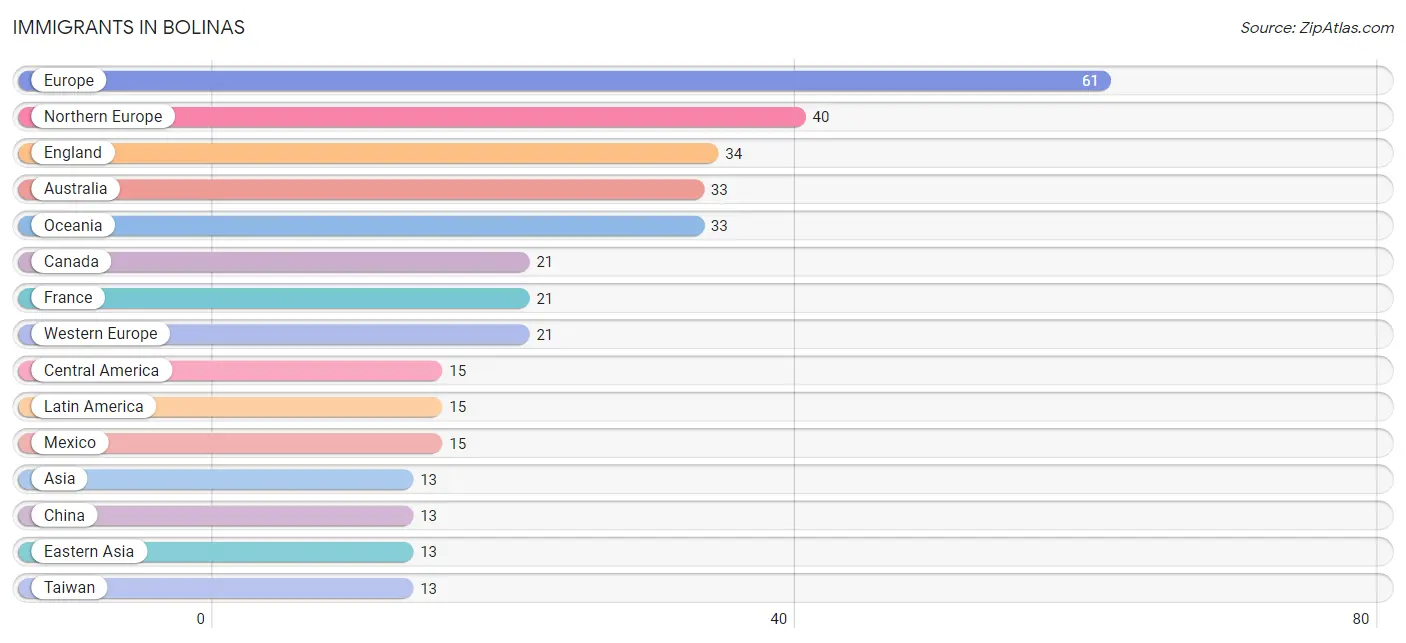
| Immigration Origin | # Population | % Population |
| Asia | 13 | 1.0% |
| Australia | 33 | 2.6% |
| Canada | 21 | 1.6% |
| Central America | 15 | 1.2% |
| China | 13 | 1.0% |
| Denmark | 6 | 0.5% |
| Eastern Asia | 13 | 1.0% |
| England | 34 | 2.7% |
| Europe | 61 | 4.8% |
| France | 21 | 1.6% |
| Latin America | 15 | 1.2% |
| Mexico | 15 | 1.2% |
| Northern Europe | 40 | 3.1% |
| Oceania | 33 | 2.6% |
| Taiwan | 13 | 1.0% |
| Western Europe | 21 | 1.6% | View All 16 Rows |
Sex and Age in Bolinas
Sex and Age in Bolinas
The most populous age groups in Bolinas are 70 to 74 Years (162 | 23.7%) for men and 70 to 74 Years (143 | 24.0%) for women.
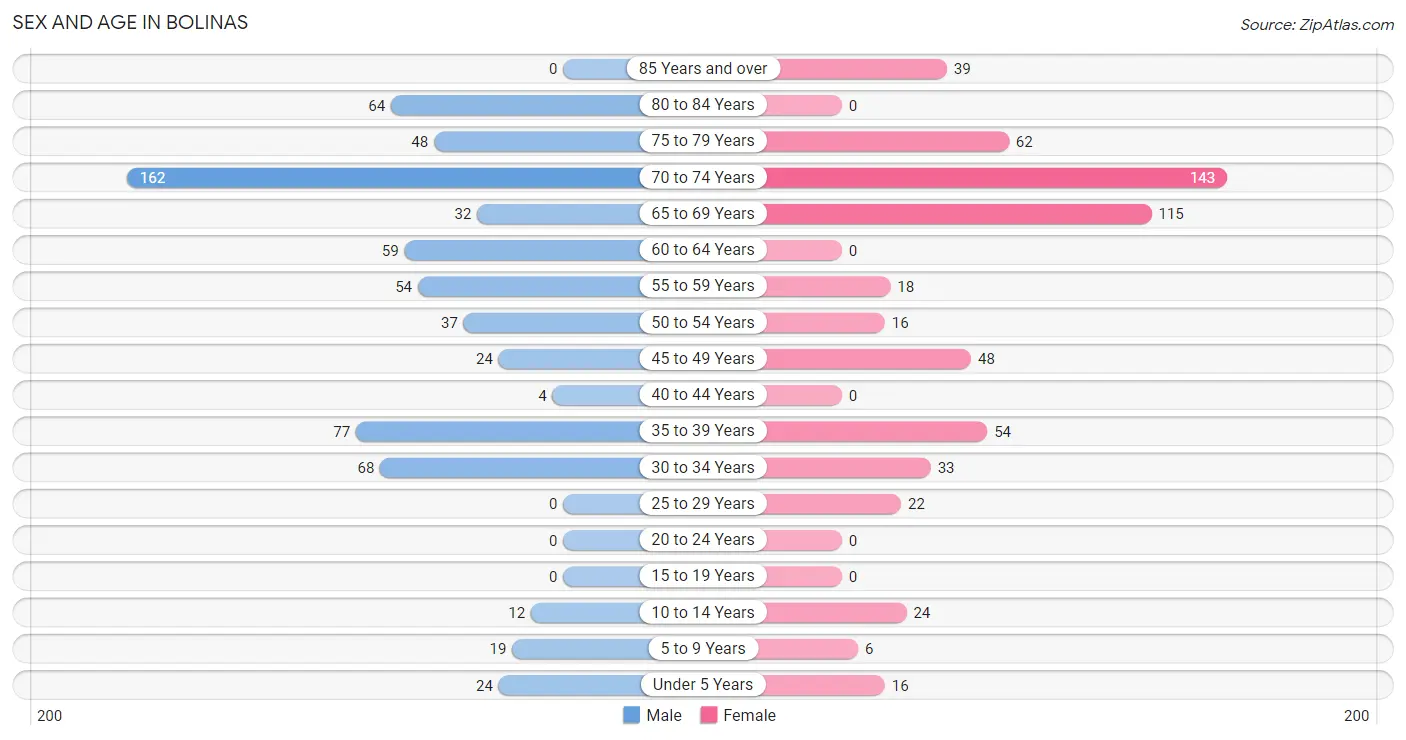
| Age Bracket | Male | Female |
| Under 5 Years | 24 (3.5%) | 16 (2.7%) |
| 5 to 9 Years | 19 (2.8%) | 6 (1.0%) |
| 10 to 14 Years | 12 (1.8%) | 24 (4.0%) |
| 15 to 19 Years | 0 (0.0%) | 0 (0.0%) |
| 20 to 24 Years | 0 (0.0%) | 0 (0.0%) |
| 25 to 29 Years | 0 (0.0%) | 22 (3.7%) |
| 30 to 34 Years | 68 (9.9%) | 33 (5.5%) |
| 35 to 39 Years | 77 (11.3%) | 54 (9.1%) |
| 40 to 44 Years | 4 (0.6%) | 0 (0.0%) |
| 45 to 49 Years | 24 (3.5%) | 48 (8.1%) |
| 50 to 54 Years | 37 (5.4%) | 16 (2.7%) |
| 55 to 59 Years | 54 (7.9%) | 18 (3.0%) |
| 60 to 64 Years | 59 (8.6%) | 0 (0.0%) |
| 65 to 69 Years | 32 (4.7%) | 115 (19.3%) |
| 70 to 74 Years | 162 (23.7%) | 143 (24.0%) |
| 75 to 79 Years | 48 (7.0%) | 62 (10.4%) |
| 80 to 84 Years | 64 (9.4%) | 0 (0.0%) |
| 85 Years and over | 0 (0.0%) | 39 (6.5%) |
| Total | 684 (100.0%) | 596 (100.0%) |
Families and Households in Bolinas
Median Family Size in Bolinas
The median family size in Bolinas is 2.49 persons per family, with single female/mother families (45 | 16.6%) accounting for the largest median family size of 3.2 persons per family. On the other hand, married-couple families (165 | 60.9%) represent the smallest median family size with 2.21 persons per family.
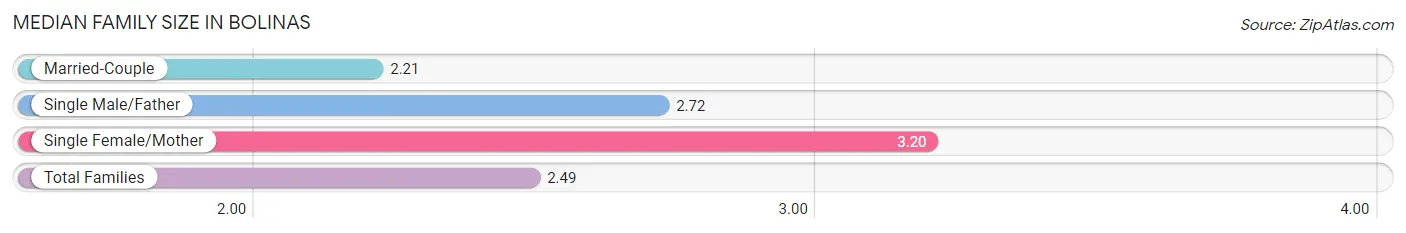
| Family Type | # Families | Family Size |
| Married-Couple | 165 (60.9%) | 2.21 |
| Single Male/Father | 61 (22.5%) | 2.72 |
| Single Female/Mother | 45 (16.6%) | 3.20 |
| Total Families | 271 (100.0%) | 2.49 |
Median Household Size in Bolinas
The median household size in Bolinas is 2.19 persons per household, with single female/mother households (45 | 7.9%) accounting for the largest median household size of 4.33 persons per household. non-family households (300 | 52.5%) represent the smallest median household size with 1.55 persons per household.
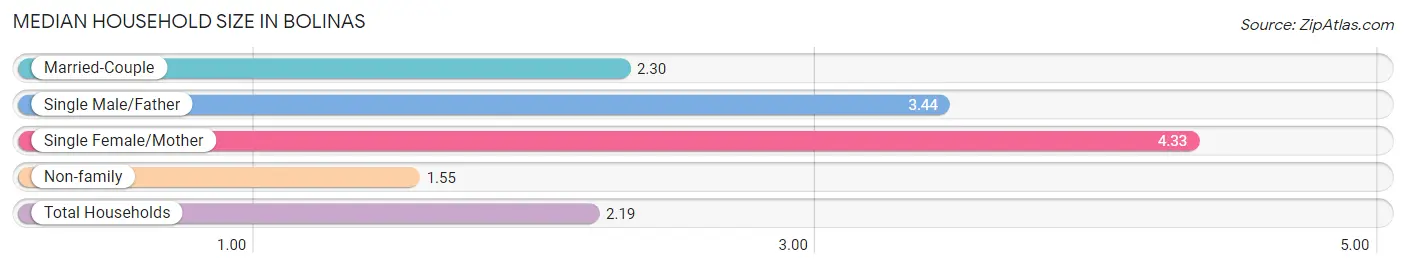
| Household Type | # Households | Household Size |
| Married-Couple | 165 (28.9%) | 2.30 |
| Single Male/Father | 61 (10.7%) | 3.44 |
| Single Female/Mother | 45 (7.9%) | 4.33 |
| Non-family | 300 (52.5%) | 1.55 |
| Total Households | 571 (100.0%) | 2.19 |
Household Size by Marriage Status in Bolinas
Out of a total of 571 households in Bolinas, 271 (47.5%) are family households, while 300 (52.5%) are nonfamily households. The most numerous type of family households are 2-person households, comprising 167, and the most common type of nonfamily households are 1-person households, comprising 200.
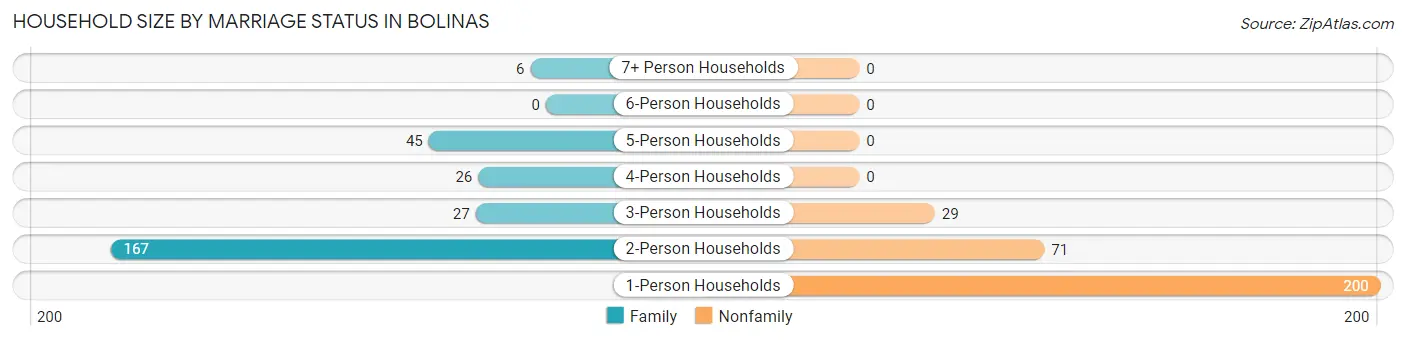
| Household Size | Family Households | Nonfamily Households |
| 1-Person Households | - | 200 (35.0%) |
| 2-Person Households | 167 (29.2%) | 71 (12.4%) |
| 3-Person Households | 27 (4.7%) | 29 (5.1%) |
| 4-Person Households | 26 (4.5%) | 0 (0.0%) |
| 5-Person Households | 45 (7.9%) | 0 (0.0%) |
| 6-Person Households | 0 (0.0%) | 0 (0.0%) |
| 7+ Person Households | 6 (1.1%) | 0 (0.0%) |
| Total | 271 (47.5%) | 300 (52.5%) |
Female Fertility in Bolinas
Fertility by Age in Bolinas
| Age Bracket | Women with Births | Births / 1,000 Women |
| 15 to 19 years | 0 (0.0%) | 0.0 |
| 20 to 34 years | 0 (0.0%) | 0.0 |
| 35 to 50 years | 0 (0.0%) | 0.0 |
| Total | 0 (0.0%) | 0.0 |
Fertility by Age by Marriage Status in Bolinas
| Age Bracket | Married | Unmarried |
| 15 to 19 years | 0 (0.0%) | 0 (0.0%) |
| 20 to 34 years | 0 (0.0%) | 0 (0.0%) |
| 35 to 50 years | 0 (0.0%) | 0 (0.0%) |
| Total | 0 (0.0%) | 0 (0.0%) |
Fertility by Education in Bolinas
| Educational Attainment | Women with Births | Births / 1,000 Women |
| Less than High School | 0 (0.0%) | 0.0 |
| High School Diploma | 0 (0.0%) | 0.0 |
| College or Associate's Degree | 0 (0.0%) | 0.0 |
| Bachelor's Degree | 0 (0.0%) | 0.0 |
| Graduate Degree | 0 (0.0%) | 0.0 |
| Total | 0 (0.0%) | 0.0 |
Fertility by Education by Marriage Status in Bolinas
| Educational Attainment | Married | Unmarried |
| Less than High School | 0 (0.0%) | 0 (0.0%) |
| High School Diploma | 0 (0.0%) | 0 (0.0%) |
| College or Associate's Degree | 0 (0.0%) | 0 (0.0%) |
| Bachelor's Degree | 0 (0.0%) | 0 (0.0%) |
| Graduate Degree | 0 (0.0%) | 0 (0.0%) |
| Total | 0 (0.0%) | 0 (0.0%) |
Employment Characteristics in Bolinas
Employment by Class of Employer in Bolinas
Among the 643 employed individuals in Bolinas, private company employees (276 | 42.9%), self-employed (not incorporated) (207 | 32.2%), and self-employed (incorporated) (60 | 9.3%) make up the most common classes of employment.
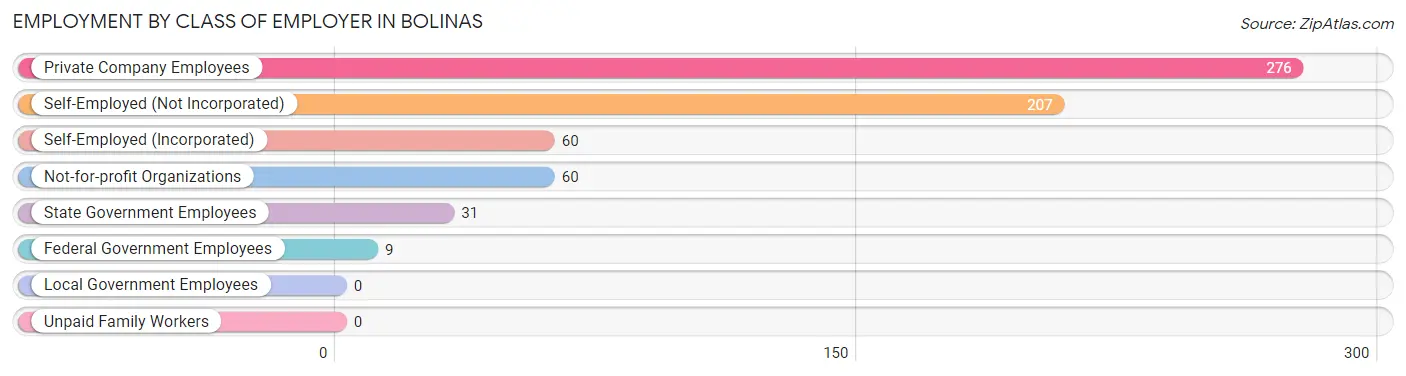
| Employer Class | # Employees | % Employees |
| Private Company Employees | 276 | 42.9% |
| Self-Employed (Incorporated) | 60 | 9.3% |
| Self-Employed (Not Incorporated) | 207 | 32.2% |
| Not-for-profit Organizations | 60 | 9.3% |
| Local Government Employees | 0 | 0.0% |
| State Government Employees | 31 | 4.8% |
| Federal Government Employees | 9 | 1.4% |
| Unpaid Family Workers | 0 | 0.0% |
| Total | 643 | 100.0% |
Employment Status by Age in Bolinas
According to the labor force statistics for Bolinas, out of the total population over 16 years of age (1,179), 55.8% or 658 individuals are in the labor force, with 2.3% or 15 of them unemployed. The age group with the highest labor force participation rate is 25 to 29 years, with 100.0% or 22 individuals in the labor force. Within the labor force, the 30 to 34 years age range has the highest percentage of unemployed individuals, with 21.7% or 15 of them being unemployed.
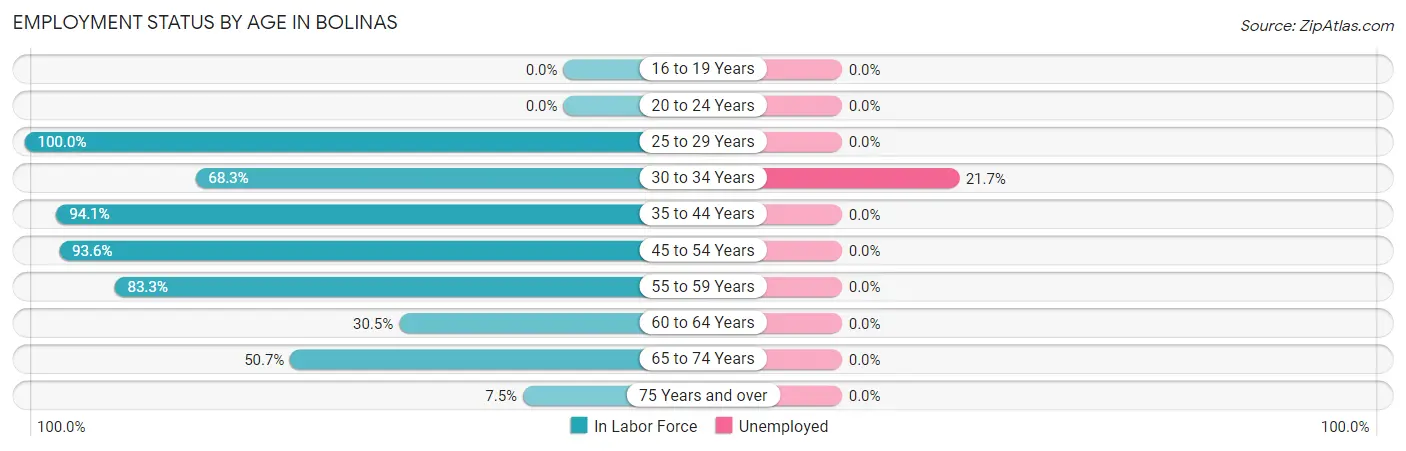
| Age Bracket | In Labor Force | Unemployed |
| 16 to 19 Years | 0 (0.0%) | 0 (0.0%) |
| 20 to 24 Years | 0 (0.0%) | 0 (0.0%) |
| 25 to 29 Years | 22 (100.0%) | 0 (0.0%) |
| 30 to 34 Years | 69 (68.3%) | 15 (21.7%) |
| 35 to 44 Years | 127 (94.1%) | 0 (0.0%) |
| 45 to 54 Years | 117 (93.6%) | 0 (0.0%) |
| 55 to 59 Years | 60 (83.3%) | 0 (0.0%) |
| 60 to 64 Years | 18 (30.5%) | 0 (0.0%) |
| 65 to 74 Years | 229 (50.7%) | 0 (0.0%) |
| 75 Years and over | 16 (7.5%) | 0 (0.0%) |
| Total | 658 (55.8%) | 15 (2.3%) |
Employment Status by Educational Attainment in Bolinas
According to labor force statistics for Bolinas, 80.4% of individuals (413) out of the total population between 25 and 64 years of age (514) are in the labor force, with 3.6% or 15 of them being unemployed. The group with the highest labor force participation rate are those with the educational attainment of high school diploma, with 100.0% or 135 individuals in the labor force. Within the labor force, individuals with college / associate degree education have the highest percentage of unemployment, with 21.4% or 15 of them being unemployed.
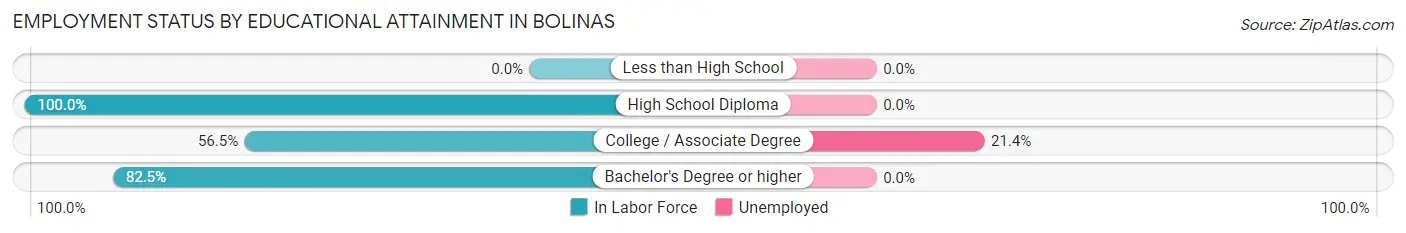
| Educational Attainment | In Labor Force | Unemployed |
| Less than High School | 0 (0.0%) | 0 (0.0%) |
| High School Diploma | 135 (100.0%) | 0 (0.0%) |
| College / Associate Degree | 70 (56.5%) | 27 (21.4%) |
| Bachelor's Degree or higher | 208 (82.5%) | 0 (0.0%) |
| Total | 413 (80.4%) | 19 (3.6%) |
Employment Occupations by Sex in Bolinas
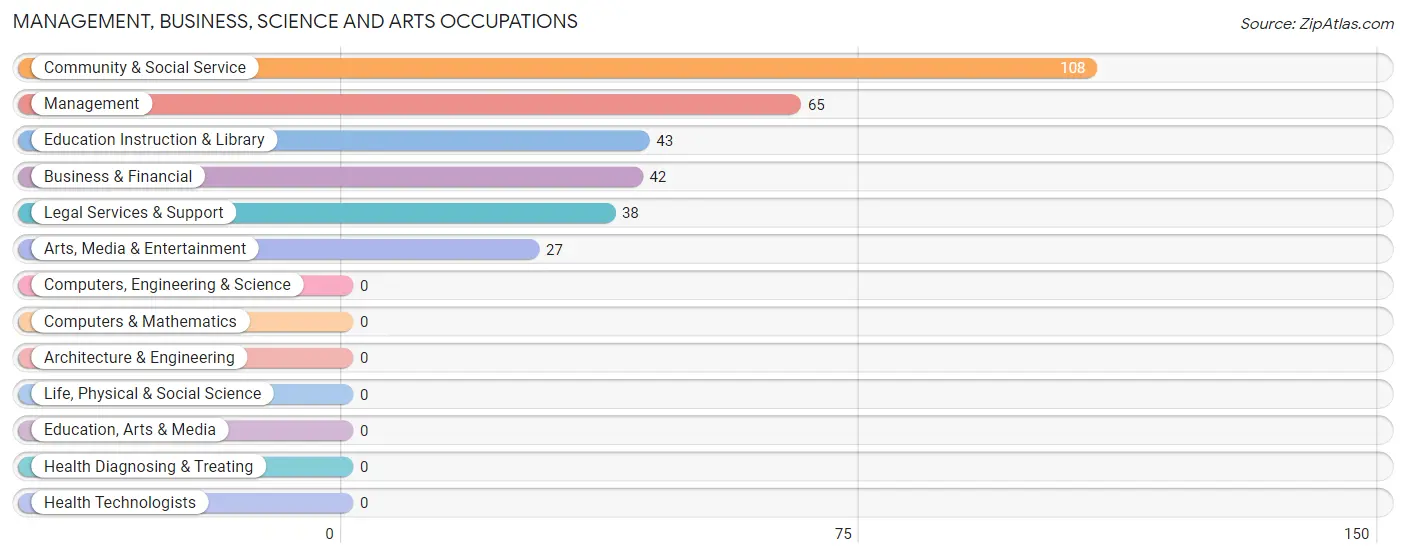
Management, Business, Science and Arts Occupations
The most common Management, Business, Science and Arts occupations in Bolinas are Community & Social Service (108 | 16.8%), Management (65 | 10.1%), Education Instruction & Library (43 | 6.7%), Business & Financial (42 | 6.5%), and Legal Services & Support (38 | 5.9%).
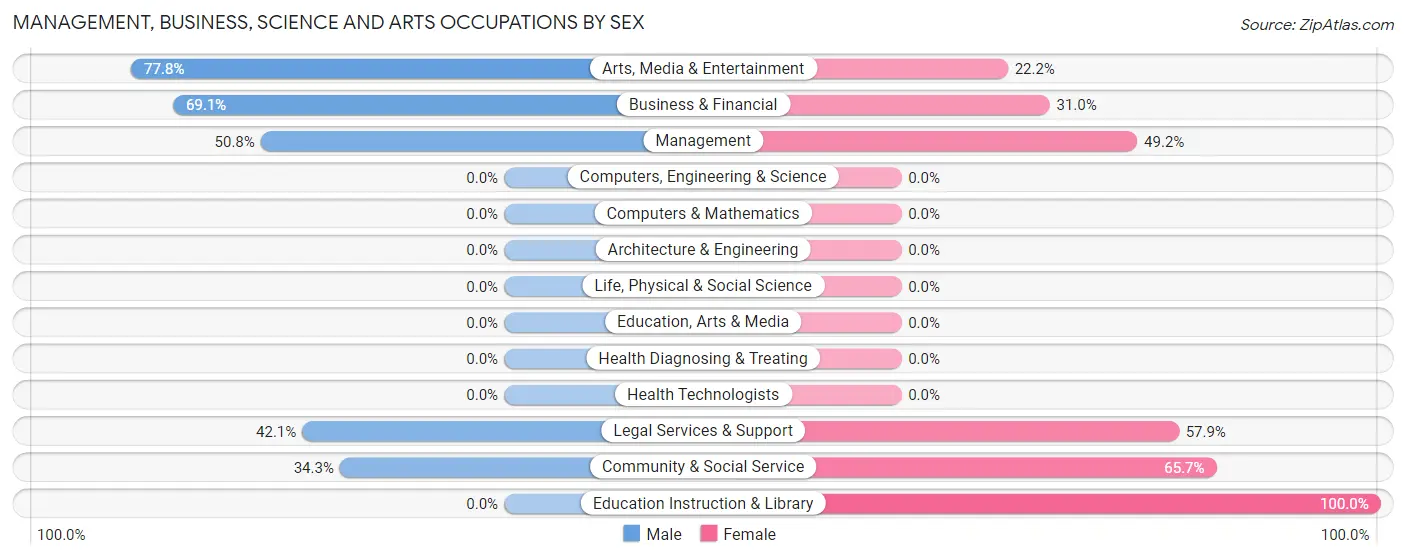
Management, Business, Science and Arts Occupations by Sex
Within the Management, Business, Science and Arts occupations in Bolinas, the most male-oriented occupations are Arts, Media & Entertainment (77.8%), Business & Financial (69.1%), and Management (50.8%), while the most female-oriented occupations are Education Instruction & Library (100.0%), Community & Social Service (65.7%), and Legal Services & Support (57.9%).
| Occupation | Male | Female |
| Management | 33 (50.8%) | 32 (49.2%) |
| Business & Financial | 29 (69.1%) | 13 (30.9%) |
| Computers, Engineering & Science | 0 (0.0%) | 0 (0.0%) |
| Computers & Mathematics | 0 (0.0%) | 0 (0.0%) |
| Architecture & Engineering | 0 (0.0%) | 0 (0.0%) |
| Life, Physical & Social Science | 0 (0.0%) | 0 (0.0%) |
| Community & Social Service | 37 (34.3%) | 71 (65.7%) |
| Education, Arts & Media | 0 (0.0%) | 0 (0.0%) |
| Legal Services & Support | 16 (42.1%) | 22 (57.9%) |
| Education Instruction & Library | 0 (0.0%) | 43 (100.0%) |
| Arts, Media & Entertainment | 21 (77.8%) | 6 (22.2%) |
| Health Diagnosing & Treating | 0 (0.0%) | 0 (0.0%) |
| Health Technologists | 0 (0.0%) | 0 (0.0%) |
| Total (Category) | 99 (46.1%) | 116 (53.9%) |
| Total (Overall) | 383 (59.6%) | 260 (40.4%) |
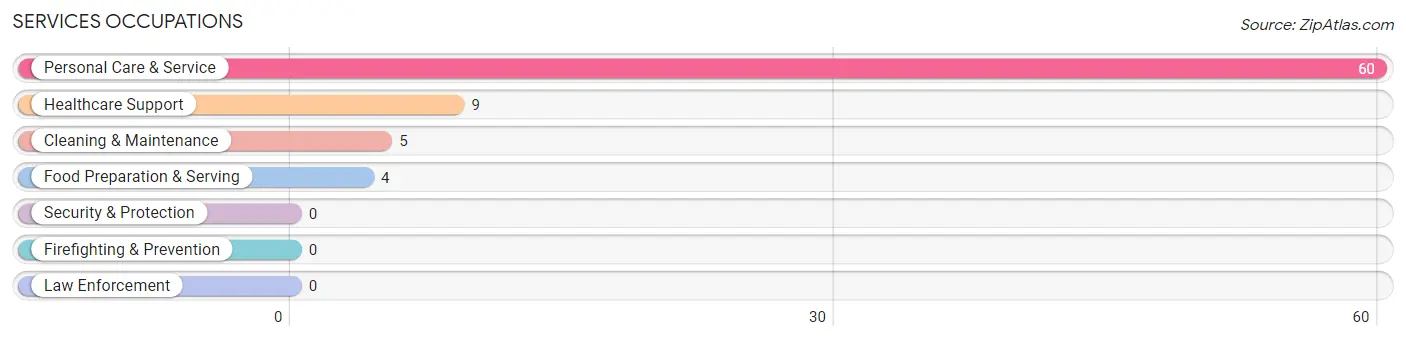
Services Occupations
The most common Services occupations in Bolinas are Personal Care & Service (60 | 9.3%), Healthcare Support (9 | 1.4%), Cleaning & Maintenance (5 | 0.8%), and Food Preparation & Serving (4 | 0.6%).
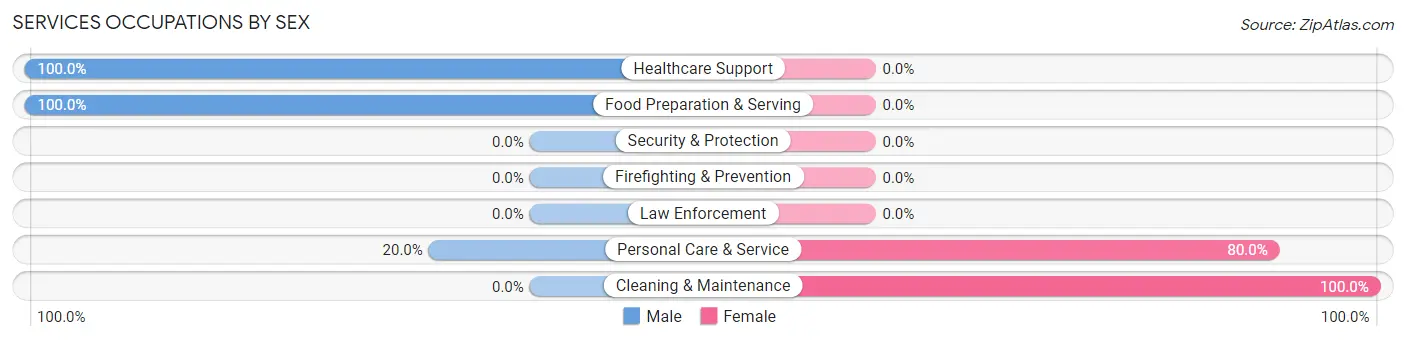
Services Occupations by Sex
Within the Services occupations in Bolinas, the most male-oriented occupations are Healthcare Support (100.0%), Food Preparation & Serving (100.0%), and Personal Care & Service (20.0%), while the most female-oriented occupations are Cleaning & Maintenance (100.0%), and Personal Care & Service (80.0%).
| Occupation | Male | Female |
| Healthcare Support | 9 (100.0%) | 0 (0.0%) |
| Security & Protection | 0 (0.0%) | 0 (0.0%) |
| Firefighting & Prevention | 0 (0.0%) | 0 (0.0%) |
| Law Enforcement | 0 (0.0%) | 0 (0.0%) |
| Food Preparation & Serving | 4 (100.0%) | 0 (0.0%) |
| Cleaning & Maintenance | 0 (0.0%) | 5 (100.0%) |
| Personal Care & Service | 12 (20.0%) | 48 (80.0%) |
| Total (Category) | 25 (32.1%) | 53 (67.9%) |
| Total (Overall) | 383 (59.6%) | 260 (40.4%) |
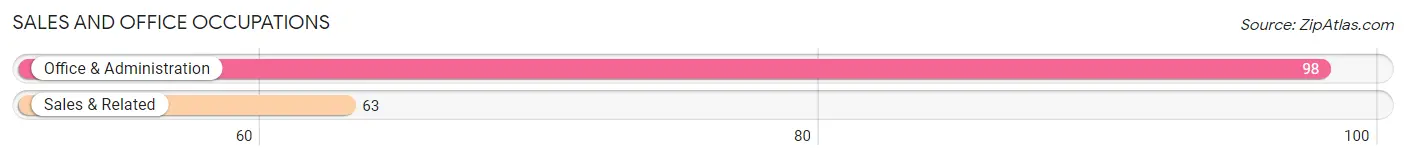
Sales and Office Occupations
The most common Sales and Office occupations in Bolinas are Office & Administration (98 | 15.2%), and Sales & Related (63 | 9.8%).
Sales and Office Occupations by Sex
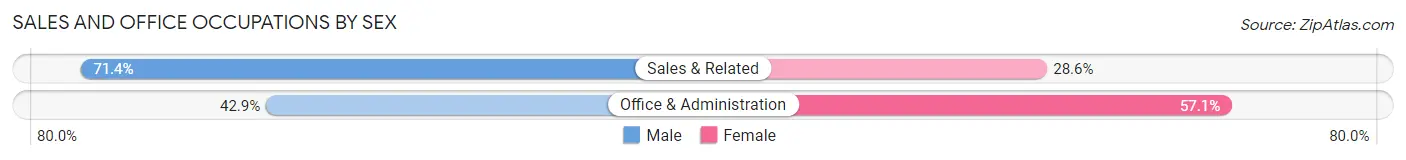
| Occupation | Male | Female |
| Sales & Related | 45 (71.4%) | 18 (28.6%) |
| Office & Administration | 42 (42.9%) | 56 (57.1%) |
| Total (Category) | 87 (54.0%) | 74 (46.0%) |
| Total (Overall) | 383 (59.6%) | 260 (40.4%) |
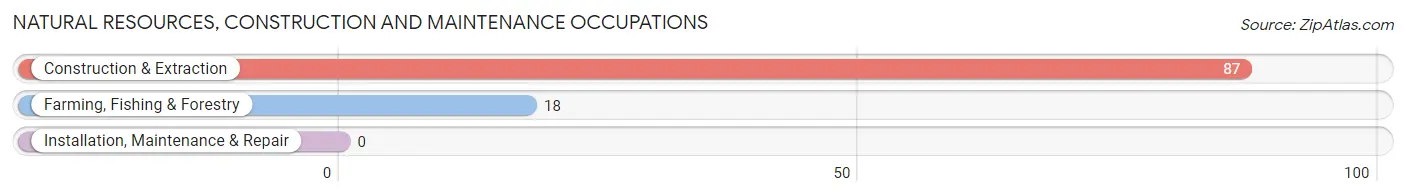
Natural Resources, Construction and Maintenance Occupations
The most common Natural Resources, Construction and Maintenance occupations in Bolinas are Construction & Extraction (87 | 13.5%), and Farming, Fishing & Forestry (18 | 2.8%).
Natural Resources, Construction and Maintenance Occupations by Sex
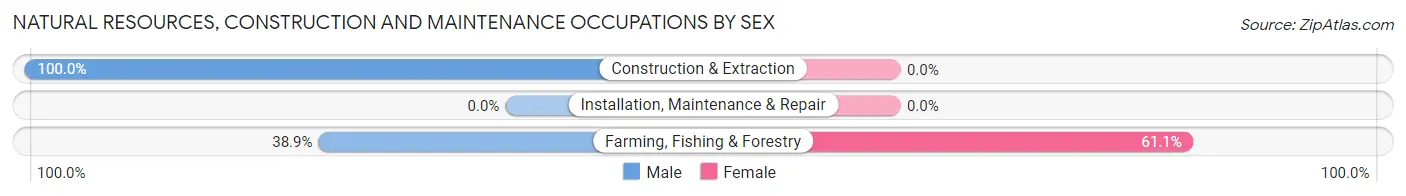
| Occupation | Male | Female |
| Farming, Fishing & Forestry | 7 (38.9%) | 11 (61.1%) |
| Construction & Extraction | 87 (100.0%) | 0 (0.0%) |
| Installation, Maintenance & Repair | 0 (0.0%) | 0 (0.0%) |
| Total (Category) | 94 (89.5%) | 11 (10.5%) |
| Total (Overall) | 383 (59.6%) | 260 (40.4%) |
Production, Transportation and Moving Occupations
The most common Production, Transportation and Moving occupations in Bolinas are Transportation (54 | 8.4%), and Production (30 | 4.7%).
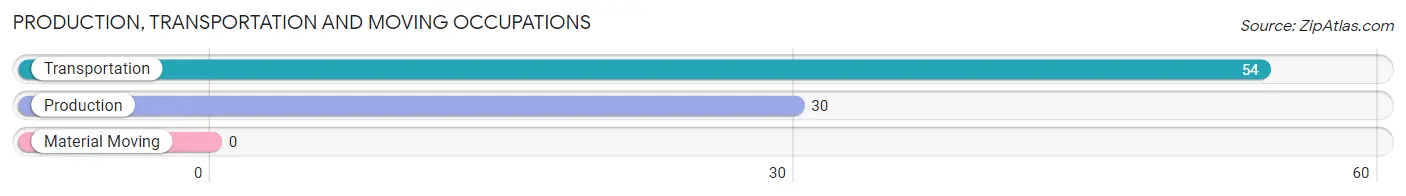
Production, Transportation and Moving Occupations by Sex
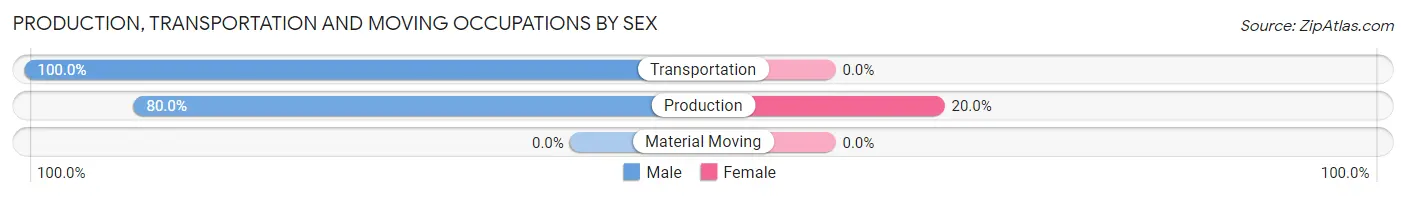
| Occupation | Male | Female |
| Production | 24 (80.0%) | 6 (20.0%) |
| Transportation | 54 (100.0%) | 0 (0.0%) |
| Material Moving | 0 (0.0%) | 0 (0.0%) |
| Total (Category) | 78 (92.9%) | 6 (7.1%) |
| Total (Overall) | 383 (59.6%) | 260 (40.4%) |
Employment Industries by Sex in Bolinas
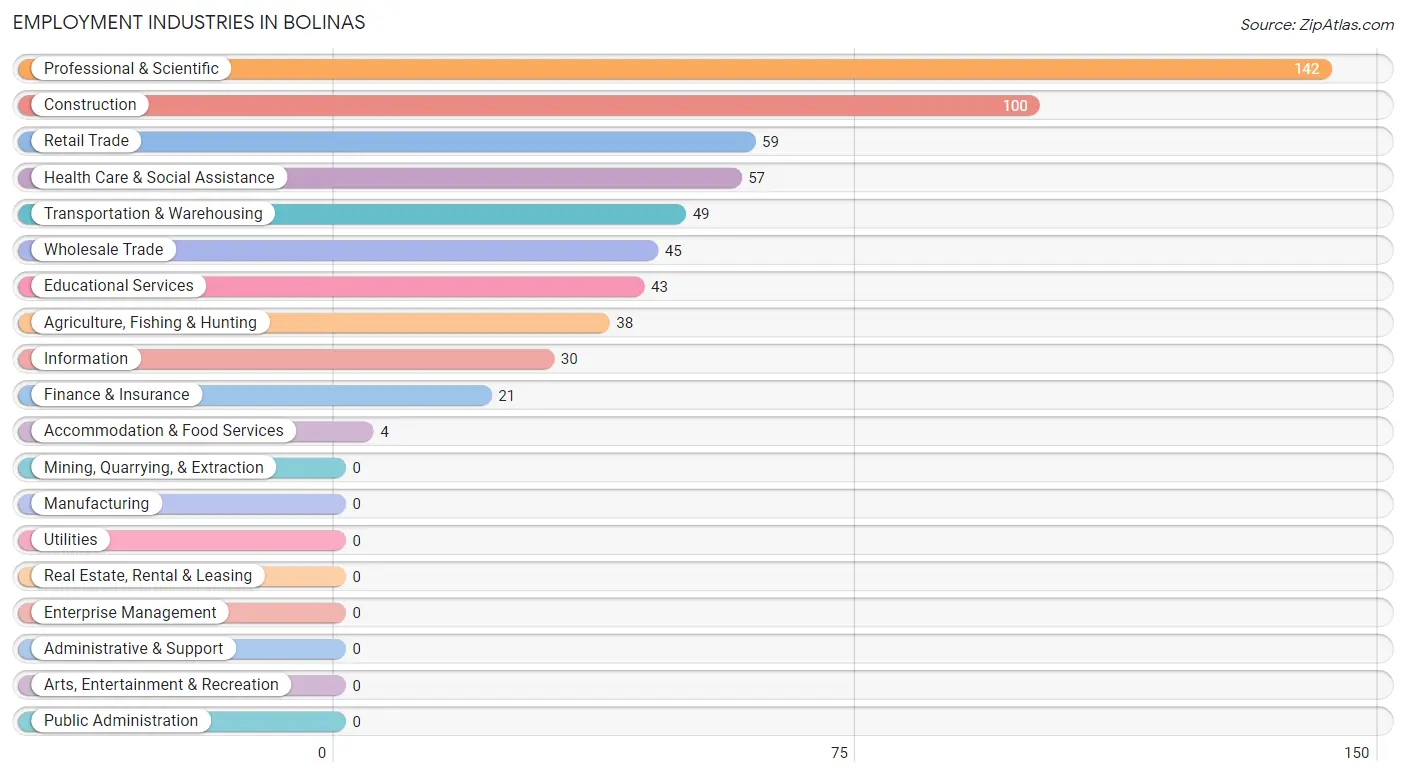
Employment Industries in Bolinas
The major employment industries in Bolinas include Professional & Scientific (142 | 22.1%), Construction (100 | 15.5%), Retail Trade (59 | 9.2%), Health Care & Social Assistance (57 | 8.9%), and Transportation & Warehousing (49 | 7.6%).
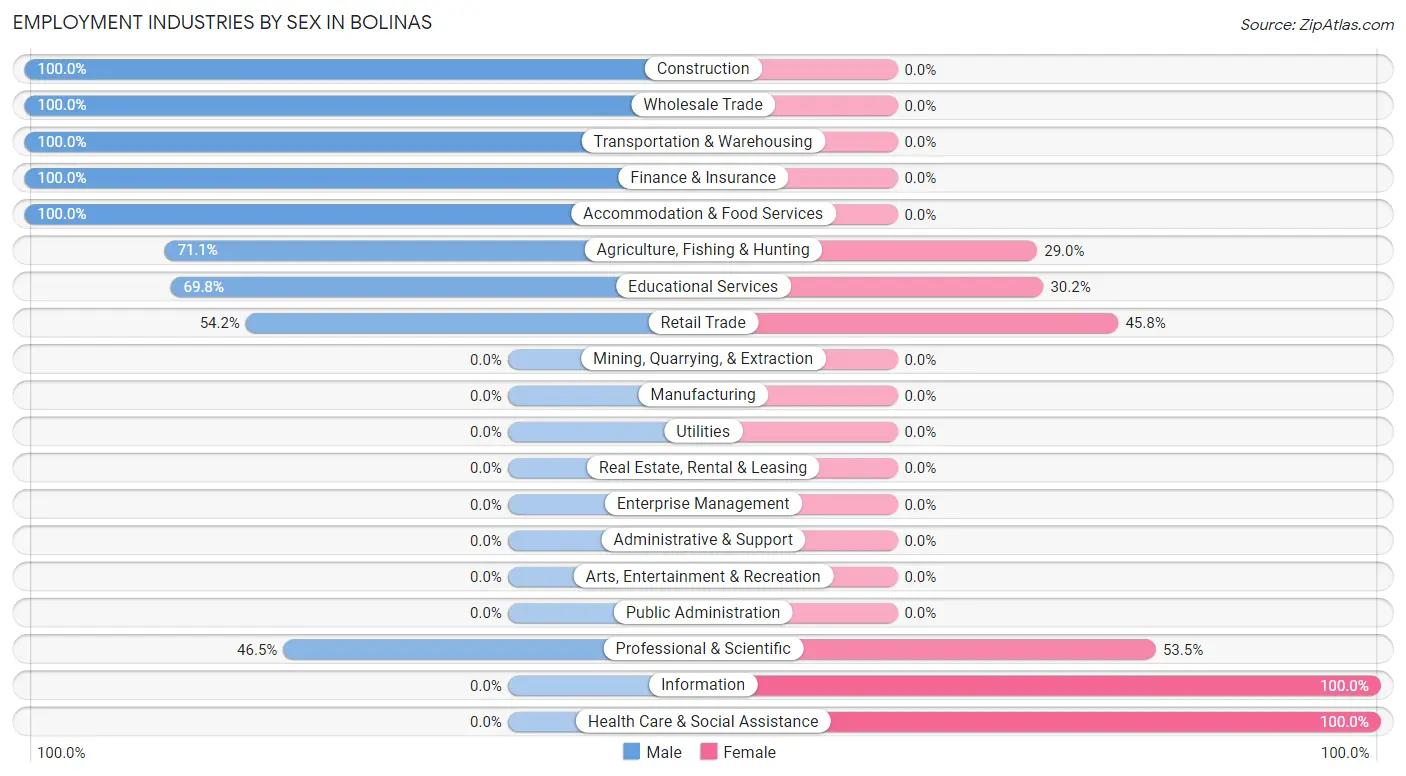
Employment Industries by Sex in Bolinas
The Bolinas industries that see more men than women are Construction (100.0%), Wholesale Trade (100.0%), and Transportation & Warehousing (100.0%), whereas the industries that tend to have a higher number of women are Information (100.0%), Health Care & Social Assistance (100.0%), and Professional & Scientific (53.5%).
| Industry | Male | Female |
| Agriculture, Fishing & Hunting | 27 (71.1%) | 11 (28.9%) |
| Mining, Quarrying, & Extraction | 0 (0.0%) | 0 (0.0%) |
| Construction | 100 (100.0%) | 0 (0.0%) |
| Manufacturing | 0 (0.0%) | 0 (0.0%) |
| Wholesale Trade | 45 (100.0%) | 0 (0.0%) |
| Retail Trade | 32 (54.2%) | 27 (45.8%) |
| Transportation & Warehousing | 49 (100.0%) | 0 (0.0%) |
| Utilities | 0 (0.0%) | 0 (0.0%) |
| Information | 0 (0.0%) | 30 (100.0%) |
| Finance & Insurance | 21 (100.0%) | 0 (0.0%) |
| Real Estate, Rental & Leasing | 0 (0.0%) | 0 (0.0%) |
| Professional & Scientific | 66 (46.5%) | 76 (53.5%) |
| Enterprise Management | 0 (0.0%) | 0 (0.0%) |
| Administrative & Support | 0 (0.0%) | 0 (0.0%) |
| Educational Services | 30 (69.8%) | 13 (30.2%) |
| Health Care & Social Assistance | 0 (0.0%) | 57 (100.0%) |
| Arts, Entertainment & Recreation | 0 (0.0%) | 0 (0.0%) |
| Accommodation & Food Services | 4 (100.0%) | 0 (0.0%) |
| Public Administration | 0 (0.0%) | 0 (0.0%) |
| Total | 383 (59.6%) | 260 (40.4%) |
Education in Bolinas
School Enrollment in Bolinas
The most common levels of schooling among the 182 students in Bolinas are graduate / professional (72 | 39.6%), elementary school (49 | 26.9%), and nursery / preschool (40 | 22.0%).
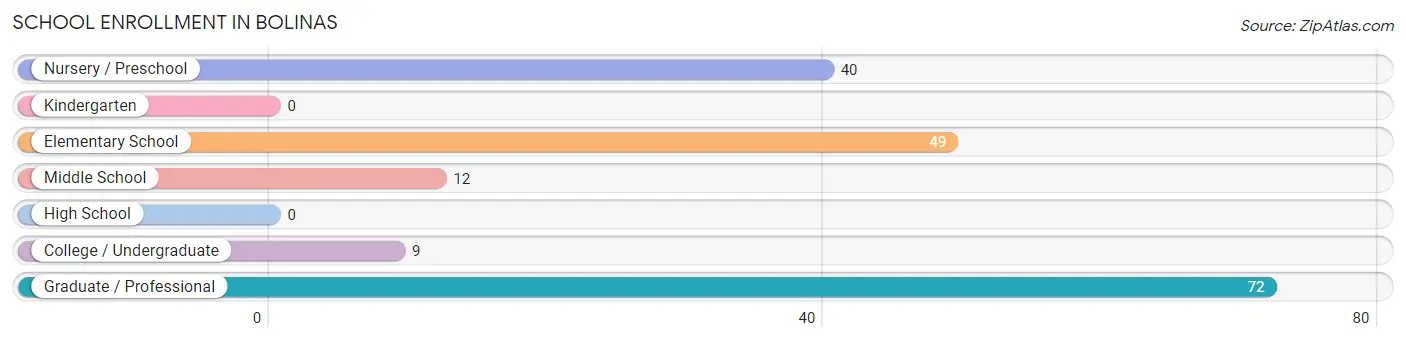
| School Level | # Students | % Students |
| Nursery / Preschool | 40 | 22.0% |
| Kindergarten | 0 | 0.0% |
| Elementary School | 49 | 26.9% |
| Middle School | 12 | 6.6% |
| High School | 0 | 0.0% |
| College / Undergraduate | 9 | 5.0% |
| Graduate / Professional | 72 | 39.6% |
| Total | 182 | 100.0% |
School Enrollment by Age by Funding Source in Bolinas
Out of a total of 182 students who are enrolled in schools in Bolinas, 97 (53.3%) attend a private institution, while the remaining 85 (46.7%) are enrolled in public schools. The age group of 3 to 4 year olds has the highest likelihood of being enrolled in private schools, with 40 (100.0% in the age bracket) enrolled. Conversely, the age group of 35 years and over has the lowest likelihood of being enrolled in a private school, with 13 (100.0% in the age bracket) attending a public institution.
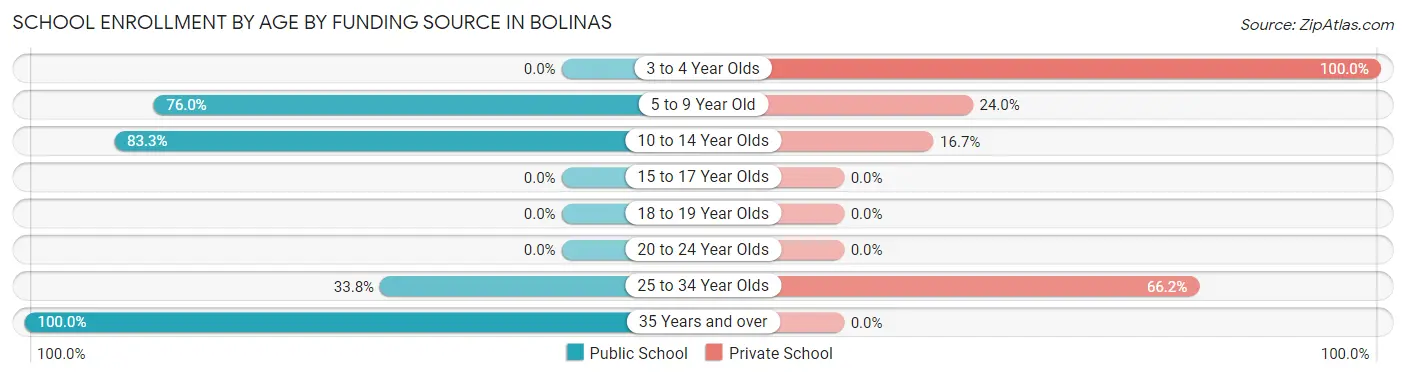
| Age Bracket | Public School | Private School |
| 3 to 4 Year Olds | 0 (0.0%) | 40 (100.0%) |
| 5 to 9 Year Old | 19 (76.0%) | 6 (24.0%) |
| 10 to 14 Year Olds | 30 (83.3%) | 6 (16.7%) |
| 15 to 17 Year Olds | 0 (0.0%) | 0 (0.0%) |
| 18 to 19 Year Olds | 0 (0.0%) | 0 (0.0%) |
| 20 to 24 Year Olds | 0 (0.0%) | 0 (0.0%) |
| 25 to 34 Year Olds | 23 (33.8%) | 45 (66.2%) |
| 35 Years and over | 13 (100.0%) | 0 (0.0%) |
| Total | 85 (46.7%) | 97 (53.3%) |
Educational Attainment by Field of Study in Bolinas
Liberal arts & history (139 | 21.2%), psychology (108 | 16.4%), bio, nature & agricultural (97 | 14.8%), social sciences (58 | 8.8%), and engineering (57 | 8.7%) are the most common fields of study among 657 individuals in Bolinas who have obtained a bachelor's degree or higher.
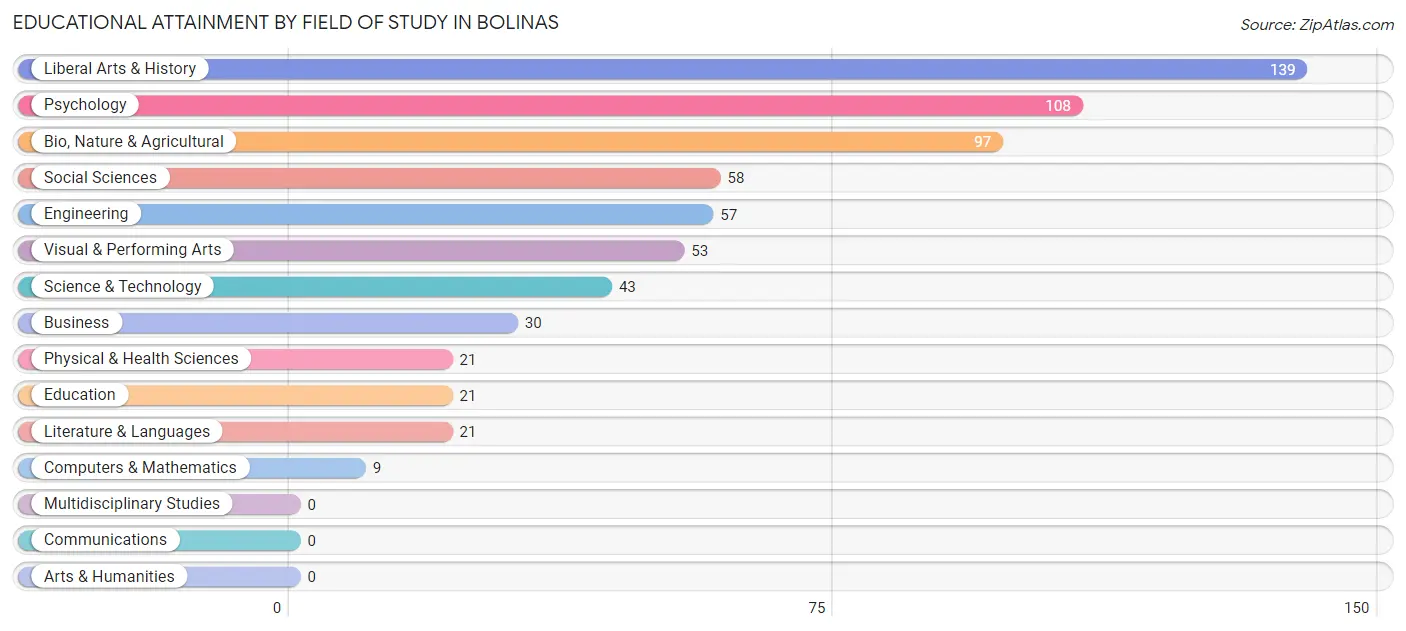
| Field of Study | # Graduates | % Graduates |
| Computers & Mathematics | 9 | 1.4% |
| Bio, Nature & Agricultural | 97 | 14.8% |
| Physical & Health Sciences | 21 | 3.2% |
| Psychology | 108 | 16.4% |
| Social Sciences | 58 | 8.8% |
| Engineering | 57 | 8.7% |
| Multidisciplinary Studies | 0 | 0.0% |
| Science & Technology | 43 | 6.5% |
| Business | 30 | 4.6% |
| Education | 21 | 3.2% |
| Literature & Languages | 21 | 3.2% |
| Liberal Arts & History | 139 | 21.2% |
| Visual & Performing Arts | 53 | 8.1% |
| Communications | 0 | 0.0% |
| Arts & Humanities | 0 | 0.0% |
| Total | 657 | 100.0% |
Transportation & Commute in Bolinas
Vehicle Availability by Sex in Bolinas
The most prevalent vehicle ownership categories in Bolinas are males with 3 vehicles (170, accounting for 46.6%) and females with 3 vehicles (57, making up 68.3%).
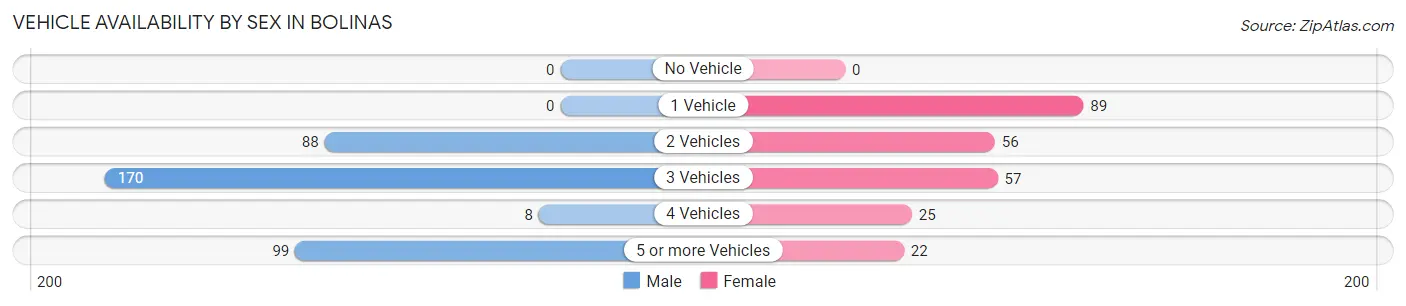
| Vehicles Available | Male | Female |
| No Vehicle | 0 (0.0%) | 0 (0.0%) |
| 1 Vehicle | 0 (0.0%) | 89 (35.7%) |
| 2 Vehicles | 88 (24.1%) | 56 (22.5%) |
| 3 Vehicles | 170 (46.6%) | 57 (22.9%) |
| 4 Vehicles | 8 (2.2%) | 25 (10.0%) |
| 5 or more Vehicles | 99 (27.1%) | 22 (8.8%) |
| Total | 365 (100.0%) | 249 (100.0%) |
Commute Time in Bolinas
The most frequently occuring commute durations in Bolinas are 10 to 14 minutes (182 commuters, 42.3%), 60 to 89 minutes (128 commuters, 29.8%), and 5 to 9 minutes (34 commuters, 7.9%).
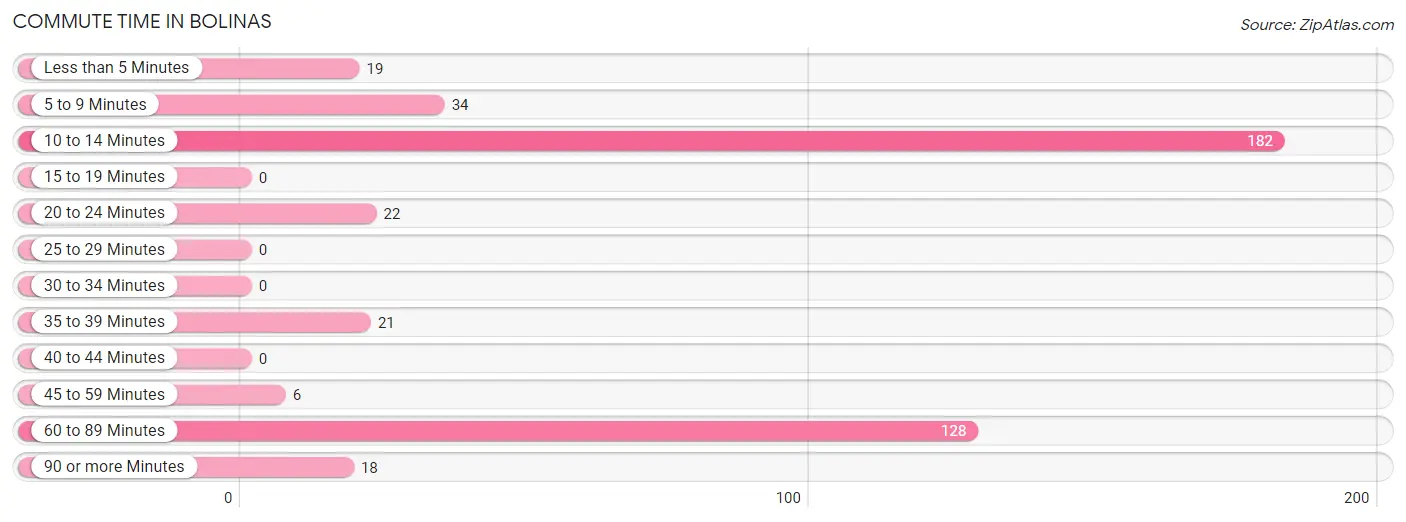
| Commute Time | # Commuters | % Commuters |
| Less than 5 Minutes | 19 | 4.4% |
| 5 to 9 Minutes | 34 | 7.9% |
| 10 to 14 Minutes | 182 | 42.3% |
| 15 to 19 Minutes | 0 | 0.0% |
| 20 to 24 Minutes | 22 | 5.1% |
| 25 to 29 Minutes | 0 | 0.0% |
| 30 to 34 Minutes | 0 | 0.0% |
| 35 to 39 Minutes | 21 | 4.9% |
| 40 to 44 Minutes | 0 | 0.0% |
| 45 to 59 Minutes | 6 | 1.4% |
| 60 to 89 Minutes | 128 | 29.8% |
| 90 or more Minutes | 18 | 4.2% |
Commute Time by Sex in Bolinas
The most common commute times in Bolinas are 10 to 14 minutes (142 commuters, 60.9%) for males and 60 to 89 minutes (112 commuters, 56.9%) for females.
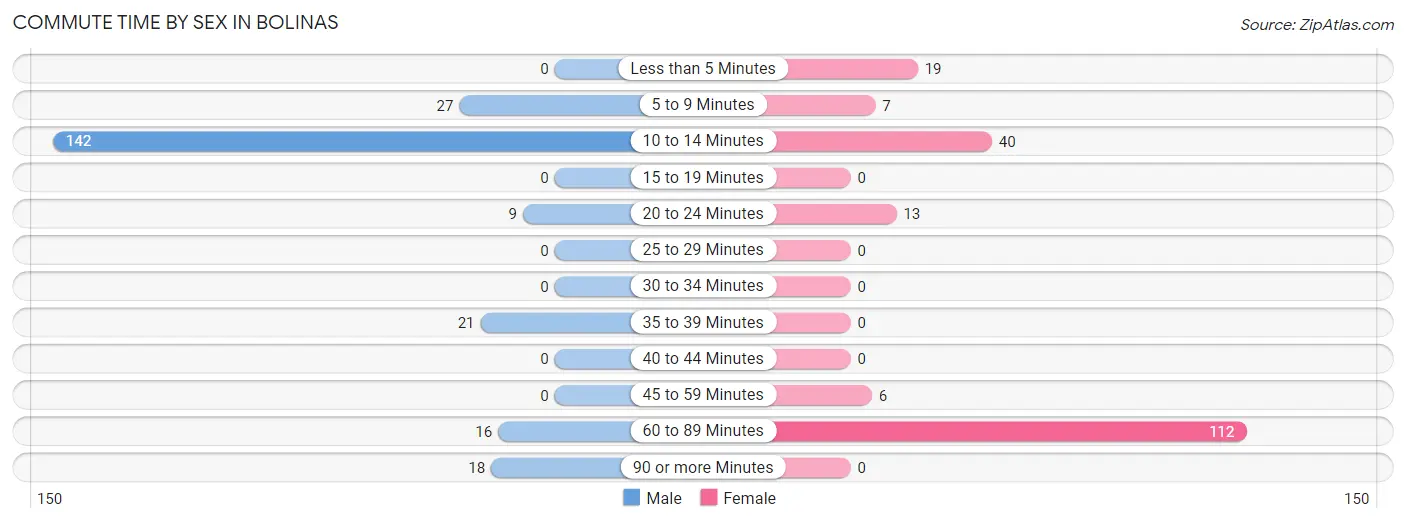
| Commute Time | Male | Female |
| Less than 5 Minutes | 0 (0.0%) | 19 (9.6%) |
| 5 to 9 Minutes | 27 (11.6%) | 7 (3.5%) |
| 10 to 14 Minutes | 142 (60.9%) | 40 (20.3%) |
| 15 to 19 Minutes | 0 (0.0%) | 0 (0.0%) |
| 20 to 24 Minutes | 9 (3.9%) | 13 (6.6%) |
| 25 to 29 Minutes | 0 (0.0%) | 0 (0.0%) |
| 30 to 34 Minutes | 0 (0.0%) | 0 (0.0%) |
| 35 to 39 Minutes | 21 (9.0%) | 0 (0.0%) |
| 40 to 44 Minutes | 0 (0.0%) | 0 (0.0%) |
| 45 to 59 Minutes | 0 (0.0%) | 6 (3.0%) |
| 60 to 89 Minutes | 16 (6.9%) | 112 (56.9%) |
| 90 or more Minutes | 18 (7.7%) | 0 (0.0%) |
Time of Departure to Work by Sex in Bolinas
The most frequent times of departure to work in Bolinas are 7:30 AM to 7:59 AM (78, 33.5%) for males and 12:00 PM to 3:59 PM (47, 23.9%) for females.
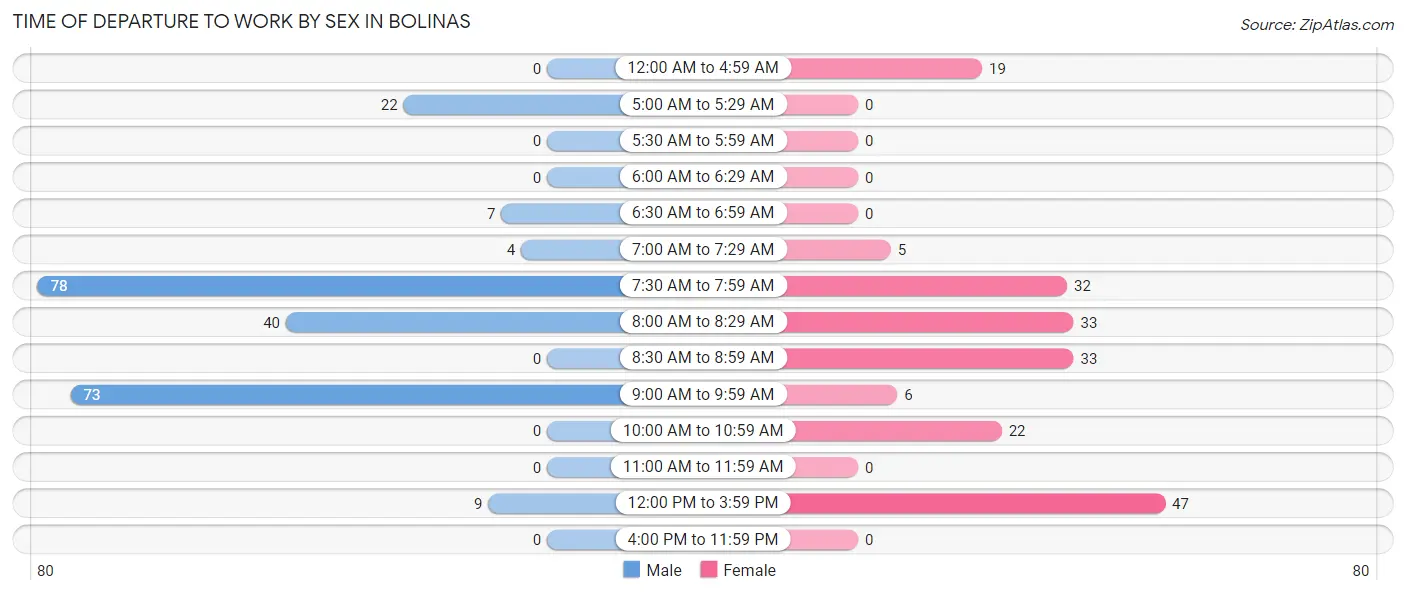
| Time of Departure | Male | Female |
| 12:00 AM to 4:59 AM | 0 (0.0%) | 19 (9.6%) |
| 5:00 AM to 5:29 AM | 22 (9.4%) | 0 (0.0%) |
| 5:30 AM to 5:59 AM | 0 (0.0%) | 0 (0.0%) |
| 6:00 AM to 6:29 AM | 0 (0.0%) | 0 (0.0%) |
| 6:30 AM to 6:59 AM | 7 (3.0%) | 0 (0.0%) |
| 7:00 AM to 7:29 AM | 4 (1.7%) | 5 (2.5%) |
| 7:30 AM to 7:59 AM | 78 (33.5%) | 32 (16.2%) |
| 8:00 AM to 8:29 AM | 40 (17.2%) | 33 (16.8%) |
| 8:30 AM to 8:59 AM | 0 (0.0%) | 33 (16.8%) |
| 9:00 AM to 9:59 AM | 73 (31.3%) | 6 (3.0%) |
| 10:00 AM to 10:59 AM | 0 (0.0%) | 22 (11.2%) |
| 11:00 AM to 11:59 AM | 0 (0.0%) | 0 (0.0%) |
| 12:00 PM to 3:59 PM | 9 (3.9%) | 47 (23.9%) |
| 4:00 PM to 11:59 PM | 0 (0.0%) | 0 (0.0%) |
| Total | 233 (100.0%) | 197 (100.0%) |
Housing Occupancy in Bolinas
Occupancy by Ownership in Bolinas
Of the total 571 dwellings in Bolinas, owner-occupied units account for 376 (65.8%), while renter-occupied units make up 195 (34.2%).
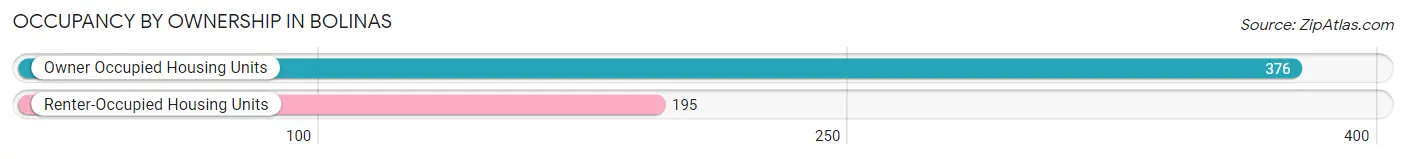
| Occupancy | # Housing Units | % Housing Units |
| Owner Occupied Housing Units | 376 | 65.8% |
| Renter-Occupied Housing Units | 195 | 34.2% |
| Total Occupied Housing Units | 571 | 100.0% |
Occupancy by Household Size in Bolinas
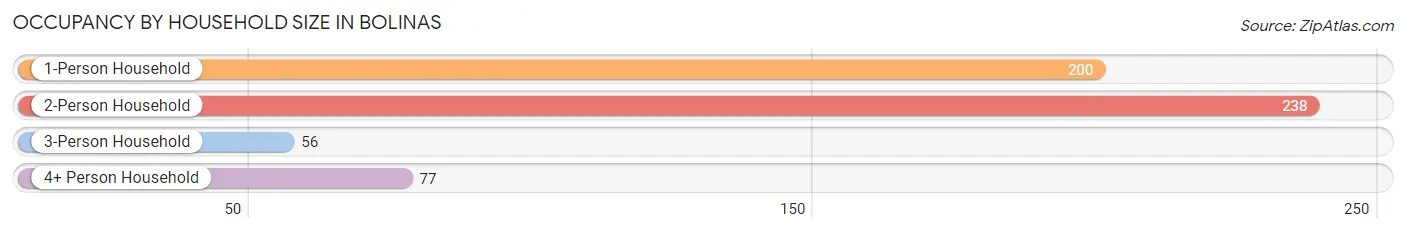
| Household Size | # Housing Units | % Housing Units |
| 1-Person Household | 200 | 35.0% |
| 2-Person Household | 238 | 41.7% |
| 3-Person Household | 56 | 9.8% |
| 4+ Person Household | 77 | 13.5% |
| Total Housing Units | 571 | 100.0% |
Occupancy by Ownership by Household Size in Bolinas
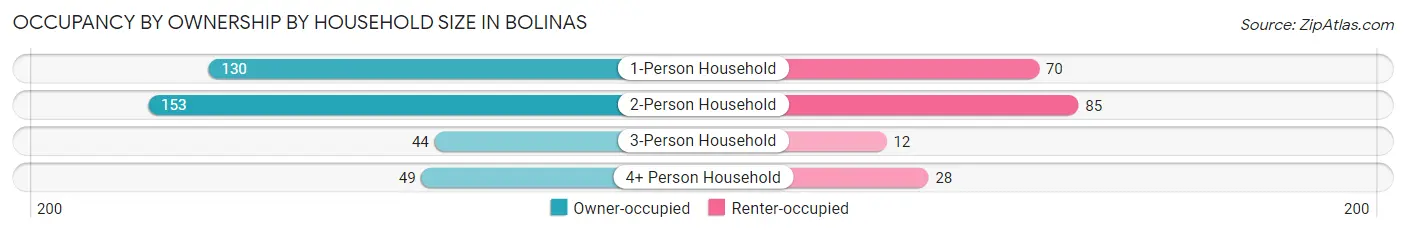
| Household Size | Owner-occupied | Renter-occupied |
| 1-Person Household | 130 (65.0%) | 70 (35.0%) |
| 2-Person Household | 153 (64.3%) | 85 (35.7%) |
| 3-Person Household | 44 (78.6%) | 12 (21.4%) |
| 4+ Person Household | 49 (63.6%) | 28 (36.4%) |
| Total Housing Units | 376 (65.8%) | 195 (34.2%) |
Occupancy by Educational Attainment in Bolinas
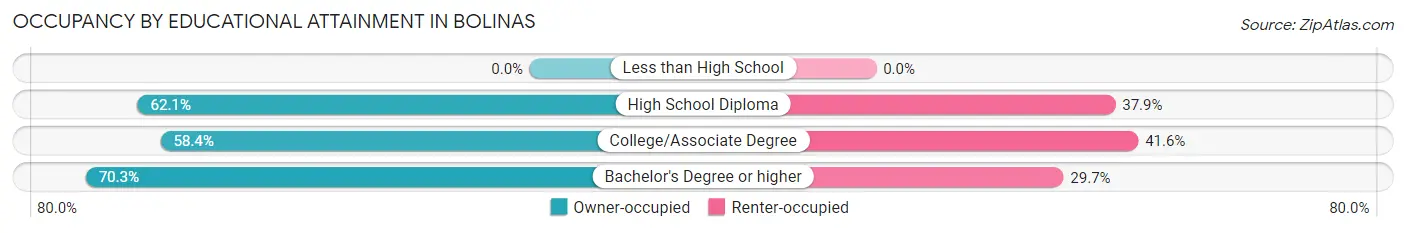
| Household Size | Owner-occupied | Renter-occupied |
| Less than High School | 0 (0.0%) | 0 (0.0%) |
| High School Diploma | 54 (62.1%) | 33 (37.9%) |
| College/Associate Degree | 90 (58.4%) | 64 (41.6%) |
| Bachelor's Degree or higher | 232 (70.3%) | 98 (29.7%) |
Occupancy by Age of Householder in Bolinas
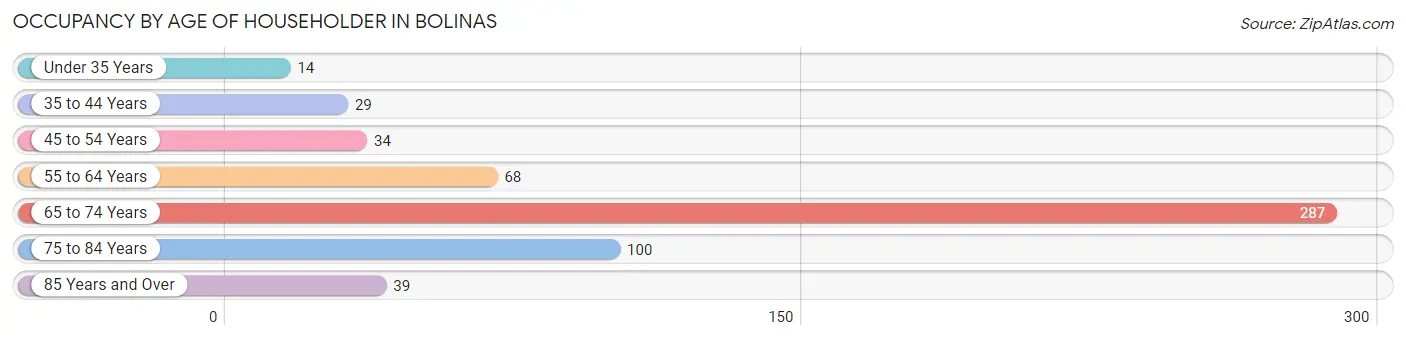
| Age Bracket | # Households | % Households |
| Under 35 Years | 14 | 2.5% |
| 35 to 44 Years | 29 | 5.1% |
| 45 to 54 Years | 34 | 5.9% |
| 55 to 64 Years | 68 | 11.9% |
| 65 to 74 Years | 287 | 50.3% |
| 75 to 84 Years | 100 | 17.5% |
| 85 Years and Over | 39 | 6.8% |
| Total | 571 | 100.0% |
Housing Finances in Bolinas
Median Income by Occupancy in Bolinas
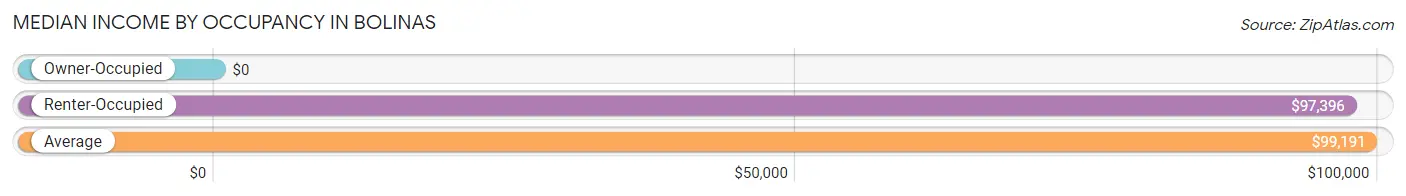
| Occupancy Type | # Households | Median Income |
| Owner-Occupied | 376 (65.8%) | $0 |
| Renter-Occupied | 195 (34.2%) | $97,396 |
| Average | 571 (100.0%) | $99,191 |
Occupancy by Householder Income Bracket in Bolinas
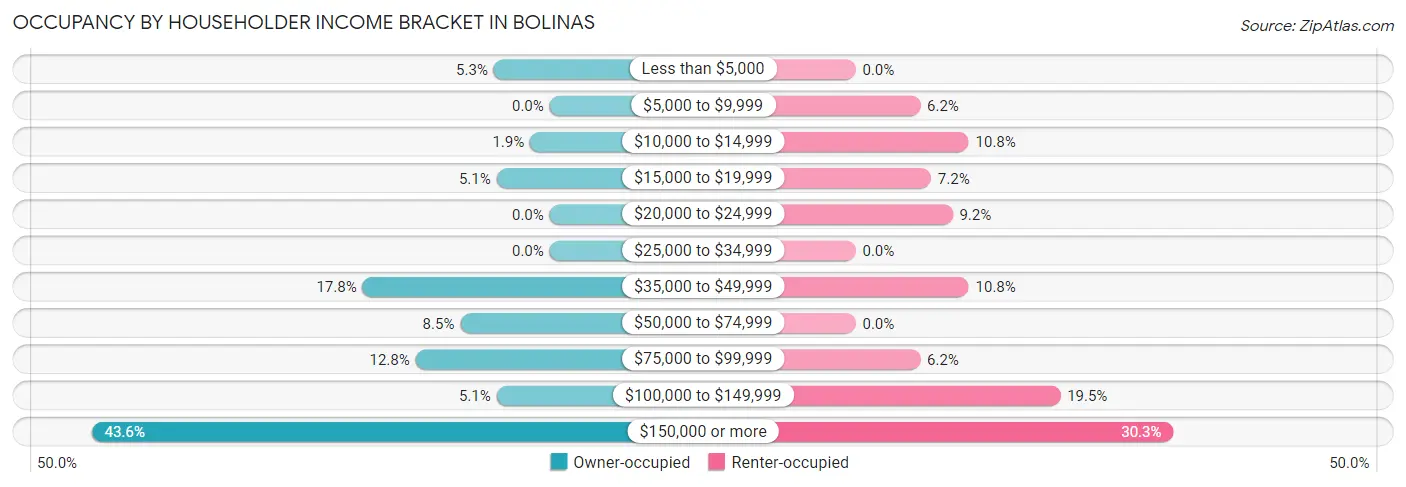
| Income Bracket | Owner-occupied | Renter-occupied |
| Less than $5,000 | 20 (5.3%) | 0 (0.0%) |
| $5,000 to $9,999 | 0 (0.0%) | 12 (6.1%) |
| $10,000 to $14,999 | 7 (1.9%) | 21 (10.8%) |
| $15,000 to $19,999 | 19 (5.1%) | 14 (7.2%) |
| $20,000 to $24,999 | 0 (0.0%) | 18 (9.2%) |
| $25,000 to $34,999 | 0 (0.0%) | 0 (0.0%) |
| $35,000 to $49,999 | 67 (17.8%) | 21 (10.8%) |
| $50,000 to $74,999 | 32 (8.5%) | 0 (0.0%) |
| $75,000 to $99,999 | 48 (12.8%) | 12 (6.1%) |
| $100,000 to $149,999 | 19 (5.1%) | 38 (19.5%) |
| $150,000 or more | 164 (43.6%) | 59 (30.3%) |
| Total | 376 (100.0%) | 195 (100.0%) |
Monthly Housing Cost Tiers in Bolinas
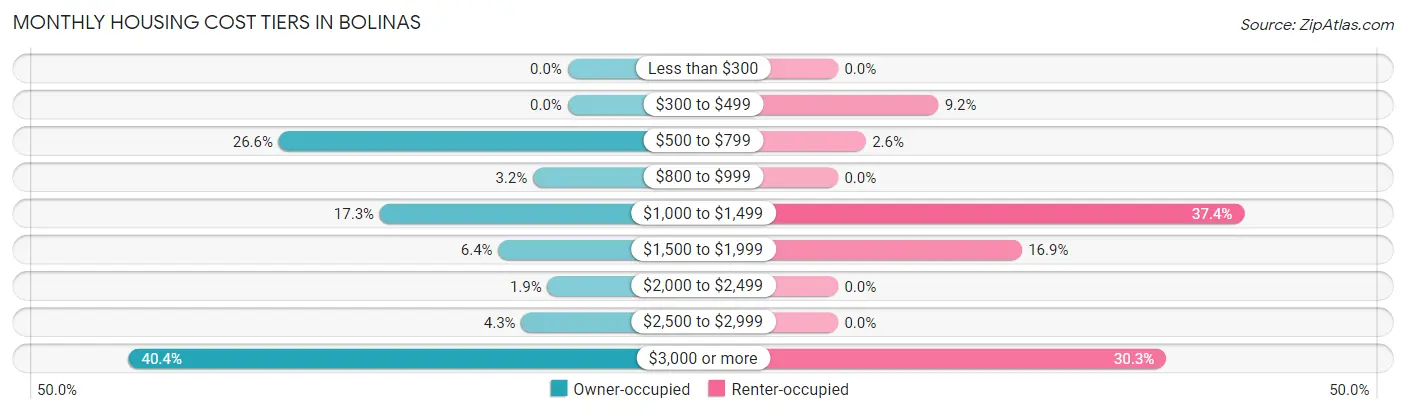
| Monthly Cost | Owner-occupied | Renter-occupied |
| Less than $300 | 0 (0.0%) | 0 (0.0%) |
| $300 to $499 | 0 (0.0%) | 18 (9.2%) |
| $500 to $799 | 100 (26.6%) | 5 (2.6%) |
| $800 to $999 | 12 (3.2%) | 0 (0.0%) |
| $1,000 to $1,499 | 65 (17.3%) | 73 (37.4%) |
| $1,500 to $1,999 | 24 (6.4%) | 33 (16.9%) |
| $2,000 to $2,499 | 7 (1.9%) | 0 (0.0%) |
| $2,500 to $2,999 | 16 (4.3%) | 0 (0.0%) |
| $3,000 or more | 152 (40.4%) | 59 (30.3%) |
| Total | 376 (100.0%) | 195 (100.0%) |
Physical Housing Characteristics in Bolinas
Housing Structures in Bolinas
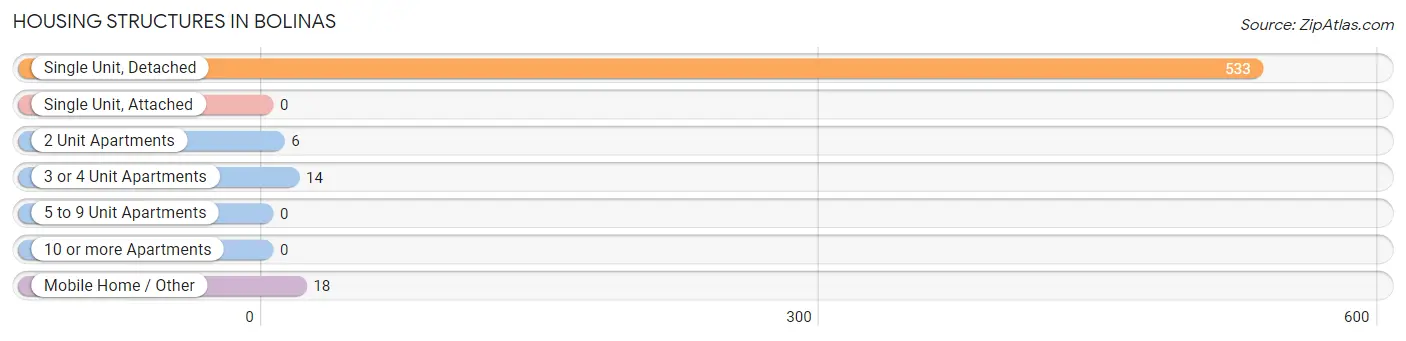
| Structure Type | # Housing Units | % Housing Units |
| Single Unit, Detached | 533 | 93.3% |
| Single Unit, Attached | 0 | 0.0% |
| 2 Unit Apartments | 6 | 1.1% |
| 3 or 4 Unit Apartments | 14 | 2.5% |
| 5 to 9 Unit Apartments | 0 | 0.0% |
| 10 or more Apartments | 0 | 0.0% |
| Mobile Home / Other | 18 | 3.2% |
| Total | 571 | 100.0% |
Housing Structures by Occupancy in Bolinas
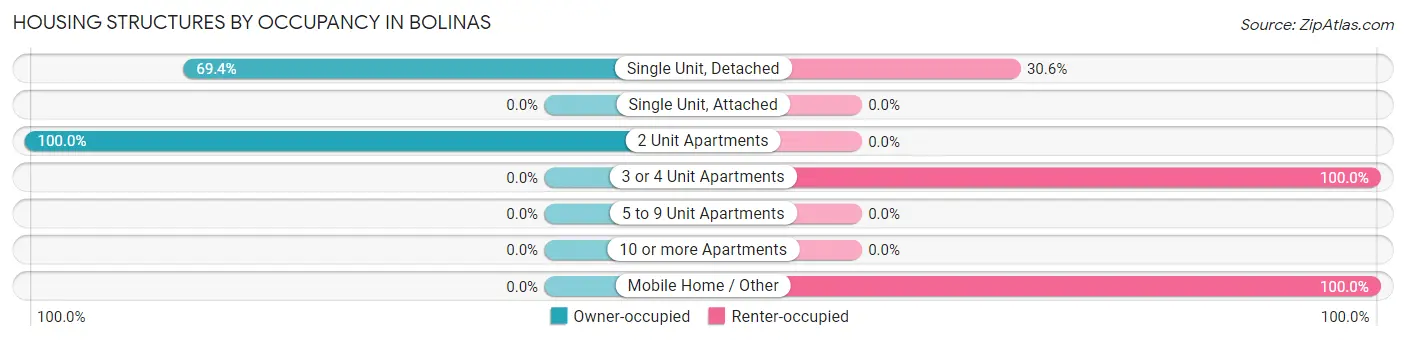
| Structure Type | Owner-occupied | Renter-occupied |
| Single Unit, Detached | 370 (69.4%) | 163 (30.6%) |
| Single Unit, Attached | 0 (0.0%) | 0 (0.0%) |
| 2 Unit Apartments | 6 (100.0%) | 0 (0.0%) |
| 3 or 4 Unit Apartments | 0 (0.0%) | 14 (100.0%) |
| 5 to 9 Unit Apartments | 0 (0.0%) | 0 (0.0%) |
| 10 or more Apartments | 0 (0.0%) | 0 (0.0%) |
| Mobile Home / Other | 0 (0.0%) | 18 (100.0%) |
| Total | 376 (65.8%) | 195 (34.2%) |
Housing Structures by Number of Rooms in Bolinas
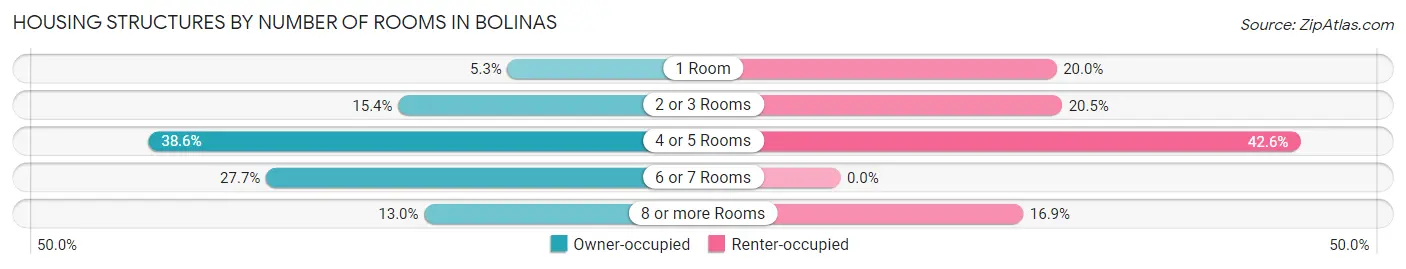
| Number of Rooms | Owner-occupied | Renter-occupied |
| 1 Room | 20 (5.3%) | 39 (20.0%) |
| 2 or 3 Rooms | 58 (15.4%) | 40 (20.5%) |
| 4 or 5 Rooms | 145 (38.6%) | 83 (42.6%) |
| 6 or 7 Rooms | 104 (27.7%) | 0 (0.0%) |
| 8 or more Rooms | 49 (13.0%) | 33 (16.9%) |
| Total | 376 (100.0%) | 195 (100.0%) |
Housing Structure by Heating Type in Bolinas
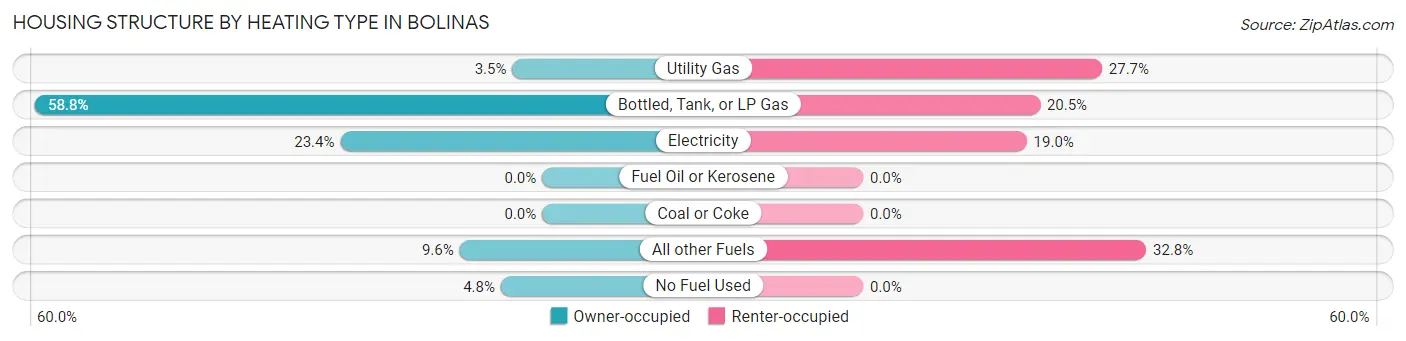
| Heating Type | Owner-occupied | Renter-occupied |
| Utility Gas | 13 (3.5%) | 54 (27.7%) |
| Bottled, Tank, or LP Gas | 221 (58.8%) | 40 (20.5%) |
| Electricity | 88 (23.4%) | 37 (19.0%) |
| Fuel Oil or Kerosene | 0 (0.0%) | 0 (0.0%) |
| Coal or Coke | 0 (0.0%) | 0 (0.0%) |
| All other Fuels | 36 (9.6%) | 64 (32.8%) |
| No Fuel Used | 18 (4.8%) | 0 (0.0%) |
| Total | 376 (100.0%) | 195 (100.0%) |
Household Vehicle Usage in Bolinas
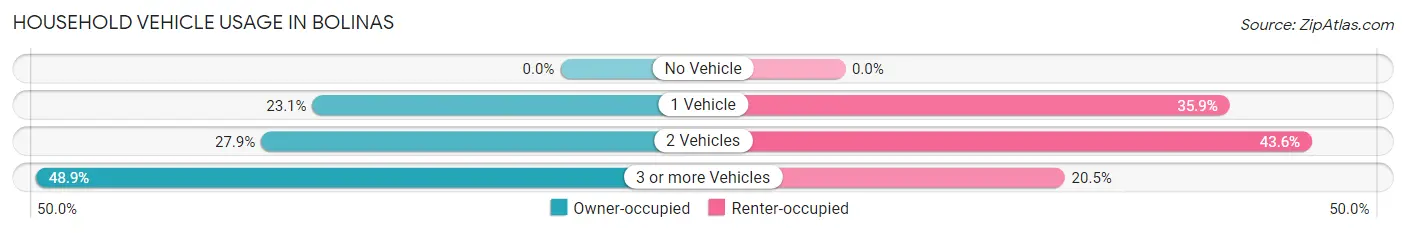
| Vehicles per Household | Owner-occupied | Renter-occupied |
| No Vehicle | 0 (0.0%) | 0 (0.0%) |
| 1 Vehicle | 87 (23.1%) | 70 (35.9%) |
| 2 Vehicles | 105 (27.9%) | 85 (43.6%) |
| 3 or more Vehicles | 184 (48.9%) | 40 (20.5%) |
| Total | 376 (100.0%) | 195 (100.0%) |
Real Estate & Mortgages in Bolinas
Real Estate and Mortgage Overview in Bolinas
| Characteristic | Without Mortgage | With Mortgage |
| Housing Units | 193 | 183 |
| Median Property Value | $1,153,100 | $2,000,001 |
| Median Household Income | - | - |
| Monthly Housing Costs | $787 | $152 |
| Real Estate Taxes | $5,240 | $0 |
Property Value by Mortgage Status in Bolinas
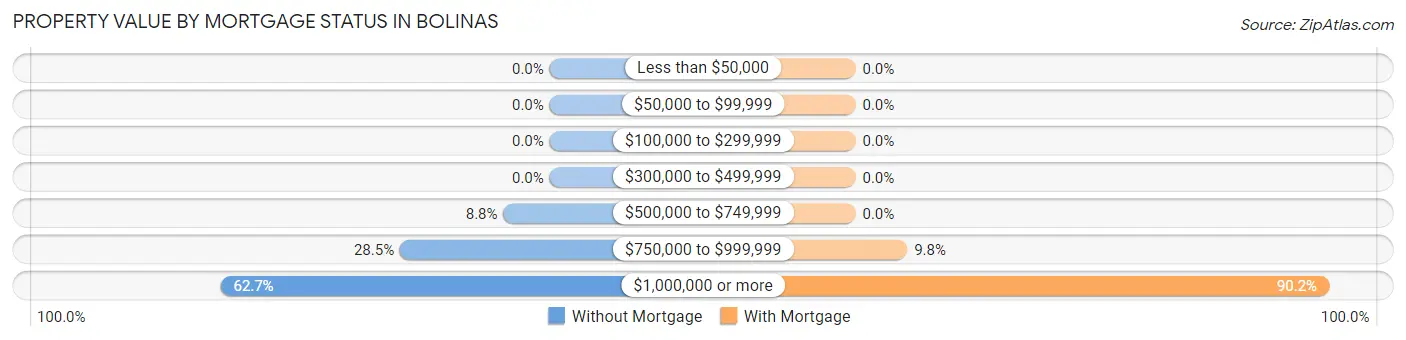
| Property Value | Without Mortgage | With Mortgage |
| Less than $50,000 | 0 (0.0%) | 0 (0.0%) |
| $50,000 to $99,999 | 0 (0.0%) | 0 (0.0%) |
| $100,000 to $299,999 | 0 (0.0%) | 0 (0.0%) |
| $300,000 to $499,999 | 0 (0.0%) | 0 (0.0%) |
| $500,000 to $749,999 | 17 (8.8%) | 0 (0.0%) |
| $750,000 to $999,999 | 55 (28.5%) | 18 (9.8%) |
| $1,000,000 or more | 121 (62.7%) | 165 (90.2%) |
| Total | 193 (100.0%) | 183 (100.0%) |
Household Income by Mortgage Status in Bolinas
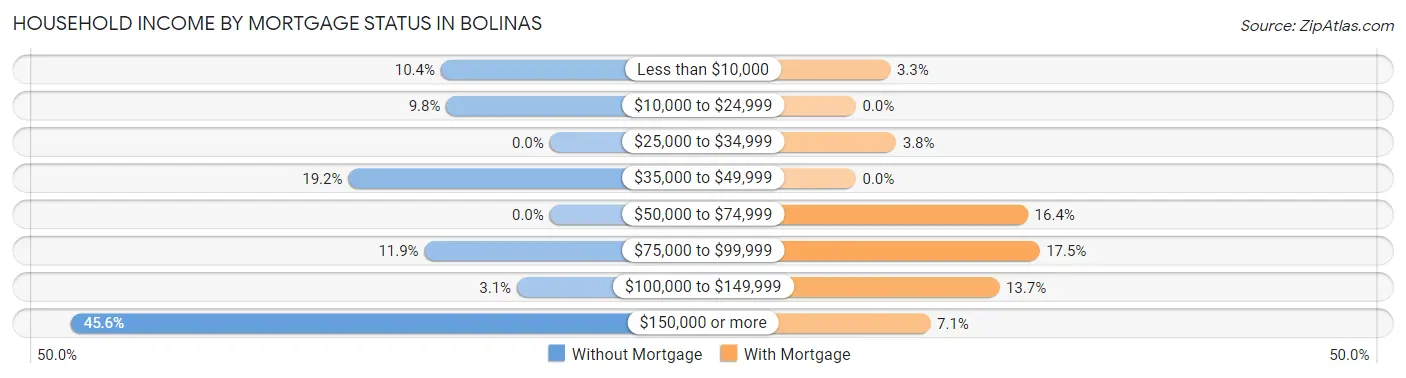
| Household Income | Without Mortgage | With Mortgage |
| Less than $10,000 | 20 (10.4%) | 6 (3.3%) |
| $10,000 to $24,999 | 19 (9.8%) | 0 (0.0%) |
| $25,000 to $34,999 | 0 (0.0%) | 7 (3.8%) |
| $35,000 to $49,999 | 37 (19.2%) | 0 (0.0%) |
| $50,000 to $74,999 | 0 (0.0%) | 30 (16.4%) |
| $75,000 to $99,999 | 23 (11.9%) | 32 (17.5%) |
| $100,000 to $149,999 | 6 (3.1%) | 25 (13.7%) |
| $150,000 or more | 88 (45.6%) | 13 (7.1%) |
| Total | 193 (100.0%) | 183 (100.0%) |
Property Value to Household Income Ratio in Bolinas
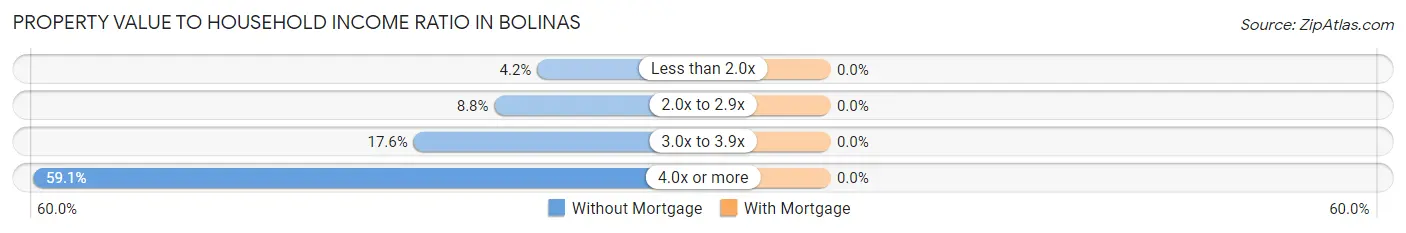
| Value-to-Income Ratio | Without Mortgage | With Mortgage |
| Less than 2.0x | 8 (4.2%) | 0 (0.0%) |
| 2.0x to 2.9x | 17 (8.8%) | 0 (0.0%) |
| 3.0x to 3.9x | 34 (17.6%) | 0 (0.0%) |
| 4.0x or more | 114 (59.1%) | 0 (0.0%) |
| Total | 193 (100.0%) | 183 (100.0%) |
Real Estate Taxes by Mortgage Status in Bolinas
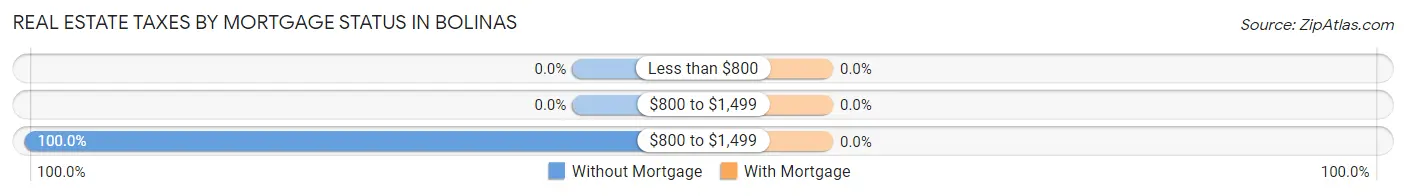
| Property Taxes | Without Mortgage | With Mortgage |
| Less than $800 | 0 (0.0%) | 0 (0.0%) |
| $800 to $1,499 | 0 (0.0%) | 0 (0.0%) |
| $800 to $1,499 | 193 (100.0%) | 0 (0.0%) |
| Total | 193 (100.0%) | 183 (100.0%) |
Health & Disability in Bolinas
Health Insurance Coverage by Age in Bolinas
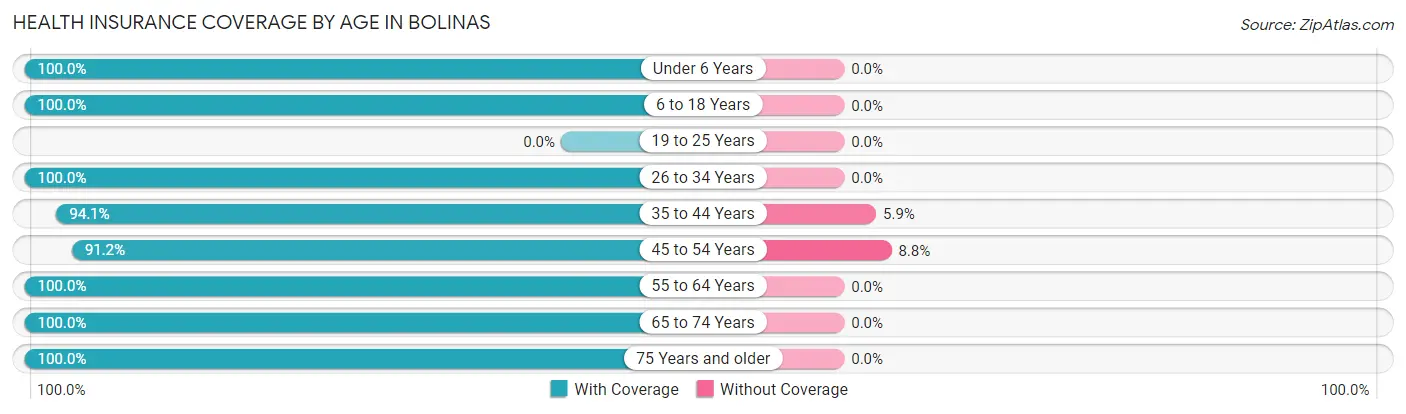
| Age Bracket | With Coverage | Without Coverage |
| Under 6 Years | 40 (100.0%) | 0 (0.0%) |
| 6 to 18 Years | 61 (100.0%) | 0 (0.0%) |
| 19 to 25 Years | 0 (0.0%) | 0 (0.0%) |
| 26 to 34 Years | 123 (100.0%) | 0 (0.0%) |
| 35 to 44 Years | 127 (94.1%) | 8 (5.9%) |
| 45 to 54 Years | 114 (91.2%) | 11 (8.8%) |
| 55 to 64 Years | 131 (100.0%) | 0 (0.0%) |
| 65 to 74 Years | 452 (100.0%) | 0 (0.0%) |
| 75 Years and older | 213 (100.0%) | 0 (0.0%) |
| Total | 1,261 (98.5%) | 19 (1.5%) |
Health Insurance Coverage by Citizenship Status in Bolinas
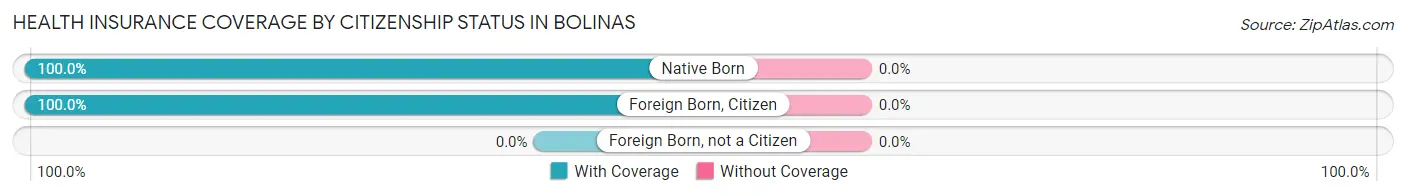
| Citizenship Status | With Coverage | Without Coverage |
| Native Born | 40 (100.0%) | 0 (0.0%) |
| Foreign Born, Citizen | 61 (100.0%) | 0 (0.0%) |
| Foreign Born, not a Citizen | 0 (0.0%) | 0 (0.0%) |
Health Insurance Coverage by Household Income in Bolinas
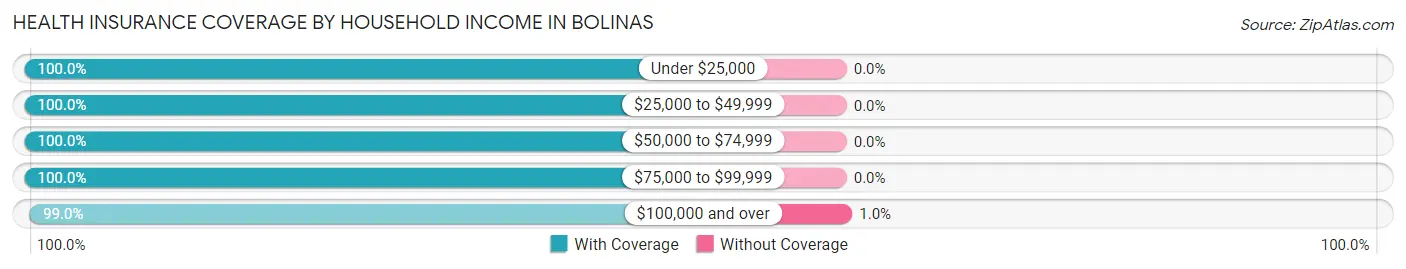
| Household Income | With Coverage | Without Coverage |
| Under $25,000 | 143 (100.0%) | 0 (0.0%) |
| $25,000 to $49,999 | 105 (100.0%) | 0 (0.0%) |
| $50,000 to $74,999 | 96 (100.0%) | 0 (0.0%) |
| $75,000 to $99,999 | 137 (100.0%) | 0 (0.0%) |
| $100,000 and over | 759 (99.0%) | 8 (1.0%) |
Public vs Private Health Insurance Coverage by Age in Bolinas
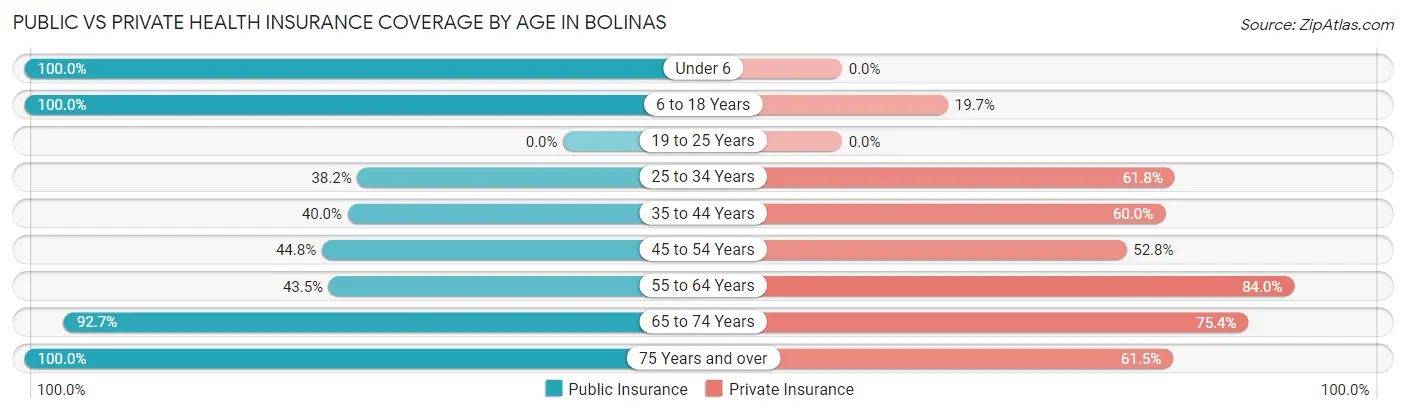
| Age Bracket | Public Insurance | Private Insurance |
| Under 6 | 40 (100.0%) | 0 (0.0%) |
| 6 to 18 Years | 61 (100.0%) | 12 (19.7%) |
| 19 to 25 Years | 0 (0.0%) | 0 (0.0%) |
| 25 to 34 Years | 47 (38.2%) | 76 (61.8%) |
| 35 to 44 Years | 54 (40.0%) | 81 (60.0%) |
| 45 to 54 Years | 56 (44.8%) | 66 (52.8%) |
| 55 to 64 Years | 57 (43.5%) | 110 (84.0%) |
| 65 to 74 Years | 419 (92.7%) | 341 (75.4%) |
| 75 Years and over | 213 (100.0%) | 131 (61.5%) |
| Total | 947 (74.0%) | 817 (63.8%) |
Disability Status by Sex by Age in Bolinas
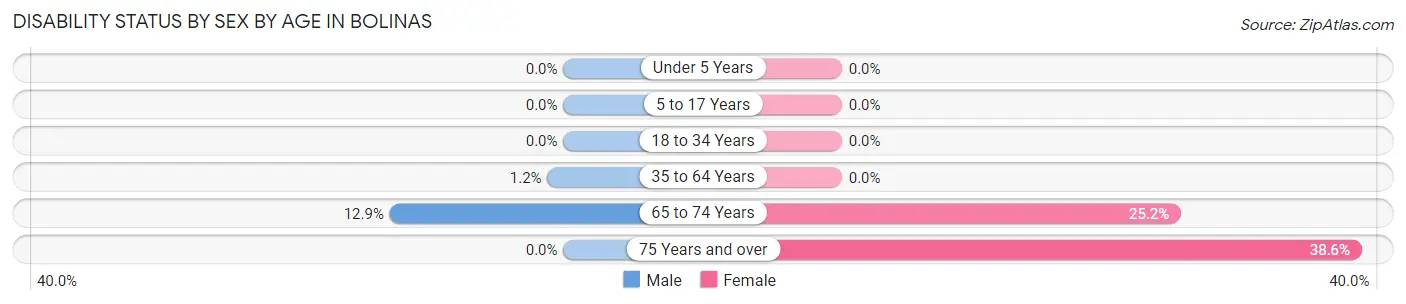
| Age Bracket | Male | Female |
| Under 5 Years | 0 (0.0%) | 0 (0.0%) |
| 5 to 17 Years | 0 (0.0%) | 0 (0.0%) |
| 18 to 34 Years | 0 (0.0%) | 0 (0.0%) |
| 35 to 64 Years | 3 (1.2%) | 0 (0.0%) |
| 65 to 74 Years | 25 (12.9%) | 65 (25.2%) |
| 75 Years and over | 0 (0.0%) | 39 (38.6%) |
Disability Class by Sex by Age in Bolinas
Disability Class: Hearing Difficulty
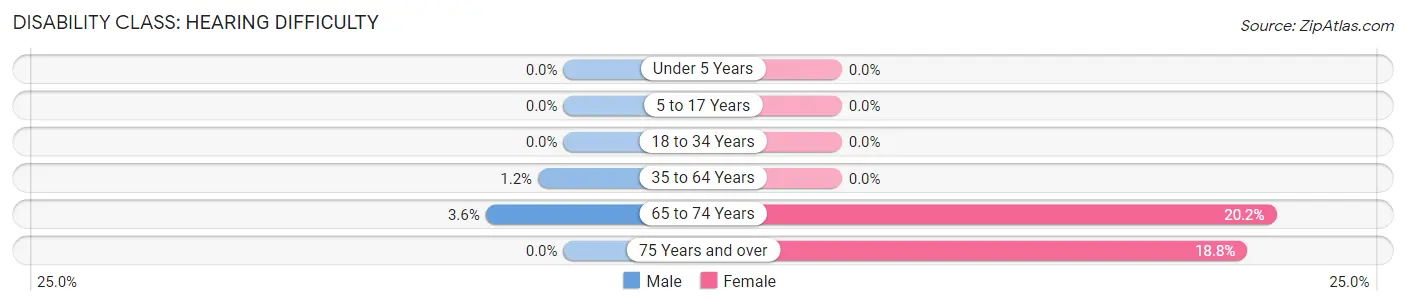
| Age Bracket | Male | Female |
| Under 5 Years | 0 (0.0%) | 0 (0.0%) |
| 5 to 17 Years | 0 (0.0%) | 0 (0.0%) |
| 18 to 34 Years | 0 (0.0%) | 0 (0.0%) |
| 35 to 64 Years | 3 (1.2%) | 0 (0.0%) |
| 65 to 74 Years | 7 (3.6%) | 52 (20.2%) |
| 75 Years and over | 0 (0.0%) | 19 (18.8%) |
Disability Class: Vision Difficulty
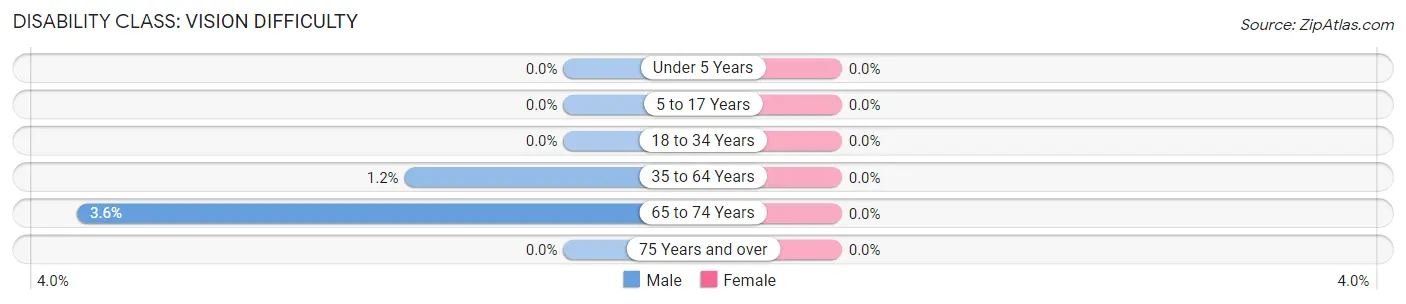
| Age Bracket | Male | Female |
| Under 5 Years | 0 (0.0%) | 0 (0.0%) |
| 5 to 17 Years | 0 (0.0%) | 0 (0.0%) |
| 18 to 34 Years | 0 (0.0%) | 0 (0.0%) |
| 35 to 64 Years | 3 (1.2%) | 0 (0.0%) |
| 65 to 74 Years | 7 (3.6%) | 0 (0.0%) |
| 75 Years and over | 0 (0.0%) | 0 (0.0%) |
Disability Class: Cognitive Difficulty
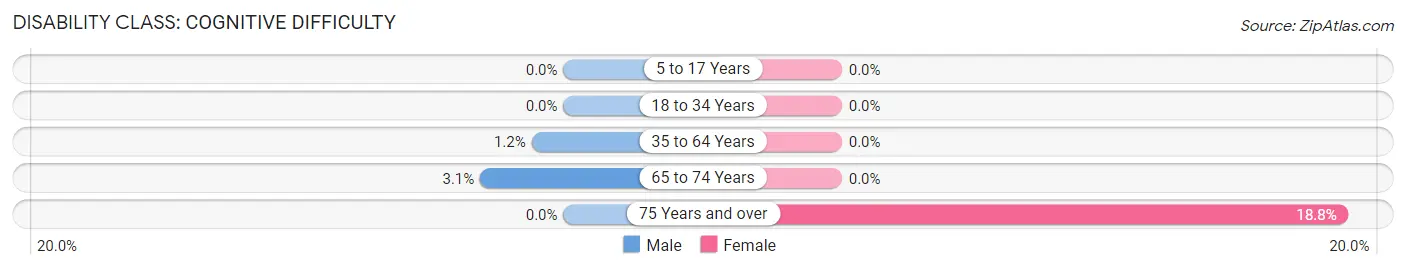
| Age Bracket | Male | Female |
| 5 to 17 Years | 0 (0.0%) | 0 (0.0%) |
| 18 to 34 Years | 0 (0.0%) | 0 (0.0%) |
| 35 to 64 Years | 3 (1.2%) | 0 (0.0%) |
| 65 to 74 Years | 6 (3.1%) | 0 (0.0%) |
| 75 Years and over | 0 (0.0%) | 19 (18.8%) |
Disability Class: Ambulatory Difficulty
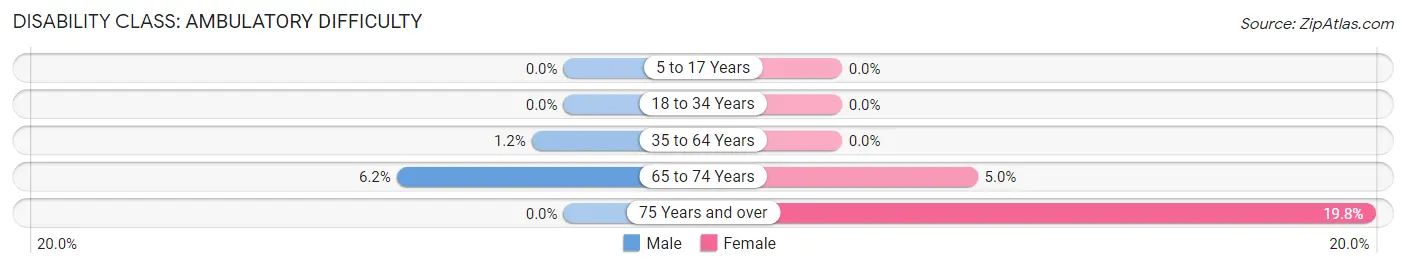
| Age Bracket | Male | Female |
| 5 to 17 Years | 0 (0.0%) | 0 (0.0%) |
| 18 to 34 Years | 0 (0.0%) | 0 (0.0%) |
| 35 to 64 Years | 3 (1.2%) | 0 (0.0%) |
| 65 to 74 Years | 12 (6.2%) | 13 (5.0%) |
| 75 Years and over | 0 (0.0%) | 20 (19.8%) |
Disability Class: Self-Care Difficulty
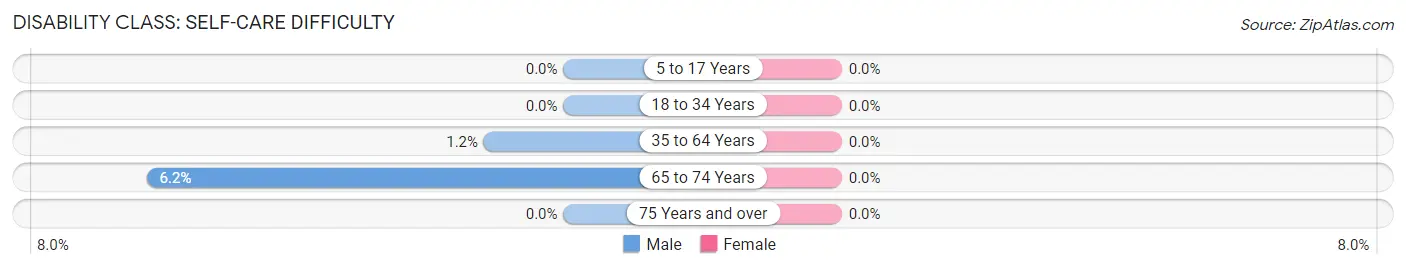
| Age Bracket | Male | Female |
| 5 to 17 Years | 0 (0.0%) | 0 (0.0%) |
| 18 to 34 Years | 0 (0.0%) | 0 (0.0%) |
| 35 to 64 Years | 3 (1.2%) | 0 (0.0%) |
| 65 to 74 Years | 12 (6.2%) | 0 (0.0%) |
| 75 Years and over | 0 (0.0%) | 0 (0.0%) |
Technology Access in Bolinas
Computing Device Access in Bolinas
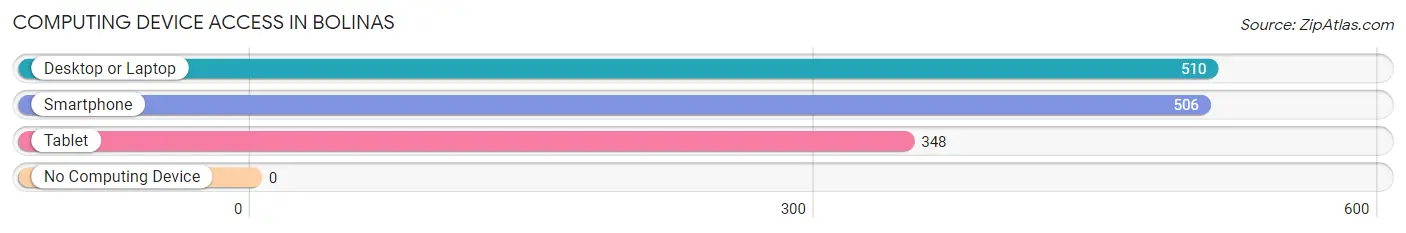
| Device Type | # Households | % Households |
| Desktop or Laptop | 510 | 89.3% |
| Smartphone | 506 | 88.6% |
| Tablet | 348 | 61.0% |
| No Computing Device | 0 | 0.0% |
| Total | 571 | 100.0% |
Internet Access in Bolinas
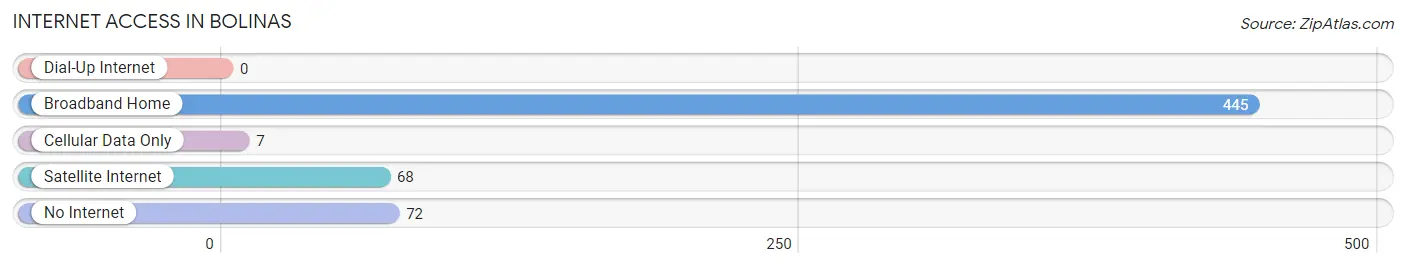
| Internet Type | # Households | % Households |
| Dial-Up Internet | 0 | 0.0% |
| Broadband Home | 445 | 77.9% |
| Cellular Data Only | 7 | 1.2% |
| Satellite Internet | 68 | 11.9% |
| No Internet | 72 | 12.6% |
| Total | 571 | 100.0% |
Bolinas Summary
Bolinas is a small coastal town located in Marin County, California, United States. It is situated on the Pacific Coast, approximately 30 miles northwest of San Francisco. The town has a population of 1,620 people as of the 2010 census.
History
The area that is now Bolinas was originally inhabited by the Coast Miwok Native American tribe. The first European settlers arrived in the area in the late 1700s, and the town was officially founded in 1866. The town was named after Bolinas Lagoon, which was named after the Spanish explorer Vicente de Soto Bolinas.
The town was a popular tourist destination in the late 1800s and early 1900s, and it was known for its beautiful beaches and scenic views. The town was also home to a number of artists and writers, including Jack London and Ansel Adams.
In the 1960s, the town became a center of the counterculture movement. The town was known for its liberal politics and its opposition to development. In the 1970s, the town was the site of a number of protests against the Vietnam War.
Geography
Bolinas is located on the Pacific Coast, approximately 30 miles northwest of San Francisco. The town is situated on a peninsula, surrounded by Bolinas Lagoon to the east and the Pacific Ocean to the west. The town is located in a temperate climate zone, with mild temperatures year-round.
The town is home to a number of beaches, including Stinson Beach, Agate Beach, and Bolinas Beach. The town is also home to a number of parks, including Bolinas Lagoon State Marine Reserve and Bolinas Lagoon State Marine Conservation Area.
Economy
The economy of Bolinas is largely based on tourism and fishing. The town is home to a number of restaurants, hotels, and other tourist attractions. The town is also home to a number of art galleries and shops.
The town is also home to a number of commercial fishing operations. The town is home to a number of seafood processing plants, and the local economy is supported by the sale of seafood products.
Demographics
As of the 2010 census, the population of Bolinas was 1,620 people. The racial makeup of the town was 87.3% White, 0.6% African American, 0.9% Native American, 0.9% Asian, 0.1% Pacific Islander, 8.2% from other races, and 2.1% from two or more races. The median household income was $68,750, and the median family income was $77,500.
The town is home to a number of religious organizations, including the Bolinas Community Church, the Bolinas United Methodist Church, and the Bolinas Presbyterian Church. The town is also home to a number of schools, including the Bolinas-Stinson Union School District and the Bolinas-Stinson High School.
Common Questions
What is Per Capita Income in Bolinas?
Per Capita income in Bolinas is $88,127.
What is the Median Family Income in Bolinas?
Median Family Income in Bolinas is $185,134.
What is the Median Household income in Bolinas?
Median Household Income in Bolinas is $99,191.
What is Income or Wage Gap in Bolinas?
Income or Wage Gap in Bolinas is 66.3%.
Women in Bolinas earn 33.7 cents for every dollar earned by a man.
What is Inequality or Gini Index in Bolinas?
Inequality or Gini Index in Bolinas is 0.55.
What is the Total Population of Bolinas?
Total Population of Bolinas is 1,280.
What is the Total Male Population of Bolinas?
Total Male Population of Bolinas is 684.
What is the Total Female Population of Bolinas?
Total Female Population of Bolinas is 596.
What is the Ratio of Males per 100 Females in Bolinas?
There are 114.77 Males per 100 Females in Bolinas.
What is the Ratio of Females per 100 Males in Bolinas?
There are 87.13 Females per 100 Males in Bolinas.
What is the Median Population Age in Bolinas?
Median Population Age in Bolinas is 65.4 Years.
What is the Average Family Size in Bolinas
Average Family Size in Bolinas is 2.5 People.
What is the Average Household Size in Bolinas
Average Household Size in Bolinas is 2.2 People.
How Large is the Labor Force in Bolinas?
There are 658 People in the Labor Forcein in Bolinas.
What is the Percentage of People in the Labor Force in Bolinas?
55.8% of People are in the Labor Force in Bolinas.
What is the Unemployment Rate in Bolinas?
Unemployment Rate in Bolinas is 2.3%.