Woodlands, CA Map & Demographics
Woodlands Map
Woodlands Overview
$84,908
PER CAPITA INCOME
$154,233
AVG FAMILY INCOME
$151,736
AVG HOUSEHOLD INCOME
59.4%
WAGE / INCOME GAP [ % ]
40.6¢/ $1
WAGE / INCOME GAP [ $ ]
0.33
INEQUALITY / GINI INDEX
1,924
TOTAL POPULATION
923
MALE POPULATION
1,001
FEMALE POPULATION
92.21
MALES / 100 FEMALES
108.45
FEMALES / 100 MALES
69.1
MEDIAN AGE
2.0
AVG FAMILY SIZE
1.9
AVG HOUSEHOLD SIZE
550
LABOR FORCE [ PEOPLE ]
28.6%
PERCENT IN LABOR FORCE
Income in Woodlands
Income Overview in Woodlands
Per Capita Income in Woodlands is $84,908, while median incomes of families and households are $154,233 and $151,736 respectively.
| Characteristic | Number | Measure |
| Per Capita Income | 1,924 | $84,908 |
| Median Family Income | 891 | $154,233 |
| Mean Family Income | 891 | $168,171 |
| Median Household Income | 1,009 | $151,736 |
| Mean Household Income | 1,009 | $159,893 |
| Income Deficit | 891 | $0 |
| Wage / Income Gap (%) | 1,924 | 59.42% |
| Wage / Income Gap ($) | 1,924 | 40.58¢ per $1 |
| Gini / Inequality Index | 1,924 | 0.33 |
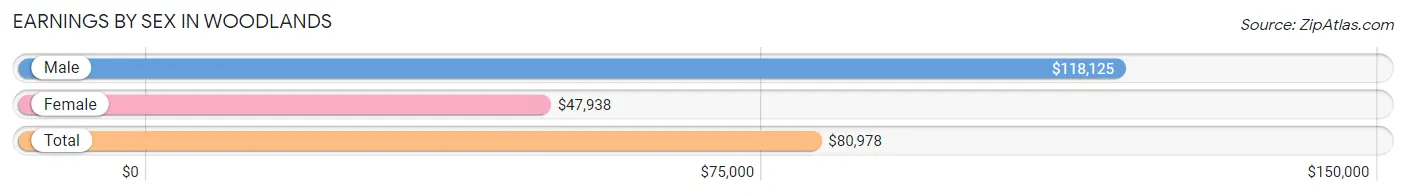
Earnings by Sex in Woodlands
Average Earnings in Woodlands are $80,978, $118,125 for men and $47,938 for women, a difference of 59.4%.
| Sex | Number | Average Earnings |
| Male | 361 (48.5%) | $118,125 |
| Female | 383 (51.5%) | $47,938 |
| Total | 744 (100.0%) | $80,978 |
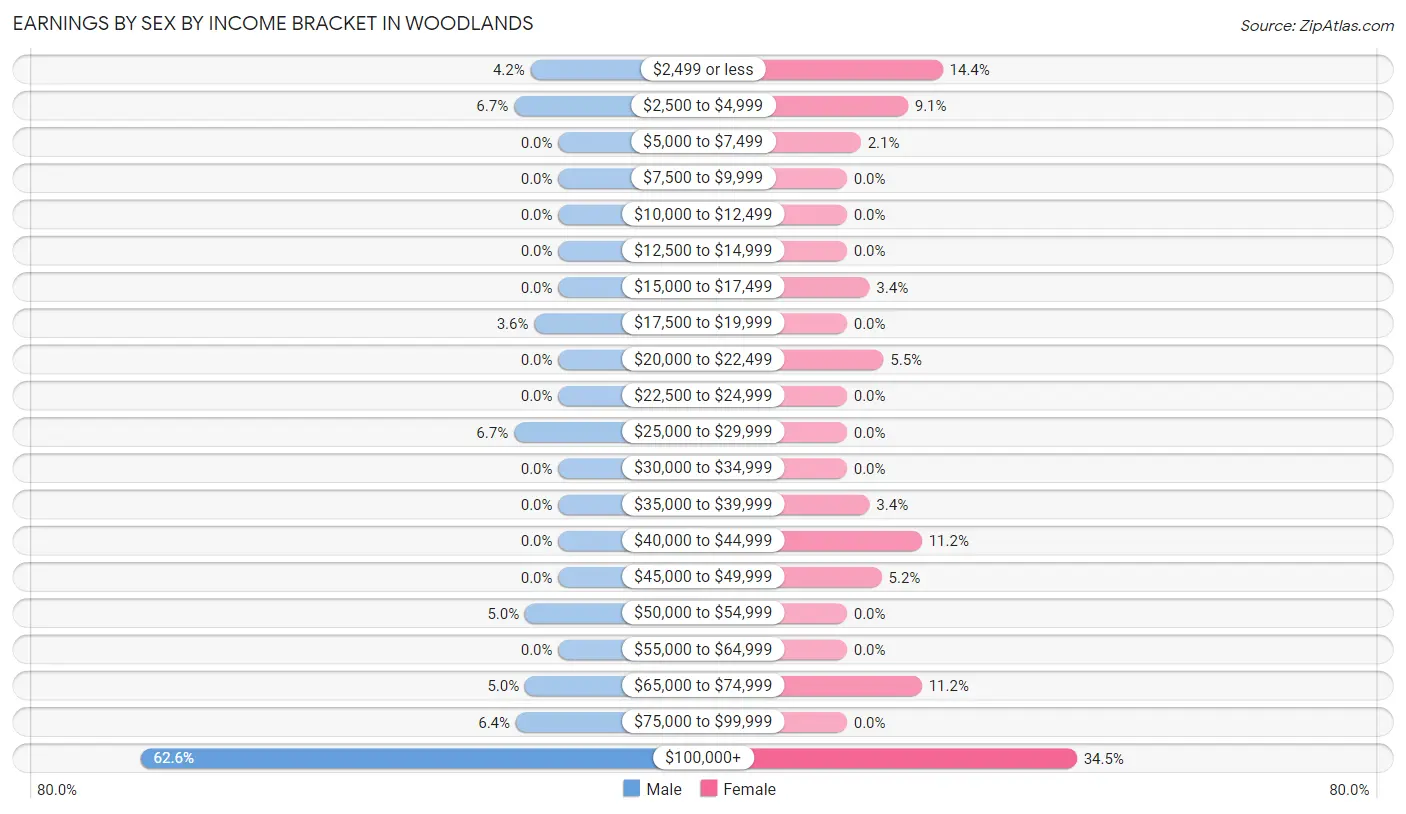
Earnings by Sex by Income Bracket in Woodlands
The most common earnings brackets in Woodlands are $100,000+ for men (226 | 62.6%) and $100,000+ for women (132 | 34.5%).
| Income | Male | Female |
| $2,499 or less | 15 (4.2%) | 55 (14.4%) |
| $2,500 to $4,999 | 24 (6.7%) | 35 (9.1%) |
| $5,000 to $7,499 | 0 (0.0%) | 8 (2.1%) |
| $7,500 to $9,999 | 0 (0.0%) | 0 (0.0%) |
| $10,000 to $12,499 | 0 (0.0%) | 0 (0.0%) |
| $12,500 to $14,999 | 0 (0.0%) | 0 (0.0%) |
| $15,000 to $17,499 | 0 (0.0%) | 13 (3.4%) |
| $17,500 to $19,999 | 13 (3.6%) | 0 (0.0%) |
| $20,000 to $22,499 | 0 (0.0%) | 21 (5.5%) |
| $22,500 to $24,999 | 0 (0.0%) | 0 (0.0%) |
| $25,000 to $29,999 | 24 (6.7%) | 0 (0.0%) |
| $30,000 to $34,999 | 0 (0.0%) | 0 (0.0%) |
| $35,000 to $39,999 | 0 (0.0%) | 13 (3.4%) |
| $40,000 to $44,999 | 0 (0.0%) | 43 (11.2%) |
| $45,000 to $49,999 | 0 (0.0%) | 20 (5.2%) |
| $50,000 to $54,999 | 18 (5.0%) | 0 (0.0%) |
| $55,000 to $64,999 | 0 (0.0%) | 0 (0.0%) |
| $65,000 to $74,999 | 18 (5.0%) | 43 (11.2%) |
| $75,000 to $99,999 | 23 (6.4%) | 0 (0.0%) |
| $100,000+ | 226 (62.6%) | 132 (34.5%) |
| Total | 361 (100.0%) | 383 (100.0%) |
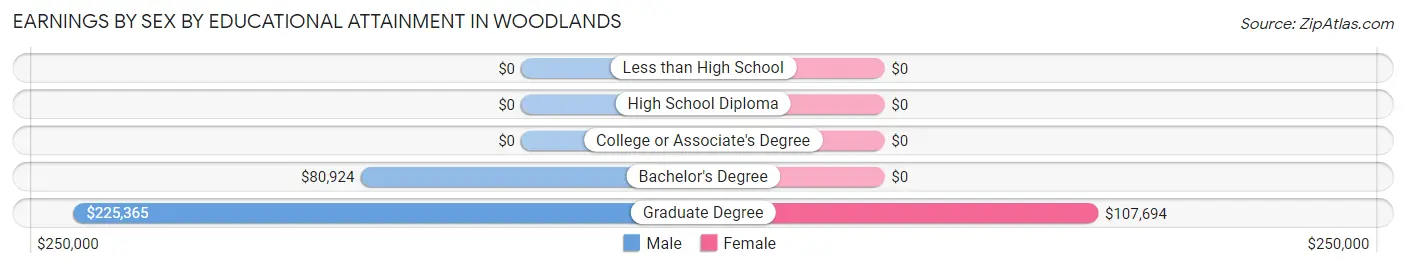
Earnings by Sex by Educational Attainment in Woodlands
Average earnings in Woodlands are $118,125 for men and $47,938 for women, a difference of 59.4%. Men with an educational attainment of graduate degree enjoy the highest average annual earnings of $225,365, while those with bachelor's degree education earn the least with $80,924. Women with an educational attainment of graduate degree earn the most with the average annual earnings of $107,694, while those with graduate degree education have the smallest earnings of $107,694.
| Educational Attainment | Male Income | Female Income |
| Less than High School | - | - |
| High School Diploma | - | - |
| College or Associate's Degree | - | - |
| Bachelor's Degree | $80,924 | $0 |
| Graduate Degree | $225,365 | $107,694 |
| Total | $118,125 | $47,938 |
Family Income in Woodlands
Family Income Brackets in Woodlands
According to the Woodlands family income data, there are 286 families falling into the $150,000 to $199,999 income range, which is the most common income bracket and makes up 32.1% of all families.
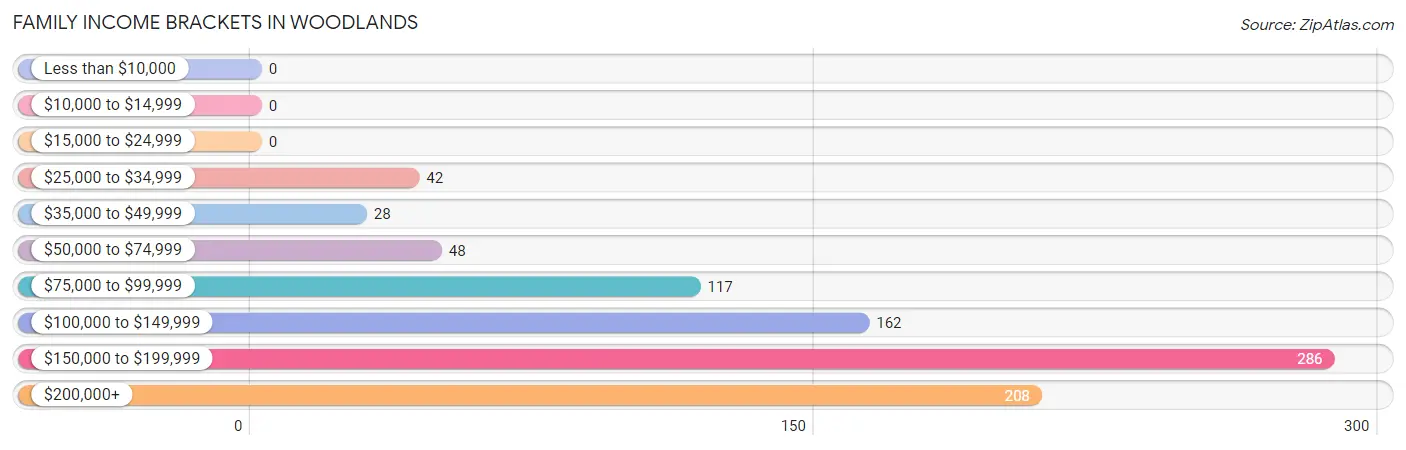
| Income Bracket | # Families | % Families |
| Less than $10,000 | 0 | 0.0% |
| $10,000 to $14,999 | 0 | 0.0% |
| $15,000 to $24,999 | 0 | 0.0% |
| $25,000 to $34,999 | 42 | 4.7% |
| $35,000 to $49,999 | 28 | 3.1% |
| $50,000 to $74,999 | 48 | 5.4% |
| $75,000 to $99,999 | 117 | 13.1% |
| $100,000 to $149,999 | 162 | 18.2% |
| $150,000 to $199,999 | 286 | 32.1% |
| $200,000+ | 208 | 23.3% |
Family Income by Famaliy Size in Woodlands
2-person families (886 | 99.4%) account for the highest median family income in Woodlands with $154,091 per family, while 2-person families (886 | 99.4%) have the highest median income of $77,046 per family member.
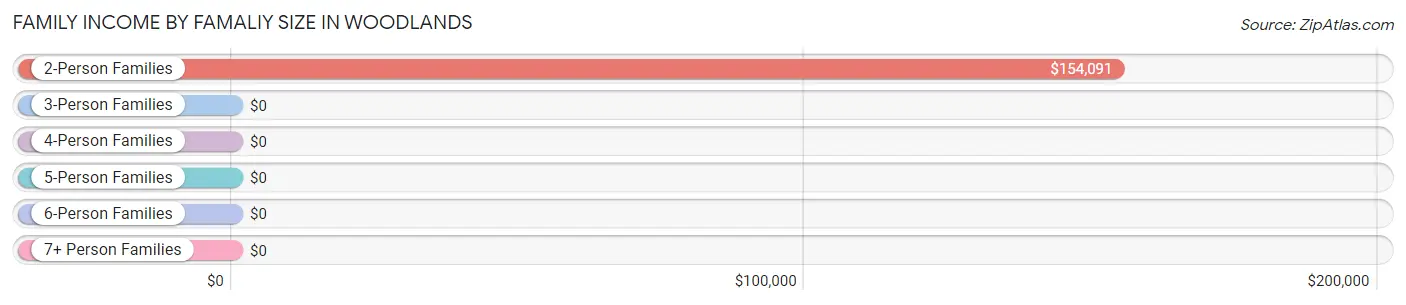
| Income Bracket | # Families | Median Income |
| 2-Person Families | 886 (99.4%) | $154,091 |
| 3-Person Families | 5 (0.6%) | $0 |
| 4-Person Families | 0 (0.0%) | $0 |
| 5-Person Families | 0 (0.0%) | $0 |
| 6-Person Families | 0 (0.0%) | $0 |
| 7+ Person Families | 0 (0.0%) | $0 |
| Total | 891 (100.0%) | $154,233 |
Family Income by Number of Earners in Woodlands
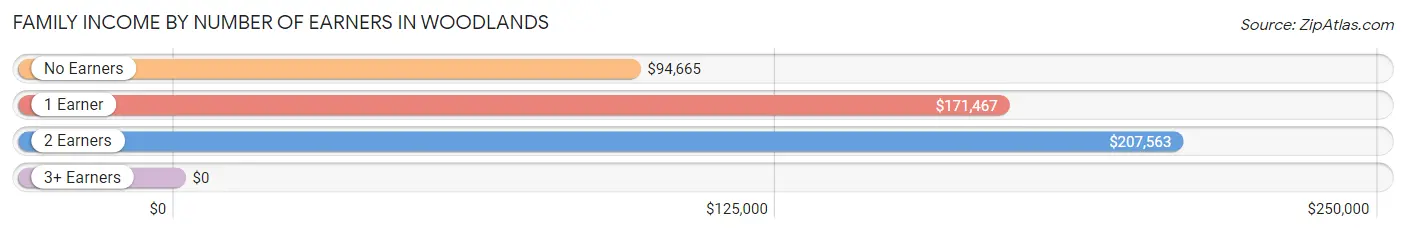
| Number of Earners | # Families | Median Income |
| No Earners | 375 (42.1%) | $94,665 |
| 1 Earner | 303 (34.0%) | $171,467 |
| 2 Earners | 213 (23.9%) | $207,563 |
| 3+ Earners | 0 (0.0%) | $0 |
| Total | 891 (100.0%) | $154,233 |
Household Income in Woodlands
Household Income Brackets in Woodlands
With 303 households falling in the category, the $150,000 to $199,999 income range is the most frequent in Woodlands, accounting for 30.0% of all households.
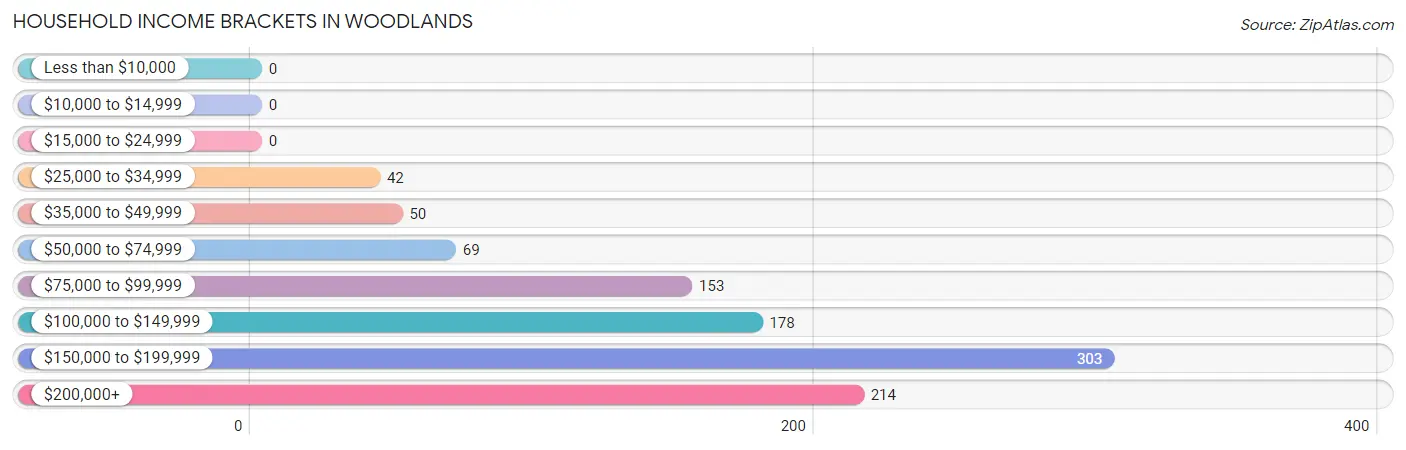
| Income Bracket | # Households | % Households |
| Less than $10,000 | 0 | 0.0% |
| $10,000 to $14,999 | 0 | 0.0% |
| $15,000 to $24,999 | 0 | 0.0% |
| $25,000 to $34,999 | 42 | 4.2% |
| $35,000 to $49,999 | 50 | 5.0% |
| $50,000 to $74,999 | 69 | 6.8% |
| $75,000 to $99,999 | 153 | 15.2% |
| $100,000 to $149,999 | 178 | 17.6% |
| $150,000 to $199,999 | 303 | 30.0% |
| $200,000+ | 214 | 21.2% |
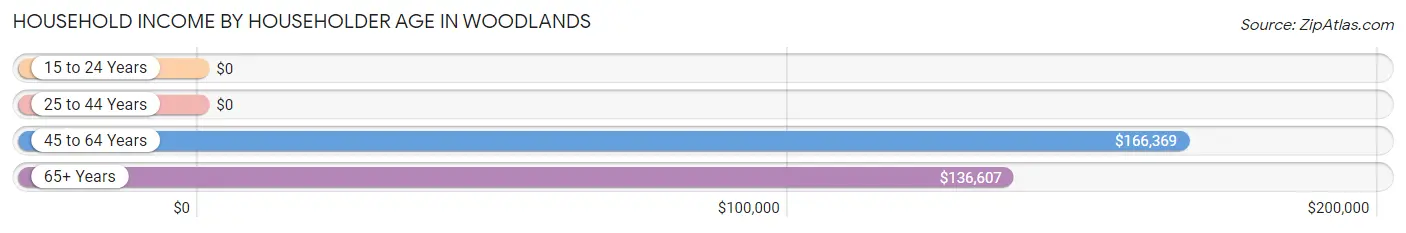
Household Income by Householder Age in Woodlands
The median household income in Woodlands is $151,736, with the highest median household income of $166,369 found in the 45 to 64 years age bracket for the primary householder. A total of 209 households (20.7%) fall into this category.
| Income Bracket | # Households | Median Income |
| 15 to 24 Years | 0 (0.0%) | $0 |
| 25 to 44 Years | 14 (1.4%) | $0 |
| 45 to 64 Years | 209 (20.7%) | $166,369 |
| 65+ Years | 786 (77.9%) | $136,607 |
| Total | 1,009 (100.0%) | $151,736 |
Poverty in Woodlands
Income Below Poverty by Sex and Age in Woodlands
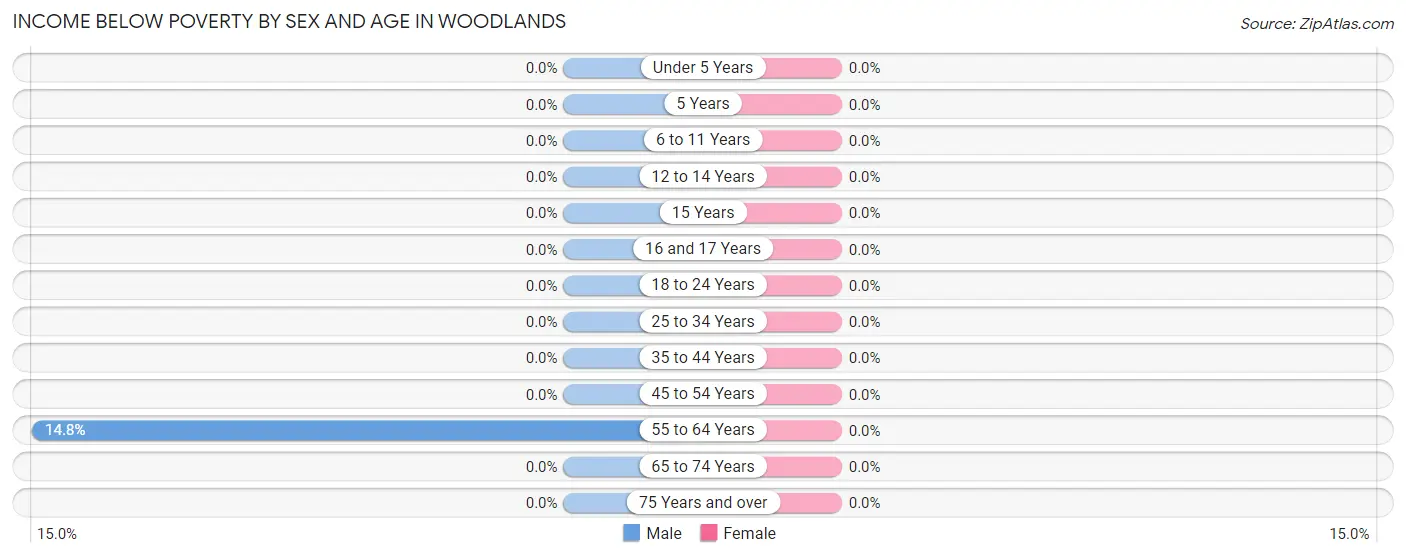
| Age Bracket | Male | Female |
| Under 5 Years | 0 (0.0%) | 0 (0.0%) |
| 5 Years | 0 (0.0%) | 0 (0.0%) |
| 6 to 11 Years | 0 (0.0%) | 0 (0.0%) |
| 12 to 14 Years | 0 (0.0%) | 0 (0.0%) |
| 15 Years | 0 (0.0%) | 0 (0.0%) |
| 16 and 17 Years | 0 (0.0%) | 0 (0.0%) |
| 18 to 24 Years | 0 (0.0%) | 0 (0.0%) |
| 25 to 34 Years | 0 (0.0%) | 0 (0.0%) |
| 35 to 44 Years | 0 (0.0%) | 0 (0.0%) |
| 45 to 54 Years | 0 (0.0%) | 0 (0.0%) |
| 55 to 64 Years | 21 (14.8%) | 0 (0.0%) |
| 65 to 74 Years | 0 (0.0%) | 0 (0.0%) |
| 75 Years and over | 0 (0.0%) | 0 (0.0%) |
| Total | 21 (2.3%) | 0 (0.0%) |
Income Above Poverty by Sex and Age in Woodlands
According to the poverty statistics in Woodlands, males aged 35 to 44 years and females aged 35 to 44 years are the age groups that are most secure financially, with 100.0% of males and 100.0% of females in these age groups living above the poverty line.
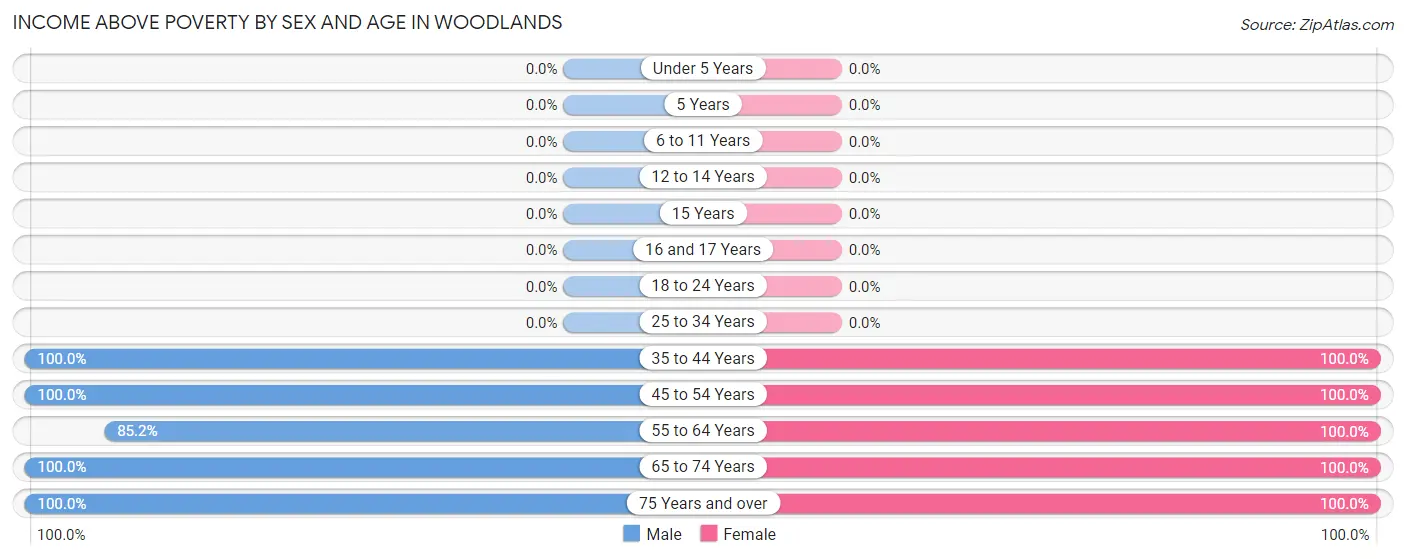
| Age Bracket | Male | Female |
| Under 5 Years | 0 (0.0%) | 0 (0.0%) |
| 5 Years | 0 (0.0%) | 0 (0.0%) |
| 6 to 11 Years | 0 (0.0%) | 0 (0.0%) |
| 12 to 14 Years | 0 (0.0%) | 0 (0.0%) |
| 15 Years | 0 (0.0%) | 0 (0.0%) |
| 16 and 17 Years | 0 (0.0%) | 0 (0.0%) |
| 18 to 24 Years | 0 (0.0%) | 0 (0.0%) |
| 25 to 34 Years | 0 (0.0%) | 0 (0.0%) |
| 35 to 44 Years | 16 (100.0%) | 14 (100.0%) |
| 45 to 54 Years | 47 (100.0%) | 45 (100.0%) |
| 55 to 64 Years | 121 (85.2%) | 160 (100.0%) |
| 65 to 74 Years | 428 (100.0%) | 519 (100.0%) |
| 75 Years and over | 290 (100.0%) | 263 (100.0%) |
| Total | 902 (97.7%) | 1,001 (100.0%) |
Income Below Poverty Among Married-Couple Families in Woodlands
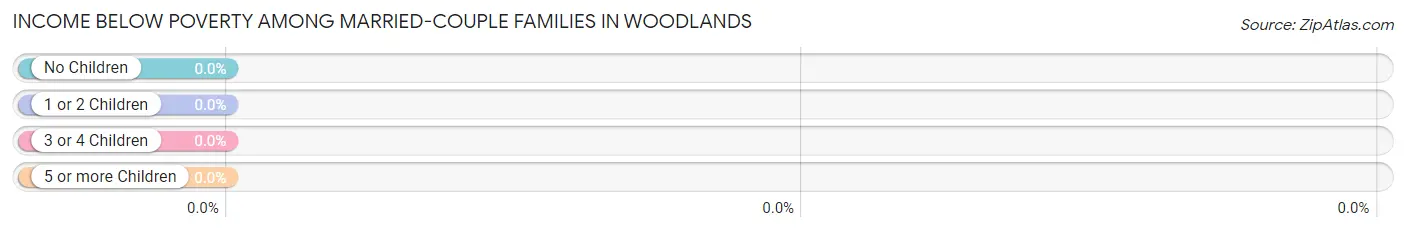
| Children | Above Poverty | Below Poverty |
| No Children | 891 (100.0%) | 0 (0.0%) |
| 1 or 2 Children | 0 (0.0%) | 0 (0.0%) |
| 3 or 4 Children | 0 (0.0%) | 0 (0.0%) |
| 5 or more Children | 0 (0.0%) | 0 (0.0%) |
| Total | 891 (100.0%) | 0 (0.0%) |
Income Below Poverty Among Single-Parent Households in Woodlands
| Children | Single Father | Single Mother |
| No Children | 0 (0.0%) | 0 (0.0%) |
| 1 or 2 Children | 0 (0.0%) | 0 (0.0%) |
| 3 or 4 Children | 0 (0.0%) | 0 (0.0%) |
| 5 or more Children | 0 (0.0%) | 0 (0.0%) |
| Total | 0 (0.0%) | 0 (0.0%) |
Income Below Poverty Among Married-Couple vs Single-Parent Households in Woodlands
| Children | Married-Couple Families | Single-Parent Households |
| No Children | 0 (0.0%) | 0 (0.0%) |
| 1 or 2 Children | 0 (0.0%) | 0 (0.0%) |
| 3 or 4 Children | 0 (0.0%) | 0 (0.0%) |
| 5 or more Children | 0 (0.0%) | 0 (0.0%) |
| Total | 0 (0.0%) | 0 (0.0%) |
Race in Woodlands
The most populous races in Woodlands are White / Caucasian (1,836 | 95.4%), Two or more Races (65 | 3.4%), and Asian (23 | 1.2%).
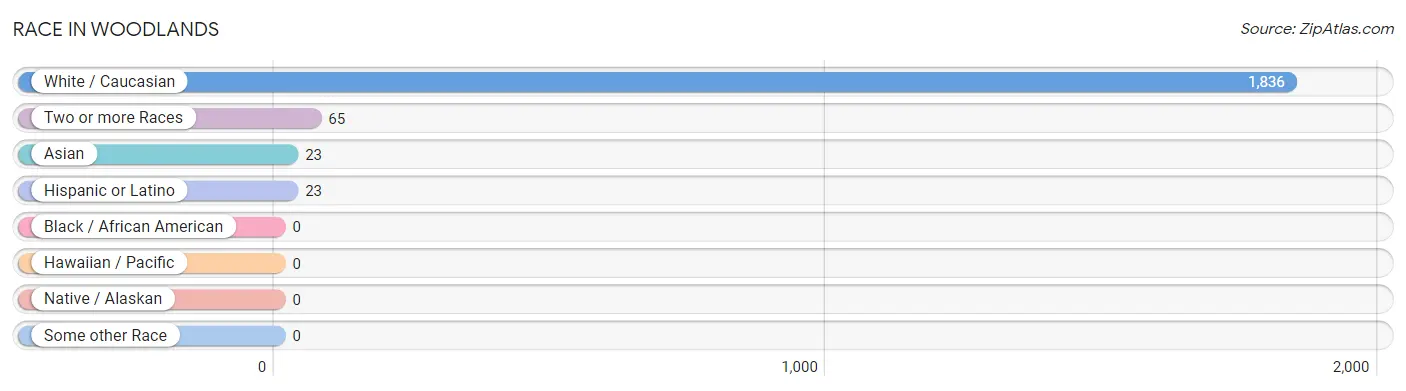
| Race | # Population | % Population |
| Asian | 23 | 1.2% |
| Black / African American | 0 | 0.0% |
| Hawaiian / Pacific | 0 | 0.0% |
| Hispanic or Latino | 23 | 1.2% |
| Native / Alaskan | 0 | 0.0% |
| White / Caucasian | 1,836 | 95.4% |
| Two or more Races | 65 | 3.4% |
| Some other Race | 0 | 0.0% |
| Total | 1,924 | 100.0% |
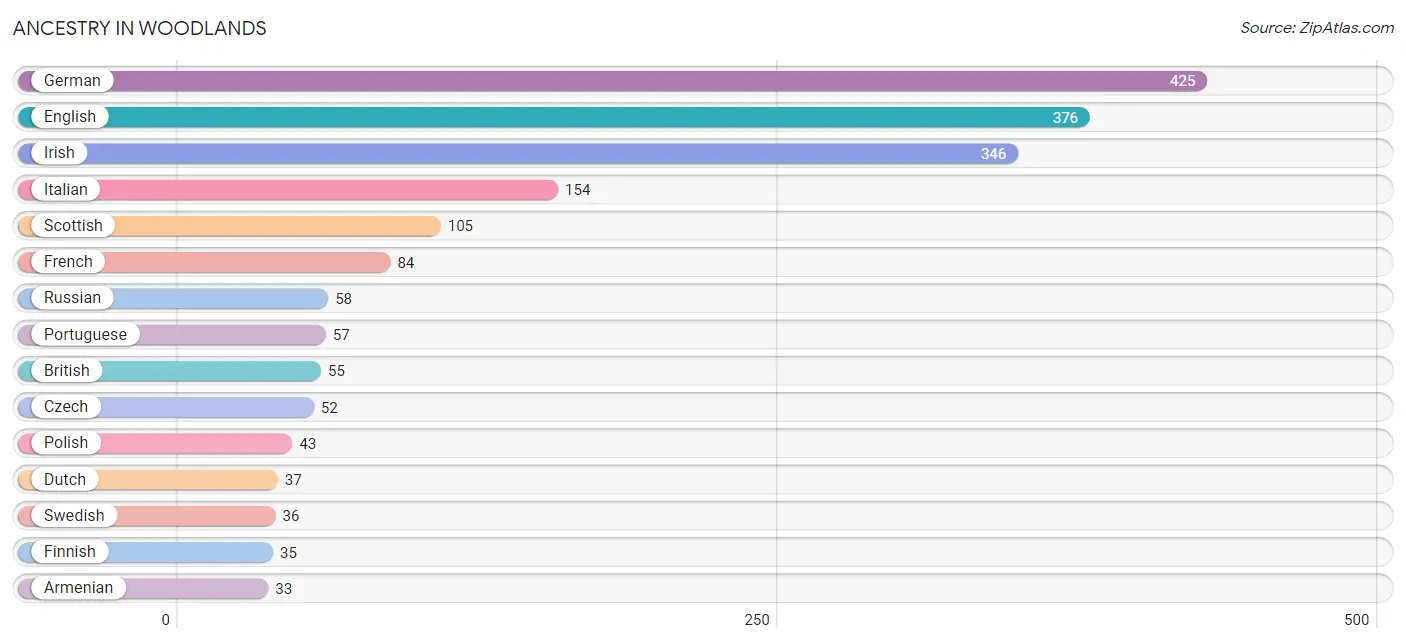
Ancestry in Woodlands
The most populous ancestries reported in Woodlands are German (425 | 22.1%), English (376 | 19.5%), Irish (346 | 18.0%), Italian (154 | 8.0%), and Scottish (105 | 5.5%), together accounting for 73.1% of all Woodlands residents.
| Ancestry | # Population | % Population |
| American | 24 | 1.3% |
| Arab | 32 | 1.7% |
| Armenian | 33 | 1.7% |
| Bhutanese | 18 | 0.9% |
| British | 55 | 2.9% |
| Croatian | 13 | 0.7% |
| Czech | 52 | 2.7% |
| Danish | 13 | 0.7% |
| Dutch | 37 | 1.9% |
| Eastern European | 21 | 1.1% |
| English | 376 | 19.5% |
| European | 30 | 1.6% |
| Finnish | 35 | 1.8% |
| French | 84 | 4.4% |
| French Canadian | 30 | 1.6% |
| German | 425 | 22.1% |
| Indian (Asian) | 14 | 0.7% |
| Irish | 346 | 18.0% |
| Italian | 154 | 8.0% |
| Korean | 9 | 0.5% |
| Lebanese | 32 | 1.7% |
| Mexican | 23 | 1.2% |
| Northern European | 26 | 1.3% |
| Norwegian | 31 | 1.6% |
| Polish | 43 | 2.2% |
| Portuguese | 57 | 3.0% |
| Romanian | 22 | 1.1% |
| Russian | 58 | 3.0% |
| Scandinavian | 30 | 1.6% |
| Scottish | 105 | 5.5% |
| Swedish | 36 | 1.9% |
| Ukrainian | 18 | 0.9% | View All 32 Rows |
Immigrants in Woodlands
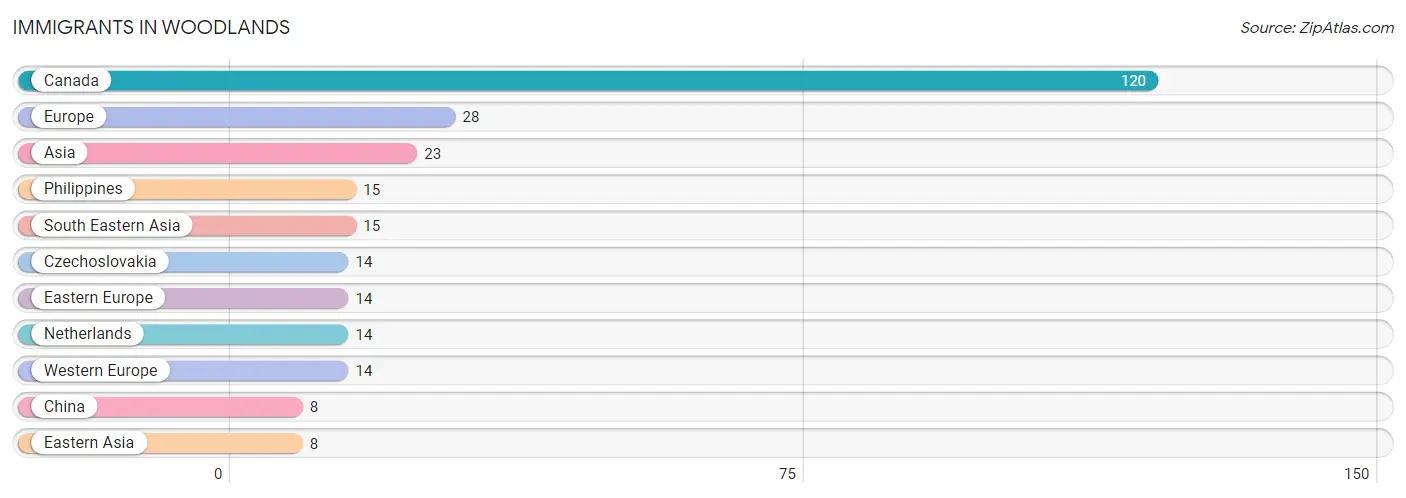
The most numerous immigrant groups reported in Woodlands came from Canada (120 | 6.2%), Europe (28 | 1.5%), Asia (23 | 1.2%), Philippines (15 | 0.8%), and South Eastern Asia (15 | 0.8%), together accounting for 10.5% of all Woodlands residents.
| Immigration Origin | # Population | % Population |
| Asia | 23 | 1.2% |
| Canada | 120 | 6.2% |
| China | 8 | 0.4% |
| Czechoslovakia | 14 | 0.7% |
| Eastern Asia | 8 | 0.4% |
| Eastern Europe | 14 | 0.7% |
| Europe | 28 | 1.5% |
| Netherlands | 14 | 0.7% |
| Philippines | 15 | 0.8% |
| South Eastern Asia | 15 | 0.8% |
| Western Europe | 14 | 0.7% | View All 11 Rows |
Sex and Age in Woodlands
Sex and Age in Woodlands
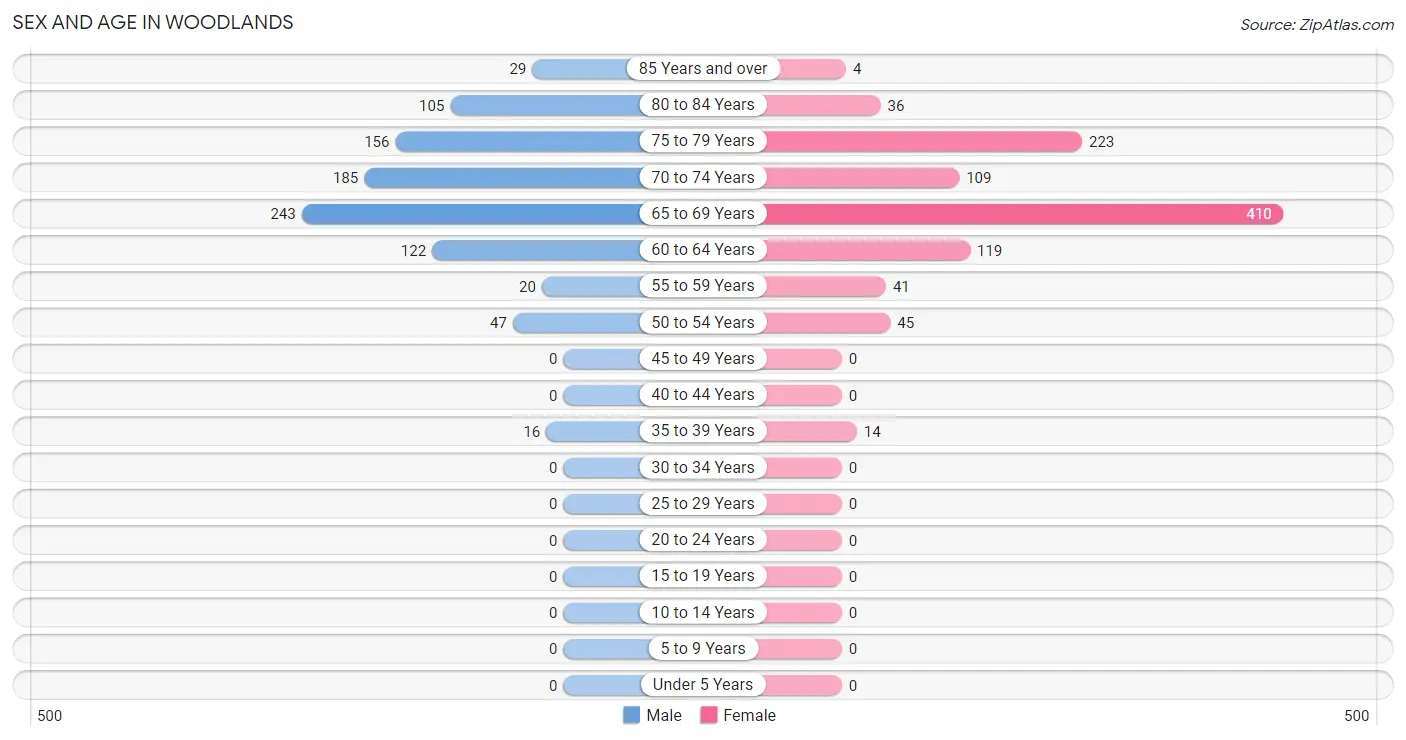
The most populous age groups in Woodlands are 65 to 69 Years (243 | 26.3%) for men and 65 to 69 Years (410 | 41.0%) for women.
| Age Bracket | Male | Female |
| Under 5 Years | 0 (0.0%) | 0 (0.0%) |
| 5 to 9 Years | 0 (0.0%) | 0 (0.0%) |
| 10 to 14 Years | 0 (0.0%) | 0 (0.0%) |
| 15 to 19 Years | 0 (0.0%) | 0 (0.0%) |
| 20 to 24 Years | 0 (0.0%) | 0 (0.0%) |
| 25 to 29 Years | 0 (0.0%) | 0 (0.0%) |
| 30 to 34 Years | 0 (0.0%) | 0 (0.0%) |
| 35 to 39 Years | 16 (1.7%) | 14 (1.4%) |
| 40 to 44 Years | 0 (0.0%) | 0 (0.0%) |
| 45 to 49 Years | 0 (0.0%) | 0 (0.0%) |
| 50 to 54 Years | 47 (5.1%) | 45 (4.5%) |
| 55 to 59 Years | 20 (2.2%) | 41 (4.1%) |
| 60 to 64 Years | 122 (13.2%) | 119 (11.9%) |
| 65 to 69 Years | 243 (26.3%) | 410 (41.0%) |
| 70 to 74 Years | 185 (20.0%) | 109 (10.9%) |
| 75 to 79 Years | 156 (16.9%) | 223 (22.3%) |
| 80 to 84 Years | 105 (11.4%) | 36 (3.6%) |
| 85 Years and over | 29 (3.1%) | 4 (0.4%) |
| Total | 923 (100.0%) | 1,001 (100.0%) |
Families and Households in Woodlands
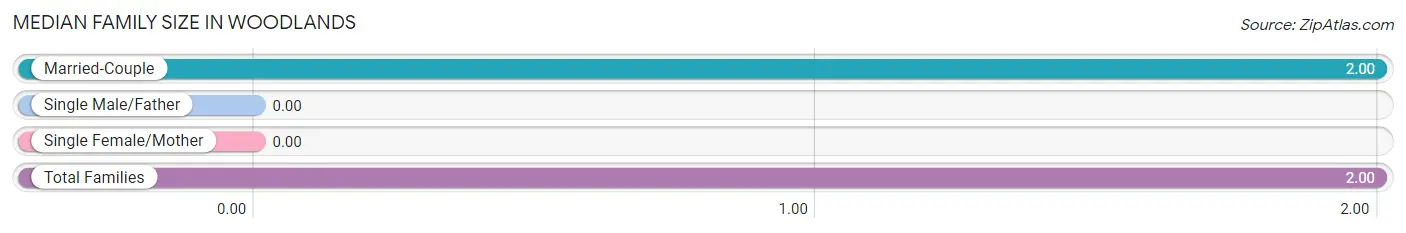
Median Family Size in Woodlands
| Family Type | # Families | Family Size |
| Married-Couple | 891 (100.0%) | 2.00 |
| Single Male/Father | 0 (0.0%) | - |
| Single Female/Mother | 0 (0.0%) | - |
| Total Families | 891 (100.0%) | 2.00 |
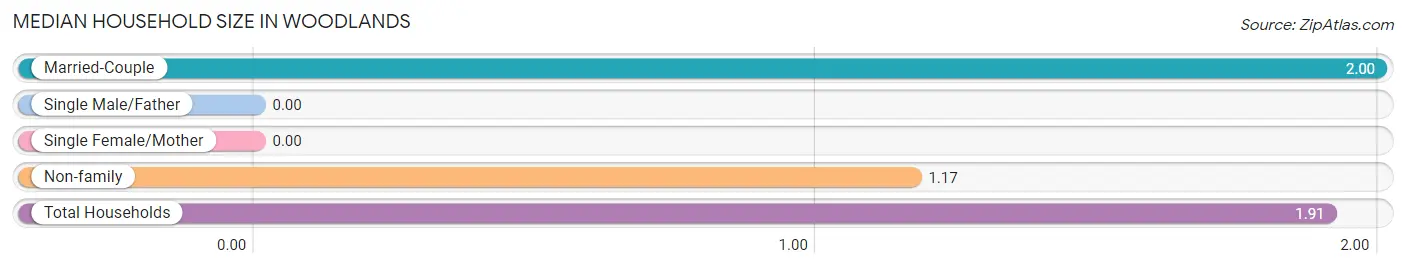
Median Household Size in Woodlands
| Household Type | # Households | Household Size |
| Married-Couple | 891 (88.3%) | 2.00 |
| Single Male/Father | 0 (0.0%) | - |
| Single Female/Mother | 0 (0.0%) | - |
| Non-family | 118 (11.7%) | 1.17 |
| Total Households | 1,009 (100.0%) | 1.91 |
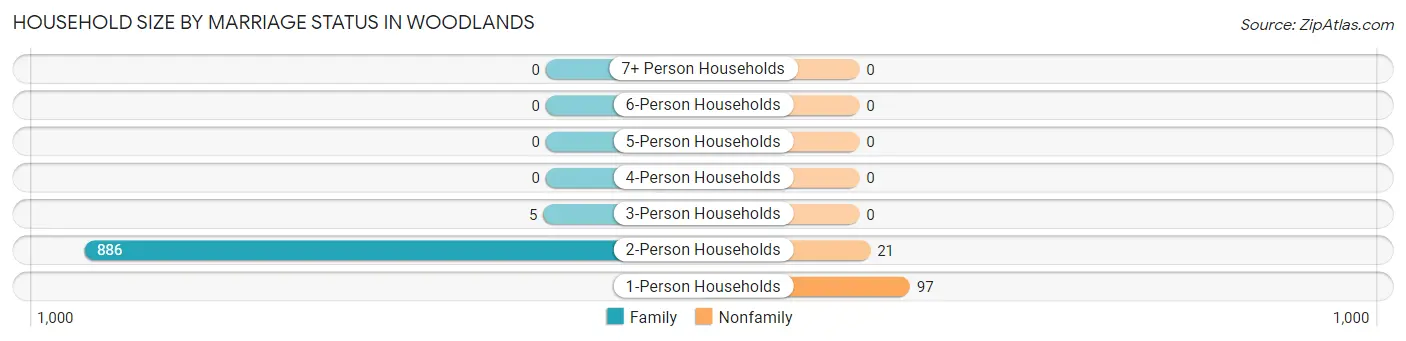
Household Size by Marriage Status in Woodlands
Out of a total of 1,009 households in Woodlands, 891 (88.3%) are family households, while 118 (11.7%) are nonfamily households. The most numerous type of family households are 2-person households, comprising 886, and the most common type of nonfamily households are 1-person households, comprising 97.
| Household Size | Family Households | Nonfamily Households |
| 1-Person Households | - | 97 (9.6%) |
| 2-Person Households | 886 (87.8%) | 21 (2.1%) |
| 3-Person Households | 5 (0.5%) | 0 (0.0%) |
| 4-Person Households | 0 (0.0%) | 0 (0.0%) |
| 5-Person Households | 0 (0.0%) | 0 (0.0%) |
| 6-Person Households | 0 (0.0%) | 0 (0.0%) |
| 7+ Person Households | 0 (0.0%) | 0 (0.0%) |
| Total | 891 (88.3%) | 118 (11.7%) |
Female Fertility in Woodlands
Fertility by Age in Woodlands
| Age Bracket | Women with Births | Births / 1,000 Women |
| 15 to 19 years | 0 (0.0%) | 0.0 |
| 20 to 34 years | 0 (0.0%) | 0.0 |
| 35 to 50 years | 0 (0.0%) | 0.0 |
| Total | 0 (0.0%) | 0.0 |
Fertility by Age by Marriage Status in Woodlands
| Age Bracket | Married | Unmarried |
| 15 to 19 years | 0 (0.0%) | 0 (0.0%) |
| 20 to 34 years | 0 (0.0%) | 0 (0.0%) |
| 35 to 50 years | 0 (0.0%) | 0 (0.0%) |
| Total | 0 (0.0%) | 0 (0.0%) |
Fertility by Education in Woodlands
| Educational Attainment | Women with Births | Births / 1,000 Women |
| Less than High School | 0 (0.0%) | 0.0 |
| High School Diploma | 0 (0.0%) | 0.0 |
| College or Associate's Degree | 0 (0.0%) | 0.0 |
| Bachelor's Degree | 0 (0.0%) | 0.0 |
| Graduate Degree | 0 (0.0%) | 0.0 |
| Total | 0 (0.0%) | 0.0 |
Fertility by Education by Marriage Status in Woodlands
| Educational Attainment | Married | Unmarried |
| Less than High School | 0 (0.0%) | 0 (0.0%) |
| High School Diploma | 0 (0.0%) | 0 (0.0%) |
| College or Associate's Degree | 0 (0.0%) | 0 (0.0%) |
| Bachelor's Degree | 0 (0.0%) | 0 (0.0%) |
| Graduate Degree | 0 (0.0%) | 0 (0.0%) |
| Total | 0 (0.0%) | 0 (0.0%) |
Employment Characteristics in Woodlands
Employment by Class of Employer in Woodlands
Among the 533 employed individuals in Woodlands, private company employees (233 | 43.7%), self-employed (incorporated) (85 | 16.0%), and local government employees (61 | 11.4%) make up the most common classes of employment.
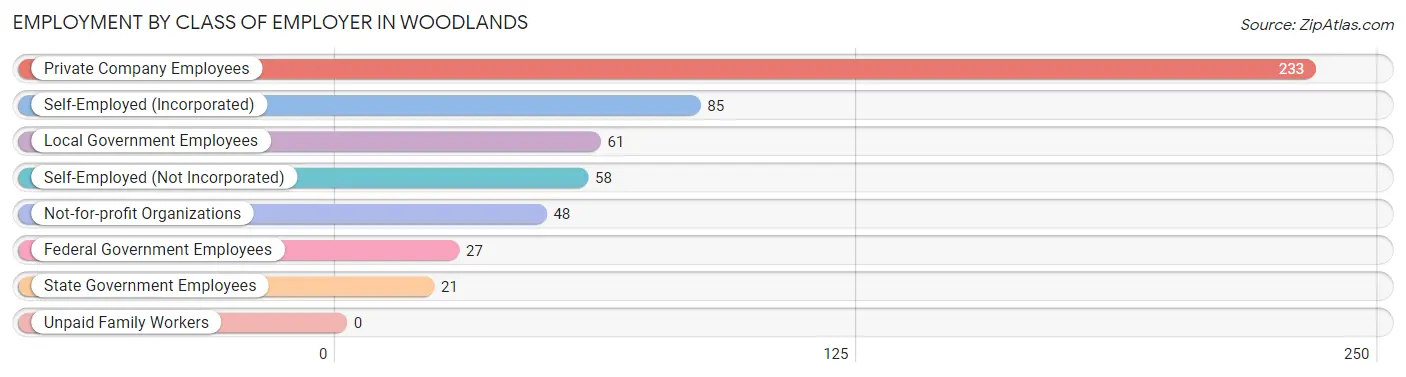
| Employer Class | # Employees | % Employees |
| Private Company Employees | 233 | 43.7% |
| Self-Employed (Incorporated) | 85 | 16.0% |
| Self-Employed (Not Incorporated) | 58 | 10.9% |
| Not-for-profit Organizations | 48 | 9.0% |
| Local Government Employees | 61 | 11.4% |
| State Government Employees | 21 | 3.9% |
| Federal Government Employees | 27 | 5.1% |
| Unpaid Family Workers | 0 | 0.0% |
| Total | 533 | 100.0% |
Employment Status by Age in Woodlands
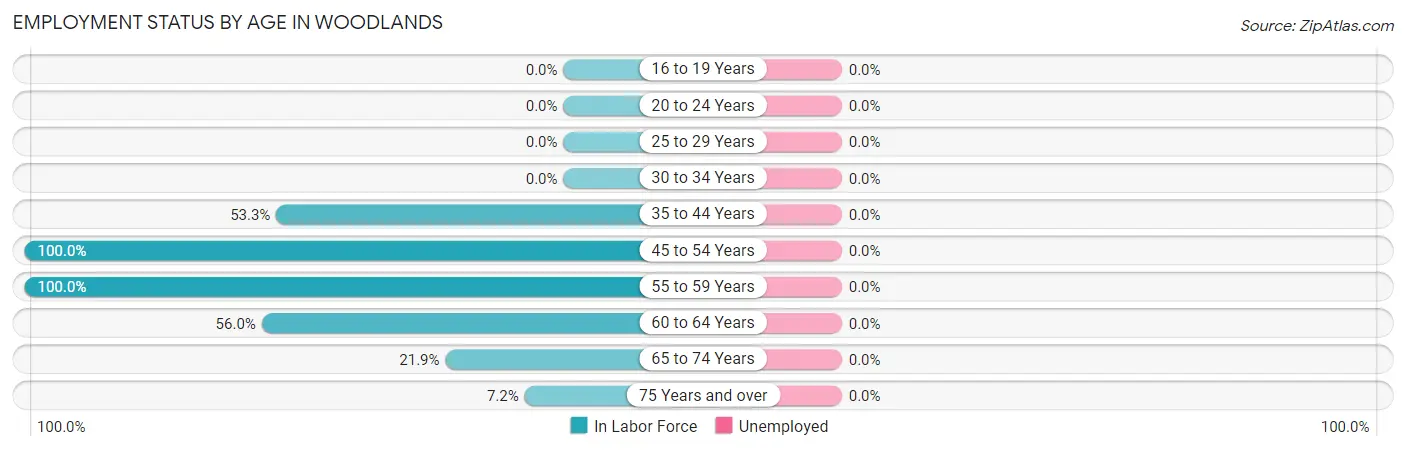
| Age Bracket | In Labor Force | Unemployed |
| 16 to 19 Years | 0 (0.0%) | 0 (0.0%) |
| 20 to 24 Years | 0 (0.0%) | 0 (0.0%) |
| 25 to 29 Years | 0 (0.0%) | 0 (0.0%) |
| 30 to 34 Years | 0 (0.0%) | 0 (0.0%) |
| 35 to 44 Years | 16 (53.3%) | 0 (0.0%) |
| 45 to 54 Years | 92 (100.0%) | 0 (0.0%) |
| 55 to 59 Years | 61 (100.0%) | 0 (0.0%) |
| 60 to 64 Years | 135 (56.0%) | 0 (0.0%) |
| 65 to 74 Years | 207 (21.9%) | 0 (0.0%) |
| 75 Years and over | 40 (7.2%) | 0 (0.0%) |
| Total | 550 (28.6%) | 0 (0.0%) |
Employment Status by Educational Attainment in Woodlands
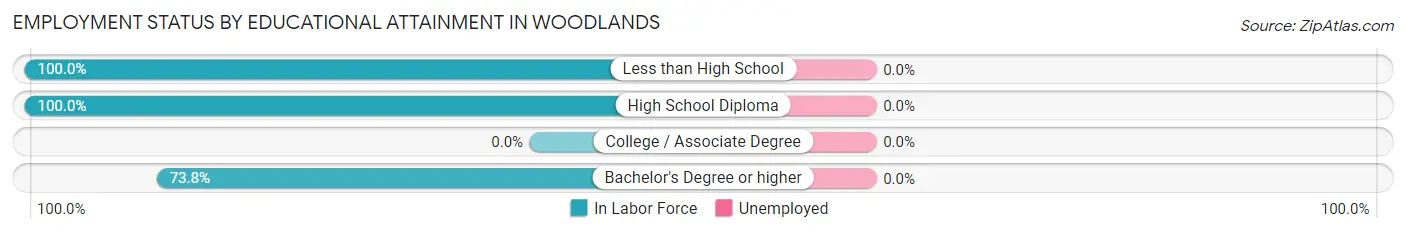
| Educational Attainment | In Labor Force | Unemployed |
| Less than High School | 45 (100.0%) | 0 (0.0%) |
| High School Diploma | 65 (100.0%) | 0 (0.0%) |
| College / Associate Degree | 0 (0.0%) | 0 (0.0%) |
| Bachelor's Degree or higher | 194 (73.8%) | 0 (0.0%) |
| Total | 304 (71.7%) | 0 (0.0%) |
Employment Occupations by Sex in Woodlands
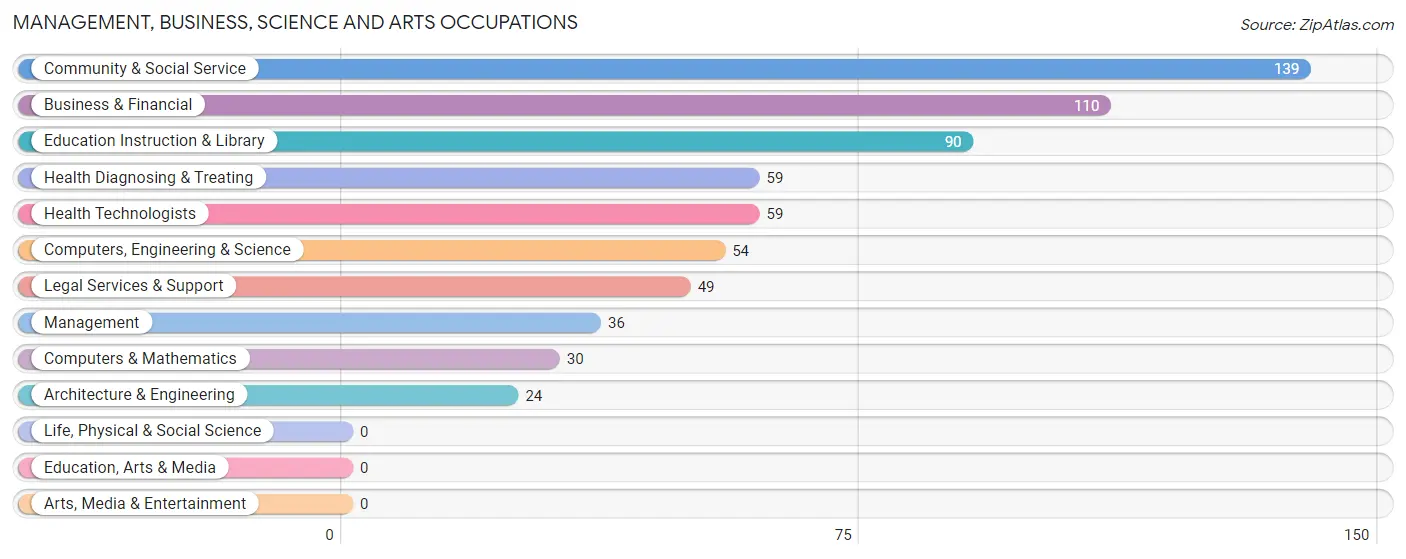
Management, Business, Science and Arts Occupations
The most common Management, Business, Science and Arts occupations in Woodlands are Community & Social Service (139 | 25.2%), Business & Financial (110 | 20.0%), Education Instruction & Library (90 | 16.3%), Health Diagnosing & Treating (59 | 10.7%), and Health Technologists (59 | 10.7%).
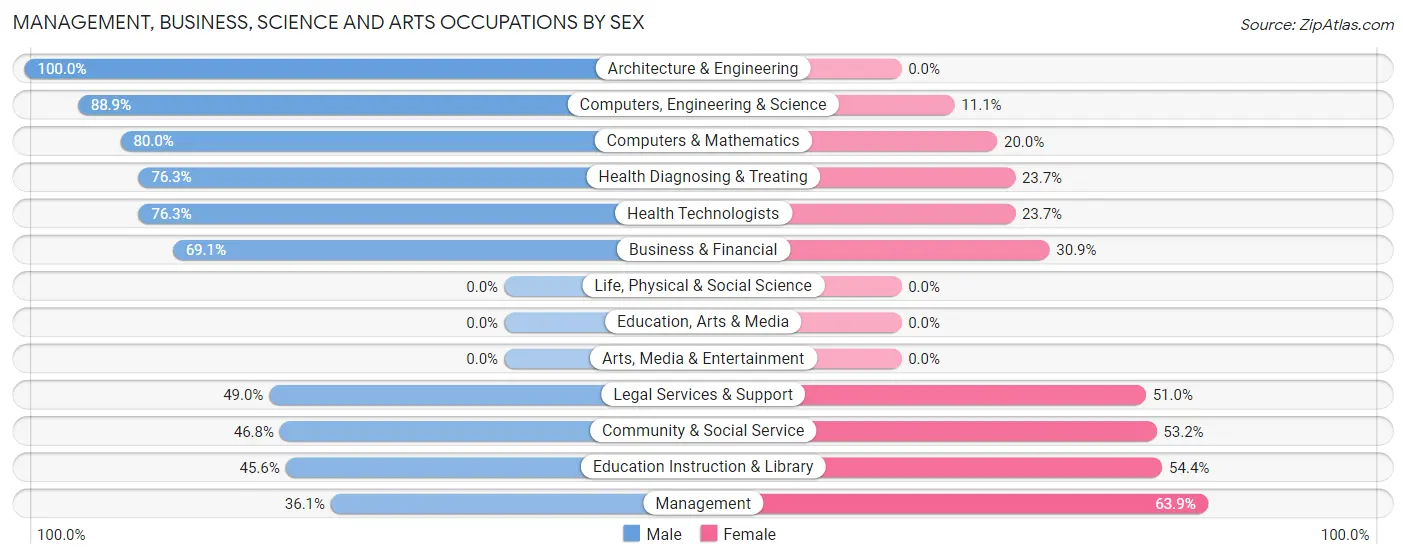
Management, Business, Science and Arts Occupations by Sex
Within the Management, Business, Science and Arts occupations in Woodlands, the most male-oriented occupations are Architecture & Engineering (100.0%), Computers, Engineering & Science (88.9%), and Computers & Mathematics (80.0%), while the most female-oriented occupations are Management (63.9%), Education Instruction & Library (54.4%), and Community & Social Service (53.2%).
| Occupation | Male | Female |
| Management | 13 (36.1%) | 23 (63.9%) |
| Business & Financial | 76 (69.1%) | 34 (30.9%) |
| Computers, Engineering & Science | 48 (88.9%) | 6 (11.1%) |
| Computers & Mathematics | 24 (80.0%) | 6 (20.0%) |
| Architecture & Engineering | 24 (100.0%) | 0 (0.0%) |
| Life, Physical & Social Science | 0 (0.0%) | 0 (0.0%) |
| Community & Social Service | 65 (46.8%) | 74 (53.2%) |
| Education, Arts & Media | 0 (0.0%) | 0 (0.0%) |
| Legal Services & Support | 24 (49.0%) | 25 (51.0%) |
| Education Instruction & Library | 41 (45.6%) | 49 (54.4%) |
| Arts, Media & Entertainment | 0 (0.0%) | 0 (0.0%) |
| Health Diagnosing & Treating | 45 (76.3%) | 14 (23.7%) |
| Health Technologists | 45 (76.3%) | 14 (23.7%) |
| Total (Category) | 247 (62.1%) | 151 (37.9%) |
| Total (Overall) | 346 (62.8%) | 205 (37.2%) |
Services Occupations
Services Occupations by Sex
| Occupation | Male | Female |
| Healthcare Support | 0 (0.0%) | 0 (0.0%) |
| Security & Protection | 0 (0.0%) | 0 (0.0%) |
| Firefighting & Prevention | 0 (0.0%) | 0 (0.0%) |
| Law Enforcement | 0 (0.0%) | 0 (0.0%) |
| Food Preparation & Serving | 0 (0.0%) | 0 (0.0%) |
| Cleaning & Maintenance | 0 (0.0%) | 0 (0.0%) |
| Personal Care & Service | 0 (0.0%) | 0 (0.0%) |
| Total (Category) | 0 (0.0%) | 0 (0.0%) |
| Total (Overall) | 346 (62.8%) | 205 (37.2%) |
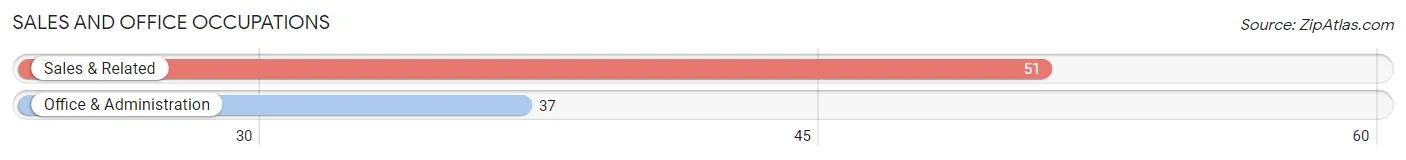
Sales and Office Occupations
The most common Sales and Office occupations in Woodlands are Sales & Related (51 | 9.3%), and Office & Administration (37 | 6.7%).
Sales and Office Occupations by Sex
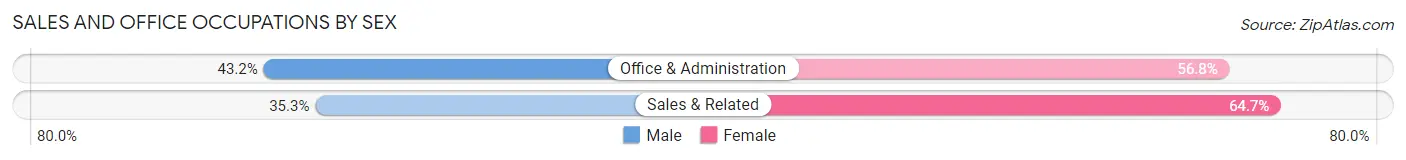
| Occupation | Male | Female |
| Sales & Related | 18 (35.3%) | 33 (64.7%) |
| Office & Administration | 16 (43.2%) | 21 (56.8%) |
| Total (Category) | 34 (38.6%) | 54 (61.4%) |
| Total (Overall) | 346 (62.8%) | 205 (37.2%) |
Natural Resources, Construction and Maintenance Occupations
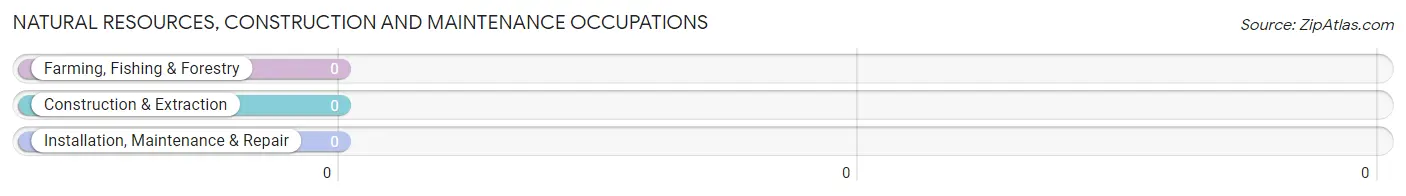
Natural Resources, Construction and Maintenance Occupations by Sex
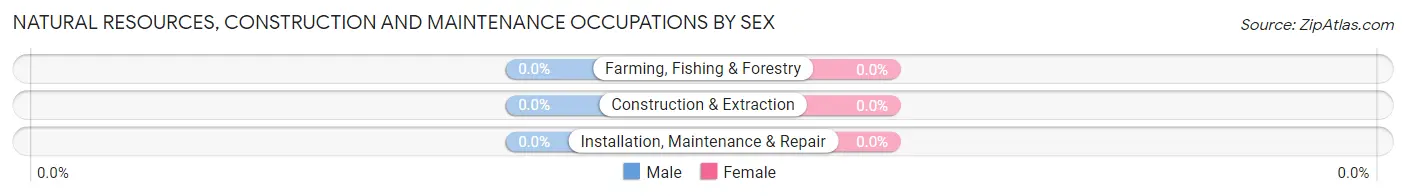
| Occupation | Male | Female |
| Farming, Fishing & Forestry | 0 (0.0%) | 0 (0.0%) |
| Construction & Extraction | 0 (0.0%) | 0 (0.0%) |
| Installation, Maintenance & Repair | 0 (0.0%) | 0 (0.0%) |
| Total (Category) | 0 (0.0%) | 0 (0.0%) |
| Total (Overall) | 346 (62.8%) | 205 (37.2%) |
Production, Transportation and Moving Occupations
The most common Production, Transportation and Moving occupations in Woodlands are , and Transportation (65 | 11.8%).
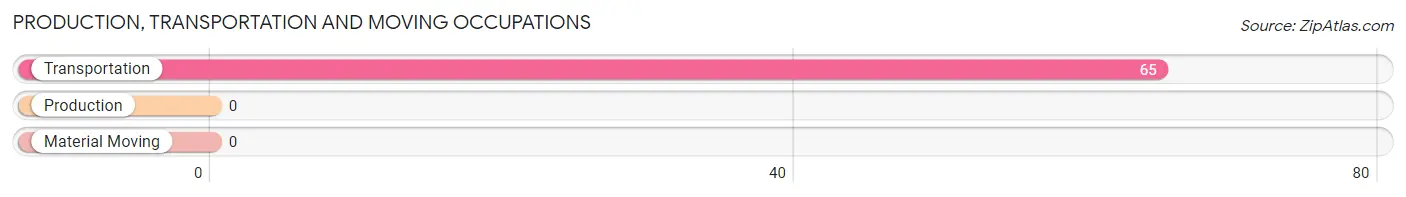
Production, Transportation and Moving Occupations by Sex
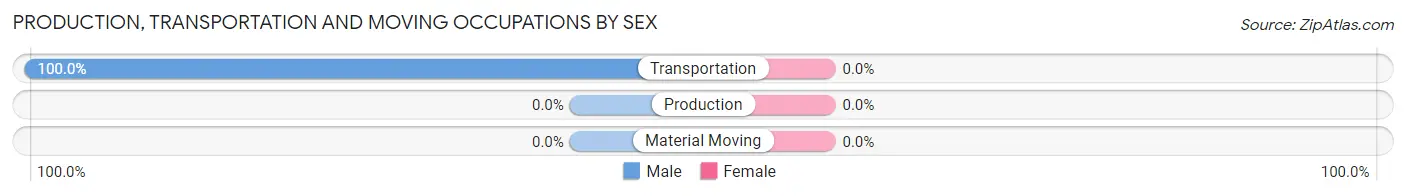
| Occupation | Male | Female |
| Production | 0 (0.0%) | 0 (0.0%) |
| Transportation | 65 (100.0%) | 0 (0.0%) |
| Material Moving | 0 (0.0%) | 0 (0.0%) |
| Total (Category) | 65 (100.0%) | 0 (0.0%) |
| Total (Overall) | 346 (62.8%) | 205 (37.2%) |
Employment Industries by Sex in Woodlands
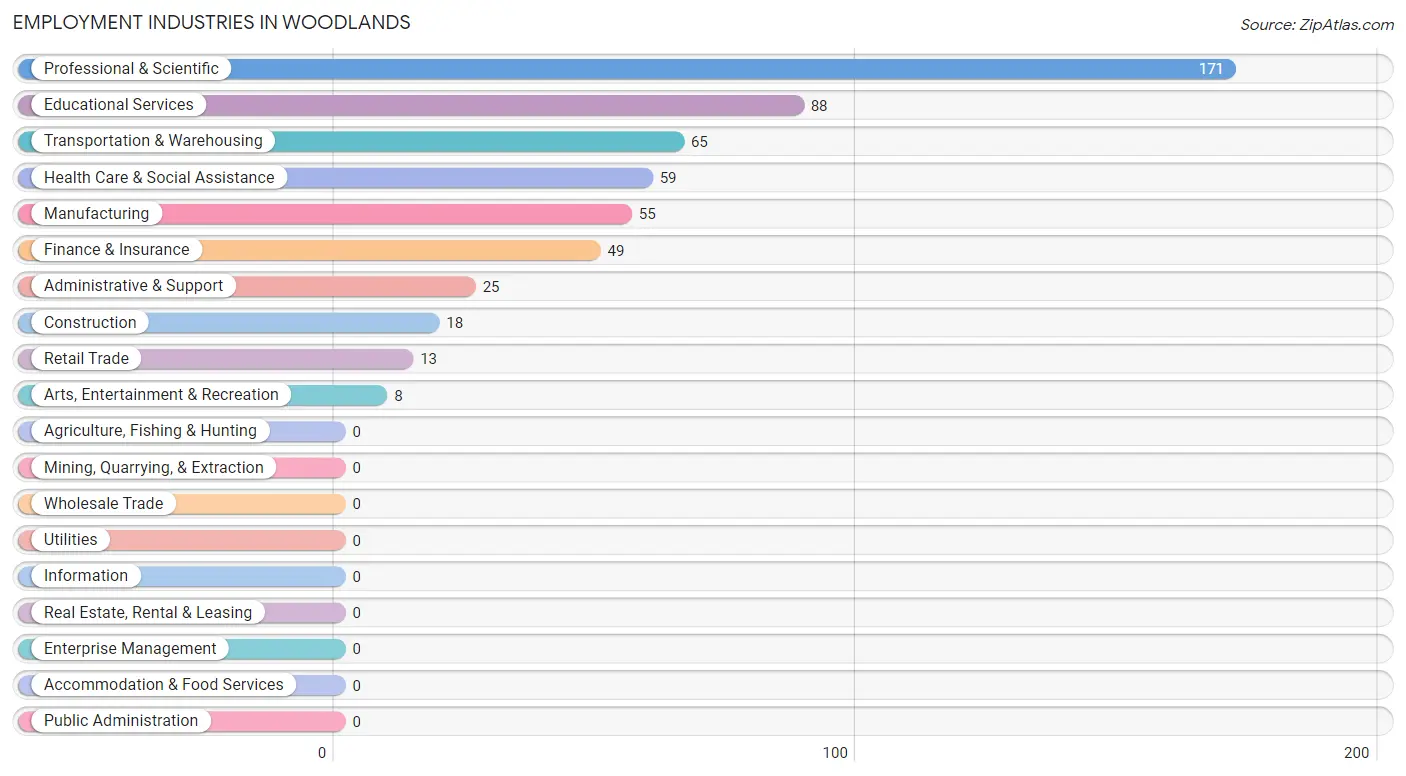
Employment Industries in Woodlands
The major employment industries in Woodlands include Professional & Scientific (171 | 31.0%), Educational Services (88 | 16.0%), Transportation & Warehousing (65 | 11.8%), Health Care & Social Assistance (59 | 10.7%), and Manufacturing (55 | 10.0%).
Employment Industries by Sex in Woodlands
The Woodlands industries that see more men than women are Construction (100.0%), Retail Trade (100.0%), and Transportation & Warehousing (100.0%), whereas the industries that tend to have a higher number of women are Administrative & Support (100.0%), Arts, Entertainment & Recreation (100.0%), and Finance & Insurance (67.3%).
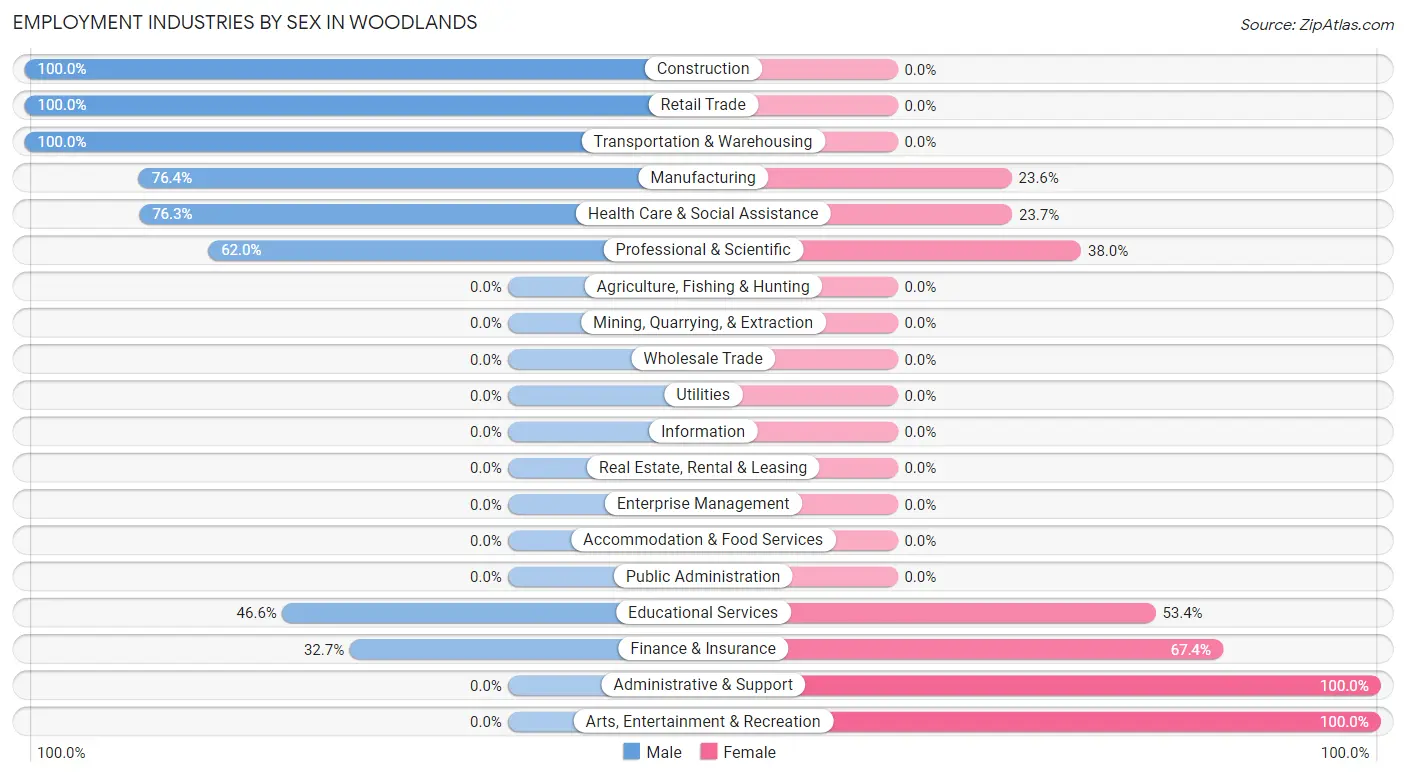
| Industry | Male | Female |
| Agriculture, Fishing & Hunting | 0 (0.0%) | 0 (0.0%) |
| Mining, Quarrying, & Extraction | 0 (0.0%) | 0 (0.0%) |
| Construction | 18 (100.0%) | 0 (0.0%) |
| Manufacturing | 42 (76.4%) | 13 (23.6%) |
| Wholesale Trade | 0 (0.0%) | 0 (0.0%) |
| Retail Trade | 13 (100.0%) | 0 (0.0%) |
| Transportation & Warehousing | 65 (100.0%) | 0 (0.0%) |
| Utilities | 0 (0.0%) | 0 (0.0%) |
| Information | 0 (0.0%) | 0 (0.0%) |
| Finance & Insurance | 16 (32.7%) | 33 (67.3%) |
| Real Estate, Rental & Leasing | 0 (0.0%) | 0 (0.0%) |
| Professional & Scientific | 106 (62.0%) | 65 (38.0%) |
| Enterprise Management | 0 (0.0%) | 0 (0.0%) |
| Administrative & Support | 0 (0.0%) | 25 (100.0%) |
| Educational Services | 41 (46.6%) | 47 (53.4%) |
| Health Care & Social Assistance | 45 (76.3%) | 14 (23.7%) |
| Arts, Entertainment & Recreation | 0 (0.0%) | 8 (100.0%) |
| Accommodation & Food Services | 0 (0.0%) | 0 (0.0%) |
| Public Administration | 0 (0.0%) | 0 (0.0%) |
| Total | 346 (62.8%) | 205 (37.2%) |
Education in Woodlands
School Enrollment in Woodlands
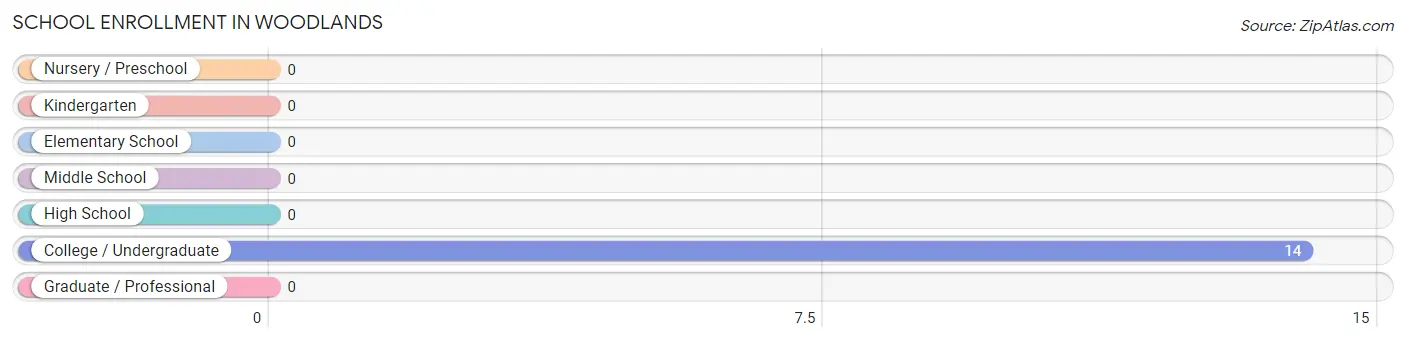
| School Level | # Students | % Students |
| Nursery / Preschool | 0 | 0.0% |
| Kindergarten | 0 | 0.0% |
| Elementary School | 0 | 0.0% |
| Middle School | 0 | 0.0% |
| High School | 0 | 0.0% |
| College / Undergraduate | 14 | 100.0% |
| Graduate / Professional | 0 | 0.0% |
| Total | 14 | 100.0% |
School Enrollment by Age by Funding Source in Woodlands
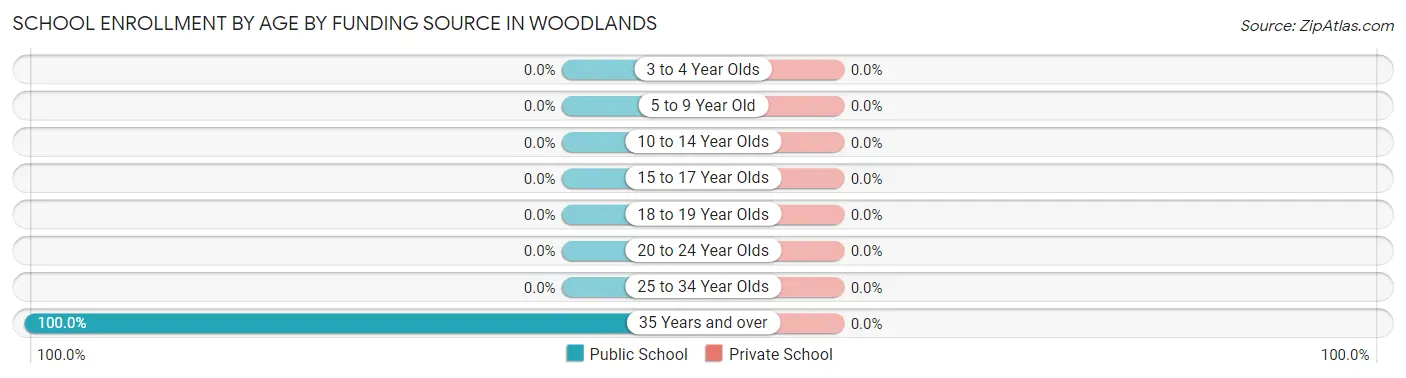
| Age Bracket | Public School | Private School |
| 3 to 4 Year Olds | 0 (0.0%) | 0 (0.0%) |
| 5 to 9 Year Old | 0 (0.0%) | 0 (0.0%) |
| 10 to 14 Year Olds | 0 (0.0%) | 0 (0.0%) |
| 15 to 17 Year Olds | 0 (0.0%) | 0 (0.0%) |
| 18 to 19 Year Olds | 0 (0.0%) | 0 (0.0%) |
| 20 to 24 Year Olds | 0 (0.0%) | 0 (0.0%) |
| 25 to 34 Year Olds | 0 (0.0%) | 0 (0.0%) |
| 35 Years and over | 14 (100.0%) | 0 (0.0%) |
| Total | 14 (100.0%) | 0 (0.0%) |
Educational Attainment by Field of Study in Woodlands
Business (290 | 17.8%), education (181 | 11.1%), engineering (174 | 10.7%), visual & performing arts (166 | 10.2%), and physical & health sciences (146 | 9.0%) are the most common fields of study among 1,627 individuals in Woodlands who have obtained a bachelor's degree or higher.
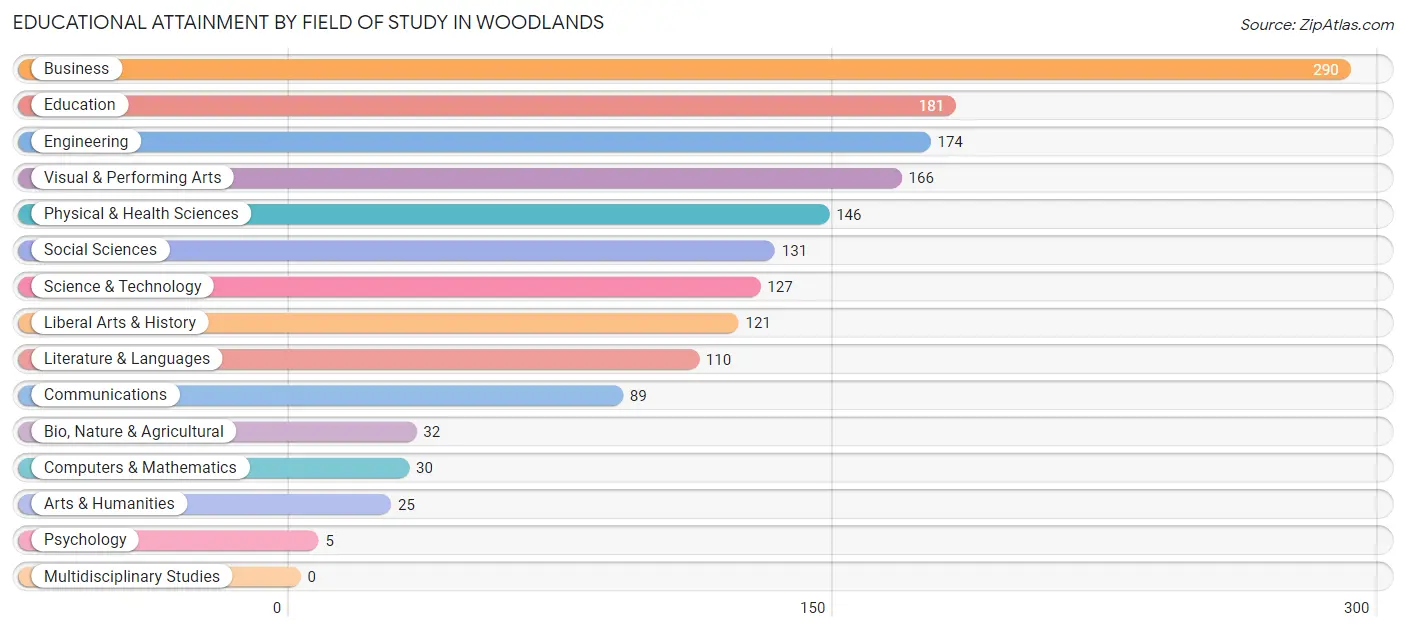
| Field of Study | # Graduates | % Graduates |
| Computers & Mathematics | 30 | 1.8% |
| Bio, Nature & Agricultural | 32 | 2.0% |
| Physical & Health Sciences | 146 | 9.0% |
| Psychology | 5 | 0.3% |
| Social Sciences | 131 | 8.1% |
| Engineering | 174 | 10.7% |
| Multidisciplinary Studies | 0 | 0.0% |
| Science & Technology | 127 | 7.8% |
| Business | 290 | 17.8% |
| Education | 181 | 11.1% |
| Literature & Languages | 110 | 6.8% |
| Liberal Arts & History | 121 | 7.4% |
| Visual & Performing Arts | 166 | 10.2% |
| Communications | 89 | 5.5% |
| Arts & Humanities | 25 | 1.5% |
| Total | 1,627 | 100.0% |
Transportation & Commute in Woodlands
Vehicle Availability by Sex in Woodlands
The most prevalent vehicle ownership categories in Woodlands are males with 2 vehicles (184, accounting for 56.1%) and females with 2 vehicles (90, making up 89.8%).
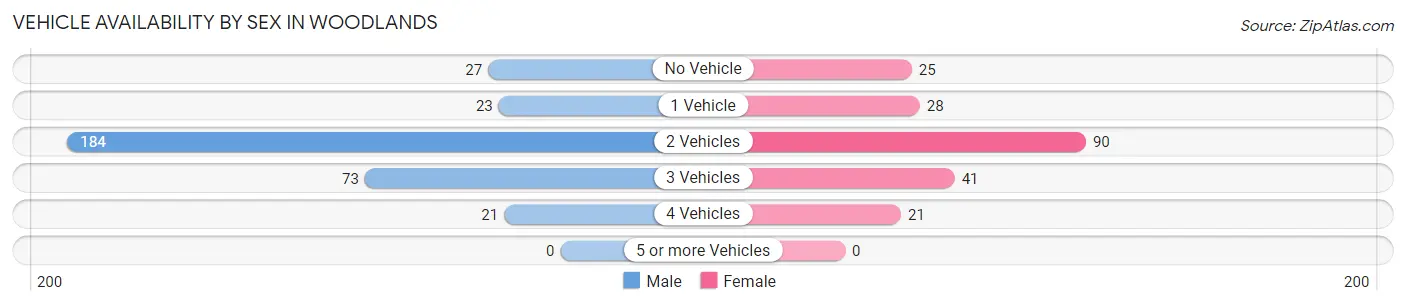
| Vehicles Available | Male | Female |
| No Vehicle | 27 (8.2%) | 25 (12.2%) |
| 1 Vehicle | 23 (7.0%) | 28 (13.7%) |
| 2 Vehicles | 184 (56.1%) | 90 (43.9%) |
| 3 Vehicles | 73 (22.3%) | 41 (20.0%) |
| 4 Vehicles | 21 (6.4%) | 21 (10.2%) |
| 5 or more Vehicles | 0 (0.0%) | 0 (0.0%) |
| Total | 328 (100.0%) | 205 (100.0%) |
Commute Time in Woodlands
The most frequently occuring commute durations in Woodlands are 35 to 39 minutes (103 commuters, 33.7%), 25 to 29 minutes (81 commuters, 26.5%), and 15 to 19 minutes (54 commuters, 17.6%).
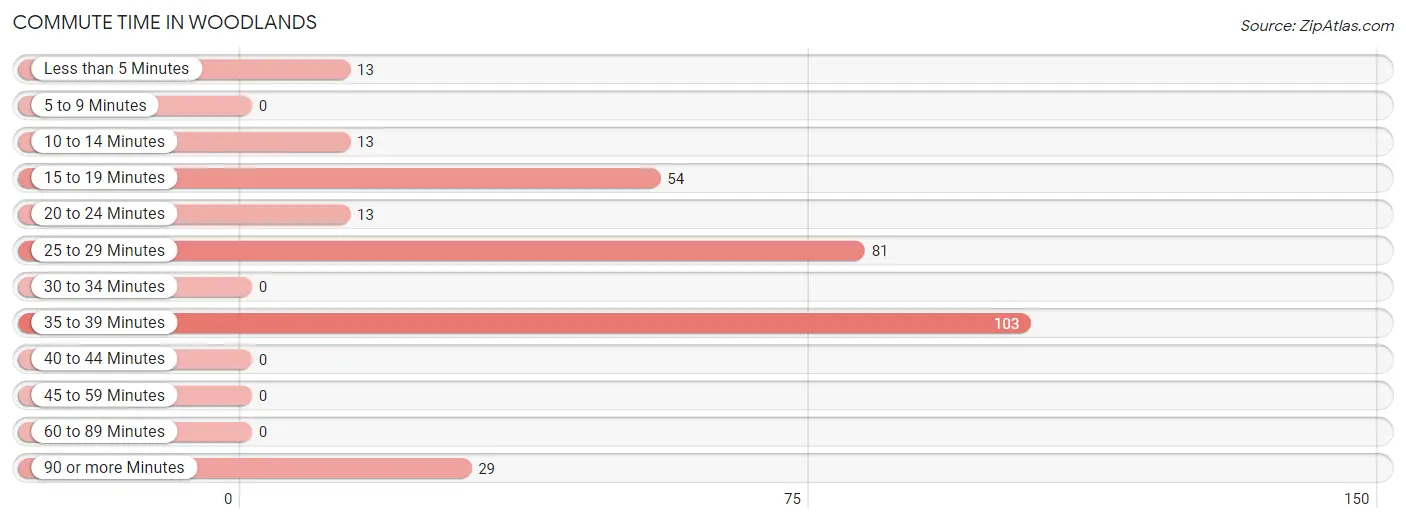
| Commute Time | # Commuters | % Commuters |
| Less than 5 Minutes | 13 | 4.3% |
| 5 to 9 Minutes | 0 | 0.0% |
| 10 to 14 Minutes | 13 | 4.3% |
| 15 to 19 Minutes | 54 | 17.6% |
| 20 to 24 Minutes | 13 | 4.3% |
| 25 to 29 Minutes | 81 | 26.5% |
| 30 to 34 Minutes | 0 | 0.0% |
| 35 to 39 Minutes | 103 | 33.7% |
| 40 to 44 Minutes | 0 | 0.0% |
| 45 to 59 Minutes | 0 | 0.0% |
| 60 to 89 Minutes | 0 | 0.0% |
| 90 or more Minutes | 29 | 9.5% |
Commute Time by Sex in Woodlands
The most common commute times in Woodlands are 25 to 29 minutes (58 commuters, 32.4%) for males and 35 to 39 minutes (82 commuters, 64.6%) for females.
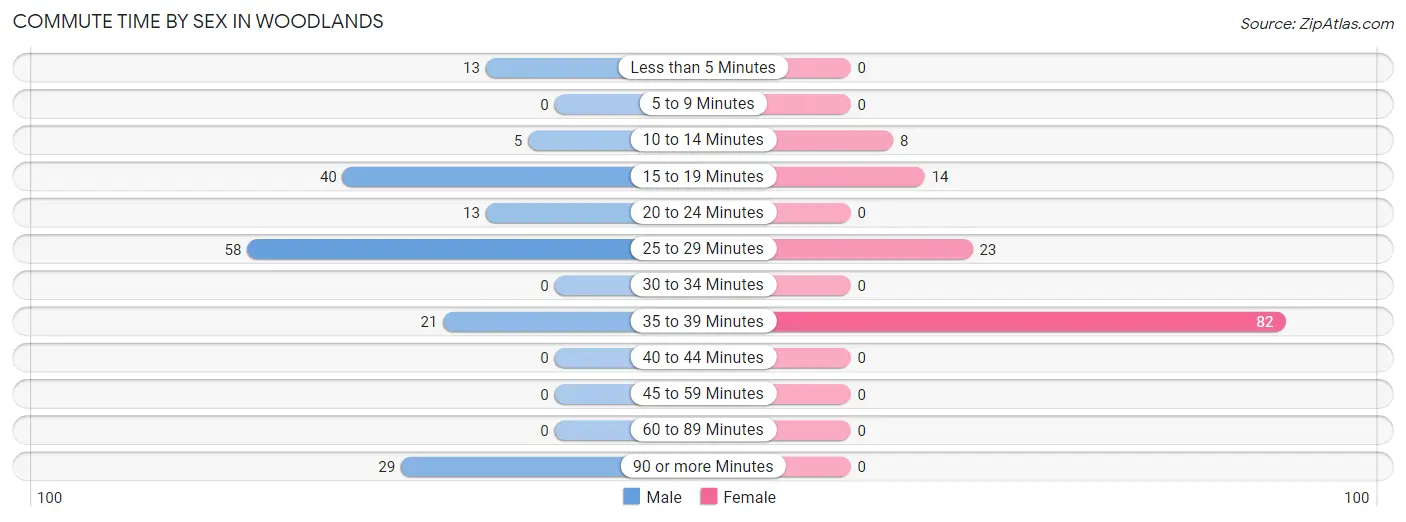
| Commute Time | Male | Female |
| Less than 5 Minutes | 13 (7.3%) | 0 (0.0%) |
| 5 to 9 Minutes | 0 (0.0%) | 0 (0.0%) |
| 10 to 14 Minutes | 5 (2.8%) | 8 (6.3%) |
| 15 to 19 Minutes | 40 (22.4%) | 14 (11.0%) |
| 20 to 24 Minutes | 13 (7.3%) | 0 (0.0%) |
| 25 to 29 Minutes | 58 (32.4%) | 23 (18.1%) |
| 30 to 34 Minutes | 0 (0.0%) | 0 (0.0%) |
| 35 to 39 Minutes | 21 (11.7%) | 82 (64.6%) |
| 40 to 44 Minutes | 0 (0.0%) | 0 (0.0%) |
| 45 to 59 Minutes | 0 (0.0%) | 0 (0.0%) |
| 60 to 89 Minutes | 0 (0.0%) | 0 (0.0%) |
| 90 or more Minutes | 29 (16.2%) | 0 (0.0%) |
Time of Departure to Work by Sex in Woodlands
The most frequent times of departure to work in Woodlands are 6:30 AM to 6:59 AM (53, 29.6%) for males and 9:00 AM to 9:59 AM (39, 30.7%) for females.
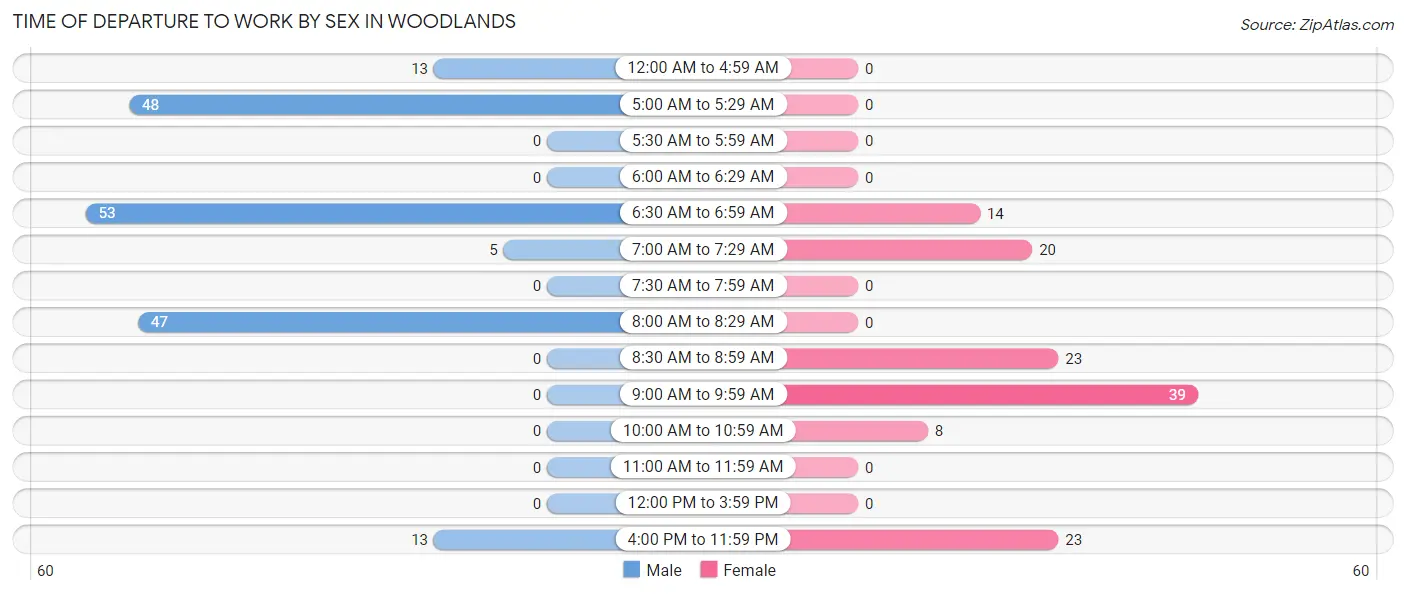
| Time of Departure | Male | Female |
| 12:00 AM to 4:59 AM | 13 (7.3%) | 0 (0.0%) |
| 5:00 AM to 5:29 AM | 48 (26.8%) | 0 (0.0%) |
| 5:30 AM to 5:59 AM | 0 (0.0%) | 0 (0.0%) |
| 6:00 AM to 6:29 AM | 0 (0.0%) | 0 (0.0%) |
| 6:30 AM to 6:59 AM | 53 (29.6%) | 14 (11.0%) |
| 7:00 AM to 7:29 AM | 5 (2.8%) | 20 (15.8%) |
| 7:30 AM to 7:59 AM | 0 (0.0%) | 0 (0.0%) |
| 8:00 AM to 8:29 AM | 47 (26.3%) | 0 (0.0%) |
| 8:30 AM to 8:59 AM | 0 (0.0%) | 23 (18.1%) |
| 9:00 AM to 9:59 AM | 0 (0.0%) | 39 (30.7%) |
| 10:00 AM to 10:59 AM | 0 (0.0%) | 8 (6.3%) |
| 11:00 AM to 11:59 AM | 0 (0.0%) | 0 (0.0%) |
| 12:00 PM to 3:59 PM | 0 (0.0%) | 0 (0.0%) |
| 4:00 PM to 11:59 PM | 13 (7.3%) | 23 (18.1%) |
| Total | 179 (100.0%) | 127 (100.0%) |
Housing Occupancy in Woodlands
Occupancy by Ownership in Woodlands
Of the total 1,009 dwellings in Woodlands, owner-occupied units account for 926 (91.8%), while renter-occupied units make up 83 (8.2%).
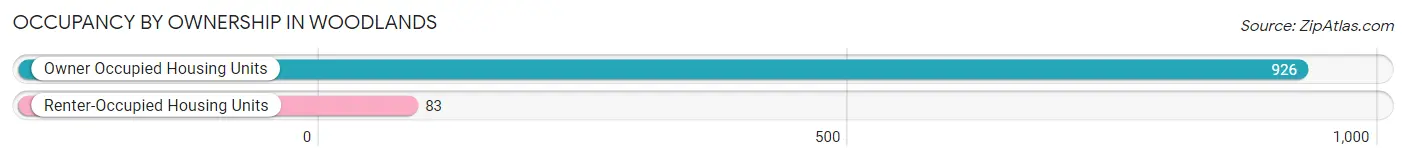
| Occupancy | # Housing Units | % Housing Units |
| Owner Occupied Housing Units | 926 | 91.8% |
| Renter-Occupied Housing Units | 83 | 8.2% |
| Total Occupied Housing Units | 1,009 | 100.0% |
Occupancy by Household Size in Woodlands
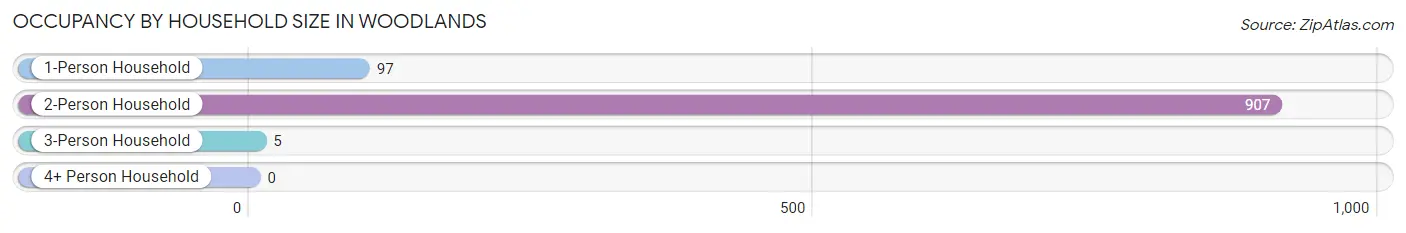
| Household Size | # Housing Units | % Housing Units |
| 1-Person Household | 97 | 9.6% |
| 2-Person Household | 907 | 89.9% |
| 3-Person Household | 5 | 0.5% |
| 4+ Person Household | 0 | 0.0% |
| Total Housing Units | 1,009 | 100.0% |
Occupancy by Ownership by Household Size in Woodlands
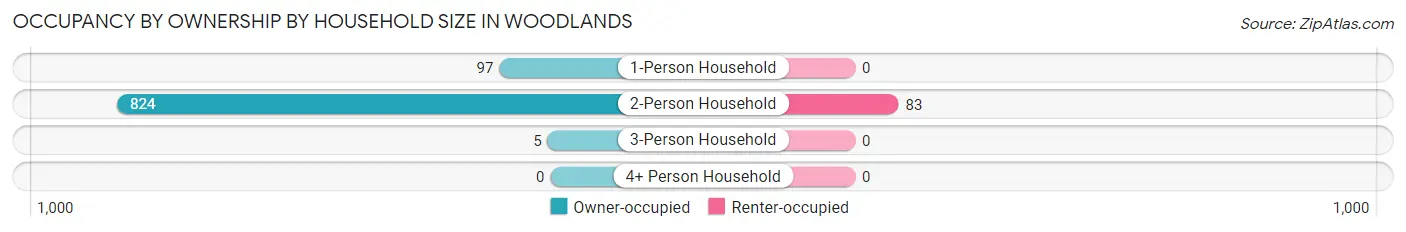
| Household Size | Owner-occupied | Renter-occupied |
| 1-Person Household | 97 (100.0%) | 0 (0.0%) |
| 2-Person Household | 824 (90.8%) | 83 (9.1%) |
| 3-Person Household | 5 (100.0%) | 0 (0.0%) |
| 4+ Person Household | 0 (0.0%) | 0 (0.0%) |
| Total Housing Units | 926 (91.8%) | 83 (8.2%) |
Occupancy by Educational Attainment in Woodlands
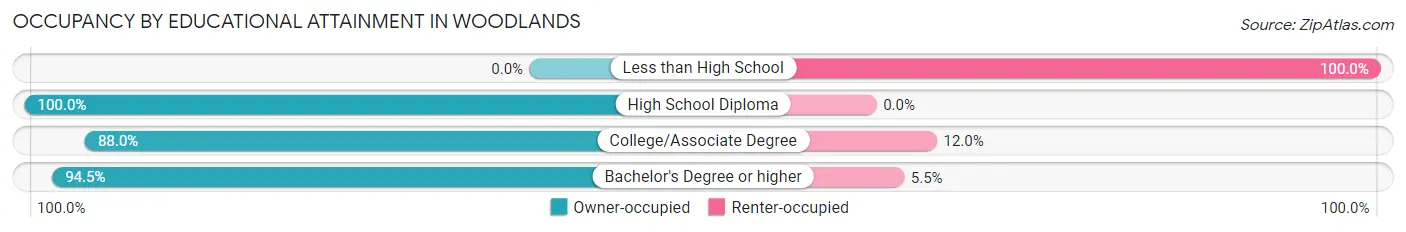
| Household Size | Owner-occupied | Renter-occupied |
| Less than High School | 0 (0.0%) | 25 (100.0%) |
| High School Diploma | 64 (100.0%) | 0 (0.0%) |
| College/Associate Degree | 103 (88.0%) | 14 (12.0%) |
| Bachelor's Degree or higher | 759 (94.5%) | 44 (5.5%) |
Occupancy by Age of Householder in Woodlands
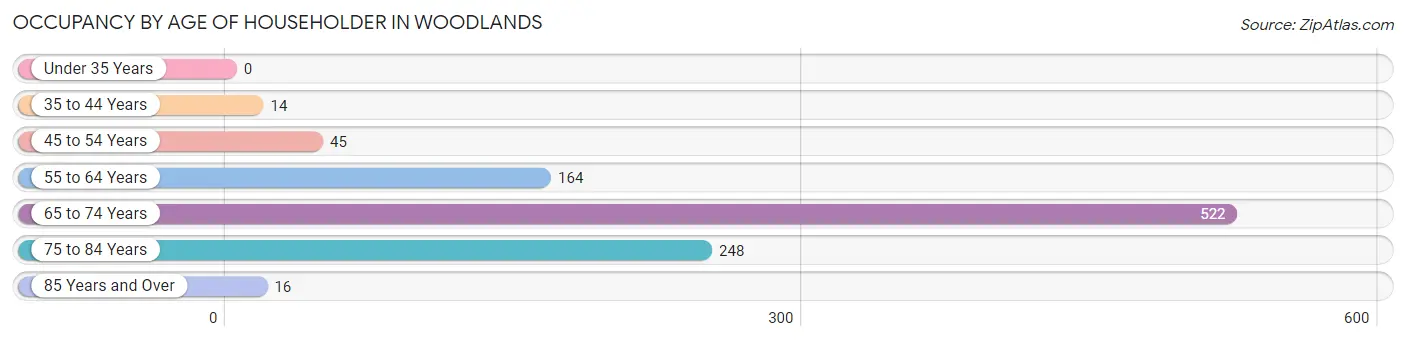
| Age Bracket | # Households | % Households |
| Under 35 Years | 0 | 0.0% |
| 35 to 44 Years | 14 | 1.4% |
| 45 to 54 Years | 45 | 4.5% |
| 55 to 64 Years | 164 | 16.3% |
| 65 to 74 Years | 522 | 51.7% |
| 75 to 84 Years | 248 | 24.6% |
| 85 Years and Over | 16 | 1.6% |
| Total | 1,009 | 100.0% |
Housing Finances in Woodlands
Median Income by Occupancy in Woodlands
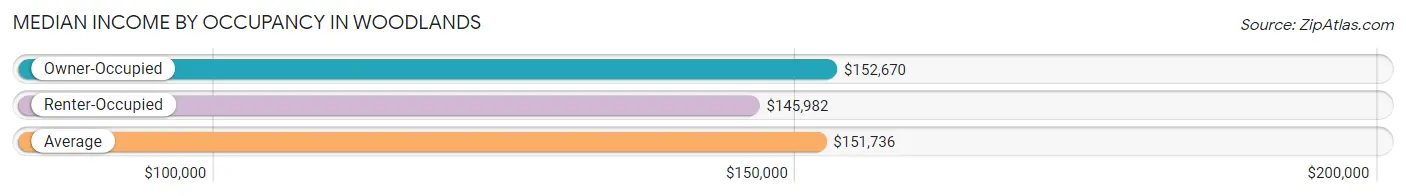
| Occupancy Type | # Households | Median Income |
| Owner-Occupied | 926 (91.8%) | $152,670 |
| Renter-Occupied | 83 (8.2%) | $145,982 |
| Average | 1,009 (100.0%) | $151,736 |
Occupancy by Householder Income Bracket in Woodlands
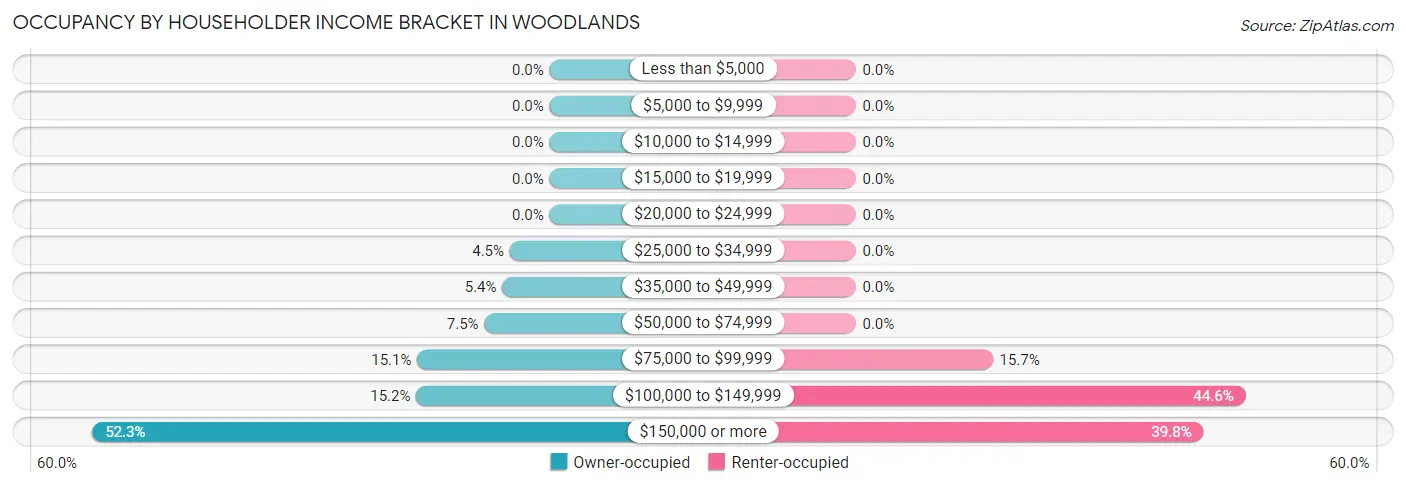
| Income Bracket | Owner-occupied | Renter-occupied |
| Less than $5,000 | 0 (0.0%) | 0 (0.0%) |
| $5,000 to $9,999 | 0 (0.0%) | 0 (0.0%) |
| $10,000 to $14,999 | 0 (0.0%) | 0 (0.0%) |
| $15,000 to $19,999 | 0 (0.0%) | 0 (0.0%) |
| $20,000 to $24,999 | 0 (0.0%) | 0 (0.0%) |
| $25,000 to $34,999 | 42 (4.5%) | 0 (0.0%) |
| $35,000 to $49,999 | 50 (5.4%) | 0 (0.0%) |
| $50,000 to $74,999 | 69 (7.4%) | 0 (0.0%) |
| $75,000 to $99,999 | 140 (15.1%) | 13 (15.7%) |
| $100,000 to $149,999 | 141 (15.2%) | 37 (44.6%) |
| $150,000 or more | 484 (52.3%) | 33 (39.8%) |
| Total | 926 (100.0%) | 83 (100.0%) |
Monthly Housing Cost Tiers in Woodlands
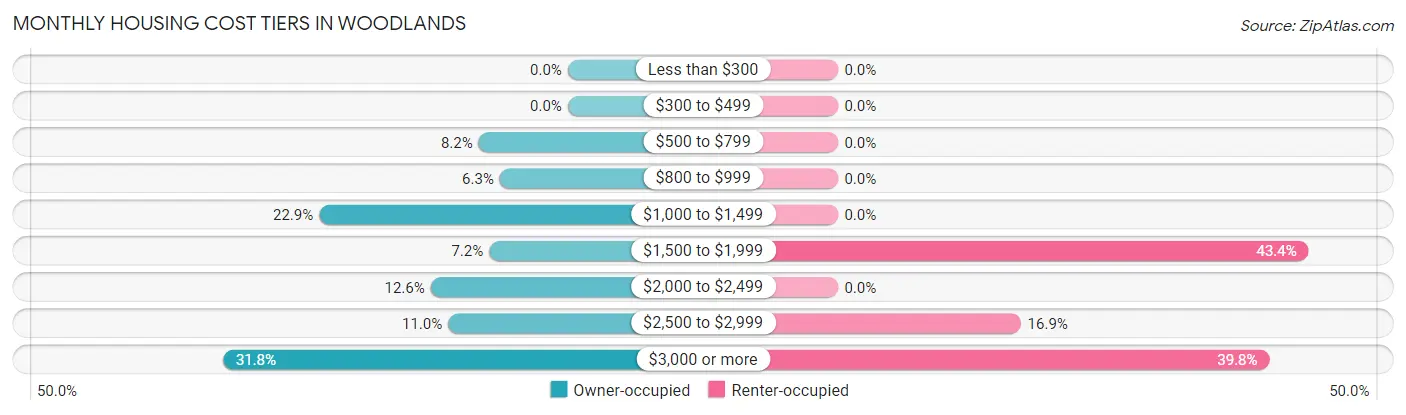
| Monthly Cost | Owner-occupied | Renter-occupied |
| Less than $300 | 0 (0.0%) | 0 (0.0%) |
| $300 to $499 | 0 (0.0%) | 0 (0.0%) |
| $500 to $799 | 76 (8.2%) | 0 (0.0%) |
| $800 to $999 | 58 (6.3%) | 0 (0.0%) |
| $1,000 to $1,499 | 212 (22.9%) | 0 (0.0%) |
| $1,500 to $1,999 | 67 (7.2%) | 36 (43.4%) |
| $2,000 to $2,499 | 117 (12.6%) | 0 (0.0%) |
| $2,500 to $2,999 | 102 (11.0%) | 14 (16.9%) |
| $3,000 or more | 294 (31.8%) | 33 (39.8%) |
| Total | 926 (100.0%) | 83 (100.0%) |
Physical Housing Characteristics in Woodlands
Housing Structures in Woodlands
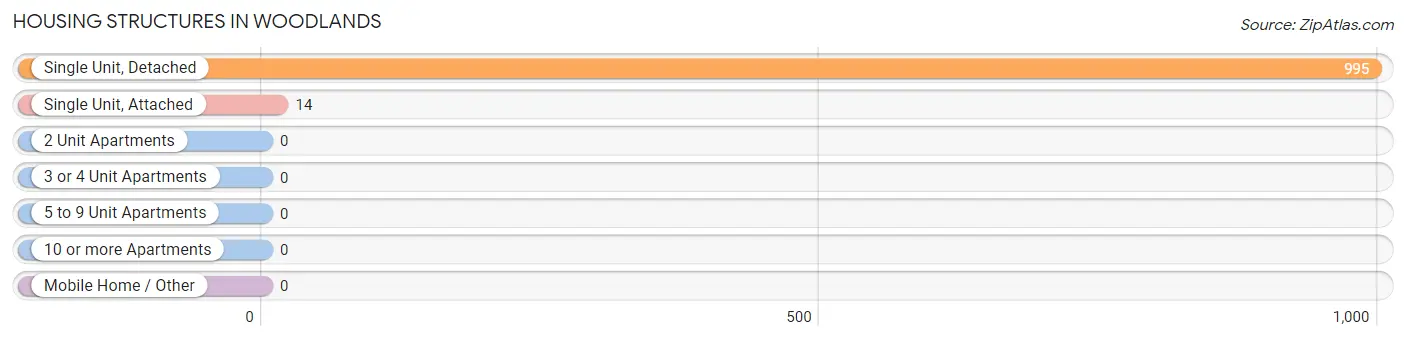
| Structure Type | # Housing Units | % Housing Units |
| Single Unit, Detached | 995 | 98.6% |
| Single Unit, Attached | 14 | 1.4% |
| 2 Unit Apartments | 0 | 0.0% |
| 3 or 4 Unit Apartments | 0 | 0.0% |
| 5 to 9 Unit Apartments | 0 | 0.0% |
| 10 or more Apartments | 0 | 0.0% |
| Mobile Home / Other | 0 | 0.0% |
| Total | 1,009 | 100.0% |
Housing Structures by Occupancy in Woodlands
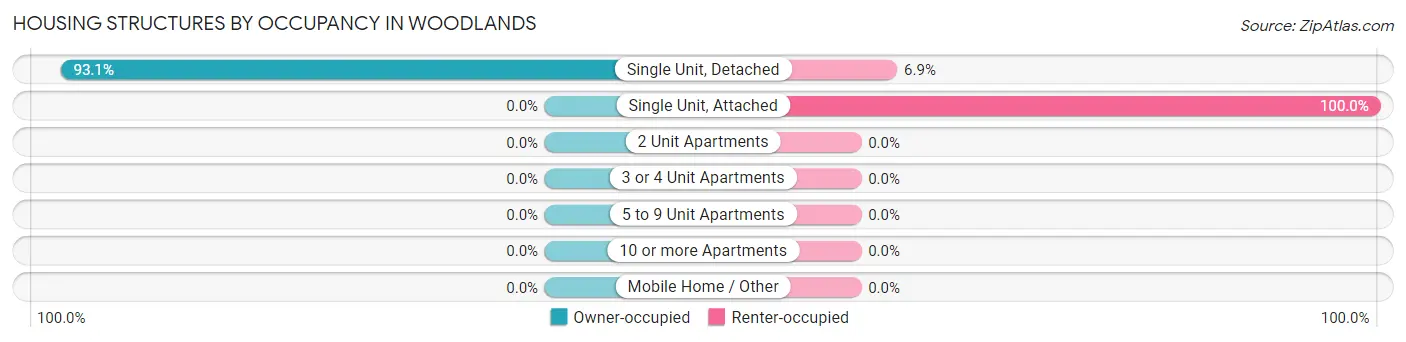
| Structure Type | Owner-occupied | Renter-occupied |
| Single Unit, Detached | 926 (93.1%) | 69 (6.9%) |
| Single Unit, Attached | 0 (0.0%) | 14 (100.0%) |
| 2 Unit Apartments | 0 (0.0%) | 0 (0.0%) |
| 3 or 4 Unit Apartments | 0 (0.0%) | 0 (0.0%) |
| 5 to 9 Unit Apartments | 0 (0.0%) | 0 (0.0%) |
| 10 or more Apartments | 0 (0.0%) | 0 (0.0%) |
| Mobile Home / Other | 0 (0.0%) | 0 (0.0%) |
| Total | 926 (91.8%) | 83 (8.2%) |
Housing Structures by Number of Rooms in Woodlands
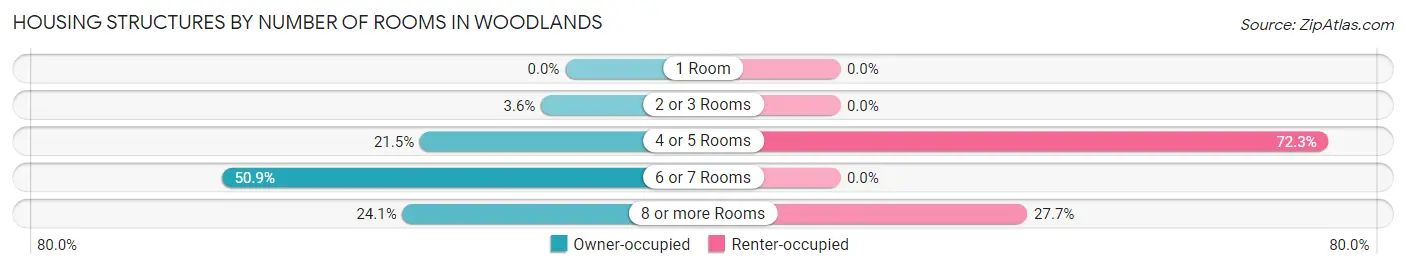
| Number of Rooms | Owner-occupied | Renter-occupied |
| 1 Room | 0 (0.0%) | 0 (0.0%) |
| 2 or 3 Rooms | 33 (3.6%) | 0 (0.0%) |
| 4 or 5 Rooms | 199 (21.5%) | 60 (72.3%) |
| 6 or 7 Rooms | 471 (50.9%) | 0 (0.0%) |
| 8 or more Rooms | 223 (24.1%) | 23 (27.7%) |
| Total | 926 (100.0%) | 83 (100.0%) |
Housing Structure by Heating Type in Woodlands
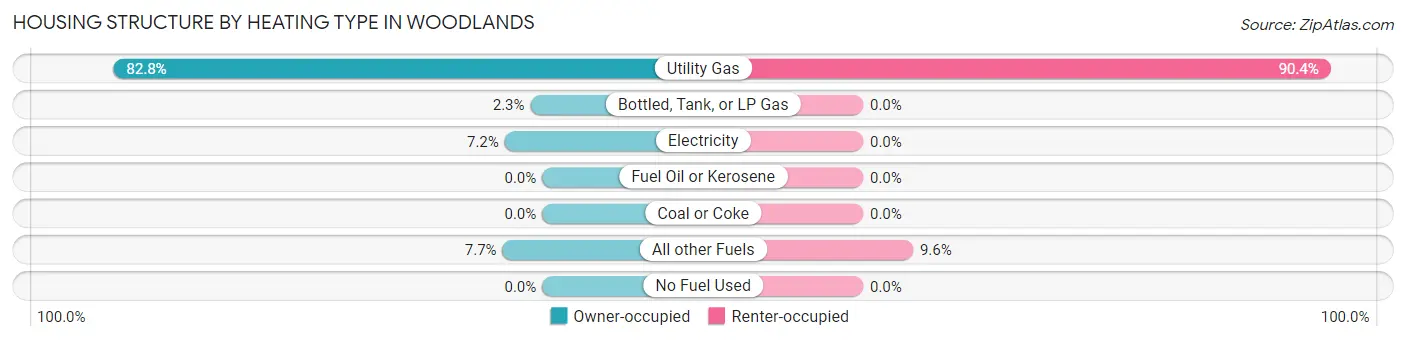
| Heating Type | Owner-occupied | Renter-occupied |
| Utility Gas | 767 (82.8%) | 75 (90.4%) |
| Bottled, Tank, or LP Gas | 21 (2.3%) | 0 (0.0%) |
| Electricity | 67 (7.2%) | 0 (0.0%) |
| Fuel Oil or Kerosene | 0 (0.0%) | 0 (0.0%) |
| Coal or Coke | 0 (0.0%) | 0 (0.0%) |
| All other Fuels | 71 (7.7%) | 8 (9.6%) |
| No Fuel Used | 0 (0.0%) | 0 (0.0%) |
| Total | 926 (100.0%) | 83 (100.0%) |
Household Vehicle Usage in Woodlands
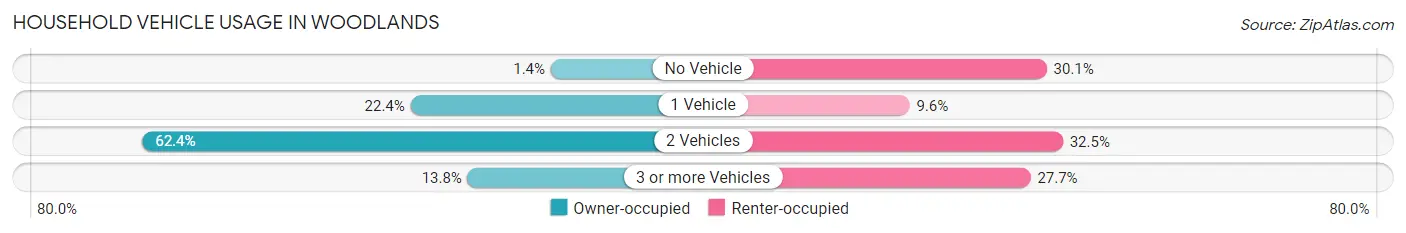
| Vehicles per Household | Owner-occupied | Renter-occupied |
| No Vehicle | 13 (1.4%) | 25 (30.1%) |
| 1 Vehicle | 207 (22.4%) | 8 (9.6%) |
| 2 Vehicles | 578 (62.4%) | 27 (32.5%) |
| 3 or more Vehicles | 128 (13.8%) | 23 (27.7%) |
| Total | 926 (100.0%) | 83 (100.0%) |
Real Estate & Mortgages in Woodlands
Real Estate and Mortgage Overview in Woodlands
| Characteristic | Without Mortgage | With Mortgage |
| Housing Units | 377 | 549 |
| Median Property Value | $984,300 | $1,082,400 |
| Median Household Income | $119,453 | $313 |
| Monthly Housing Costs | $1,110 | $294 |
| Real Estate Taxes | $10,001 | $0 |
Property Value by Mortgage Status in Woodlands
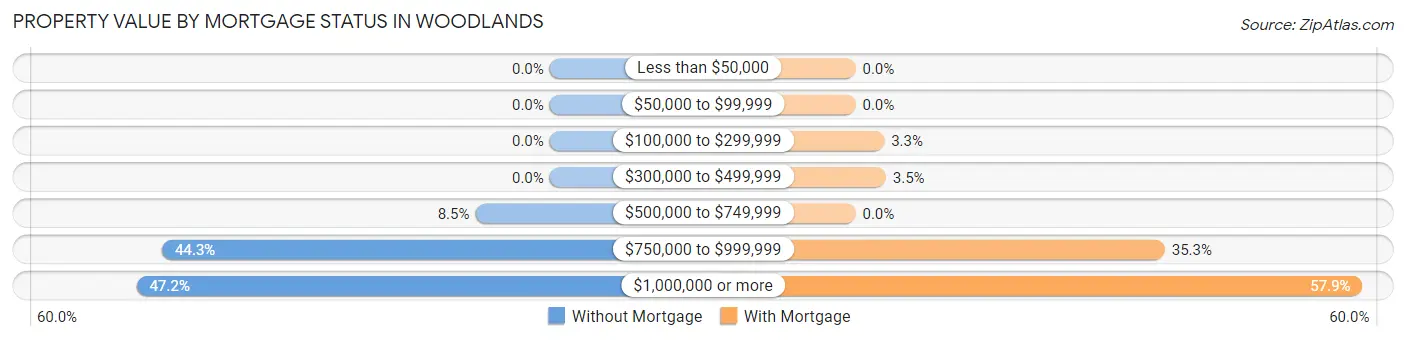
| Property Value | Without Mortgage | With Mortgage |
| Less than $50,000 | 0 (0.0%) | 0 (0.0%) |
| $50,000 to $99,999 | 0 (0.0%) | 0 (0.0%) |
| $100,000 to $299,999 | 0 (0.0%) | 18 (3.3%) |
| $300,000 to $499,999 | 0 (0.0%) | 19 (3.5%) |
| $500,000 to $749,999 | 32 (8.5%) | 0 (0.0%) |
| $750,000 to $999,999 | 167 (44.3%) | 194 (35.3%) |
| $1,000,000 or more | 178 (47.2%) | 318 (57.9%) |
| Total | 377 (100.0%) | 549 (100.0%) |
Household Income by Mortgage Status in Woodlands
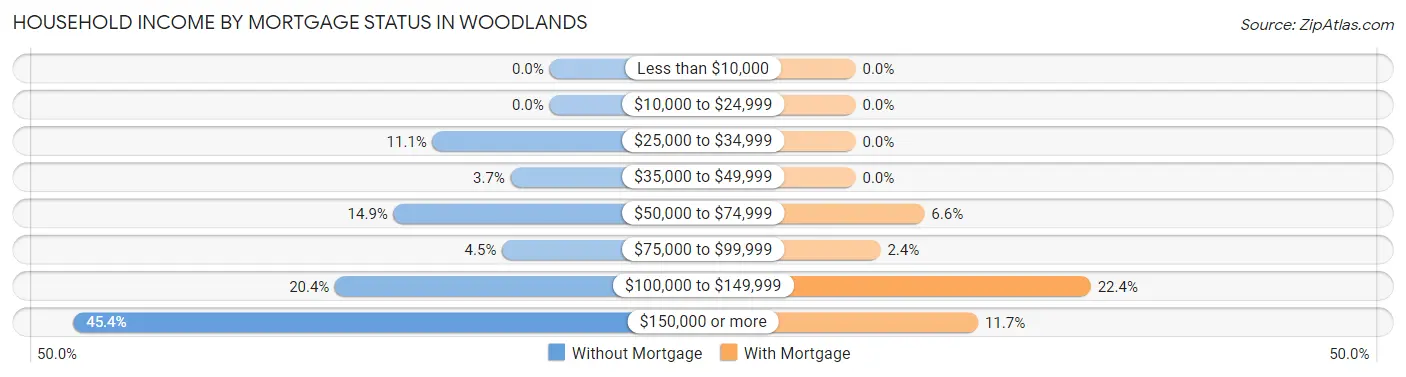
| Household Income | Without Mortgage | With Mortgage |
| Less than $10,000 | 0 (0.0%) | 0 (0.0%) |
| $10,000 to $24,999 | 0 (0.0%) | 0 (0.0%) |
| $25,000 to $34,999 | 42 (11.1%) | 0 (0.0%) |
| $35,000 to $49,999 | 14 (3.7%) | 0 (0.0%) |
| $50,000 to $74,999 | 56 (14.8%) | 36 (6.6%) |
| $75,000 to $99,999 | 17 (4.5%) | 13 (2.4%) |
| $100,000 to $149,999 | 77 (20.4%) | 123 (22.4%) |
| $150,000 or more | 171 (45.4%) | 64 (11.7%) |
| Total | 377 (100.0%) | 549 (100.0%) |
Property Value to Household Income Ratio in Woodlands
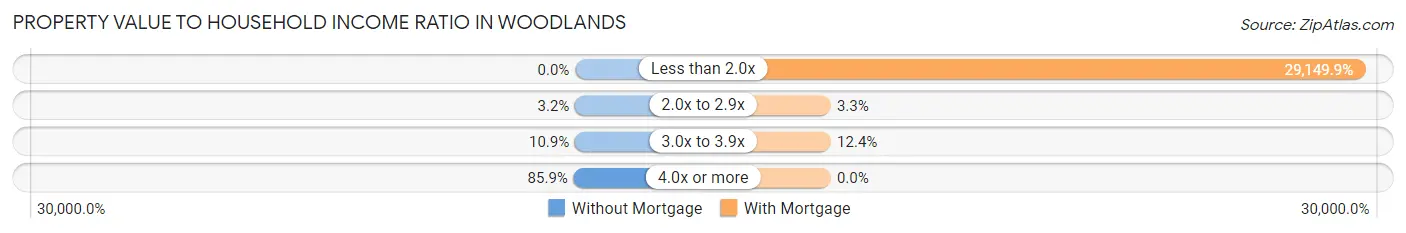
| Value-to-Income Ratio | Without Mortgage | With Mortgage |
| Less than 2.0x | 0 (0.0%) | 160,033 (29,149.9%) |
| 2.0x to 2.9x | 12 (3.2%) | 18 (3.3%) |
| 3.0x to 3.9x | 41 (10.9%) | 68 (12.4%) |
| 4.0x or more | 324 (85.9%) | 0 (0.0%) |
| Total | 377 (100.0%) | 549 (100.0%) |
Real Estate Taxes by Mortgage Status in Woodlands
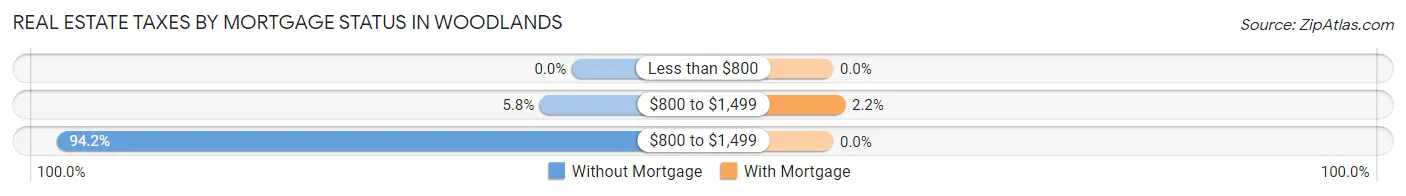
| Property Taxes | Without Mortgage | With Mortgage |
| Less than $800 | 0 (0.0%) | 0 (0.0%) |
| $800 to $1,499 | 22 (5.8%) | 12 (2.2%) |
| $800 to $1,499 | 355 (94.2%) | 0 (0.0%) |
| Total | 377 (100.0%) | 549 (100.0%) |
Health & Disability in Woodlands
Health Insurance Coverage by Age in Woodlands
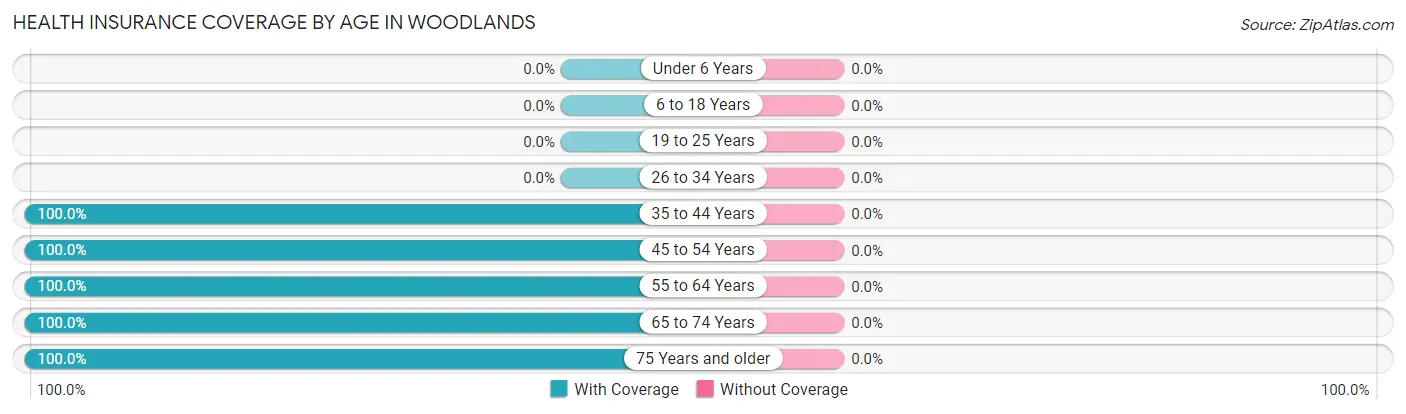
| Age Bracket | With Coverage | Without Coverage |
| Under 6 Years | 0 (0.0%) | 0 (0.0%) |
| 6 to 18 Years | 0 (0.0%) | 0 (0.0%) |
| 19 to 25 Years | 0 (0.0%) | 0 (0.0%) |
| 26 to 34 Years | 0 (0.0%) | 0 (0.0%) |
| 35 to 44 Years | 30 (100.0%) | 0 (0.0%) |
| 45 to 54 Years | 92 (100.0%) | 0 (0.0%) |
| 55 to 64 Years | 302 (100.0%) | 0 (0.0%) |
| 65 to 74 Years | 947 (100.0%) | 0 (0.0%) |
| 75 Years and older | 553 (100.0%) | 0 (0.0%) |
| Total | 1,924 (100.0%) | 0 (0.0%) |
Health Insurance Coverage by Citizenship Status in Woodlands
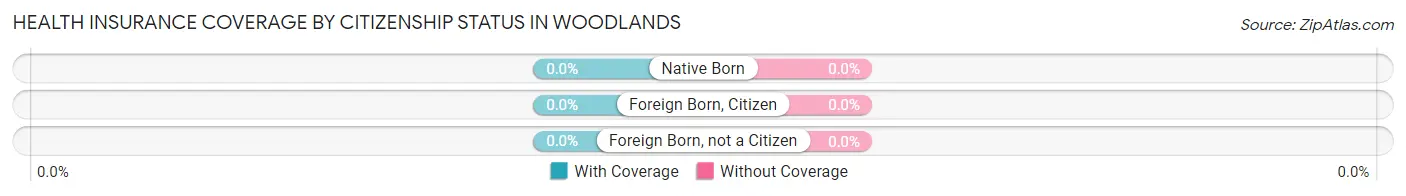
| Citizenship Status | With Coverage | Without Coverage |
| Native Born | 0 (0.0%) | 0 (0.0%) |
| Foreign Born, Citizen | 0 (0.0%) | 0 (0.0%) |
| Foreign Born, not a Citizen | 0 (0.0%) | 0 (0.0%) |
Health Insurance Coverage by Household Income in Woodlands
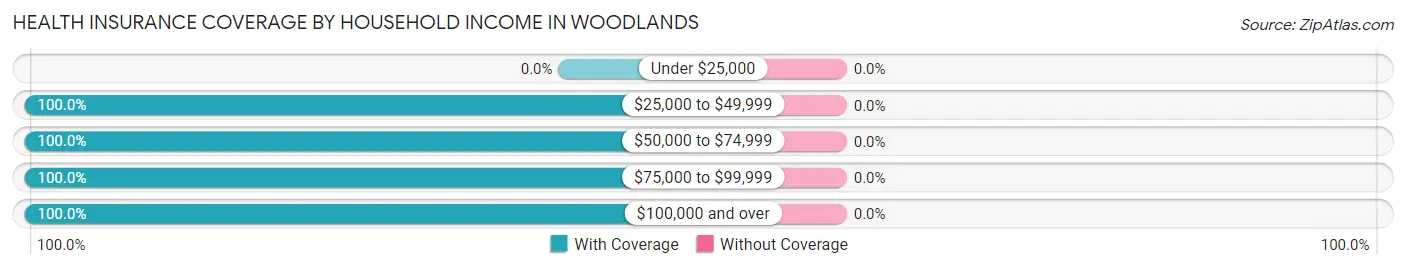
| Household Income | With Coverage | Without Coverage |
| Under $25,000 | 0 (0.0%) | 0 (0.0%) |
| $25,000 to $49,999 | 155 (100.0%) | 0 (0.0%) |
| $50,000 to $74,999 | 138 (100.0%) | 0 (0.0%) |
| $75,000 to $99,999 | 266 (100.0%) | 0 (0.0%) |
| $100,000 and over | 1,365 (100.0%) | 0 (0.0%) |
Public vs Private Health Insurance Coverage by Age in Woodlands
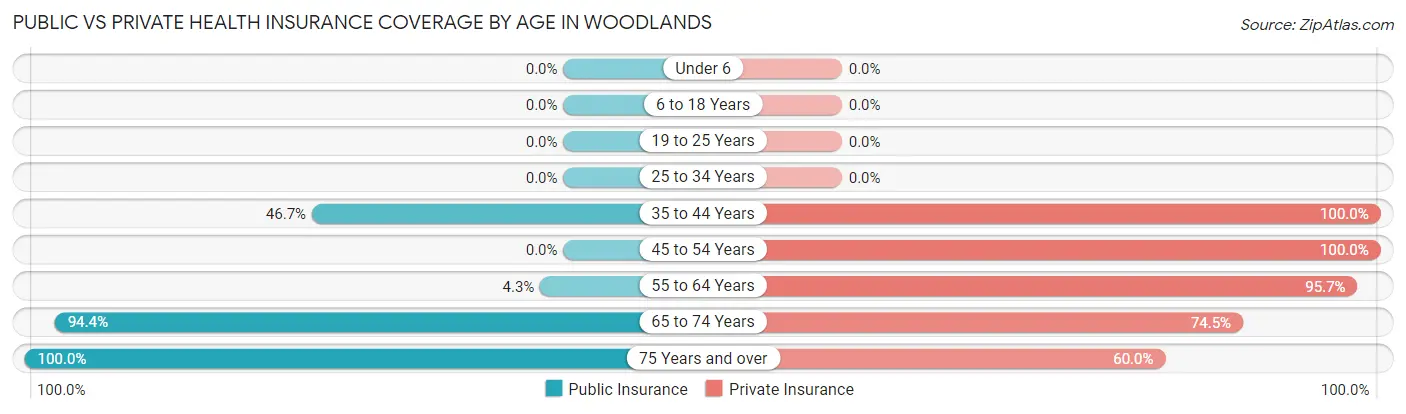
| Age Bracket | Public Insurance | Private Insurance |
| Under 6 | 0 (0.0%) | 0 (0.0%) |
| 6 to 18 Years | 0 (0.0%) | 0 (0.0%) |
| 19 to 25 Years | 0 (0.0%) | 0 (0.0%) |
| 25 to 34 Years | 0 (0.0%) | 0 (0.0%) |
| 35 to 44 Years | 14 (46.7%) | 30 (100.0%) |
| 45 to 54 Years | 0 (0.0%) | 92 (100.0%) |
| 55 to 64 Years | 13 (4.3%) | 289 (95.7%) |
| 65 to 74 Years | 894 (94.4%) | 705 (74.5%) |
| 75 Years and over | 553 (100.0%) | 332 (60.0%) |
| Total | 1,474 (76.6%) | 1,448 (75.3%) |
Disability Status by Sex by Age in Woodlands
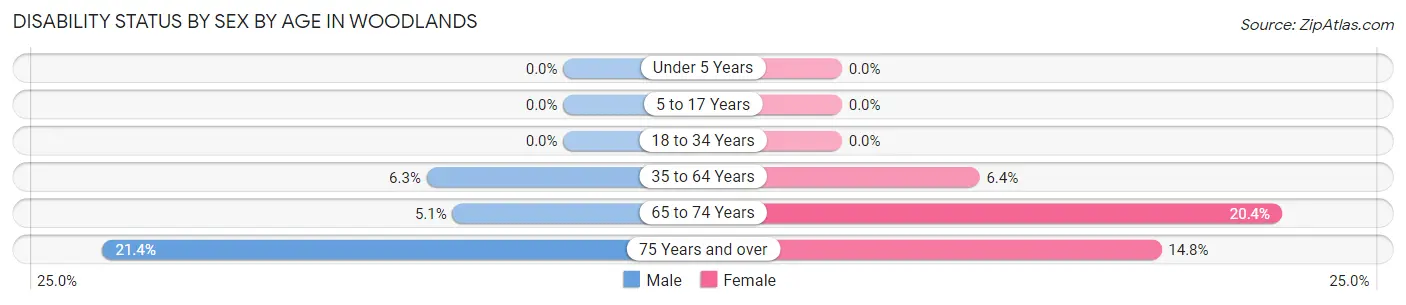
| Age Bracket | Male | Female |
| Under 5 Years | 0 (0.0%) | 0 (0.0%) |
| 5 to 17 Years | 0 (0.0%) | 0 (0.0%) |
| 18 to 34 Years | 0 (0.0%) | 0 (0.0%) |
| 35 to 64 Years | 13 (6.3%) | 14 (6.4%) |
| 65 to 74 Years | 22 (5.1%) | 106 (20.4%) |
| 75 Years and over | 62 (21.4%) | 39 (14.8%) |
Disability Class by Sex by Age in Woodlands
Disability Class: Hearing Difficulty
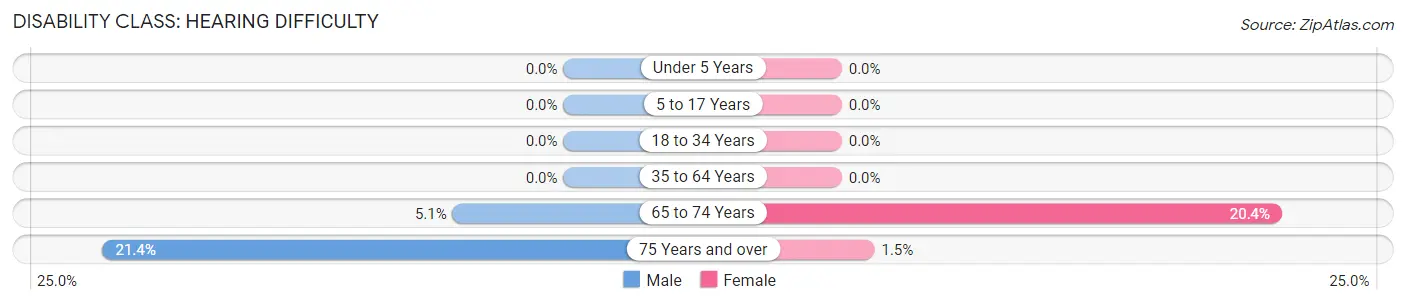
| Age Bracket | Male | Female |
| Under 5 Years | 0 (0.0%) | 0 (0.0%) |
| 5 to 17 Years | 0 (0.0%) | 0 (0.0%) |
| 18 to 34 Years | 0 (0.0%) | 0 (0.0%) |
| 35 to 64 Years | 0 (0.0%) | 0 (0.0%) |
| 65 to 74 Years | 22 (5.1%) | 106 (20.4%) |
| 75 Years and over | 62 (21.4%) | 4 (1.5%) |
Disability Class: Vision Difficulty
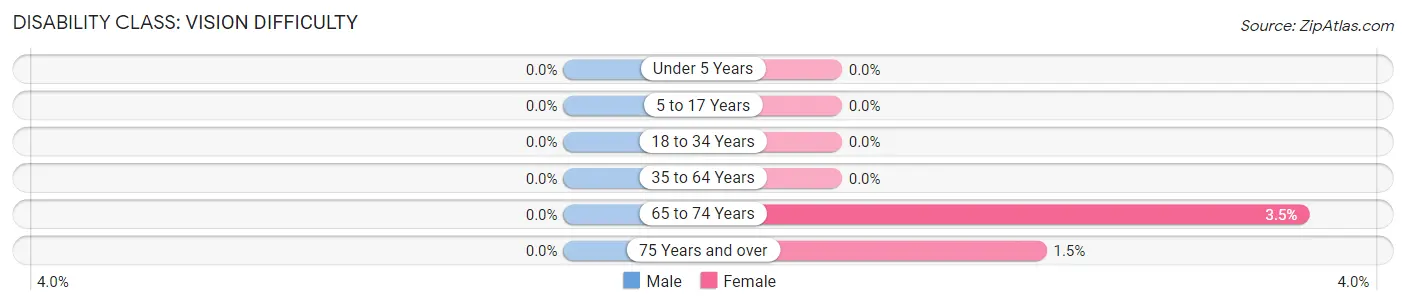
| Age Bracket | Male | Female |
| Under 5 Years | 0 (0.0%) | 0 (0.0%) |
| 5 to 17 Years | 0 (0.0%) | 0 (0.0%) |
| 18 to 34 Years | 0 (0.0%) | 0 (0.0%) |
| 35 to 64 Years | 0 (0.0%) | 0 (0.0%) |
| 65 to 74 Years | 0 (0.0%) | 18 (3.5%) |
| 75 Years and over | 0 (0.0%) | 4 (1.5%) |
Disability Class: Cognitive Difficulty
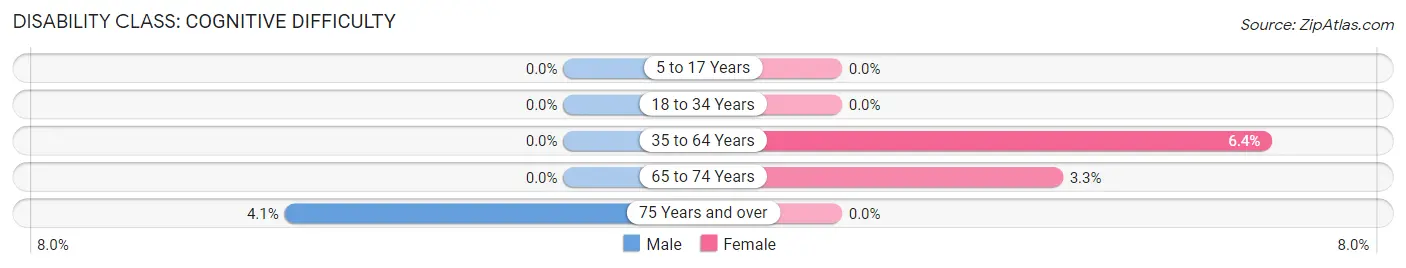
| Age Bracket | Male | Female |
| 5 to 17 Years | 0 (0.0%) | 0 (0.0%) |
| 18 to 34 Years | 0 (0.0%) | 0 (0.0%) |
| 35 to 64 Years | 0 (0.0%) | 14 (6.4%) |
| 65 to 74 Years | 0 (0.0%) | 17 (3.3%) |
| 75 Years and over | 12 (4.1%) | 0 (0.0%) |
Disability Class: Ambulatory Difficulty
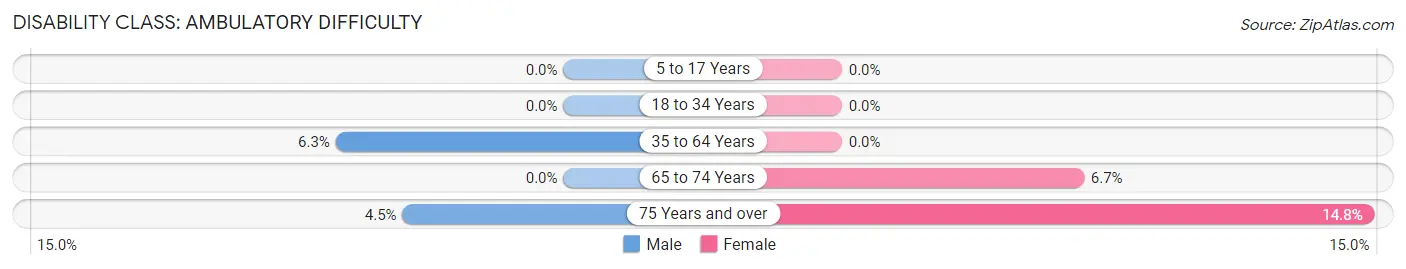
| Age Bracket | Male | Female |
| 5 to 17 Years | 0 (0.0%) | 0 (0.0%) |
| 18 to 34 Years | 0 (0.0%) | 0 (0.0%) |
| 35 to 64 Years | 13 (6.3%) | 0 (0.0%) |
| 65 to 74 Years | 0 (0.0%) | 35 (6.7%) |
| 75 Years and over | 13 (4.5%) | 39 (14.8%) |
Disability Class: Self-Care Difficulty
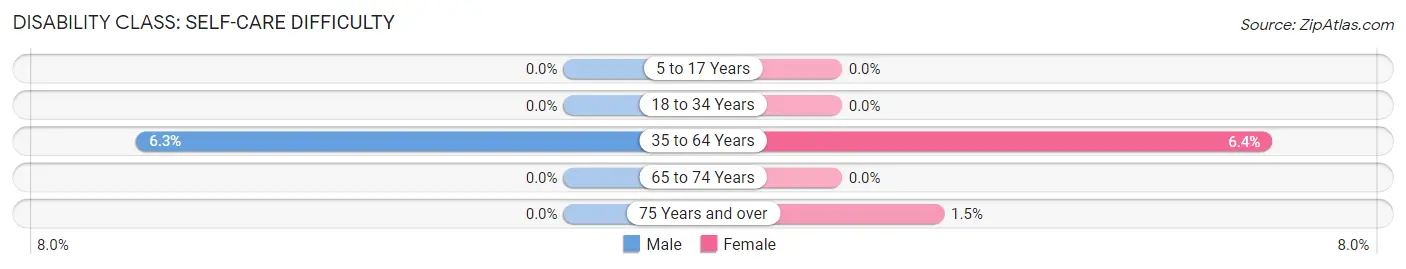
| Age Bracket | Male | Female |
| 5 to 17 Years | 0 (0.0%) | 0 (0.0%) |
| 18 to 34 Years | 0 (0.0%) | 0 (0.0%) |
| 35 to 64 Years | 13 (6.3%) | 14 (6.4%) |
| 65 to 74 Years | 0 (0.0%) | 0 (0.0%) |
| 75 Years and over | 0 (0.0%) | 4 (1.5%) |
Technology Access in Woodlands
Computing Device Access in Woodlands
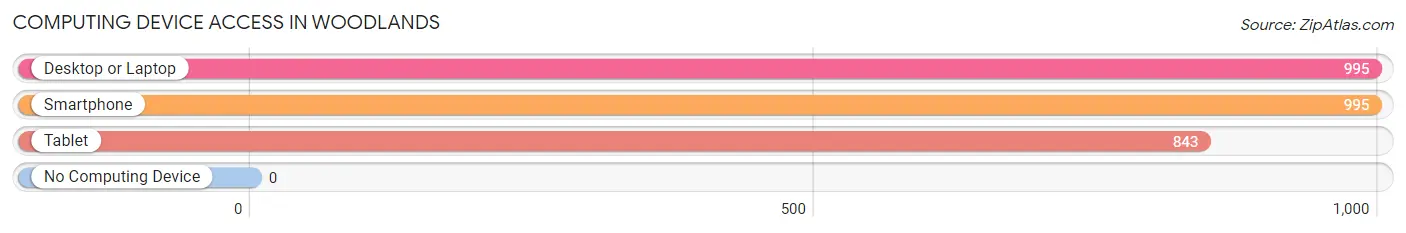
| Device Type | # Households | % Households |
| Desktop or Laptop | 995 | 98.6% |
| Smartphone | 995 | 98.6% |
| Tablet | 843 | 83.6% |
| No Computing Device | 0 | 0.0% |
| Total | 1,009 | 100.0% |
Internet Access in Woodlands
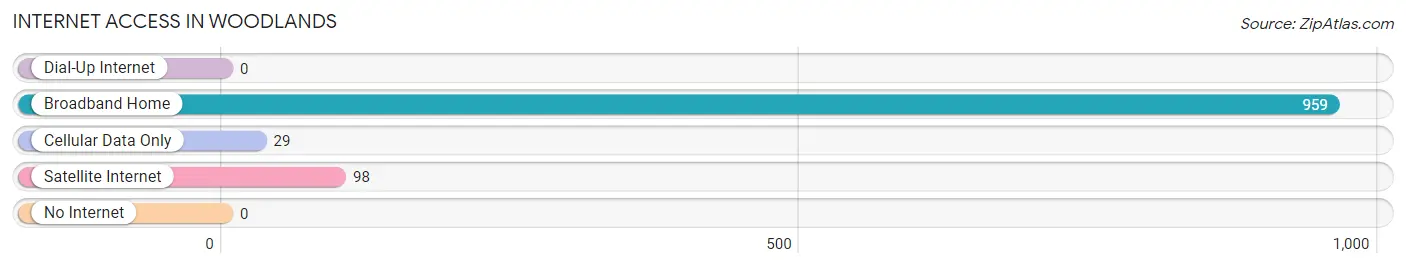
| Internet Type | # Households | % Households |
| Dial-Up Internet | 0 | 0.0% |
| Broadband Home | 959 | 95.0% |
| Cellular Data Only | 29 | 2.9% |
| Satellite Internet | 98 | 9.7% |
| No Internet | 0 | 0.0% |
| Total | 1,009 | 100.0% |
Woodlands Summary
Woodlands is a small town located in the northern part of California, in the United States. It is situated in the Sierra Nevada Mountains, and is surrounded by the Plumas National Forest. The town has a population of approximately 1,000 people, and is known for its rural charm and natural beauty.
History
Woodlands was founded in 1852 by a group of settlers from the East Coast. The settlers were looking for a place to settle and start a new life, and they found the perfect spot in the Sierra Nevada Mountains. The town was originally called “Woodland”, but the name was changed to “Woodlands” in 1854.
The town quickly grew and prospered, and by the late 1800s, it had become a popular destination for tourists and outdoor enthusiasts. The town was known for its beautiful scenery, and it was a popular spot for fishing, hunting, and camping.
In the early 1900s, the town began to decline as the timber industry moved away from the area. The town was also affected by the Great Depression, and many of the businesses in the area closed. However, the town was able to survive, and it continued to be a popular destination for tourists and outdoor enthusiasts.
Geography
Woodlands is located in the northern part of California, in the Sierra Nevada Mountains. The town is situated at an elevation of 4,000 feet, and is surrounded by the Plumas National Forest. The town is located near the Feather River, which is a popular spot for fishing and rafting.
The town is located in a temperate climate, and the average temperature in the summer is around 70 degrees Fahrenheit. The winters are cold, with temperatures dropping to around 30 degrees Fahrenheit. The town receives an average of 20 inches of precipitation each year.
Economy
The economy of Woodlands is largely based on tourism and outdoor recreation. The town is a popular destination for fishing, hunting, camping, and other outdoor activities. The town also has a few small businesses, such as restaurants, stores, and a gas station.
The town is also home to a few small farms, which produce a variety of fruits and vegetables. The town also has a few small wineries, which produce a variety of wines.
Demographics
The population of Woodlands is approximately 1,000 people. The town is predominantly white, with a small Hispanic population. The median household income is around $50,000, and the median home value is around $200,000. The town has a low crime rate, and the unemployment rate is around 4%.
Common Questions
What is Per Capita Income in Woodlands?
Per Capita income in Woodlands is $84,908.
What is the Median Family Income in Woodlands?
Median Family Income in Woodlands is $154,233.
What is the Median Household income in Woodlands?
Median Household Income in Woodlands is $151,736.
What is Income or Wage Gap in Woodlands?
Income or Wage Gap in Woodlands is 59.4%.
Women in Woodlands earn 40.6 cents for every dollar earned by a man.
What is Inequality or Gini Index in Woodlands?
Inequality or Gini Index in Woodlands is 0.33.
What is the Total Population of Woodlands?
Total Population of Woodlands is 1,924.
What is the Total Male Population of Woodlands?
Total Male Population of Woodlands is 923.
What is the Total Female Population of Woodlands?
Total Female Population of Woodlands is 1,001.
What is the Ratio of Males per 100 Females in Woodlands?
There are 92.21 Males per 100 Females in Woodlands.
What is the Ratio of Females per 100 Males in Woodlands?
There are 108.45 Females per 100 Males in Woodlands.
What is the Median Population Age in Woodlands?
Median Population Age in Woodlands is 69.1 Years.
What is the Average Family Size in Woodlands
Average Family Size in Woodlands is 2.0 People.
What is the Average Household Size in Woodlands
Average Household Size in Woodlands is 1.9 People.
How Large is the Labor Force in Woodlands?
There are 550 People in the Labor Forcein in Woodlands.
What is the Percentage of People in the Labor Force in Woodlands?
28.6% of People are in the Labor Force in Woodlands.